cafos uncovered
TRANSCRIPT
CAFOs Uncovered 1
CAFOsUncoveredThe Untold Costs of Confined Animal Feeding Operations
Union of Concerned ScientistsCitizens and Scientists for Environmental Solutions
CAFOs UncoveredThe Untold Costs of Confined
Animal Feeding Operations
Doug Gurian-Sherman
U N I O N O F C O N C E R N E D S C I E N T I S T S
A P R I L 2 0 0 8

© 2008 Union of Concerned Scientists
All rights reserved
Doug Gurian-Sherman is a senior scientist in theUnion of Concerned Scientists (UCS) Food andEnvironment Program.
e Union of Concerned Scientists is the leadingscience-based nonprofit working for a healthyenvironment and a safer world.
e goal of the UCS Food and EnvironmentProgram is a food system that encouragesinnovative and environmentally sustainable waysto produce high-quality, safe, and affordable food,while ensuring that citizens have a voice in howtheir food is grown.
More information about the Union of ConcernedScientists and the Food and Environment Programis available on the UCS website at www.ucsusa.org.
e full text of this report is available online(in PDF format) at www.ucsusa.org or may beobtained from:
UCS PublicationsTwo Brattle SquareCambridge, MA 02238-9105
Or, email [email protected] or call (617) 547-5552.
COVER PHOTOS:David Michalak, www.huntingtoncreative.com(steak), Farmsanctuary.org (pigs),istockphoto (money), Farmsanctuary.org (chickens) ,Rick Dove, www.doveimaging.com andwww.neuseriver.com (fish)
DESIGN: Penny Michalak (designmz.com)
Printed on recycled paper using soy-based inks
ii Union of Concerned Scientists
CAFOs Uncovered iii
CON T EN T S
Figures and Tables iv
Acknowledgments v
Executive Summary 1CAFOs: Too Big for Our Own Good 2Better Options Exist 2e Many Hidden Costs of CAFOs 3Conclusions and Recommendations 5
Introduction 9e Rise of the CAFO 9Considering the Alternatives 10
Chapter 1. Production Costs of CAFOs and Alternative Systems 13Problems Associated with CAFOs 13CAFOs Are Getting Bigger 14Bigger Does Not Mean More Efficient 16Factors Contributing to CAFO Growth 17Are CAFO Alternatives Cost-effective? 23Looking Beyond Narrowly Defined Costs 25Conclusions 26
Chapter 2. Direct and Indirect Subsidies to CAFOs 29How Crop Subsidies Have Propped Up CAFOs 29Indirect Subsidies to Poultry CAFOs 31Indirect Subsidies to Hog CAFOs 31Indirect Subsidies to Beef and Dairy CAFOs 32Indirect Subsidies across Sectors 33Subsidies for Alternative Production Methods 33e Effect of Changing Grain Prices 35Summary of Indirect Subsidies to CAFOs 37Direct Subsidies to CAFOs 37Summary of Direct CAFO Subsidies under EQIP 40
Chapter 3. Externalized Costs of CAFOs 41Pollution Caused by CAFO Manure 42Box: Regulation of CAFO Manure 53e Costs of Manure Disposal 56Other Externalized Costs 59Summary of CAFO Externalities 65
Chapter 4. Conclusions and Recommendations 67Can Technology Fix CAFOs? 67Wanted: Sound Agricultural Policy 68
References 71
Glossary 83

iv Union of Concerned Scientists
Figures
1. U.S. Hog Inventory on the Largest Farms 142. Number of U.S. Hog Operations and Hog Inventory 153. Federal EQIP Funding for 2006 434. Counties Eligible for EQIP Subsidies in Georgia’s Poultry Litter Transfer Program, 2006 445. Average Atmospheric Ammonium Ion Concentration, 1985–2002 456. Wet Deposition of Ammonium Nitrogen, 2002 457. Wet Deposition of Ammonia and Nitrate Nitrogen, 2002 468. Geographic Concentration of Hog Production, 1997–2002 469. Geographic Concentration of Dairy Cows, 1997–2002 47
10. Geographic Concentration of Broiler Production, 1997–2002 4711. CAFO Manure Lagoon 4812. Environmental Danger of CAFOs 4813. CAFO Manure Pile 4814. CAFO Manure Lagoon 4815. Unsanitary Conditions in Cattle CAFO 4916. Alternative Cattle Production 4917. Crowding in Chicken CAFO 4918. Alternative Poultry Production 4919. Crowding in Hog CAFO 5020. Hog Hoop Barn 5021. Alternative Pork Production 50
Tables
ES-1. CAFO Costs Underwritten by U.S. Taxpayers 61. Number of Livestock Operations by Size, 1982–1997 162. Number of Animals by Operation Size, 1982–1997 163. Percent of Livestock Production under Contract by Sector 214. Percent of Animals Slaughtered in Large Plants 225. Indirect Subsidies to the CAFO Industry, 1997–2005 346. Comparison of Subsidies for CAFOs and Diversified Farms 35
F I G U R E S AND TA B L E S
is report was made possible through the financialsupport of e Cedar Tree Foundation, e DeerCreek Foundation, e Educational Foundation ofAmerica, e David B. Gold Foundation, Newman’sOwn Foundation, and UCS members.
e report was greatly informed by Dr. Silvia Secchiof Southern Illinois University, who provided in-sights on economic matters concerning the livestockindustry and also reviewed parts of the text. Wewere similarly fortunate to receive research contri-butions and perspectives from Elanor Starmer of theGlobal Development and Environment Institute(GDAE) at Tus University. We also thank Dr. KateClancy for her helpful thoughts and suggestions.
We are grateful for the reviews provided byDr. Mark Honeyman of Iowa State University,Dr. Michael Mallin of the University of North Car-olina, Dr. William Weida of Colorado College andthe Global Resource Action Center for the Environ-
ment (GRACE), and Timothy A. Wise of the GDAEat Tus University. Each offered invaluable com-ments that greatly improved the report, but we mustnote that their willingness to review the materialdoes not necessarily imply an endorsement of thereport or its conclusions and recommendations.
Here at the Union of Concerned Scientists, a greatdeal of appreciation is due to Margaret Mellon,without whose patience, counsel, and many contri-butions this report would not have been possible.anks are also due to Stanback interns ElizabethWillets and Pei Yen for research contributions, JaneRissler and Heather Sisan for logistical and otherhelp, and Julie MacCartee for research assistance.
We would also like to thank Bryan Wadsworth forcopyediting, Heather Tuttle for coordinating printproduction, and Penny Michalak for designand layout.
CAFOs Uncovered v
ACKNOWLEDGMENT S


he livestock industry (including poultry) is vitalto our national economy, supplying meat, milk,
eggs, and other animal products and providingmeaningful employment in rural communities. Untilrecently, food animal production was integrated withcrop production in a balanced way that was gener-ally beneficial to farmers and society as a whole. Butlivestock production has undergone a transforma-tion in which a small number of very large CAFOs(confined animal feeding operations) predominate.ese CAFOs have imposed significant—but largelyunaccounted for—costs on taxpayers and communi-ties throughout the United States.
CAFOs are characterized by large numbers ofanimals crowded into a confined space—an unnatu-ral and unhealthy condition that concentrates toomuch manure in too small an area. Many of thecostly problems caused by CAFOs can be attributedto the storage and disposal of this manure and theoveruse of antibiotics in livestock to stave off disease.
e predominance of CAFOs is not the in-evitable result of market forces; it has been fosteredby misguided public policy. Alternative productionmethods can be economically efficient and techno-logically sophisticated, and can deliver abundant an-imal products while avoiding most of the problemscaused by CAFOs. However, these alternatives are ata competitive disadvantage because CAFOs have re-duced their costs through subsidies that come at thepublic’s expense, including (until very recently) low-cost feed. CAFOs have also benefited from taxpayer-supported pollution cleanup programs andtechnological “fixes” that may be counterproductive,such as the overuse of antibiotics. And by shiingthe risks of their production methods onto the pub-lic, CAFOs avoid the costs of the harm they cause.
In addition, the fact that the meat processing in-dustry is dominated by a few large and economicallypowerful companies makes it difficult for alternativeproducers to slaughter their animals and get theirproducts to market. is excessive market concen-tration is facilitated by lax enforcement of laws in-tended to prevent anti-competitive practices.
By describing several of the subsidies and otheroen hidden costs of CAFOs that are imposed onsociety (referred to as externalized costs or “exter-nalities”), this report attempts to clarify the realprice we pay—and can no longer afford—for thisharmful system. ese externalities are associatedwith the damage caused by water and air pollution(along with cleanup and prevention), the costsborne by rural communities (e.g., lower propertyvalues), and the costs associated with excessive an-tibiotic use (e.g., harder-to-treat human diseases).Subsidies have included payments to grain farmersthat historically supported unrealistically low ani-mal feed prices, and payments to CAFOs to preventwater pollution.
e United States can do better. In fact, there isa new and growing movement among U.S. farmersto produce food efficiently by working with naturerather than against it. More and more meat anddairy farmers are successfully shiing away frommassive, overcrowded CAFOs in favor of modernproduction practices. We offer a number of policyrecommendations that would level the playing fieldfor these smart, sophisticated alternatives by reduc-ing CAFO subsidies and requiring CAFOs to pay afair share of their costs.
CAFOs Uncovered 1
EXECUTIVE SUMMARY
T

CAFOs—Too Big for Our Own Good
Most of the problems caused by CAFOs result fromtheir excessive size and crowded conditions. CAFOscontain at least 1,000 large animals such as beefcows, or tens of thousands of smaller animals suchas chickens, and many are much larger—with tensof thousands of beef cows or hogs, and hundreds ofthousands of chickens.
e problems that arise from excessive size anddensity (e.g., air and water pollution from manure,overuse of antibiotics) are exacerbated by the paral-lel trend of geographic concentration, wherebyCAFOs for particular types of livestock have be-come concentrated in certain parts of the country.For example, large numbers of swine CAFOs arenow located in Iowa and North Carolina, dairyCAFOs in California, and broiler chicken CAFOs inArkansas and Georgia.
We need to be concerned about these exces-sively large feeding operations because they have be-come the predominant means of producing meatand dairy products in this country over the past fewdecades. Although they comprise only about 5 per-cent of all U.S. animal operations, CAFOs now pro-duce more than 50 percent of our food animals.ey also produce about 65 percent of the manurefrom U.S. animal operations, or about 300 milliontons per year—more than double the amount gener-ated by this country’s entire human population. Forthe purposes of this report, there are approximately9,900 U.S. CAFOs producing hogs, dairy cows, beefcows, broiler chickens, or laying hens.
Better Options Exist
CAFOs do not represent the only way of ensuringthe availability of food at reasonable prices. Recentstudies by the U.S. Department of Agriculture(USDA) show that almost 40 percent of medium-sized animal feeding operations are about as cost-effective as the average large hog CAFO, and manyother studies have provided similar results.Medium-sized and smaller operations also avoid or
reduce many of the external costs that stemfrom CAFOs.
If CAFOs are not appreciably more efficientthan small and mid-sized operations, why are theysupplanting smaller farms? e answers lie largelyin farm policies that have favored large operations.CAFOs have relied on cheap inputs (water, energy,and especially feed) to support the high animal den-sities that offset these operations’ high fixed costs(such as buildings). Feed accounts for about 60 per-cent of the costs of producing hogs and chickensand is also an important cost for dairy and beefcows, and federal policies have encouraged the pro-duction of inexpensive grain that benefits CAFOs.
Perhaps even more important has been the con-centration of market power in the processing indus-try upon which animal farmers depend. isconcentration allows meat processors to exert con-siderable economic control over livestock produc-ers, oen in the form of production contracts andanimal ownership. e resulting “captive supply”can limit market access for independent smallerproducers, since the large majority of livestock areeither owned by processors or acquired under con-tract—and processors typically do not contract withsmaller producers. Federal government watchdogshave stated that the agency responsible for ensuringthat markets function properly for smaller produc-ers is not up to the task.
Hoop barns and smart pasture operationsAlthough there is evidence that confinement opera-tions smaller than CAFOs can be cost-effective andproduce ample animal products, studies also suggestthat sophisticated alternative means of producinganimal products hold even greater promise. For ex-ample, hog hoop barns, which are healthier for theanimals and much smaller than CAFOs, can pro-duce comparable or even higher profits per unit atclose to the same price.
Research in Iowa (the major hog-producingstate) has also found that raising hogs on pasturemay produce animals at a lower cost than CAFOs.Other studies have shown that “smart” pasture oper-
2 Union of Concerned Scientists

ations such as managed intensive rotational grazing(MIRG) can produce milk at a cost similar to con-fined dairy operations, but with added environmen-tal benefits.
Properly managed pastures, for example, requireless maintenance and energy than the feed crops(such as corn and soybeans) on which CAFOs rely.Healthy pastures are also less susceptible to erosion,can capture more heat-trapping carbon dioxide thanfeed crops, and absorb more of the nutrients appliedto them, thereby contributing less to water pollu-tion. Furthermore, the manure deposited by animalsonto pasture produces about six to nine times lessvolatilized ammonia—an important air pollutant—than surface-applied manure from CAFOs.
The Many Hidden Costs of CAFOs
Feed grain subsidiesCAFOs have been indirectly supported by huge tax-payer-funded subsidies that compensated grainfarmers for excessively low prices. Because feedmakes up such a large part of CAFOs’ costs, lowergrain prices can have a big impact on the total costof production.
Over the past few decades, federal farm billshave progressively moved toward policies that letgrain prices fall—oen below the cost of produc-tion—and compensated farmers for much of thedifference. Without such subsidies, grain farmerswould not have been able to continue selling theirproduct at such low prices, which benefit CAFOs.
is so-called indirect subsidy to hog andbroiler CAFOs amounts to hundreds of millions ofdollars per year. When extended to include thedairy, beef, and egg sectors, low-cost grain wasworth a total of almost $35 billion to CAFOs from1996 to 2005, or almost $4 billion per year.
Farms that raise animals on pasture and thosethat grow their own grain do not usually receive asmuch of a subsidy as the CAFO industry. Pasturesthemselves are not subsidized at all, so the suste-nance that livestock derive from pastures receivesno government support.
During the past few years, grain prices have ap-proached or even risen above the cost of produc-tion. Under these conditions, CAFOs no longerbenefit from grain subsidies, but the problem of in-creasing concentration in the processing industrypersists. is may make it difficult for CAFO alter-natives to gain substantial market share withoutchanges in U.S. policy.
Pollution prevention subsidiesAnother farm bill program, the EnvironmentalQuality Incentives Program (EQIP), providesCAFOs with another important subsidy. Beginningin 2002, CAFOs were no longer explicitly excludedfrom EQIP funding (which was originally intendedto help smaller farming operations reduce their pol-lution), and the maximum funding level for individ-ual projects has increased dramatically to $450,000.Several criteria used to prioritize projects such asmanure disposal actually favor CAFOs over pasture-based operations. Extrapolation from the availabledata suggests that U.S. CAFOs may have benefitedfrom about $125 million in EQIP subsidies in 2007.
State-level EQIP projects can also favor confine-ment operations. California, the state with the mostdairy CAFOs, spends $10 million of its allocatedEQIP subsidies each year to address dairy manureissues. Georgia, the state with the most broilerchicken CAFOs, uses EQIP funds to support thetransportation of chicken manure from that part ofthe state where broiler CAFOs are primarily locatedto areas with enough cropland to accept this ma-nure. e distance involved would oen not be eco-nomically feasible without subsidization.
Water pollution from manureDisposal of CAFO manure on an insufficientamount of land results in the runoff and leaching ofwaste into surface and groundwater, which has con-taminated drinking water in many rural areas, andthe volatilization of ammonia (i.e., the transfer ofthis substance from manure into the atmosphere).Several manure lagoons have also experienced cata-strophic failures, sending tens of millions of gallons
CAFOs Uncovered 3

of raw manure into streams and estuaries and killingmillions of fish. Smaller but more numerous spillscause substantial losses as well.
Remediation of the leaching under dairy andhog CAFOs in Kansas has been projected to costtaxpayers $56 million—and Kansas is not one of thecountry’s top dairy- or hog-producing states. Basedon these data, a rough estimate of the total cost ofcleaning up the soil under U.S. hog and dairyCAFOs could approach $4.1 billion.
The two primary pollutants from manure, ni-trogen and phosphorus, can cause eutrophication(the proliferation and subsequent death of aquaticplant life that robs freshwater and marine environ-ments of the oxygen that fish and many otheraquatic organisms need to survive). For example,runoff and leaching from animal sources includingCAFOs is believed to contribute about 15 percentof the nutrient pollution that reaches the Gulf ofMexico, where a large “dead zone”—devoid of fishand commercially important seafood such asshrimp—has developed. CAFO manure also con-tributes to similar dead zones in the ChesapeakeBay (another important source of fish and shell-fish) and other important estuaries along the EastCoast. The Chesapeake Bay’s blue crab industry,which had a dockside value of about $52 million in2002, has declined drastically in recent years alongwith other important catches such as striped bass,partly due to the decline in water quality caused inpart by CAFOs.
Although it is difficult to account for all of thesocial benefits (such as fisheries and drinkingwater) lost due to CAFO pollution, it is reasonableto assume the losses are substantial. One indirectway of estimating such costs is to calculate the costof preventing some or all of the pollution causedby CAFOs. The USDA, for example, has deter-mined how much it would cost to transport ma-nure to enough crop fields or pastures to complywith new Clean Water Act rules governing the dis-tribution of manure on fields. Based on a nitrogen-limited standard and realistic estimates of the rateat which farms will accept manure, the annual cost
of adequate manure distribution in the ChesapeakeBay region alone would total $134 million per year.Using a phosphorus-limited standard and an unre-alistically high manure acceptance rate, the costwould be $153 million annually. Considering thatnet returns for the animal industry in this regionamount to $313 million, compliance with suchstandards could comprise between 43 and 49 per-cent of net returns.
Air pollution from manureAirborne ammonia is a respiratory irritant and cancombine with other air pollutants to form fine par-ticulate matter that can cause respiratory disease.And because ammonia is also re-deposited onto theground, mostly within the region from which itoriginates, ammonia nitrogen deposited on soilsthat have evolved under low-nitrogen conditionsmay reduce biodiversity and find its way into watersources. Ammonium ion deposition also con-tributes to the acidification of some forest soils.
Animal agriculture is the major contributor ofammonia to the atmosphere, and the substantialmajority of this ammonia likely comes from con-finement operations, since manure deposited bylivestock on pasture contributes proportionatelymuch less ammonia to the atmosphere than manurefrom CAFOs. Up to 70 percent of the nitrogen inCAFO manure can be lost to the atmosphere de-pending on manure storage and field applicationmeasures. Over the past several decades, theamount of airborne ammonia deposition in manyareas of the United States with large numbers ofCAFOs has been rising dramatically, and may oenexceed the capacity of forests and other environ-ments to utilize it without harm.
e USDA has estimated the total U.S. cost ofcontrolling air and water pollution through manuredistribution onto farmland—in quantities that com-ply with the Clean Water Act—at $1.16 billion peryear under high manure acceptance rates. However,the standard applied in this calculation would onlyreduce airborne ammonia pollution from CAFOs byabout 40 percent. And if lower, more realistic ma-
4 Union of Concerned Scientists
nure acceptance rates were used, the manure wouldhave to be transported unacceptable distances.erefore, proper manure disposal from CAFOs atcurrent farmer acceptance rates would in all likeli-hood exceed these values considerably.
Harm to rural communitiesCAFOs are sited in rural communities that bear thebrunt of the harm caused by CAFOs. is harm in-cludes the frequent presence of foul odors and watercontaminated by nitrogen and pathogens, as wellas higher rates of respiratory and other diseasescompared with rural areas that are not locatednear CAFOs.
One study determined that each CAFO in Mis-souri has lowered property values in its surroundingcommunities by an average total of $2.68 million. Itis not possible to accurately extrapolate this valuenationally due to the many differences between lo-calities, but as a very rough indication of the magni-tude of these costs, multiplying by 9,900 (the totalnumber of U.S. CAFOs as defined for this report)would yield a loss of about $26 billion.
Antibiotic-resistant pathogensEstimates have suggested that considerably greateramounts of antibiotics are used for livestock pro-duction than for the treatment of human disease inthe United States. e massive use of antibiotics inCAFOs, especially for non-therapeutic purposessuch as growth promotion, contributes to the devel-opment of antibiotic-resistant pathogens that aremore difficult to treat.
Many of the bacteria found on livestock (such asSalmonella, Escherichia coli, and Campylobacter) cancause food-borne diseases in humans. Furthermore,recent evidence strongly suggests that some methi-cillin-resistant Staphylococcus aureus (MRSA) anduropathogenic E. coli infections may also be causedby animal sources. ese pathogens collectivelycause tens of millions of infections and many thou-sands of hospitalizations and deaths every year.
e costs associated with Salmonella alone havebeen estimated at about $2.5 billion per year—about
88 percent of which is related to premature deaths.Because an appreciable degree of antibiotic resist-ance in animal-associated pathogens is likely due tothe overuse of antibiotics in CAFOs, the resultingcosts are likely to be high. Eliminating the use of an-tibiotics for growth promotion (the majority ofwhich occurs on CAFOs) could cost CAFOsbetween $1.5 billion and $3 billion per year.
Conclusions and Recommendations
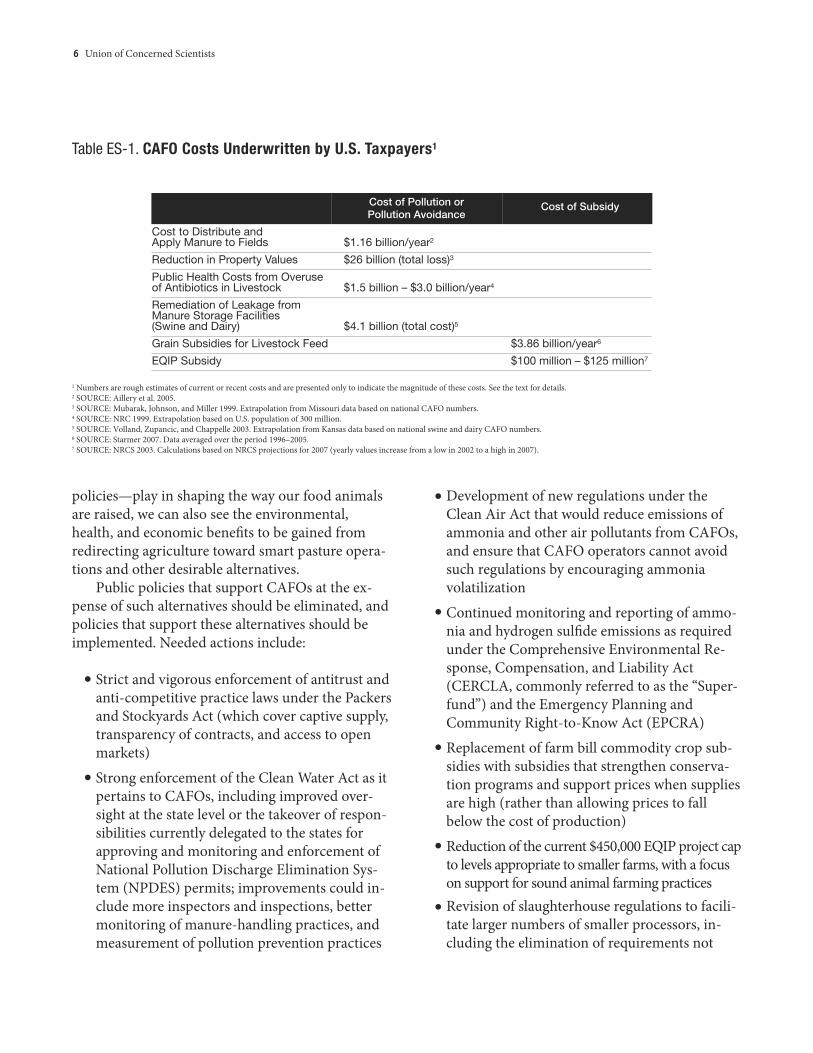
e costs we pay as a society to support CAFOs—inthe form of taxpayer subsidies, pollution, harm torural communities, and poorer public health—ismuch too high (Table ES-1, p. 6). For example, con-servative estimates of grain subsidies and manuredistribution alone suggest that CAFOs would haveincurred at least $5 billion in extra production costsper year if these expenses were not shied onto thepublic. e figure would undoubtedly be muchhigher if truly adequate manure distribution was re-quired. Although we do not have good national datafor other costs quantified in Table ES-1, and somethat have not been quantified (such as water and en-ergy use and water purification costs), they couldamount to billions of dollars more per year.
Technological solutions to specific CAFO prob-lems have been proposed, such as feed formulationsthat would reduce manure nitrogen, lagoon coversthat would reduce atmospheric ammonia, and “bio-gas” capture and production that would reducemethane emissions from manure, but these are onlypartial solutions and would generally add to the costof production. None of these technologies solve an-tibiotic resistance, loss of rural income, or theethical treatment of animals. By comparison, so-phisticated CAFO alternatives can provide plentifulanimal products at similar prices, but with muchfewer of the problems caused by CAFOs.
e bottom line is that society is currently prop-ping up an undesirable form of animal agriculturewith enormous subsidies and a lack of accountabil-ity for its externalized costs. Once we appreciate therole these subsidies—along with government
CAFOs Uncovered 5
policies—play in shaping the way our food animalsare raised, we can also see the environmental,health, and economic benefits to be gained fromredirecting agriculture toward smart pasture opera-tions and other desirable alternatives.
Public policies that support CAFOs at the ex-pense of such alternatives should be eliminated, andpolicies that support these alternatives should beimplemented. Needed actions include:
Strict and vigorous enforcement of antitrust andanti-competitive practice laws under the Packersand Stockyards Act (which cover captive supply,transparency of contracts, and access to openmarkets)
Strong enforcement of the Clean Water Act as itpertains to CAFOs, including improved over-sight at the state level or the takeover of respon-sibilities currently delegated to the states forapproving and monitoring and enforcement ofNational Pollution Discharge Elimination Sys-tem (NPDES) permits; improvements could in-clude more inspectors and inspections, bettermonitoring of manure-handling practices, andmeasurement of pollution prevention practices
Development of new regulations under theClean Air Act that would reduce emissions ofammonia and other air pollutants from CAFOs,and ensure that CAFO operators cannot avoidsuch regulations by encouraging ammoniavolatilization
Continued monitoring and reporting of ammo-nia and hydrogen sulfide emissions as requiredunder the Comprehensive Environmental Re-sponse, Compensation, and Liability Act(CERCLA, commonly referred to as the “Super-fund”) and the Emergency Planning andCommunity Right-to-Know Act (EPCRA)
Replacement of farm bill commodity crop sub-sidies with subsidies that strengthen conserva-tion programs and support prices when suppliesare high (rather than allowing prices to fallbelow the cost of production)
Reduction of the current $450,000 EQIP project capto levels appropriate to smaller farms, with a focuson support for sound animal farming practicesRevision of slaughterhouse regulations to facili-tate larger numbers of smaller processors, in-cluding the elimination of requirements not
6 Union of Concerned Scientists
•
•
•
•
•
•
•
Cost of Pollution or Cost of SubsidyPollution Avoidance
Cost to Distribute andApply Manure to Fields $1.16 billion/year2
Reduction in Property Values $26 billion (total loss)3
Public Health Costs from Overuseof Antibiotics in Livestock $1.5 billion – $3.0 billion/year4
Remediation of Leakage fromManure Storage Facilities(Swine and Dairy) $4.1 billion (total cost)5
Grain Subsidies for Livestock Feed $3.86 billion/year6
EQIP Subsidy $100 million – $125 million7
Table ES-1. CAFO Costs Underwritten by U.S. Taxpayers1
1 Numbers are rough estimates of current or recent costs and are presented only to indicate the magnitude of these costs. See the text for details.2 SOURCE: Aillery et al. 2005.3 SOURCE: Mubarak, Johnson, and Miller 1999. Extrapolation from Missouri data based on national CAFO numbers.4 SOURCE: NRC 1999. Extrapolation based on U.S. population of 300 million.5 SOURCE: Volland, Zupancic, and Chappelle 2003. Extrapolation from Kansas data based on national swine and dairy CAFO numbers.6 SOURCE: Starmer 2007. Data averaged over the period 1996–2005.7 SOURCE: NRCS 2003. Calculations based on NRCS projections for 2007 (yearly values increase from a low in 2002 to a high in 2007).

CAFOs Uncovered 7
appropriate to smaller facilities, combined withpublic health measures such as providing ade-quate numbers of federal inspectors or empow-ering and training state inspectors
Substantial funding for research to improvealternative animal production methods (especiallypasture-based) that are beneficial to the environ-ment, public health, and rural communities
•


lthough our milk cartons still portray con-tented cows and chickens on pastures in front
of bright red barns, these bucolic scenes are far fromthe current reality in which food animals are pro-duced. Food animals today are predominantlyraised in very large facilities called CAFOs (con-fined animal feeding operations), which containthousands of animals and are geographically con-centrated in several regions of the country. Al-though consumers pay a relatively low price formeat, milk, and eggs produced in CAFOs, society ingeneral pays a high price for such products in theform of taxpayer subsidies and damage to the envi-ronment, public health, and rural communities.is report examines some of the oen hidden costsof CAFOs to arrive at a meaningful accounting oftheir true costs.
e U.S. Environmental Protection Agency(EPA) estimates that there are approximately 15,500CAFOs in the United States, as defined by CleanWater Act regulations (EPA 2003), including about9,900 large CAFOs containing the types of animalsthat are the focus of this report1 (EPA 2002). Al-though large CAFOs make up only 5 percent of allanimal feeding operations (AFOs), they contain 50percent of all animals and produce 65 percent oflivestock2 manure (Ribaudo et al. 2003).
e large numbers of animals in CAFOs pro-duce mountains of waste—more than 300 milliontons per year, or twice the amount produced by theentire human population of the United States (EPA2003). Unlike the majority of human waste, how-ever, livestock waste is not treated to reduce pollu-
tants and pathogens, but is applied untreated to landand allowed to pollute the air and water. Animalmanure is oen temporarily stored in facilities suchas pits or “lagoons,” but instead of frogs, fish, andwater lilies, these lagoons hold foul-smelling liquidwaste. Typically, the waste from CAFOs is ultimatelyapplied to nearby crop or grass fields in amountsthat may not be fully absorbed by the land.
Because CAFOs contain many animals in a rela-tively small area, the waste they produce becomes amajor disposal problem unless ample cropland isavailable nearby. Unfortunately, such cropland isoen too distant to be accessed without consider-able expense. And although manure is intrinsicallyvaluable as fertilizer if applied to crops, it also repre-sents an important source of pollution if its compo-nents make their way into our air and water. ispollution contributes to large areas of oxygen-depleted coastal waters that are now devoid of fish(as in the Chesapeake Bay and Gulf of Mexico), andexacerbates the spread of pathogens and disease.Spills from manure storage facilities into streamsand rivers have killed millions of fish and increasedwater purification costs for downstream communi-ties. Furthermore, the odor from CAFOs has ham-pered life and lowered property values for nearbyhomeowners.
The Rise of the CAFO
e increasing size of animal farms and the geo-graphic concentration of CAFOs have not alwaysbeen part of the picture of animal farming in the
CAFOs Uncovered 9
INTRODUCTION
A
1 e number of CAFOs as defined by the EPA includes some medium-sized operations that are not the primary focus of this report. e number of largeCAFOs to which we refer excludes operations that produce sheep and horses exclusively (which are not covered in this report).2 e term “livestock” is oen used to refer to large farm animals such as cattle and pigs, but for the sake of simplicity, this report also includes poultry underthe definition of livestock.

United States. Poultry industry concentration hasbeen increasing for more than 50 years, but the con-centration of pig and cattle production has onlyincreased dramatically in the last few decades.Overall, the number of animals on small tomedium-sized farms decreased substantially be-tween 1982 and 1997, while animals on CAFOs in-creased by 88 percent (Kellogg et al. 2000). Inaddition, many animal farmers have ceased beingindependent and diversified producers of crops andlivestock, and have become contract farmers forhuge animal-product processors.
What accounts for this enormous change in theway we raise livestock? One might assume that thetransformation of animal agriculture in the UnitedStates and elsewhere reflects a process of increasingmodernization and efficiency, and that the relativelylow prices we currently pay for meat, milk, and eggscould only be maintained by continuing to raise ani-mals in such systems.
is assumption is, at best, a half-truth. As willbe seen in this report, the existence of CAFOs canbe attributed only in part to efficiencies of scale andtechnological advances that reduce productioncosts. When examined in detail, economies of scalelargely disappear for CAFOs. A more important fac-tor is processor-driven vertical integration and co-ordination,3 and the resulting accumulation ofmarket power in the hands of large processors.
is trend is facilitated by a wide array of subsi-dies—both direct and indirect—paid for by the pub-lic. For example, taxpayers have supported CAFOsthrough crop subsidies that most of the public is un-aware of and would not connect to animal produc-tion. And because CAFOs are not held accountablefor the environmental and health damage caused bytheir pollution (leaving the public to foot the bill),CAFOs are essentially being subsidized in this re-gard as well. A full accounting of the cost of animalproducts reveals that CAFOs are anything but effi-
cient—consumers are actually paying a very highprice for this type of production.
e history and highly subsidized nature ofCAFOs suggest that these operations are not an in-evitable and essential form of animal agriculture,but the result of specific government policies. Al-though CAFOs are entrenched, other systems canalso produce plentiful and—from a perspective inwhich all the costs are taken into account—reason-ably priced meat, milk, and eggs.
Considering the Alternatives
e purpose of this report is to illuminate some ofthe important hidden costs of CAFOs. By doing sowe can make a more informed decision aboutwhether this form of animal agriculture representsthe path to a sustainable way of producing livestock,or a temporary diversion from that path.
e scope of the report is domestic rather thaninternational, and is not intended to be comprehen-sive in terms of the subsidies discussed. We havelooked at three major categories: direct taxpayersubsidies (payments made directly to CAFOs for ac-tions they take to reduce pollution, such as manuretransport to crop fields), indirect taxpayer subsidies(payments made to others, such as farmers whoproduce grain for animal feed, thereby loweringCAFOs’ operating costs), and the “virtual” subsidiesrepresented by the costs society pays for environ-mental and health damage caused by CAFOs.
We were unable to quantify costs that CAFOsimpose on society, such as air pollution, except in apreliminary way, but have included numbers wherewe could find them. Some data are better than oth-ers, and we focused most of our attention on severalcalculations at the national level because of theirlarger scale than local subsidies. Nevertheless, localand state subsidies may add up to large cumulativenational costs. Finding enough of these costs to
10 Union of Concerned Scientists
3 Vertical integration is the ownership by a single company of several stages of production, such as the production, processing, and marketing of chickenmeat. Vertical coordination is the control by a single company of several stages of production (for example, through the production contracts that processorsoen require of meat producers).

draw precise conclusions was beyond the scope ofthis report, but even when limited to the availablenational data, a glimpse of the large scale of CAFOsubsidies is possible.
Alternatives to CAFOs are many and diverse.ey include smaller feeding operations; pasture-based cattle, swine, and poultry; and swine hoopbarns. Even these alternatives receive some subsi-dies; in particular, systems that use feed grain mayhave received some of the indirect grain subsidiesthat CAFOs have received. However, some alterna-tives have not received these subsidies, and mosthave received proportionately less than CAFOs. Al-ternatives do not receive several important directsubsidies (e.g., for manure transport), and they donot produce the degree of water pollution, air pollu-tion, antibiotic-resistant organisms, health costs, orharm to rural communities that CAFOs do, thusgreatly reducing the costs the public must bear.
Depriving CAFOs of their subsidies could helplevel the playing field, but would not necessarily en-sure the success of alternative systems. In manyways subsidies are appropriate in agriculture—pro-vided the public gets the desired benefits in returnfor its investment.
CAFOs Uncovered 11

AFOs are distinguished from other ways of rais-ing livestock by their size, high-density confine-
ment of livestock, and grain-based diet, whichrequires bringing feed to the animals rather than al-lowing the animals to graze or otherwise seek theirfood. Other ways of raising farm animals may in-clude some of the features of CAFOs, such as a pre-dominantly grain-based diet or some degree ofconfinement, but CAFOs have all of these features.
CAFOs are primarily associated with the pro-duction stages of livestock. For example, beef cattleenter CAFOs aer weaning and early growth, andremain until they are ready for slaughter. e earlierstages of beef cattle production, so-called cow-calfoperations, oen involve much smaller numbers ofcattle than CAFOs and occur on widely dispersedrange or pasture. On the other hand, broiler chick-ens typically enter CAFOs within a few days ofhatching.
Definitions of CAFOs differ in terms of theminimum number of animals a facility has on site.is report uses the U.S. Environmental ProtectionAgency (EPA) definition, which considers 700 dairyand 1,000 beef cows as the lower limit for cattleCAFOs (EPA 2003). Chicken CAFO sizes dependon the waste system and product: 30,000 broilers forwet-manure systems, 125,000 broilers for dry-litter4
systems, and 82,000 laying hens for egg-producingoperations. For hog-finishing operations, the lowerlimit is 2,500 hogs.5
e EPA definition has been criticized for lackof equivalence in manure production for the differ-
ent animal types. However, the EPA uses thesethresholds in its regulatory programs under theClean Water Act, and other agencies including theU.S. Department of Agriculture (USDA) also usethem in their calculations. Data and analyses by theEPA and USDA are of major importance in this re-port, and therefore the EPA definition is convenientfor these purposes. It should be kept in mind, how-ever, that cited literature may use other definitions.
Animal feeding operations (AFOs) that confineanimals at a high density but are smaller thanCAFOs are called small or medium-sized AFOs.Other operations such as hoop barns6 for pigs (Geg-ner 2004; Honeyman and Harmon 2003) generallyconfine animals to a main building, but at a lowerdensity and with more freedom of movement thanhog CAFOs. e high geographic clustering ofmany CAFOs is also an important feature of the sys-tem that dominates today’s agriculture.
Problems Associated with CAFOs
e size, density, and geographic clustering ofCAFOs pose several important problems. First,putting large numbers of animals together in a rela-tively small area produces a huge amount of ma-nure. e storage and ultimate disposal of thismanure can present environmental and healthchallenges.
e most feasible and cheapest means of ma-nure disposal is to apply it to crop fields or pastures.Because manure from CAFOs is very heavy,
CAFOs Uncovered 13
C h a p t e r 1
PRODUCTION COSTS OF CAFOs AND ALTERNATIVE SYSTEMS
C
4 Birds, unlike mammals, do not produce urine that is primarily water; some poultry operations therefore produce “litter” that has much lower water contentthan manure from pigs and cattle. It is oen disposed of by spreading on fields.5 e EPA uses the term animal unit, or AU, to compare different types of livestock. For example, while one beef cow equals one AU, it takes 2.5 market-sizedpigs to equal one AU. A CAFO typically contains 1,000 AU or more.6 Hoop barns are structures with curved roofs that, compared with CAFOs, are typically much less expensive, maintain pigs at lower densities, and providebedding material such as straw.
however, it can be prohibitively expensive to trans-port the manure beyond a short distance. Disposalmay therefore be accomplished by pumping the liq-uefied manure onto nearby “sprayfields” (a practicethat can only distribute manure over a relativelyshort distance), or by trucking it a greater distance(which adds additional expense).
e weight of CAFO manure is due to the mix-ing of urine and feces, which forms a slurry that ismostly liquid, and additional liquid is oen addedwhen manure is flushed with water into storage fa-cilities such as lagoons. Placing a large number ofanimals in a small space oen means that more ma-nure is produced than can be properly disposed ofon fields close to the CAFO.
Other problems stem from the density of theanimals in individual operations. High-density con-finement means that animals may be exposed totheir own manure, which is typically collectedwithin the stocking facilities, oen aer droppingthrough slatted floors. e manure can harbor andspread disease-causing organisms, and gases such asammonia and hydrogen sulfide emitted from themanure can be harmful to both animals and work-ers. CAFOs also release these harmful products into
the surrounding air and water, causing problems farbeyond the facility itself.
Large manure storage facilities are oen re-quired because the application of manure to fields isoen restricted to certain times of the year (e.g.,when the ground is not frozen). Such storage facili-ties raise additional environmental concerns. eycan overflow or collapse, sending unprocessed ma-nure into surface water, killing fish and contributingto degradation of the aquatic environment. Waterpollution can also occur due to leakage through theground under the storage facility, contaminatinggroundwater supplies such as wells and aquifers. Fi-nally, these facilities also emit gases, especially am-monia, that cause air pollution and global warming.
CAFOs Are Getting Bigger
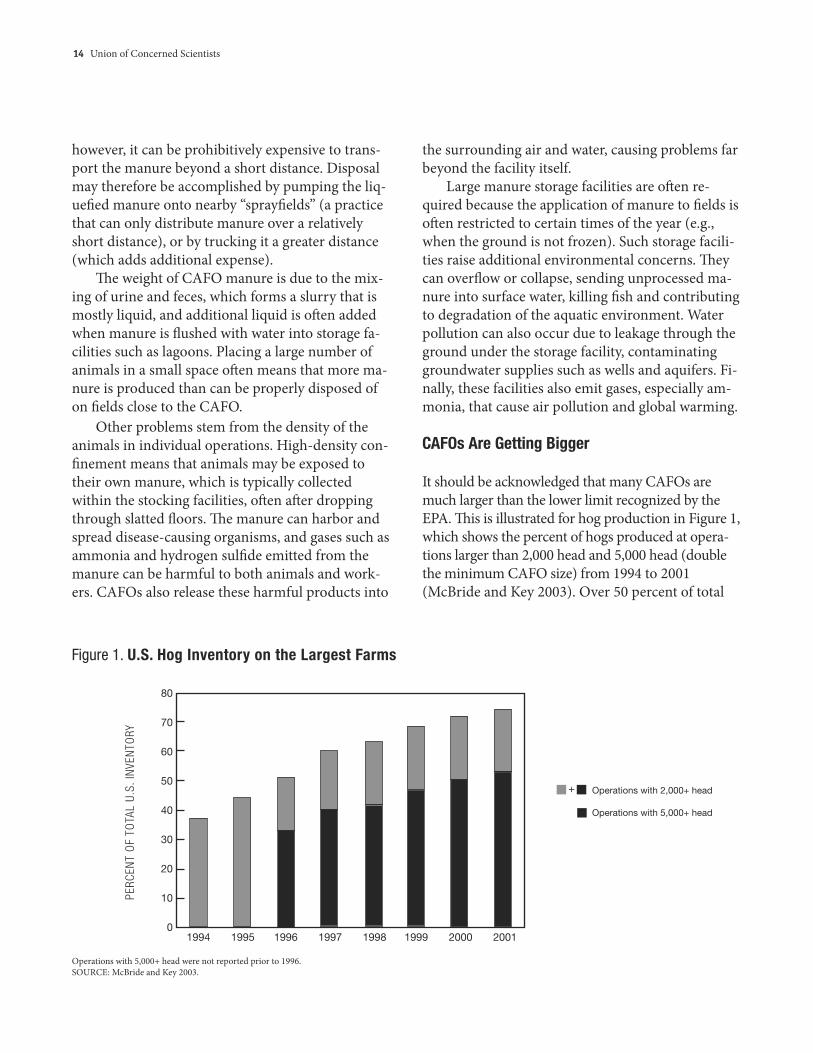
It should be acknowledged that many CAFOs aremuch larger than the lower limit recognized by theEPA. is is illustrated for hog production in Figure 1,which shows the percent of hogs produced at opera-tions larger than 2,000 head and 5,000 head (doublethe minimum CAFO size) from 1994 to 2001(McBride and Key 2003). Over 50 percent of total
14 Union of Concerned Scientists
Figure 1. U.S. Hog Inventory on the Largest Farms
PERC
ENT
OF
TOTA
LU.
S.IN
VEN
TORY
1994 1995 1996 1997 1998 1999 2000 2001
80
70
60
50
40
30
20
10
0
Operations with 2,000+ head
Operations with 5,000+ head
+
Operations with 5,000+ head were not reported prior to 1996.SOURCE: McBride and Key 2003.
hog production occurred on CAFOs with morethan 5,000 hogs by 2001. e average hog CAFOin the EPA’s southern seaboard region held morethan 12,000 head per year in 2004 (McBride andKey 2007).
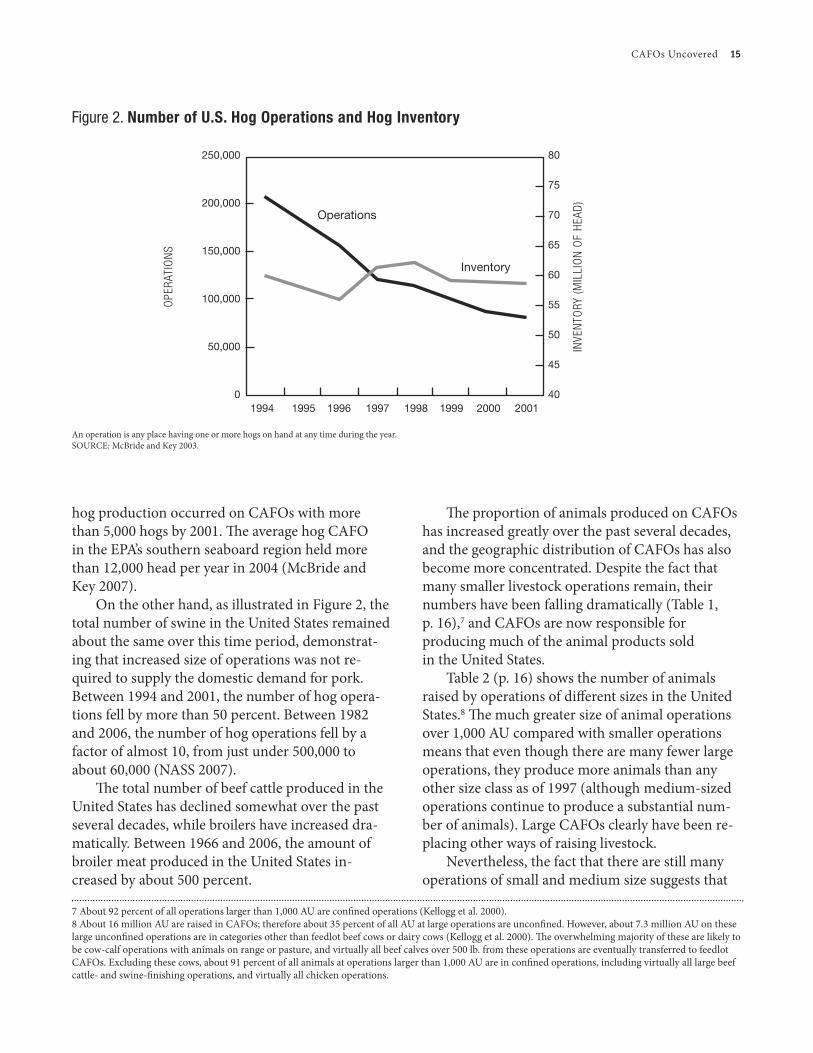
On the other hand, as illustrated in Figure 2, thetotal number of swine in the United States remainedabout the same over this time period, demonstrat-ing that increased size of operations was not re-quired to supply the domestic demand for pork.Between 1994 and 2001, the number of hog opera-tions fell by more than 50 percent. Between 1982and 2006, the number of hog operations fell by afactor of almost 10, from just under 500,000 toabout 60,000 (NASS 2007).
e total number of beef cattle produced in theUnited States has declined somewhat over the pastseveral decades, while broilers have increased dra-matically. Between 1966 and 2006, the amount ofbroiler meat produced in the United States in-creased by about 500 percent.
e proportion of animals produced on CAFOshas increased greatly over the past several decades,and the geographic distribution of CAFOs has alsobecome more concentrated. Despite the fact thatmany smaller livestock operations remain, theirnumbers have been falling dramatically (Table 1,p. 16),7 and CAFOs are now responsible forproducing much of the animal products soldin the United States.
Table 2 (p. 16) shows the number of animalsraised by operations of different sizes in the UnitedStates.8 e much greater size of animal operationsover 1,000 AU compared with smaller operationsmeans that even though there are many fewer largeoperations, they produce more animals than anyother size class as of 1997 (although medium-sizedoperations continue to produce a substantial num-ber of animals). Large CAFOs clearly have been re-placing other ways of raising livestock.
Nevertheless, the fact that there are still manyoperations of small and medium size suggests that
CAFOs Uncovered 15
250,000
200,000
150,000
100,000
50,000
0
80
75
70
65
60
55
50
45
401994 1995 1996 1997 1998 1999 2000 2001
Figure 2. Number of U.S. Hog Operations and Hog Inventory
OPE
RATI
ON
S
INVE
NTO
RY(M
ILLI
ON
OF
HEA
D)
An operation is any place having one or more hogs on hand at any time during the year.SOURCE: McBride and Key 2003.
Operations
Inventory
7 About 92 percent of all operations larger than 1,000 AU are confined operations (Kellogg et al. 2000).8 About 16 million AU are raised in CAFOs; therefore about 35 percent of all AU at large operations are unconfined. However, about 7.3 million AU on theselarge unconfined operations are in categories other than feedlot beef cows or dairy cows (Kellogg et al. 2000). e overwhelming majority of these are likely tobe cow-calf operations with animals on range or pasture, and virtually all beef calves over 500 lb. from these operations are eventually transferred to feedlotCAFOs. Excluding these cows, about 91 percent of all animals at operations larger than 1,000 AU are in confined operations, including virtually all large beefcattle- and swine-finishing operations, and virtually all chicken operations.

alternatives to large CAFOs need not only be tinyoperations. As seen in Table 1, for example, therewere almost 10 times as many medium-sized hogoperations (in the range of 150 to 300 animals) thanCAFOs in 1997, despite years of increasing concen-tration. ere are, therefore, a variety of buildingblocks that could be used to construct an alternativeto the CAFO system.
Bigger Does Not Mean More Ef=cient
e prevalence of CAFOs raises questions aboutwhy they have prospered, and conversely why othertypes of animal agriculture have been displaced.Does the spread of CAFOs reflect inherent eco-nomic advantages compared with other ways ofraising livestock, or are there other explanations? IfCAFOs do have some benefits in terms of produc-tion efficiency, it is important to weigh those advan-
16 Union of Concerned Scientists
Farm 1982 1987 1992 1997 Percent ChangeSize Category 1982 to 1997
Less Than 25 Total AU 660,425 577,488 496,206 474,335 -28
25 to <50 Total AU 263,355 233,366 217,423 203,402 -23
50 to <150 Total 336,505 297,081 275,128 246,220 -27
150 to <300 Total AU 84,041 79,952 80,178 77,219 -8
300 to <1,000 Total AU 35,437 35,697 38,666 41,534 +17
1,000 or More Total AU 5,442 5,757 6,526 8,021 +47
All Operations 1,385,205 1,229,341 1,114,127 1,048,731 -24
Table 1. Number of Livestock Operations by Size,* 1982–1997
*Operation size is measured in animal units (AU); numbers include both confined and unconfined animal operations.SOURCE: Kellogg et al. 2000.
Farm 1982 1987 1992 1997 Percent ChangeSize Category 1982 to 1997
Less Than 25 Total AU 7,311,927 6,406,057 5,727,476 5,407,009 -26
25 to <50 Total AU 9,465,723 8,379,402 7,797,699 7,277,610 -23
50 to <150 Total 29,009,019 25,722,744 23,961,311 21,460,328 -26
150 to <300 Total AU 17,142,530 16,352,605 16,483,027 15,967,020 -7
300 to <1,000 Total AU 16,912,228 17,061,674 18,603,343 20,271,518 +20
1,000 or More Total AU 15,779,144 17,285,205 19,364,252 24,925,729 +58
All Operations 95,620,570 91,207,687 91,937,108 95,309,215 0
Table 2. Number of Animals by Operation Size,* 1982–1997
*Operation size is measured in animal units (AU); numbers include both confined and unconfined animal operations.SOURCE: Kellogg et al. 2000.
tages against disadvantages such as the pollutioncaused by animal waste.
To assess the efficiency of CAFOs we must firstchoose one of several possible definitions. Onemeasure of efficiency is costs per unit of production.ese costs typically include labor, materials, andenergy, but CAFOs also cause harm to the environ-ment and people that are “costs” to society.
When such costs to the environment, publichealth, or rural communities are borne by societyrather than the producer they are termed “negativeexternalities” (or just “externalities” for the purposesof this report). If CAFOs were required to remediateor prevent the cost of these externalities, they wouldincur higher production costs and thus be consid-ered less efficient than they currently appear. In ad-dition, CAFOs receive subsidies that help defraytheir production costs. Because these subsidies aretypically funded by taxes, society is paying to reduceCAFOs’ production costs in more ways than one.
So, when examined in a broader societal con-text, suppositions about the higher economic effi-ciency of CAFOs can be seen as half-truths. eprimary purpose of this report is to examine someof the costs our society pays for CAFOs from an en-vironmental and public health perspective, and howsubsidies create an illusion of CAFO efficiency.
e societal costs of pollution externalities andgrain subsidies—that is, costs for which CAFOowners have never been held accountable—are ex-amined primarily in Chapters 2 and 3. But first, weconsider narrower aspects of efficiency that encom-pass those costs CAFO owners have historically paid.
Factors Contributing to CAFO Growth
Several key factors have driven CAFO expansion,one being the availability of cheap inputs (i.e., ex-penses such as grain, water, and energy that havevariable costs). We consider the importance of low-cost grain below.
Another factor that will be briefly addressed inChapter 3 is technological change. is has taken
the form of developing breeds of livestock that bettersuit the CAFO environment and that facilitate high-speed processing, reliance on antibiotics to compensatefor conditions that favor disease, and feed formulationsthat allow animals to be produced in a way that meetsthe demands of CAFOs. ese changes and others haveoen been accomplished through taxpayer-supportedresearch at public universities.
In addition, the ability of CAFOs to shi thecosts of their pollution onto the public in the formof externalities such as air and water pollution re-duces the apparent costs of production. e cost ofthese externalities is considered at greater length inChapter 3.
In this chapter we will examine economic effi-ciencies and processor-related market control.
Economic efficiencyEconomies of scale, which help larger operationsrun more efficiently by using production tools notreadily available to smaller operations, are oenoveremphasized in discussions of CAFO efficiency.Economies of scale do exist for CAFOs when costssuch as manure disposal are avoided, but are oensmall and reach optimum levels at an operation sizebelow that of large CAFOs.
Much more important has been the availabilityof low-cost grain, which allows CAFOs to maintainlarge numbers of animals in a small space (becausethe grain can be brought to the animals rather thanhaving the animals forage for their food, as in pas-tures). Corn and soybeans, the primary feed grains,are high in easily digestible carbohydrates and pro-tein compared with forage. eir high nutritionalvalue per unit of weight allows large volumes ofthese grains to be shipped at relatively low expense,9
further facilitating the centralization of animal feed-ing operations. For example, the ability to ship grainat low cost to the Mid-Atlantic, which lies outsidemajor corn- and soybean-growing regions, has facil-itated the dramatic growth of CAFOs in North Car-olina—now the second largest hog-producing stateand fourth largest producer of broilers.
CAFOs Uncovered 17
9 Soybeans are technically not grain, but for the sake of simplicity will be referred to as grain along with corn in this report (unless otherwise noted).

e high nutrient content of grain also gives it ahigh “conversion efficiency” compared with manyother feed sources. Conversion efficiency refers tothe amount of feed needed to produce a unit of ani-mal product. Cattle, even though they evolved to eatforage, generally add weight somewhat faster andproduce more milk when fed grain rather than pas-ture or forage.
Livestock also expend more energy to maintainbody temperature and mobility on pasture and otherCAFO alternatives, which contributes to lower con-version efficiency. Animals that are housed in temper-ature-controlled facilities and have restricted mobilitycan devote more of their food consumption to gainingweight or producing eggs or milk. In other words, ani-mals in heated facilities are kept warm through theuse of fossil fuel energy rather than the metabolic en-ergy they would otherwise expend.
Beginning in the 1950s, the growth of broilerCAFOs applied pressure to other livestock sectors toadopt similar measures for increasing production andreducing costs. Chickens convert grain into meatmore efficiently than cattle or hogs: it typically takesabout 2.3 lb. of grain to produce a pound of chicken,but 5.9 lb. to produce a pound of pork and 13 lb. for apound of beef (Pimentel and Pimentel 2003), so evenaer adopting CAFO production methods, a grain-based diet for poultry maintains some advantagescompared with other types of livestock.
Despite its advantages for weight gain, heavy de-pendence on feed grain can only occur if it is lessexpensive than alternatives such as forage. is isbecause feed is a large part of CAFOs’ productioncosts—about 60 percent for hogs and broilers(Starmer, Witteman, and Wise 2006). As discussedat length in the following chapter, the low cost ofgrain in recent decades has been largely supportedby federal government policies that 1) provide tax-payer subsidies for cheap grain and 2) have elimi-nated grain supply controls, allowing prices to fall.Because feed comprises such a large expense for theCAFO industry, the cost to taxpayers for this sub-sidy is high.
Low-cost inputs such as grain favor CAFO ex-pansion when prices for animal products are low.
is has generally been the case during the past sev-eral decades. Low-cost inputs spread the high fixedcosts of confinement infrastructure (such as thebuildings that contain the animals) over many unitsof production. CAFOs can compensate for lowprofit margins per animal by producing large num-bers of animals. By contrast, small and diversifiedproducers oen have relatively lower fixed costs andhigher variable costs, and may attempt to lowertheir costs by reducing production when prices arelow. In this way, CAFOs may expand at the expenseof smaller operations.
Another factor in CAFO efficiency is economiesof scale. Hypothetically, a large facility may be ableto afford machinery that greatly improves produc-tion efficiency because its cost is distributed over alarge amount of finished product (in this case,processed animals). A smaller facility could not takeadvantage of such efficiency because the cost of themachinery would be spread over too few products.Studies of this factor in the hog industry (e.g.,McBride and Key 2003) suggest that economies ofscale exist, but are oen minimal for animal pro-ducers larger than medium-sized AFOs or smallCAFOs. erefore, economies of scale do not signif-icantly favor CAFOs over medium-sized operations.
A summary of several studies comparing theproduction costs of hog operations by size showedthat smaller and medium-sized hog farms had coststhat, compared with the largest farms, ranged fromthe same to 15 to 28 percent higher (Weida 2004a).For example, in one of the cited studies, three years’worth of data suggested that the optimal operationsize based on cost of production was 120 sows (pro-ducing about 2,400 hogs per year). Typical costs inother studies were about 5 to 11 percent higher forthe smaller farms of 150 to 250 sows (producingabout 3,000 to 5,000 hogs per year) compared withoperations of 3,500 sows. Medium-sized AFOs weretypically more efficient than the smallest operations.Profits per hog for the best third of producers in an-other of the cited studies, regardless of operationsize, averaged about $10 per hog in 1999 dollars.
Smaller to medium-sized independent hog pro-ducers span a range of production efficiencies, and
18 Union of Concerned Scientists

the more efficient of these operations are cost-com-petitive with larger CAFOs (Ikerd 2004; McBrideand Key 2003). ese more-efficient smaller, inde-pendent operations produce hogs at about the samecost as the larger CAFOs. In a more recent study,costs for very large hog feeder-to-finish CAFOs av-eraged about 9 percent less than medium-sized op-erations (500 to 1,999 head). However, 38 percent ofmedium-sized operations had costs below $40 perhundredweight (cwt), compared with 64 percent ofvery large CAFOs. A similar percentage of medium-sized operations, and about 16 percent of smallones, had the same or lower production costs thanthe average very large hog CAFO. Many medium-sized operations used production practices associ-ated with higher efficiency, such as “all-in-all-out”production and “phase feeding” (McBride and Key2007).10 ese data suggest that management skillsmay oen be more important than size in determin-ing efficiency, and that medium-sized and somesmall AFOs are capable of production as cost-effec-tive as CAFOs—even without considering the exter-nalities of manure that CAFOs impose in greateramounts than smaller operations.11
Comparisons based on scale are difficult whencomparing fundamentally different types of animalproduction. For example, such comparisons may beuseful when comparing CAFOs to smaller but oth-erwise similar AFOs. Various alternative livestockand poultry production methods, however, may dif-fer substantially from CAFOs in the technology,capital, and labor processes they employ, and theconsumer markets they target. In those cases, fac-tors other than scale may also be important in de-termining efficiency or economic viability.
For example, hog hoop barns that use deep bed-ding are generally a substantially less expensive al-ternative to hog CAFO shelters. On the other hand,
because hoop barns typically allow more space peranimal (especially if the hogs are provided with out-door access), fewer animals may be raised per unitof land. Bedding in hoop barns—typically small-grain straw or corn stalks—also adds expense, be-cause hog CAFOs typically have no bedding. Inaddition, feed conversion rates in Iowa (where moststudies of hoop barns have taken place) are some-what lower in typically unheated hoop barns in win-ter (Kliebenstein et al. 2003). us, comparisonsbetween hoop barns and CAFOs based primarily onscale may not be appropriate to determine the fi-nancial viability of these alternative methods forraising hogs.
Processor-driven market controlAnother major factor in the growing predominanceof CAFOs is the integrated structure of the industry.Animal production and processing has become in-creasingly integrated and concentrated over the pastseveral decades. In particular, a few very large ani-mal processors largely control the supply of animalsthrough ownership or contracting arrangements.
And because of increasing functional integra-tion, processors have gained considerable economicpower over producers, who depend on processors toslaughter their animals and distribute their prod-ucts. In most cases, contracts (especially productioncontracts) have become the primary marketingarrangement between animal producers and proces-sors or packers (oen referred to as “integrators”).
Industry concentration has risen substantiallyover the past several decades, to a point where itmay have a substantial impact on producers. An in-dustry in which the market share of the four largestfirms (“four-firm concentration” or CR4) totalsmore than 40 percent is oen considered to threatenfree-market mechanisms by giving those firms too
CAFOs Uncovered 19
10 All-in-all-out production keeps animals of the same age together in discrete batches, rather than mingling animals of different ages. Phase feeding matchesanimals’ diets to their specific life stage.11 It has been observed that many operators of smaller and independent hog farms are older and preparing for retirement (McBride and Key 2003). eseolder owners may be less willing to invest in newer management approaches or make capital improvements that would improve efficiency. Younger or newerproducers, on the other hand, may be more attracted to CAFO production methods such as contract arrangements with processors for several reasons; reduc-tion of risk has been suggested as one. Better availability of credit has also been associated with contract production, and because of the high capital expensesassociated with CAFOs, may be a significant motivating factor (MacDonald et al. 2004; Knoeber and urman 1995). Insufficient open-market options for in-dependent producers may be another reason.

much control over pricing and supply (Heffernan2000). e broiler chicken processing industry’sCR4 is 56 percent, the beef industry’s is 83.5 per-cent, and the hog industry’s is 64 percent, and eachhas been rising steadily for the past several decades.In 1990 these numbers were 44 percent, 72 percent,and 40 percent, respectively (Hendrickson and Hef-fernan 2005). In 1987, the pork packers’ CR4 was 37percent, and the broiler processors’ was 35 percentin 1986—both below the 40 percent benchmark.e dairy processing industry is more complex thanother sectors, but is also undergoing increasing con-centration (Hendrickson et al. 2001).
Several of the largest companies, such as Cargill,ConAgra, Smithfield, and Tyson, have substantialholdings in several livestock sectors, and also ownlarge numbers of animals. For example, Smithfield isby far the largest owner of hogs in the country.Cargill and ConAgra are also grain suppliers (Hen-drickson and Heffernan 2005). Growing ownershipby processors (called “captive supply”), a high per-centage of production contracts, and shrinkingopen (or “spot”) markets have the potential to dis-tort markets in favor of lower prices for producers.
Despite this growing industry concentration,the federal authority charged with oversight of theprocessor industry, the USDA’s Grain Inspection,Packers and Stockyards Administration (GIPSA),has been strongly criticized for lax regulation ofanti-competitive practices under the Packers andStockyards Act (PSA). In reports beginning in 2000,the Government Accountability Office (GAO, for-merly the General Accounting Office) and theUSDA’s Office of Inspector General (OIG) foundthat GIPSA lacked the organizational structure andprocesses needed to effectively monitor and enforcePSA provisions (GAO 2000). In particular, GIPSAdid not adequately involve attorneys from its Officeof General Counsel in its investigations of potentialanti-competitive practice violations.
Although GIPSA agreed to many of the recom-mendations of the GAO’s 2000 report, later investi-gations by the GAO and OIG found that importantagreed-upon improvements had not been imple-
mented (USDA 2006; GAO 2005), and lawyers hadnot been adequately integrated into GIPSA actions.e GAO noted that GIPSA senior managementthwarted investigations through delays and inac-tion, and that GIPSA officials had not adequatelyresponded to the GAO and OIG reports (GAO2006). e investigations of GIPSA oversight of theprocessor industry suggest that anti-competitivepractices against smaller and independent animalproducers are unlikely to be prevented under thecurrent system.
e limited access of small and medium-sizedproducers to slaughterhouses is exacerbated byUSDA inspection requirements. With the exceptionof small chicken producers in many states that selldirectly to consumers, health inspections are neces-sary for marketing, and federal inspections are re-quired for sales across state lines. Access toregulator-approved facilities is therefore needed toensure broad market access. In other words, diffi-culty in gaining access to processors not only im-pedes producers’ ability to slaughter their animals,but also may restrict their ability to market theirproducts. e resulting bottleneck between producerand consumer can reduce the viability of smaller andalternative producers even when their products maybe competitive based on production costs.
Poultry processors, for example, have becomelarger and have built larger slaughterhouses. At thesame time, smaller processors and processing plantshave le the industry (Ollinger, MacDonald, andMadison 2005). e remaining large processorspreferentially contract with large producers (i.e.,CAFOs) and do not accept chickens or hogs fromindependent producers. is problem is exacerbatedby the need for slaughterhouses to be close to pro-ducers due to the potential harm done to animalsduring transportation.
Contracts are key features of the CAFO system.Broiler and egg production, the first types of animalproduction to develop CAFOs, were almost entirelydominated by contracting in 2001 (as shown inTable 3), with 88 percent of production under con-tract. Almost 61 percent of hogs were also produced
20 Union of Concerned Scientists
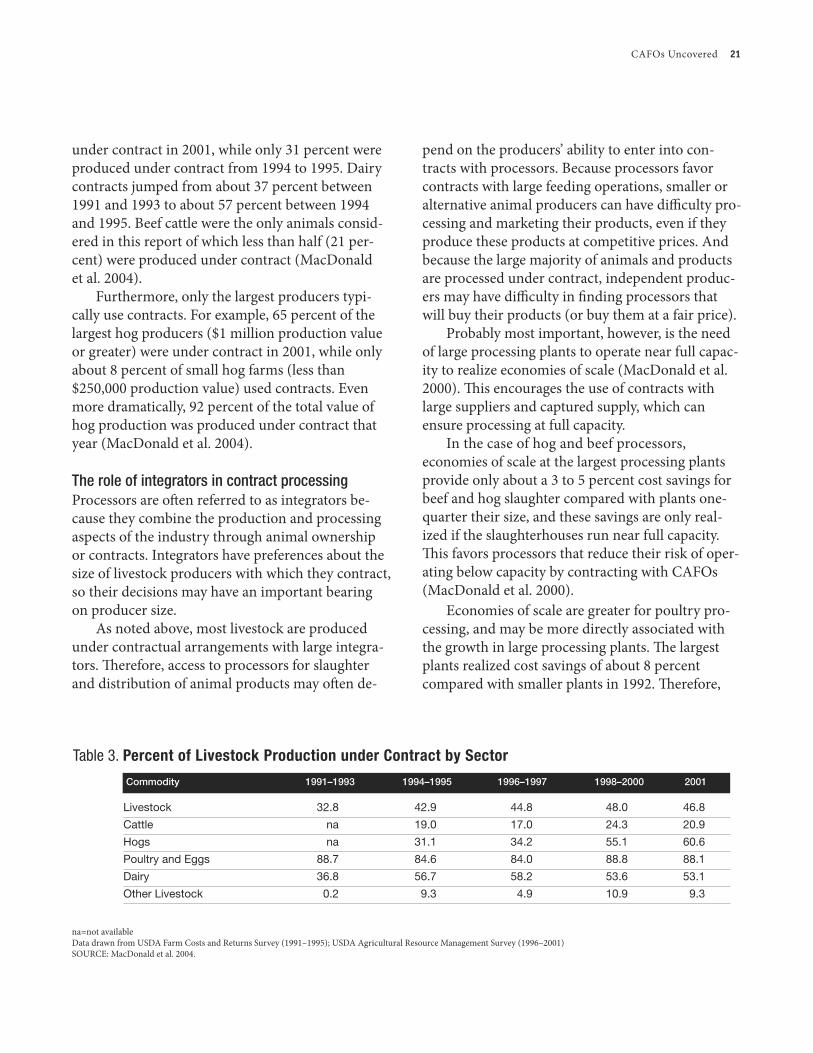
under contract in 2001, while only 31 percent wereproduced under contract from 1994 to 1995. Dairycontracts jumped from about 37 percent between1991 and 1993 to about 57 percent between 1994and 1995. Beef cattle were the only animals consid-ered in this report of which less than half (21 per-cent) were produced under contract (MacDonaldet al. 2004).
Furthermore, only the largest producers typi-cally use contracts. For example, 65 percent of thelargest hog producers ($1 million production valueor greater) were under contract in 2001, while onlyabout 8 percent of small hog farms (less than$250,000 production value) used contracts. Evenmore dramatically, 92 percent of the total value ofhog production was produced under contract thatyear (MacDonald et al. 2004).
The role of integrators in contract processingProcessors are oen referred to as integrators be-cause they combine the production and processingaspects of the industry through animal ownershipor contracts. Integrators have preferences about thesize of livestock producers with which they contract,so their decisions may have an important bearingon producer size.
As noted above, most livestock are producedunder contractual arrangements with large integra-tors. erefore, access to processors for slaughterand distribution of animal products may oen de-
pend on the producers’ ability to enter into con-tracts with processors. Because processors favorcontracts with large feeding operations, smaller oralternative animal producers can have difficulty pro-cessing and marketing their products, even if theyproduce these products at competitive prices. Andbecause the large majority of animals and productsare processed under contract, independent produc-ers may have difficulty in finding processors thatwill buy their products (or buy them at a fair price).
Probably most important, however, is the needof large processing plants to operate near full capac-ity to realize economies of scale (MacDonald et al.2000). is encourages the use of contracts withlarge suppliers and captured supply, which canensure processing at full capacity.
In the case of hog and beef processors,economies of scale at the largest processing plantsprovide only about a 3 to 5 percent cost savings forbeef and hog slaughter compared with plants one-quarter their size, and these savings are only real-ized if the slaughterhouses run near full capacity.is favors processors that reduce their risk of oper-ating below capacity by contracting with CAFOs(MacDonald et al. 2000).
Economies of scale are greater for poultry pro-cessing, and may be more directly associated withthe growth in large processing plants. e largestplants realized cost savings of about 8 percentcompared with smaller plants in 1992. erefore,
CAFOs Uncovered 21
Commodity 1991–1993 1994–1995 1996–1997 1998–2000 2001
Livestock 32.8 42.9 44.8 48.0 46.8
Cattle na 19.0 17.0 24.3 20.9
Hogs na 31.1 34.2 55.1 60.6
Poultry and Eggs 88.7 84.6 84.0 88.8 88.1
Dairy 36.8 56.7 58.2 53.6 53.1
Other Livestock 0.2 9.3 4.9 10.9 9.3
Table 3. Percent of Livestock Production under Contract by Sector
na=not availableData drawn from USDA Farm Costs and Returns Survey (1991–1995); USDA Agricultural Resource Management Survey (1996–2001)SOURCE: MacDonald et al. 2004.

economies of scale may explain a substantialamount of the consolidation in the poultry process-ing industry (Ollinger, MacDonald, and Madison2000). Although economies of scale are less pro-nounced for swine processors, that sector seems tobe following a similar pattern.
e increasing size of meat slaughtering opera-tions has occurred alongside the growth of CAFOs.is has led to the disappearance of smaller proces-sors that might be more accessible to smaller pro-ducers (Ollinger, MacDonald, and Madison 2005).By 1992 large plants processed 88 percent of chick-ens (Ollinger, MacDonald, and Madison 2005), andas of 1997, four firms handled almost 80 percent ofsteer and heifer slaughter—twice as much as twodecades earlier. Large plants handled 38 percent ofhog slaughter in 1977, but 88 percent by 1997(Table 4).
With the increase in large processors and largeplants operating through contracts with producers,and a simultaneous decrease in smaller processors,it is becoming increasingly difficult for smaller inde-pendent and alternative producers to find slaughter-houses willing to process their animals (Fanatico2003). is problem is exacerbated for specialty pro-ducers in niche markets such as pastured-raisedbeef, which require segregation of their productsfrom mainstream products.
An alternative to contracts is open bidding (alsocalled a competitive or “spot” market), which was
the common means for producers to sell to proces-sors prior to the predominance of contracting. Ascontracting has expanded, spot markets have be-come more restricted in many regions, which maylimit them as a marketing option for smaller pro-ducers (MacDonald et al. 2004). An added problemis that when spot markets become too small theymay no longer function efficiently, which can lowerprices for producers.
Although cattle producers may be unhappy withspot market prices, the data show only modestlylower spot prices compared with contracts (MacDon-ald et al. 2004). Nevertheless, because low prices foranimals may occur for both contract and spot mar-kets due to the economic concentration of processorsand their ability to cross-subsidize different sectors oftheir business (Heffernan 2000), spot market pricesthat are only modestly lower than contracts do notnecessarily reflect fair pricing for producers.
In summary, the evidence suggests that severalfactors have influenced the expansion of CAFOsover the past several decades, including the avail-ability of low-cost grain and coordination betweenCAFOs and large processors through contracts andownership. e ability of CAFOs to shi the costs oftheir pollution onto society has also been important,but is considered separately in Chapter 3.Economies of scale exist for some CAFOs but areoen modest, while many medium-sized AFOs areas efficient as the largest CAFOs.
22 Union of Concerned Scientists
Report YearSlaughter Classes and Size Cutoff*
All Cattle Steers/Heifers Cows/Bulls Hogs(<500,000) (<500,000) (>1 million) (<150,000) (>1 million)
1977 12 16 nr 10 38
1982 28 36 nr 15 59
1987 51 63 31 20 72
1992 61 76 34 38 86
1997 65 80 63 57 88
Table 4. Percent of Animals Slaughtered in Large Plants
*Size cutoff (in parentheses) refers to the number of animals slaughtered annually.nr=not reportedData drawn from U.S. Department of Agriculture (1999).SOURCE: MacDonald et al. 2000.

Are CAFO Alternatives Cost-effective?
Smaller to medium-sized AFOs that are adequatelydistributed geographically may address some of theconcerns posed by CAFOs. But what about other al-ternatives that may avoid more of the problems thatCAFOs cause? Are these alternatives cost-effective?
Although the following review is not intendedto be comprehensive, it shows that several of thebetter-researched alternatives can indeed competewith confinement operations. is is something of asurprise considering that the great majority of re-search dollars have been devoted to improvingCAFO performance while largely neglecting alter-native methods. In fact, one of the oen-touted ad-vantages of CAFOs is their ability to adopttechnological advances such as breeds that gainweight quickly—advances that are sometimes avail-able only to large producers.
e disparity in research effort also suggests thatthere may be substantial opportunities to improvethe efficiency of alternatives. is review is thereforeonly a snapshot of an evolving picture, and as suchprovides only a rough indication of the possibilities.
Hog production alternativesSome of the best-studied alternatives to CAFOs in-volve hog production. One of these alternatives ishoop barns—open-ended structures with curvedroofs, in which hogs are allowed to “nest” in strawbedding. Hogs may also be raised on pasture.
In one test, hogs raised in hoop barns in NorthDakota provided 6.63 percent higher net incomeper pig than conventional confinement. is testalso evaluated pasture-raised hogs and found thatthe net return was 4.07 percent higher than confine-ment (Landblom et al. 2001). ese results are alsosupported by Iowa Livestock Enterprise budgets cal-culated for confined and pasture-raised hogs for2003. at report determined the break-even sellingprice for pasture-raised hogs was $43.56/cwt, com-pared with $43.60/cwt for confined hogs (May, Ed-wards, and Lawrence 2003). Mid-gestation swineraised on alfalfa pasture, with only 40 percent oftheir diet from corn, gained weight and performed
as well as swine fed an exclusively corn/soy diet(Honeyman and Roush 1999).
Financial viability based on net returns (includ-ing amortization of infrastructure and debt) hasbeen used to determine how well hoop barns com-pare with confinement operations. Because hoopbarn production is more sensitive to different inputparameters than confinement, it will perform betteror worse than CAFOs under different circum-stances. For example, in one test conducted in Iowaduring winter, when feed conversion efficiency ispoorer than for confinement systems, hoop barnsdo less well by comparison. In warmer months,when conversion efficiencies are comparable, hoopbarns oen do as well or better than confinementproduction (Honeyman and Harmon 2003;Kliebenstein et al. 2003).
Poorer winter conversion efficiency, which re-sults in a slightly poorer overall efficiency, meansthat the financial viability of hoop barns is likely tobe more sensitive to grain prices than CAFOs. Forinstance, hoop barns will do less well by comparisonparticularly when grain prices are high and thegrain must be purchased rather than raised on thefarm. is alternative is also more sensitive to re-turns on investment: hoop barns delivered a higherreturn at prices over $54/cwt, while confinementoperations delivered better returns at lower prices.In addition, slightly more labor (three to six minutesper pig) was needed for hoop barns, so net returns forconfinement hogs were about 20 percent higher inthis test.
An additional consideration not evaluated inthese studies is the effect of geographic location oneconomic efficiency. For example, hoop barns mayperform better in locations where the climate ismilder than Iowa and the feed conversion ratios willthus be higher. On the other hand, because Iowa—the country’s top hog-producing state—is alsolocated in the country’s corn belt, its grain prices arelower than some other regions of the country. ismay favor production in hoop barns in Iowa even iffeed conversion efficiencies are lower than in statesthat have milder climates but little grain production.
CAFOs Uncovered 23
12 Because this study is a summary of other studies, the precise methods practiced by each organic farm are not revealed.
When well-managed, pasture can meet some ofthe nutritional requirements for gestating sows(Honeyman and Roush 1999), at least seasonally.is can reduce some of the cost of grain. For exam-ple, one three-year study demonstrated that as muchas 66 percent of a sow’s feed requirements can beobtained from a well-managed pasture program ifvitamin and mineral supplements are included(Gegner 2004).
Beef and dairy production alternativesCattle are capable of receiving all or most of theirdietary requirements from pasture or forage (suchas alfalfa hay) rather than grain. is is because cat-tle, as well as other ruminants such as sheep andgoats, have digestive systems that can efficientlyprocess forage including alfalfa and grasses, whichhave high cellulose content and relatively low levelsof simple carbohydrates such as starch or sugars.
Comparisons have been made between confine-ment and modern pasturing methods for cattle,such as managed intensive rotational grazing(MIRG). is method carefully moves cattle to sep-arated paddocks before pasture is overgrazed, pre-venting degradation and allowing re-growth. isalso reduces the risk of disease due to pathogensand parasites that can be found in manure, becausemost of these do not survive for long periods in theenvironment. Furthermore, pasture productionavoids at least some of the cost and energy involvedin harvesting feed grains or forages.
Preliminary work with beef cattle suggests thathoop barns may also be favorable compared withopen feedlots. e costs may be slightly higher, butmanure runoff issues could be much improved(Honeyman et al. 2008).
In a Minnesota study, two pasture-based dairyfarms were as or more profitable than a conven-tional confinement counterpart, although the con-finement operation was considerably smaller than aCAFO. e pasture farms sold organic milk andtherefore benefited from a 14 percent price pre-
mium (DiGiacomo et al. 2001); this helped themore profitable of the two produce twice the netprofit of comparably sized dairy farms in south-central Minnesota ($200,000 to $500,000 in grossincome)—most of which are likely to be confine-ment operations. Even without that premium, onepasture farm was financially comparable with theconventional farm, while the other outperformed itsconventional counterpart.
e more profitable pasture farm producedabout 33 percent less milk per cow than the confine-ment operation but had lower cow replacementcosts. In general, pastured dairy cows in the areaproduced about 24 percent less milk per cow thannon-pastured cows. e more profitable pasturedairy used 59 percent less grain or concentrate toproduce a pound of milk than traditional dairies,while pasture dairies as a group used about14 percent less.
e pasture-based dairies raised their own grainand hay for use during the period from Novemberthrough March when pasture was unavailable inMinnesota. Because of their reliance on pasturerather than grain for much of the year, these opera-tions should be somewhat less sensitive to changesin grain prices. ey may therefore have been rela-tively more profitable in 2007. By raising their owngrain, these farms would not have to pay pricesabove the cost of production. Finally, these dairiesalso produced considerably less water pollutioncompared with grain grown for the conventionaldairy under conservation tillage.
A recent meta-analysis compared the relativeproductivity (yield) of organic and conventional an-imal production (Badgley et al. 2007).12 Animalproducts included beef, pork, chicken, milk, andeggs. e authors considered 22 studies from devel-oped countries, primarily in Europe, that typicallyproduce most of their animal products in CAFOs.Overall, organic productivity was about 3 percentbelow that of conventional animal operations.
24 Union of Concerned Scientists

Looking Beyond Narrowly De=ned Costs
As seen in the sections above, many alternative pro-duction methods can be as profitable as CAFOs (ormore so), but tend to be somewhat less efficient interms of feed conversion. In other words, more feedis oen needed to produce a unit of product (meat,milk, or eggs) compared with CAFOs. But theseanalyses do not take the costs of externalities intoaccount. Doing so is a complicated task; what fol-lows merely scratches the surface.
First, alternatives are oen less reliant on grainproduction—itself a system of questionable sustain-ability under prevalent farming practices. Althoughthis topic is beyond the scope of this report, grainproduction is a major contributor not only to soildegradation, but also to the pollution of aquaticecosystems that are important sources of food(Tilman et al. 2002). Less than half of the syntheticfertilizer applied to feed crops is utilized, with muchof the rest contributing to water pollution. Some isconverted into nitrous oxide (Tilman et al. 2002), anextremely potent heat-trapping gas that contributesto global warming.
e costs of the damage caused by crop exter-nalities may decrease when alternative livestockproduction methods substitute pasture and peren-nial forages for grains. Properly maintained peren-nial pasture builds soil, protects water quality byreducing nutrient runoff and leaching, and capturescarbon dioxide—the heat-trapping gas most respon-sible for global warming—at higher rates than graincrops, apparently even when compared with conser-vation-tillage systems used with soybeans or corn(Russelle, Entz, and Franzluebbers 2007; Boodyet al. 2005). It is important to keep in mind, how-ever, that overgrazed or otherwise poorly main-tained pasture can also create substantialexternalities in the form of land degradation andwater pollution (Russelle, Entz, and Franzluebbers2007; Hubbard, Newton, and Hill 2005).
In addition, animals produced on pasture havebeen estimated to produce almost 10 times less am-monia than confined livestock (Anderson, Strader,and Davidson 2003). Ammonia emissions from ma-
nure are a major source of water and air pollution,and form fine particulates that can cause respiratoryailments. A summary of several research projects re-ports that grazing dairy cattle release an average of6.4 kg of ammonia per cow per year, with 10.5 per-cent lost to volatilization (the movement of ammo-nia from manure into the atmosphere as a gas),while dairy cattle in confinement produced 15.5 kgper cow per year, with 22 to 45 percent lost tovolatilization and another 13 percent lost duringspreading (Anderson et al. 2003). Pastured dairycattle thus produce about 0.67 kg of volatilized am-monia per year, while confined dairy cows releaseabout 5.4 to 9.0 kg per cow. According to these val-ues, confined dairy cows produce about 8 to 13times as much volatilized ammonia per cow as pas-tured dairy cattle.
Confined dairy cows fed a diet primarily ofgrain typically produce more milk per cow thangrazing dairy cows. However, even when calculatedon a per-milk-unit basis (assuming 30 percenthigher milk production for confined cows), con-fined cows produce about six to nine times morevolatilized ammonia than pastured cows.
Integration of animal and crop agriculture pro-vided by CAFO alternatives generally benefits bothtypes of farming and the environment. An inte-grated system in Minnesota that tested two differentwatersheds found that phosphorus in streams wasreduced by about 70 percent, nitrogen by 51 to 74percent, and sediment by 35 to 84 percent (Boodyet al. 2005). A model integrated regional livestockand crop system in Iowa, with animals in close-enough proximity to crops or pasture to replacesynthetic nitrogen fertilizer with manure, and wherepasture replaced some of the corn and soybeans,could produce livestock with environmental benefitssuch as reduced water pollution (Burkart et al.2005). In addition, the number of finished hogs inthis system could actually increase from the current940,479 head to 7,566,400 within the study area (awatershed). ere is clearly a major advantage inlinking livestock to crops, which can be readilyachieved by relocating livestock near crops.
CAFOs Uncovered 25
Impact on global warmingOne important externality of livestock productionis the emission of heat-trapping gases such asmethane. Cattle are a major source of methane,which is produced during both the fermentation offeed in the animal’s gut and the anaerobic fermenta-tion of manure in CAFO lagoons and other manureholding structures.
Cows that feed on pasture or forage producemore methane during digestion than grain-fed cows(Clemens and Ahlgrimm 2001). ough this may bereduced substantially by optimizing productivitythrough MIRG (DeRamus et al. 2003), it is not clearthat methane levels can be reduced to those ofgrain-fed cattle.
Production of the heat-trapping gas nitrousoxide from the breakdown of fertilizer used to pro-duce grain must also be weighed against the pro-duction of nitrous oxide from manure produced byCAFOs and their alternatives. erefore the net ef-fect on global warming pollution from pasture- ver-sus grain-fed livestock is unclear (Liebig et al. 2005).
It should be noted, however, that althoughmethane production may be about 125 percenthigher on pasture operations compared withCAFOs (Boody et al. 2005), the atmospheric impactwould likely be offset by higher capture of carbondioxide (Russelle, Entz, and Franzluebbers 2007).e results of several studies suggest that perennialpasture may capture about 0.9 metric ton of carbondioxide per hectare per year, while commoditycrops in Minnesota—even when grown under con-servation tillage—capture only one-third thatamount (Boody et al. 2005).
On balance, it appears likely that alternativeproduction systems that reduce the size and geo-graphic density of animal feeding operations havesubstantial benefits compared with CAFOs. It is notpossible at this time to determine whether lowerglobal warming pollution is one of those benefits,but alternative integrated animal and crop produc-tion systems will likely substantially reduce otherexternalities associated with CAFOs.
Conclusions
e small sample of studies discussed above cannotbe used to draw sharp conclusions about the pro-ductivity of alternative animal production methodscompared with CAFOs. Many variables can affectboth productivity and profitability, including man-agement capability, geography (e.g., regional cli-mate), and availability of processors and markets.Some important parameters also change over timeas research develops new innovations and breeds oras the prices of grain, energy, and other inputschange.
Despite these data limitations, however, thisoverview of alternative animal production and his-toric trends related to animal feeding operations al-lows us to draw some broad conclusions aboutCAFOs and alternative animal production meth-ods. First, although CAFOs oen exhibit someminor economies of scale, superior managementmay oen be more important in determining pro-duction efficiency in at least some sectors. Well-managed smaller to medium-sized swineoperations, for example, are as economically effi-cient as large CAFOs. Alternative systems can oenproduce animal products cost-effectively, and at anet profit to producers.
Second, the largest obstacle facing alternativesis not the inability to produce animals efficiently,but the effects of processor-related market power.Challenges in this regard (vertically coordinatedproduction contracts between CAFOs and proces-sors, elimination of smaller processors, and shrink-ing of efficient spot markets in some areas) couldhamper smaller and alternative producers evenwhen they may otherwise produce animals in acost-effective and profitable manner.
Finally, alternatives that integrate animal andcrop production can provide benefits to farms andsociety alike, in the form of higher profitability andreduced externalities. Linking manure to croppingsystems, for example, creates major economic, so-cial, and environmental benefits for an entire
26 Union of Concerned Scientists

region. Considering the relatively limited researchcurrently available on ways to improve alternativeanimal farming systems, further research is neededto expand these benefits.
CAFOs Uncovered 27


he price consumers pay for animal products atthe grocery store does not reflect all of the costs
society as a whole pays for these products. One ofthe important ways these costs are masked isthrough the provision of subsidies to CAFOs. Somesubsidies may go directly to CAFOs; others (so-called indirect or implicit subsidies) go to otherparts of the economy and are then passed on toCAFOs. ese indirect subsidies may easily go un-noticed by the general public, but are just as impor-tant to CAFOs in facilitating their operation andgrowth. Where subsidies go to CAFOs preferentiallyover other production systems, they provide an es-pecially important advantage.
In this chapter, several types of subsidies thathave been given to the CAFO industry are exam-ined. One particularly substantial indirect subsidyhas been payments made to commodity crop grow-ers, largely for corn and soybeans, which is passedon to the CAFO industry in the form of artificiallylow feed grain prices. ese low prices have largelybeen the result of the elimination of grain supplycontrols that were intended to keep prices at a rea-sonable level. is and other changes in federal farmlegislation have allowed the price of feed grains todrop below the cost of production in many years. Inresponse, lawmakers have compensated grain grow-ers for most of the difference between their cost ofproduction and low market prices. Such indirectcrop subsidies have amounted to a windfall of sev-eral billion dollars per year for the CAFO industry.
e second type of subsidy examined in this re-port is direct payments made to the CAFO industrythrough the federal Environmental Quality Incen-tives Program (EQIP), which provides about$100 million per year to CAFOs to reduce some of
the environmental damage they cause. EQIP subsi-dies, like commodity crop subsidies, are ultimatelypaid for by taxpayers, and could become increas-ingly important as pressure is applied to the indus-try to clean up its practices.
Although the reduction of harm caused byCAFOs is desirable, EQIP payments raise legitimatequestions about whether the public should under-write CAFOs in this way. is is especially impor-tant when considered in the context of alternativeproduction systems that are efficient, cause fewerproblems, and have greater societal benefits.
Subsidies are appropriate buffers for the agricul-tural sector against the uncertainties of nature andprice dips due to overproduction, and they encour-age conservation and technological innovation.However, it is essential that subsidies also encourageand support desirable agricultural practices.
How Crop Subsidies Have Propped Up CAFOs
Livestock raised in confinement eat an enormousamount of corn and soybeans. Grain and animalproduction (and their respective costs) are thereforeinseparable when evaluating CAFO production.Over the last 80 years or so, U.S. farm policy hassubsidized the production of commodity crops suchas corn and soybeans in a variety of ways; currently,some payments are made to commodity farmers re-gardless of market prices or production costs. Herewe examine whether these subsidies have con-tributed to the growth of CAFOs, which are the pri-mary users of these crops.
A majority of the two most widely cultivatedcrops in the United States, corn and soybeans, is fedto livestock. In 2007, corn was grown on about
CAFOs Uncovered 29
C h a p t e r 2
DIRECT AND INDIRECT SUBSIDIES TO CAFOs
T
93 million acres and soybeans on about 64 millionacres. Alfalfa is grown for livestock forage on about22 million acres (out of the 60 million total acres de-voted to various types of hay); sorghum (mostly forfeed) is grown on about 8 million acres and substan-tial amounts of corn stover (stalks and leaves) arealso used for cattle forage or silage.
By contrast, wheat (the crop most widely grownprimarily for food in the United States) is plantedon about 60 million acres, and rice on less than3 million acres. Most familiar vegetable and fruitcrops are grown on even smaller acreages. For ex-ample, potatoes are grown on about 1.1 millionacres, tomatoes on about 425,000 acres, apples onabout 360,000 acres, lettuce on about 310,000 acres,and carrots on about 100,000 acres (NASS 2008).
e tremendous amount of corn and soybeansgrown for animal feed reflects the huge amount ofanimal production in the United States.13 Feed graincosts make up a large proportion of the cost of rais-ing animals in CAFOs: corn and soybeans generallymake up about 50 to 60 percent of the cost of pro-ducing chickens, eggs, and pork, and somewhat lessfor dairy and beef. Because cows can efficiently di-gest the cellulose that comprises most of a plant’sstalks and leaves, cattle could survive on those partsof crops rather than on kernels or beans. However,in CAFOs a cow’s diet is largely composed of grain,which has high caloric or protein content, can beeasily transported to the animals compared withbulkier forages, and is relatively cheap.
Because of the close connection between cropprices and CAFO costs, it is important to under-stand the forces that determine grain prices in theUnited States. Federal government policy, for one,has a significant effect on the price of corn, soy-beans, and a few other crops. e government hasimplemented various programs under Title I of thefarm bill to buffer farmers against loss (such aslosses resulting from farmers’ tendency to overpro-
duce commodity crops, leading to crop prices thatare oen below the cost of production). Farmersalso tend to accept lower market prices because theyare not as economically concentrated as farm inputindustries or food processors and retailers, and theircommodities are perishable.
e farm bill has been reenacted and modifiedapproximately every five years since the 1930s. Priorto the 1980s, its commodity programs focused pri-marily on controlling the supply and price of thecovered crops. Such policies have included govern-ment purchase of grain surpluses and the transfer ofgrain acreage into government-supported conserva-tion set-aside and reserve programs. Policies di-rected at controlling the supply of grain have thegeneral effect of keeping the market price high(above the cost of production), thereby allowingfarmers to make a profit (Ray, De La Torre Ugarte,and Tiller 2003). ough price supports and supplycontrols from farm bills prior to 1996 could onlymoderate rather than completely prevent below-costproduction, they nonetheless had a substantial im-pact on prices.14
Since the 1980s, and especially since 1996, Title Iprograms have moved away from controlling thesupply or price of commodity crops (Ray, De LaTorre Ugarte, and Tiller 2003). e newer programssupport commodity crop farmers with disasteremergency payments, marketing loan gains, andloan deficiency payments when the cost of produc-tion exceeds the crop price. Until the past two yearsof rising market prices, these programs compen-sated for much of the difference between productioncosts and low prices. As a consequence, the price ofgrains was allowed to fall as the crops were overpro-duced. Between the passage of the 1996 farm billand 2005, for example, corn prices dropped 32 per-cent and soybean prices fell 21 percent, while cornproduction increased by 28 percent and soybeanproduction rose 42 percent (ERS 2005). One study
30 Union of Concerned Scientists
13 It is also a reflection of the fact that it takes several pounds of grain to produce one pound of animal product. is is an extremely important issue in termsof agricultural sustainability, but is beyond the scope of this report.14 e tendency toward low commodity prices is primarily a function of farm economics, and only partially altered by subsidies (Ray, De La Torre Ugarte,and Tiller 2003).
found that the price of corn following passage of the1996 farm bill averaged 23 percent below the cost ofproduction, and soybean prices averaged 15 percentbelow cost. By contrast, corn prices averaged 17 per-cent below the cost of production during the 11years prior to the 1996 farm bill, and soybean pricesaveraged 5 percent below cost (Starmer, Witteman,and Wise 2006).
In essence, Title I payments to commodity cropfarmers compensate farmers when the price of cornand soybeans falls below their production costs.Without these subsidies, commodity crop farmerswould not be able to stay in business indefinitelyunder such conditions. However, as will be discussedbelow, these subsidies do not always entirely com-pensate grain farmers for the cost of production.15
If crop subsidies were not in place, CAFO oper-ators would have paid more for the grain vital totheir operations. e recent surge in demand forethanol has dramatically increased the price of corn,which is now above the cost of production. Some ofthe possible implications for future CAFO produc-tion are discussed below, but from a historical per-spective, low grain prices have encouraged thegrowth and development of CAFOs over the pastseveral decades. e amount of Title I subsidiesgiven to CAFOs is reflected in the difference be-tween the production costs of corn and soybeansand the prices paid by CAFOs, as well as the per-centage of each CAFO’s production costs thesegrains comprise.
Indirect Subsidies to Poultry CAFOs
Studies have determined the indirect subsidies givento broiler chicken CAFOs (Starmer and Wise 2007a;Starmer, Witteman, and Wise 2006). is workshows that between 1986 and 1996, the broiler in-dustry’s operating costs were reduced by an averageof 6 percent below what they would have been if
prices reflected the actual cost of producing cornand soybeans in the United States. Aer passage ofthe 1996 farm bill, the indirect subsidy to CAFOsrose to 13 percent of the cost of production, orabout $1.25 billion per year. According to the EPA,there were about 1,632 broiler CAFOs as of 2003(EPA 2003), and these operations produce the largemajority of broilers. erefore, although a smalloverestimation, each of these CAFOs received anaverage of about $766,000 per year in subsidies.
e indirect subsidy for laying hens has beencalculated following the methods developed forbroilers (Starmer 2007; Starmer, Witteman, andWise 2006). As with broilers, processors rely almostexclusively on production contracts that specify in-puts such as feed (MacDonald et al. 2004). As withbroilers and hogs, the cost of these grains makes upabout 60 percent of the total production cost ofeggs. Standardized feeding practices allow general-izations to be made about feed data across the in-dustry: for example, Title I subsidies compensatedfor layer CAFOs’ feed costs by an average of 13 per-cent per year between 1997 and 2005. is resultedin an average of about $432 million per year for theindustry nationally. e EPA estimates that therewere 1,112 layer CAFOs in 2003, and calculationsbased on the average yearly subsidy for the layerCAFO industry arrive at an average subsidy for eachCAFO of about $388,000 per year.
Indirect Subsidies to Hog CAFOs
Hog CAFOs, like chicken CAFOs, are highly de-pendent on grain. One study (Starmer and Wise2007a) found that the indirect subsidy given to thelargest hog CAFOs (those with more than 5,000 ani-mals) averaged 15 percent of operating costs peryear between 1996 and 2005. is amounts to anaverage subsidy of about $652 million collectivelyper year.
CAFOs Uncovered 31
15 e data on commodity price and production costs are average values, so some farmers have made more than the cost of production, and others less. An-other factor in this equation is that many farmers now derive a substantial part of their incomes from off-farm work. erefore, non-farming income could helpprop up some money-losing farms. Other unprofitable farms have gone out of business. A detailed analysis of these issues is beyond the scope of this report.

e EPA definition of hog CAFOs used for thisreport includes operations of more than 2,500 ani-mals, but USDA data used to calculate the grainsubsidy for hog CAFOs do not include a size cate-gory that corresponds exactly to the EPA’s lowerlimit of 2,500 hogs. e calculations that come clos-est to the EPA category used in this report comefrom a study of hog operations larger than 2,000 an-imals (Starmer and Wise 2007a), which generallyuse production methods similar to larger CAFOs.16
is study found that the average indirect subsidyfor hog operations of 2,000 animals or moreamounted to more than $945 million per year since1997. In 2006, 2,910 operations containing morethan 2,000 pigs held 88 percent of U.S. hog inven-tory (NASS 2007). A rough estimate of the subsidyfor each large hog CAFO is therefore about$325,000 per operation per year.
Hog operation ownership data allow furtherbreakdown of savings by size of operation;17 for ex-ample, owners of operations totaling 50,000 or morehogs produced 54 percent of total U.S. hog inven-tory in 2006, or about 61 percent of the CAFO in-ventory. e largest CAFO owners thereforebenefited from about $576 million in subsidies forthe year. e 115 owners of operations with morethan 50,000 hogs each received an average subsidyof about $5.01 million for the year. By contrast, the1,690 owners of operations totaling between 2,000and 4,999 hogs held 10.8 percent of the CAFO in-ventory, and therefore averaged about $60,000 insubsidies per owner.
Indirect Subsidies to Beef and Dairy CAFOs
Grain makes up a smaller but still significant por-tion of the production costs of raising cattle—13 to17 percent of the costs of producing feedlot beef cat-tle. is industry’s overall production costs were re-
duced an average of about 5 percent per year overthe past 10 years due to indirect subsidies given tograin growers.
e composition of feed for dairy cows is lessuniform than other sectors, but remains a substan-tial cost of dairy production. Data from Iowa,Kansas, Ohio, and Wisconsin between 2002 and2003 show that feed represents between 38 and 43percent of production costs, of which corn repre-sents between 11 and 22 percent. erefore, if thetrue cost of production was paid for feed corn, totalproduction costs would be raised by about 4 to 7percent for these states, with the weighted averageover 6 percent (Starmer 2007).
Calculations for this report (Starmer 2007)using the same methods as for poultry and hogs(Starmer, Witteman, and Wise 2006) show that Title Icrop payments also provide large indirect subsidiesto beef and dairy CAFOs. Although the cost data fordairy CAFOs are limited and expected to vary byyear and region, we can arrive at a rough estimate ofthe indirect subsidies given to these operations.
USDA statistics do not include a category thatcorresponds exactly to the EPA definition of a dairyCAFO (700 or more animals). We therefore used theclosest USDA category—more than 500 cows—forour calculations. e annual national feed savingsfor such dairies, as extrapolated from Iowa, Kansas,Ohio, and Wisconsin, amounts to about $733 mil-lion per year. In 2006 there were 3,143 dairy opera-tions with 500 or more cows, accounting for 46.7percent of the U.S. inventory (NASS 2007). ere-fore, the average subsidy for each CAFO is roughlyestimated to have been about $233,000 per year.
As with hogs, the largest dairy CAFOs benefitmore than their smaller counterparts from the lowcost of grain. Confined operations of more than2,000 animals contained 21.6 percent of the U.S. in-ventory in 2006, or about 46 percent of dairy CAFOinventory. ere were 573 of these very large opera-
32 Union of Concerned Scientists
16 e entire class of hog operations containing 2,000 to 4,999 hogs comprises only 9.5 percent of hog production, according to NASS data for 2006.erefore, hog operations between 2,000 and 2,499 hogs likely produced less than 1.6 percent of hogs.17 A single owner may own multiple operations, and owners with the largest number of operations also maintain the largest operations in size.
tions nationally (NASS 2007), receiving an averagesubsidy of about $588,000 each per year. By con-trast, smaller CAFOs (700 to 999 cows) andmedium-sized AFOs (500 to 699 cows) collectivelycontained 12.6 percent of U.S. dairy cow inventory,or about 27 percent of dairy CAFO inventory. ese1,700 operations therefore benefited from an aver-age subsidy of about $116,000 each.
Data collected by the USDA on feedlot beef cat-tle are not as extensive as for other sectors, so datafrom several states have been used to approximatethe indirect subsidies paid to feedlot beef cattleCAFOs. As with the dairy industry, these calcula-tions must be understood to be a small sample ofthe costs and feed compositions that may occur invarious parts of the country. And unlike the data fordairy cattle, data from Iowa and Minnesota for feed-lot cattle span the longer period of 1997 to 2003.
Corn makes up a larger share of the feed costcompared with dairy cows (an average of 72 per-cent), but feed in general makes up a similar shareof the total production costs compared with dairycows (about 16 percent) and a smaller share com-pared with hogs or poultry. is is largely becausecalves (purchased by beef cattle feedlots), make up alarger share of beef cattle production costs than ani-mals in other sectors, and therefore grain makes upcorrespondingly less of the total cost of producingbeef cattle than dairy cows or other livestock. Ex-trapolated to national production levels, our calcu-lations find that the implicit subsidies for feedlotcattle CAFOs average about $500 million per year,or about 5 percent of total production costs per yearbetween 1997 and 2003.
According to the USDA, extremely large feed-lots now dominate beef cattle marketing. Feedlotssmaller than 1,000 animals sold only about 14 per-cent of beef cattle but made up almost 98 percent ofall feedlots (GIPSA 2002). Feedlots of 1,000 to32,000 animals sold about 22 percent of beef cattleand represented about 26 percent of beef CAFOs,thereby receiving an average subsidy of about$72,000 each. e 168 largest beef feedlots (over32,000 animals) sold more than 64 percent of feed-
lot cattle and represented about 74 percent of beefCAFOs (GIPSA 2002). ese huge operations re-ceived an average of about $2.2 million per feedlotin grain subsidies per year.
Indirect Subsidies across Sectors
In summary, commodity crop subsidies that com-pensate for low grain prices contributed about$34.74 billion between 1997 and 2005 to poultry,swine, beef, and dairy CAFOs (see also Starmer andWise 2007b). is amounts to about $3.86 billionper year, with the proviso that data for dairy cowsand beef cattle are limited by region and year, andtherefore nationwide averages over time are pro-vided for illustration purposes rather than as highlyaccurate values for these sectors. e data from thepreceding analyses are summarized in Table 5(p. 34).
Because of integration in the animal productsindustry, these savings are a boon to processors aswell as CAFOs. For example, the four largest broilercompanies saved approximately $5.6 billion from1997 to 2005, and the four largest swine processorssaved about $4.3 billion (Starmer and Wise 2007b).
Subsidies for Alternative Production Methods
It is useful to ask whether alternative methods ofproducing livestock have also benefited from Title Icrop subsidies. Have these subsidies favored CAFOsover other means of producing livestock that havefewer externalities? Diversified farms—those thatproduce both grain and livestock—are one alterna-tive to specialized CAFOs, which grow little or nograin.18 For example, national survey data (Boessen,Lawrence, and Grimes 2004) found that 94 percentof small hog producers grew corn and 90 percentgrew soybeans, while 84 percent of medium-sizedproducers grew corn and 80 percent grew soybeans.Fewer hog CAFOs grew corn (73 percent) and soy-beans (68 percent). ese data did not include asubcategory for the largest hog CAFOs, which couldhave indicated whether these very large operations
CAFOs Uncovered 33

also grow some of their own grain, and did not re-veal the percentage of feed grain produced on-farmin each size category.
Other data indicate that CAFOs have much lesscropland available, relative to the amount of ani-mals, compared with smaller operations (Kellogget al. 2000). Medium-sized operations of 150 to 300AU (animal units) had 0.17 AU per acre of croplandavailable to receive manure in 1997, while CAFOshad 1.7 AU per acre—or 10 times less land per ani-mal. Smaller and medium-sized diversified farmswould generally be expected to use all of the manureproduced by their animals, in an economically andenvironmentally favorable manner (provided theircropland is near the livestock operation).
Changes in the 1990 farm bill allowed farmersto retain the grain they produce but still receive loandeficiency payments. erefore, diversified farmscould benefit from Title I subsidies even if they re-tained their grain as feed for their own animalsrather than opting to sell it. However, grain subsi-dies do not necessarily entirely compensate for lowgrain prices. One study (Ray, De La Torre Ugarte,and Tiller 2003) found that, over a two-year period,Title I subsides usually did not fully compensatefarmers for the difference between production costsand grain prices, creating a “subsidy gap.” Even with
subsidies, returns for corn were 6 percent belowproduction costs for 2000 and 1 percent above pro-duction costs for 2001; soybean returns were 9 per-cent and 11 percent below production costs,respectively.
CAFOs that buy grain would not experiencethis subsidy gap because they would purchase grainat the low market price, while diversified farmerswould have to contend with production costs notentirely compensated by subsidies. Even though di-versified farms could benefit from crop subsidies,they would not receive as great a benefit as CAFOsthat purchase grain.
To illustrate the subsidy gap, our calculationsshow the lower feed cost for CAFOs compared withhog farmers who grew their own grain in 2000 and2001 (Table 6). Title I subsidies would thereforehave favored the development of CAFOs over diver-sified farms. It should also be noted that even withsubsidies for diversified farms that grow their owngrain, such farms may generally have produced thisgrain at a loss.
Indirect subsidies for pasture systemsTo the extent that alternative means of livestockproduction do not use subsidized grain, they wouldnot benefit from Title I crop subsidies. In particular,
34 Union of Concerned Scientists
18 e term “diversified farm” is used here in the very narrow sense of a farm that produces both grain and livestock. However, in other contexts, this termhas been used to define farms that produce many different crops as well as livestock. Such highly diverse farms oen have additional sustainability advantages.
Average Annual Average Annual Average Annual AverageSector Subsidy Subsidy per Subsidy per Reduction in
CAFO Large CAFO Cost of Production
Broilers $1.25 billion $766,000 na 13%
Dairy $733 million $233,000 $588,000 6%
Eggs $432 million $388,000 na 13%
Feedlot Beef $500 million $72,000 $2.20 million 5%
Swine $945 million $325,000 $5.01 million 15%
Total $3.86 billion
Table 5. Indirect Subsidies to the CAFO Industry, 1997–2005
na=not availableSOURCES: Starmer 2007; Starmer and Wise 2007a; Starmer, Witteman, and Wise 2006.
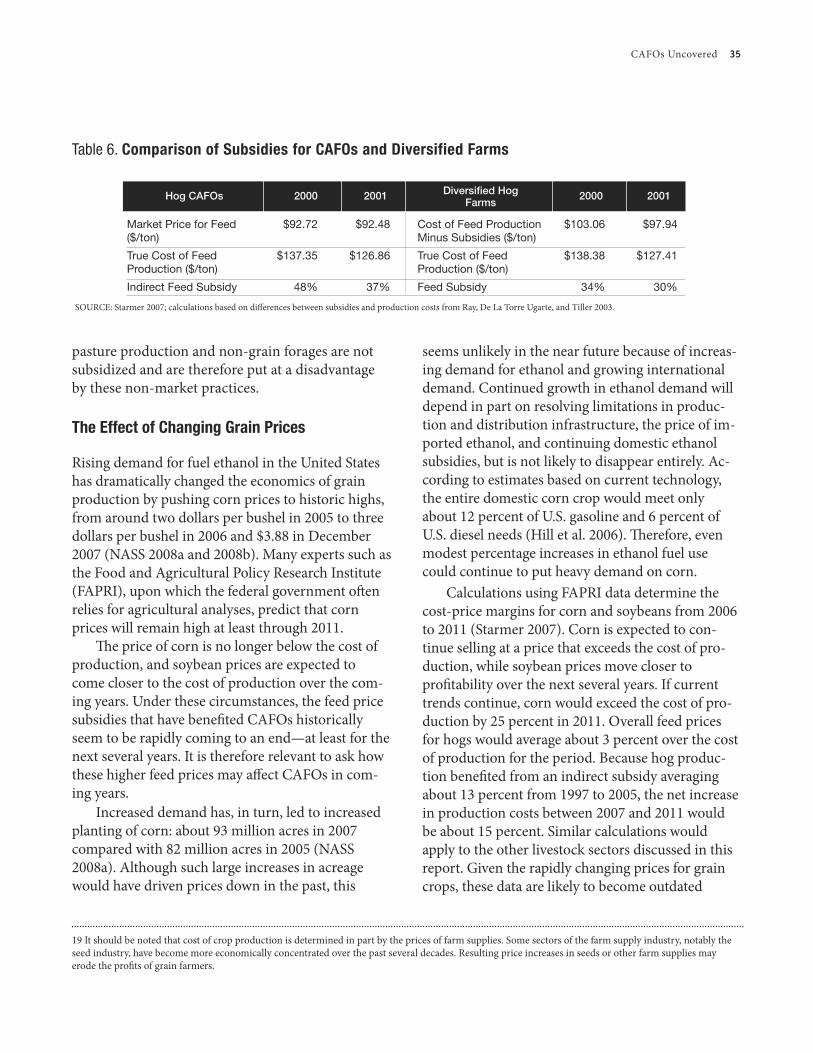
pasture production and non-grain forages are notsubsidized and are therefore put at a disadvantageby these non-market practices.
The Effect of Changing Grain Prices
Rising demand for fuel ethanol in the United Stateshas dramatically changed the economics of grainproduction by pushing corn prices to historic highs,from around two dollars per bushel in 2005 to threedollars per bushel in 2006 and $3.88 in December2007 (NASS 2008a and 2008b). Many experts such asthe Food and Agricultural Policy Research Institute(FAPRI), upon which the federal government oenrelies for agricultural analyses, predict that cornprices will remain high at least through 2011.
e price of corn is no longer below the cost ofproduction, and soybean prices are expected tocome closer to the cost of production over the com-ing years. Under these circumstances, the feed pricesubsidies that have benefited CAFOs historicallyseem to be rapidly coming to an end—at least for thenext several years. It is therefore relevant to ask howthese higher feed prices may affect CAFOs in com-ing years.
Increased demand has, in turn, led to increasedplanting of corn: about 93 million acres in 2007compared with 82 million acres in 2005 (NASS2008a). Although such large increases in acreagewould have driven prices down in the past, this
seems unlikely in the near future because of increas-ing demand for ethanol and growing internationaldemand. Continued growth in ethanol demand willdepend in part on resolving limitations in produc-tion and distribution infrastructure, the price of im-ported ethanol, and continuing domestic ethanolsubsidies, but is not likely to disappear entirely. Ac-cording to estimates based on current technology,the entire domestic corn crop would meet onlyabout 12 percent of U.S. gasoline and 6 percent ofU.S. diesel needs (Hill et al. 2006). erefore, evenmodest percentage increases in ethanol fuel usecould continue to put heavy demand on corn.
Calculations using FAPRI data determine thecost-price margins for corn and soybeans from 2006to 2011 (Starmer 2007). Corn is expected to con-tinue selling at a price that exceeds the cost of pro-duction, while soybean prices move closer toprofitability over the next several years. If currenttrends continue, corn would exceed the cost of pro-duction by 25 percent in 2011. Overall feed pricesfor hogs would average about 3 percent over the costof production for the period. Because hog produc-tion benefited from an indirect subsidy averagingabout 13 percent from 1997 to 2005, the net increasein production costs between 2007 and 2011 wouldbe about 15 percent. Similar calculations wouldapply to the other livestock sectors discussed in thisreport. Given the rapidly changing prices for graincrops, these data are likely to become outdated
CAFOs Uncovered 35
19 It should be noted that cost of crop production is determined in part by the prices of farm supplies. Some sectors of the farm supply industry, notably theseed industry, have become more economically concentrated over the past several decades. Resulting price increases in seeds or other farm supplies mayerode the profits of grain farmers.
Hog CAFOs 2000 2001 Diversi7ed Hog 2000 2001Farms
Market Price for Feed $92.72 $92.48 Cost of Feed Production $103.06 $97.94($/ton) Minus Subsidies ($/ton)
True Cost of Feed $137.35 $126.86 True Cost of Feed $138.38 $127.41Production ($/ton) Production ($/ton)
Indirect Feed Subsidy 48% 37% Feed Subsidy 34% 30%
Table 6. Comparison of Subsidies for CAFOs and Diversified Farms
SOURCE: Starmer 2007; calculations based on differences between subsidies and production costs from Ray, De La Torre Ugarte, and Tiller 2003.

quickly, but nonetheless illustrate that the indirectsubsidies of the past have largely disappeared.19
As the market price of corn or other feed grainsexceeds the cost of production, diversified farmsthat produce their own grain gain some economicadvantages. As noted in Table 6, specialized CAFOsbenefit more from crop subsidies than diversifiedfarms. Conversely, as grain prices rise, CAFOs loserelatively more of this benefit compared with diver-sified farms that grow their own grain. Rising grainprices allow diversified farms to avoid paying thedifference between the costs of production and thehigher price they would otherwise have to pay forfeed if they did not produce their own grain. Addi-tionally, production systems that use pasture andforage rely less on grain than CAFOs and may alsoacquire an economic advantage.
To the extent that the FAPRI projections are ful-filled or exceeded, CAFOs’ costs could rise substan-tially in coming years. e elimination of thesubsidy gap and a lower cost for growing ratherthan buying feed grain could eliminate some of theeconomic advantage that large hog and otherCAFOs currently maintain over diversifiedmedium-sized animal operations.
It is not clear, however, whether such a change inprofitability would result in substantial increases inalternative animal farming. As noted in Chapter 1,several alternative production methods includingwell-managed medium-sized AFOs are alreadyroughly cost-competitive with CAFOs, but oenhave difficulty gaining market access. Structural bar-riers to alternative animal production, such as thepreference of processors to contract with large pro-ducers, are not eliminated by increasing grain prices.e possible cost advantages that alternative produc-tion methods could acquire may not be dramaticenough to overcome these structural barriers, andpoint to the need for policies that will facilitate thegrowth of beneficial animal production methods.
The role of feed alternativesAnother consideration that may affect the feedcosts for CAFOs and other grain-feeding opera-
tions is the use of feed alternatives that may be lessexpensive than grain, such as the major by-productof the ethanol fermentation process: so-called drieddistillers grains with solubles (DDGS). DDGS hasconsiderable nutritional value, is enriched in pro-tein content compared with corn, and may be con-siderably less expensive under some circumstances.Most of the starch, the readily available carbohy-drate source in corn (and the main source of easilydigestible calories for livestock), is converted intoethanol and thereby removed from the grain. eoverall nutrient content, however, is concentratedin DDGS compared with corn, and fiber digestibil-ity is increased, compensating in part for loststarch.
Several factors currently limit the use of DDGSas a substitute for corn and other grains. A recenthog-finishing study showed that although a dietwith 10 percent DDGS provided good perform-ance, diets that included 20 to 30 percent DDGS re-duced daily weight gain (Whitney et al. 2006).Although feed costs were lowered compared withcorn priced at two to four dollars per bushel, thisdid not compensate for the lower weight gain, mak-ing DDGS economical only at the 10 percent feedlevel. erefore, the study authors recommendedthat DDGS should make up less than 20 percent ofa hog-finishing diet.
Similarly, recent research on broilers demon-strated that substituting DDGS for 15 percent ofgrain did not reduce the weight or quality of thechickens, but 30 percent DDGS adversely affectedgrowth rates even when alternating with 0 percentDDGS on a weekly basis (Wang et al. 2007). Cattlecan utilize greater concentrations of DDGS in theirfeed, with dairy cows using about 20 percent andbeef cows about 30 percent or more (Hicks 2007;Schingoethe 2006).
A second limitation of DDGS is that it containsconsiderable moisture. is greatly limits storagetime due to spoilage, and increases transportationcosts compared with dry grains. DDGS can bedried and formed into pellets, but drying adds ex-pense and uses energy. For these reasons, DDGS is
36 Union of Concerned Scientists

currently most feasible—to the extent they can beused—for cattle located close to CAFOs.
Finally, major changes in livestock diet mayhave unanticipated consequences. Recent work indi-cates that beef cattle fed 25 percent DDGS may pro-duce significantly higher levels of Escherichia coliO157 than beef cattle fed a conventional diet (Jacobet al. 2007). Increased levels of this serious food-borne pathogen would be an undesirable side effectof using DDGS, counteracting the benefit of lowerproduction costs with another potential publichealth threat.
Summary of Indirect Subsidies to CAFOs
Title I farm bill crop subsidies have provided hugeindirect subsidies to CAFOs: estimated at $3.8 bil-lion a year over the eight-year period from 1997 to2005 (Starmer 2007; Starmer and Wise 2007b). isnot only makes CAFOs appear more economicallyefficient than they actually are, but also givesCAFOs an advantage over alternative means of pro-ducing animal products that do not benefit (or ben-efit less) from these subsidies.
Rising grain costs driven by corn ethanol de-mand have made such alternatives more favorableeconomically, but structural barriers may prevent orslow the ability of alternatives to penetrate the mar-ket. Alternative feeds for CAFOs, especially DDGSproduced in large quantities as an ethanol by-prod-uct, currently have several limitations that preventthem from displacing more than a small to moder-ate amount of corn feed.
Direct Subsidies to CAFOs
In addition to the indirect subsidies CAFOs receivein the form of crop support and lack of accountabil-ity for externalities, direct government subsidiesalso encourage the proliferation of CAFOs. Wheredirect subsidies favor CAFOs over other ways ofraising livestock, they may also discourage other-wise viable alternatives. At the national level, per-haps the largest single direct subsidy to CAFOs is
the Environmental Quality Incentives Program(EQIP), originally intended to help small andmedium-sized livestock farms address pollution is-sues. We examine EQIP in some detail, but it shouldbe kept in mind that many similar initiatives at thestate level may collectively contribute substantial ad-ditional subsidies to CAFOs.
EQIP originated as part of the 1985 farm billand was renewed in all subsequent farm bills includ-ing the 2002 version. e intent of the program wasto provide subsidies and incentives that would helpboth crop and livestock farmers prevent environ-mental harm. In the case of livestock operations,CAFOs (defined as operations with 1,000 AU ormore) were specifically excluded from the earlierversions of the program, which focused on pasture-based animal farms and other smaller operationsthat may have difficulty acquiring the funds neededto implement pollution control. e program wasrelatively modest at the time; for example, the ver-sion passed in 1996 allocated a total of $200 millionper year in federal funding.
In 2002, however, the program’s emphasis waschanged dramatically, making CAFOs a majorfunding recipient. e upper cap for contracts withindividual farms was raised dramatically from$50,000 to $450,000 per project, and total programfunding rose from $400 million in 2002 to a pro-jected $1.36 billion in 2007 (NRCS 2003).
At the same time, the program’s regulatory lan-guage mandates that 60 percent of EQIP fundingshould be devoted to animal farming, ensuring alarge amount of funds are available for these opera-tions (NRCS 2003). ough the language does notspecifically base funding on operation size (NRCS2003), priorities are described that favor projects ca-pable of achieving the greatest reduction in environ-mental degradation (which favors CAFOs). In awhite paper prepared prior to finalizing the 2002program, the USDA’s Natural Resources Conserva-tion Service (NRCS) explicitly suggested that be-cause similar amounts of effort and cost are neededto implement each EQIP contract, more benefitmight be garnered by allocating funds to large
CAFOs Uncovered 37
CAFOs rather than a greater number of smalleroperations (NRCS 2002).
e new EQIP regulation prioritizes activitiesthat only CAFOs typically have the need to pursue,such as improvement of waste storage facilities,comprehensive nutrient management plans, andtransportation of manure tied to environmentallyand agronomically sound crop application rates. eexplicit rationale provided for this ranking is thatgreater environmental improvement can beachieved by alleviating CAFO-related problemsthan pasture-related problems.
EQIP funding also favors CAFOs by holding thefarming operation responsible for a portion of theproject costs; the share of costs supplied by EQIPtypically stops at 65 percent. While remediation asso-ciated with several CAFO waste management meth-ods is oen funded at the program maximum of 75percent of the total project cost, EQIP recommends amaximum funding level for pasture-based practicesof only 55 percent (NRCS 2003). is means thatpasture-based farmers can expect to pay for relativelymore of an EQIP project themselves than CAFOowners. is may discourage some pasture-basedfarmers from applying for EQIP funds, thereby re-ducing CAFOs’ competition for EQIP funds.
e prioritizing of applications seeking EQIPfunds is important because the total funds availableare greatly exceeded by the demand. Most EQIP ap-plications therefore remain unfunded.
Estimating EQIP subsidies to CAFOse most straightforward way to determine whetherCAFOs are now favored in EQIP funding oversmaller and alternative operations would be a directcomparison of disbursements based on farm sizeand type and the practice addressed by the EQIP al-location. However, such data do not appear to bereadily available at the state or national level. Be-cause of this lack of data, we cannot determine ei-ther how great the subsidizing of CAFOs has beenor the relative amount of subsidizing compared withother types of animal farming operations. Despitethis limitation, it is clear that the relative subsidy to
CAFOs compared with other animal operationsmust be considerably higher than in previous farmbills, because CAFOs were formerly excludedaltogether.
A rough approximation of the national CAFOsubsidy can be made using the recommendationsmade by the NRCS in finalizing the EQIP rule forthe 2002 farm bill. e NRCS estimated at the timethat approximately $563 million, or 12.5 percent ofthe total funding, would go to CAFOs over a five-year period (NRCS 2003), an average of about$94 million per year. Another approach is to con-sider that 60 percent of EQIP funding is slated foranimal farming, and 25 percent of that allocation isintended for CAFOs (NRCS 2003). at means15 percent of EQIP funding would go to CAFOs—about $676 million, or an average of $113 millionper year.
It is not possible to clearly determine which ap-proach is more accurate, due to a lack of appropriatedata collection that would distinguish allocations bysize and type of operation. Based on rankings favor-ing incentives to CAFOs, these values might be ex-pected to be a minimum allocation. is amountcould also include livestock such as turkeys andsheep that are not evaluated in this report, but pres-ent similar concerns as other CAFOs.
In 2006, about $152 million was allocated ex-plicitly for confined livestock operations, whileabout $85 million was allocated to unconfined oper-ations (Figure 3, p. 43). In addition, about $247 mil-lion was allocated for “undistinguishable” practices(i.e., those that could apply to either confined or un-confined animal operations); the amount allocatedto each type of operation is unknown. However, ifwe assume that the distribution between confinedand unconfined operations in this category is thesame as with the known disbursements, some esti-mate of the additional amount going to CAFOs canbe calculated.
In the known categories, about 64 percent offunding went to confinement operations and 36 per-cent to unconfined operations. Using this same pro-portion for the undistinguishable category, another
38 Union of Concerned Scientists
$158 million would have been disbursed to confine-ment operations, for a total of about $310 million. If25 percent of this total went to CAFOs, these opera-tions would have received about $77.5 million in2006. However, as noted above, there are reasons tobelieve that CAFOs may have actually received aconsiderably higher percentage of the funds.
For 2007, the total EQIP disbursement was pro-jected to be $1.3 billion (NRCS 2003). If 60 percentof this amount went to animal agriculture, and 64percent of that went to confined operations, and 25percent of confinement funds went to CAFOs, thenthe expected CAFO subsidy would have been$125 million in 2007. (e uncertainties in thesecalculations due to a lack of public data show thatbetter national accounting of CAFO fund distribu-tion based on operation type, size, and use isneeded.)
CAFOs first became eligible for EQIP funds atthe same time as the Clean Water Act was expandedto cover CAFO pollution. EQIP subsidies thereforecame at a fortuitous time for CAFOs, which werefacing new manure management requirements.
Each state determines how it will distribute fed-eral EQIP funds, and maintains online informationabout its implementation of EQIP programs. Statesoen provide details on the practices for whichEQIP funds are allocated and the amount of the dis-bursements. Although the size and types of opera-tions are not revealed, some practices that arelargely or exclusively limited to CAFOs, CAFOs andAFOs combined, or pasture-based operations allowus to draw inferences about EQIP disbursements.For example, manure transportation subsidies areunlikely to apply to pasture-based operations andare most oen important for CAFOs. Several of theEQIP programs of major CAFO states are brieflydiscussed below.
EQIP subsidies in CaliforniaAs shown in Figure 3 (p. 43), dairy operations re-ceive the largest share of federal EQIP subsidies forconfined animal operations (42 percent). Californiahas more dairy cows and CAFOs than any other
state, and therefore likely receives a substantial pro-portion of these funds. In 2007, a California EQIPprogram for waste storage and alternative wastetreatment practices split the share of costs betweenAFOs larger and smaller than 300 AU. e programspecifies that most of the funds would be distributedto those AFOs below 300 AU (smaller to medium-sized operations).
On the other hand, a California EQIP waterquality initiative is directed at animal operationsfacing new state and federal waste permit require-ments. Changes in the federal Clean Water Act re-quiring permits and comprehensive nutrientmanagement plans are largely specific to CAFOs(more than 700 dairy cows) rather than smallerAFOs or pasture-based animal farms. is waterquality initiative may therefore predominantly tar-get CAFOs, but state programs may affect the distri-bution of these subsidies because the states haveconsiderable authority in implementing EQIP. iswater quality initiative represents California’s largestEQIP budget item, at $10 million, or 21 percent ofthe budget (NRCS 2007b).
EQIP subsidies in Arkansas and GeorgiaArkansas and Georgia are the two states that pro-duce the most broiler chickens. Arkansas targeted25 percent of its 2008 EQIP funds for animal wastemanagement, and an additional 2 percent to “wastesystems closure” (NRCS 2008a). In 2007, Arkansasallocated $2.9 million to livestock waste manage-ment for water quality (NRCS 2007d). Arkansas alsooffered an incentive program subsidizing littertransfer to crop fields; this program may targetCAFOs because it requires applicants to document“excess manure produced on the farm.” Becausemany smaller or medium-sized farms usually haveenough of their own land to apply manure at appro-priate rates (Kellogg et al. 2000), most farms thatneed to transfer manure are likely to be CAFOs.
Georgia also implemented a pilot litter transferprogram for 2007–2008, funded by EQIP at up to$10 per ton and up to $10,000 per year per farm.Figure 4 (p. 44) shows the counties targeted in the
CAFOs Uncovered 39
program, with red designating those counties pro-ducing and contributing litter, and green designat-ing those counties receiving litter during the firstyear of the program. e program specifies that onlythese counties may receive subsidies. e distancebetween the nearest contributing and receivingcounties is close to 50 miles, while typical distancescould exceed 100 miles; since large distances are notusually required for manure transfer from smalleror medium-sized operations, we can infer that thisprogram may subsidize CAFOs more than small tomedium-sized operations. ese distances wouldalso have a substantial impact on an operation’stransportation costs and energy use.
Aer the first year of the program, additionalmanure-receiving counties were added and countieswere prioritized by a point system. A few moderate-priority counties closer to manure sources wereadded, but most high-priority manure-receivingcounties remain in central Georgia.
EQIP subsidies in Iowa and North CarolinaIowa and North Carolina are the two states withthe most swine CAFOs. Requirements for EQIPfunding in Iowa give considerable weight toCAFOs; in 2008, for example, several of the state’shighest-ranked eligibility criteria pertained to con-cerns about the animal waste produced by CAFOs,including “Surface and subsurface water quality re-lated to the presence of excessive nutrients and or-ganics related to livestock production byconcentrated animal feeding operation’s (CAFO’s)[sic] on open feedlots” (NRCS 2008b). One of thefour major criteria used for disbursement of fundsfavors those counties with the most livestock.
In North Carolina, animal farming practicesclearly pertaining to AFOs and CAFOs comprise alarge proportion of EQIP funding. Allocations forwaste storage facilities, for example, amounted to$4.5 million in 2007 (30 percent of total alloca-tions), compared with $2.9 million in 2002. The2007 amount is at least three times larger than thenext largest categories of fencing, composting, andclosure of waste impoundments, which each repre-
sented about 6 to 10 percent of allocations(NRCS 2008c).
e state paid almost $1 million in 2007 to closewaste storage facilities, which were oen abandoned(NRCS 2008c). Disbursement data do not typicallymention operation size, but the data on waste stor-age facilities show dramatically increasing amountsper operation since 2001. In that year, the averagesubsidy was about $10,000 per unit; by 2007 it hadgrown to about $36,000 per unit, favoring largeroperations.
A new EQIP program to be launched in NorthCarolina in 2008, the ground and surface water con-servation supplement, will be exclusively allocatedto operations that raise confined swine. Contractswill be capped at $10,000 each.
Summary of Direct CAFO Subsidies Under EQIP
EQIP changed in 2002 from a program specificallyaimed at smaller farming operations to one that in-cluded—and favored—CAFOs. is represents a sig-nificant change of emphasis from the first 17 years ofthe program, and provides CAFOs with a new com-petitive advantage. In addition, because the programhas grown substantially in total available funding,the actual subsidies are more than six times largerthan they were seven years ago. In other words, moremoney is going to support CAFOs now than smallerfarms received a decade ago (although a substantialamount of small-farm support likely remains).
Overall, EQIP CAFO subsidies for the pastseveral years were likely to have totaled about$100 million or more per year, although it must benoted that this can only serve as a very rough esti-mate because disbursement data by operation sizeare not readily available. Because of growing con-cern about the environmental impact of CAFOs (asreflected in new Clean Water Act provisions re-cently directed at CAFO pollution), data should becollected and made public based on operation sizeand type.
40 Union of Concerned Scientists

aising livestock and poultry can cause substan-tial harm to people and the environment. As
discussed in Chapter 1, the costs associated withthis harm (which are not included in the costs ofproduction) are called externalities.
Nutrients from manure can become externali-ties by entering the air via volatilization (Walkeret al. 2000) or by entering ground or surface water(Burkholder et al. 2007; Mallin and Cahoon 2003).Large waste spills from CAFOs have been docu-mented (Mallin 2000), and when hundreds of thou-sands or millions of gallons of animal waste spillinto a stream, river, or estuary, a series of cascadingeffects results in externalities such as the death ofthousands of fish, expenditure of many hours bystate personnel to assess the damages, closure oflocal marinas and recreational facilities due to con-tamination by pathogenic microbes, lost work dayscaused by illness, closure of downstream shellfishbeds, and negative effects on the local food web(such as the death of aquatic organisms that otheranimals depend on for food).
Typically the CAFO operator will be assessed arelatively small fine for such a spill. us, taxpayersand local residents or businesspeople will be forcedto shoulder the cost of externalities by paying forfish restocking and overtime for regulatory person-nel, and by absorbing losses from fishing, shellfish-ing, and other water-related industries. Similarharmful effects can result from water pollutioncaused by the over-application of CAFO manure tofarmland, leakage from manure holding facilities,and the redeposition of airborne CAFO ammonia.
It is oen difficult to assign a monetary value toexternalities, but in some instances it is possible. Forexample, odors and noxious gas emissions are a
common adverse effect of high animal concentra-tions (Wing and Wolf 2000), but the resulting re-duction in quality of life for people living nearCAFOs is difficult to quantify directly. However,these costs may be reflected in depressed residentialproperty values that have been quantified (Weida2004). In this chapter, both quantified and unquan-tified externalities will be considered.
Whether quantified or not, externalized costs areborne by society rather than the industry that causedthe damage. If the costs to prevent (or remediate) thedamage were instead borne by the industry, its costof production would increase and could be reflectedin the marketplace by higher prices. is could facil-itate competition by alternatives that do not causethese externalities. To the extent that the costs of ex-ternalities are avoided, they constitute a form of sub-sidy to the industry that caused them.
Below we discuss in detail several of the majorexternalized costs of CAFOs. In particular, costs tothe environment in the form of water and air pollu-tion are considered at length. One important con-sideration of nutrient pollution is the tradeoffbetween water and air pollution. Reducing waterpollution, if not done properly, can exacerbate airpollution and, ironically, fail to resolve water pollu-tion on a regional scale. is tradeoff has seriousimplications for nutrient management policies. Wealso discuss the harm from pathogens, especiallyantibiotic-resistant pathogens, and the harm torural communities.
For each topic, we describe the damage done byCAFOs and how we might estimate the monetarycosts associated with that damage. Although com-prehensive economic assessments of the monetarycosts are not available, efforts have been made to
CAFOs Uncovered 41
C h a p t e r 3
EXTERNALIZED COSTS OF CAFOs
R
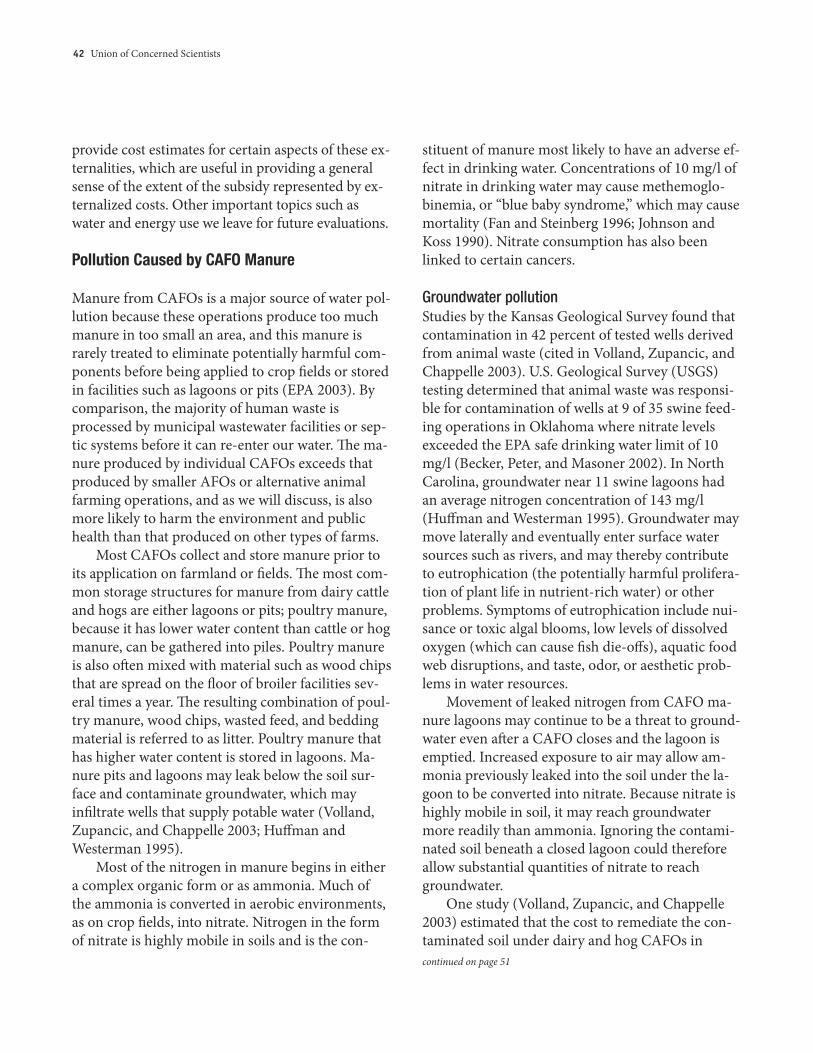
42 Union of Concerned Scientists
provide cost estimates for certain aspects of these ex-ternalities, which are useful in providing a generalsense of the extent of the subsidy represented by ex-ternalized costs. Other important topics such aswater and energy use we leave for future evaluations.
Pollution Caused by CAFO Manure
Manure from CAFOs is a major source of water pol-lution because these operations produce too muchmanure in too small an area, and this manure israrely treated to eliminate potentially harmful com-ponents before being applied to crop fields or storedin facilities such as lagoons or pits (EPA 2003). Bycomparison, the majority of human waste isprocessed by municipal wastewater facilities or sep-tic systems before it can re-enter our water. e ma-nure produced by individual CAFOs exceeds thatproduced by smaller AFOs or alternative animalfarming operations, and as we will discuss, is alsomore likely to harm the environment and publichealth than that produced on other types of farms.
Most CAFOs collect and store manure prior toits application on farmland or fields. e most com-mon storage structures for manure from dairy cattleand hogs are either lagoons or pits; poultry manure,because it has lower water content than cattle or hogmanure, can be gathered into piles. Poultry manureis also oen mixed with material such as wood chipsthat are spread on the floor of broiler facilities sev-eral times a year. e resulting combination of poul-try manure, wood chips, wasted feed, and beddingmaterial is referred to as litter. Poultry manure thathas higher water content is stored in lagoons. Ma-nure pits and lagoons may leak below the soil sur-face and contaminate groundwater, which mayinfiltrate wells that supply potable water (Volland,Zupancic, and Chappelle 2003; Huffman andWesterman 1995).
Most of the nitrogen in manure begins in eithera complex organic form or as ammonia. Much ofthe ammonia is converted in aerobic environments,as on crop fields, into nitrate. Nitrogen in the formof nitrate is highly mobile in soils and is the con-
stituent of manure most likely to have an adverse ef-fect in drinking water. Concentrations of 10 mg/l ofnitrate in drinking water may cause methemoglo-binemia, or “blue baby syndrome,” which may causemortality (Fan and Steinberg 1996; Johnson andKoss 1990). Nitrate consumption has also beenlinked to certain cancers.
Groundwater pollutionStudies by the Kansas Geological Survey found thatcontamination in 42 percent of tested wells derivedfrom animal waste (cited in Volland, Zupancic, andChappelle 2003). U.S. Geological Survey (USGS)testing determined that animal waste was responsi-ble for contamination of wells at 9 of 35 swine feed-ing operations in Oklahoma where nitrate levelsexceeded the EPA safe drinking water limit of 10mg/l (Becker, Peter, and Masoner 2002). In NorthCarolina, groundwater near 11 swine lagoons hadan average nitrogen concentration of 143 mg/l(Huffman and Westerman 1995). Groundwater maymove laterally and eventually enter surface watersources such as rivers, and may thereby contributeto eutrophication (the potentially harmful prolifera-tion of plant life in nutrient-rich water) or otherproblems. Symptoms of eutrophication include nui-sance or toxic algal blooms, low levels of dissolvedoxygen (which can cause fish die-offs), aquatic foodweb disruptions, and taste, odor, or aesthetic prob-lems in water resources.
Movement of leaked nitrogen from CAFO ma-nure lagoons may continue to be a threat to ground-water even aer a CAFO closes and the lagoon isemptied. Increased exposure to air may allow am-monia previously leaked into the soil under the la-goon to be converted into nitrate. Because nitrate ishighly mobile in soil, it may reach groundwatermore readily than ammonia. Ignoring the contami-nated soil beneath a closed lagoon could thereforeallow substantial quantities of nitrate to reachgroundwater.
One study (Volland, Zupancic, and Chappelle2003) estimated that the cost to remediate the con-taminated soil under dairy and hog CAFOs incontinued on page 51

CAFOs Uncovered 43
Total Confined Unconfined Practices NumberLivestock Cost-Share Cost-Share Cost-Share Undistinguishable ofType Approved Approved Approved Cost-Share Approved Contracts
Sheep $6,552,097 $701,466 $2,246,764 $3,603,867 296
Beef $312,634,324 $43,062,776 $71,465,241 $198,106,306 17,605
Dairy $90,101,196 $62,284,196 $3,372,295 $24,444,705 1,951
Other $20,410,903 $3,198,336 $6,526,001 $10,686,566 1,118
Poultry $28,478,004 $23,036,577 $629,270 $4,812,157 1,252
Swine $25,570,331 $20,116,235 $327,272 $5,126,824 658
Subtotal $483,746,854 $152,399,586 $84,566,843 $246,780,425 22,880
Non-Livestock $304,220,696 $0 $0 $0 18,310
Total $787,967,550 $152,399,586 $84,566,843 $246,780,425 41,190
Figure 3. Federal EQIP Funding for 2006
National FY2006 Confined Livestock Cost-Share Approved
Swine 13%
Poultry 15%
Other 2%
Dairy 42%
Beef 28%
Sheep 0%
National FY2006 Unconfined Livestock Cost-Share Approved
Dairy 4%
Swine 0%
Other 8% Sheep 3%
Beef 84%
Poultry 1%
SOURCE: NRCS 2007.
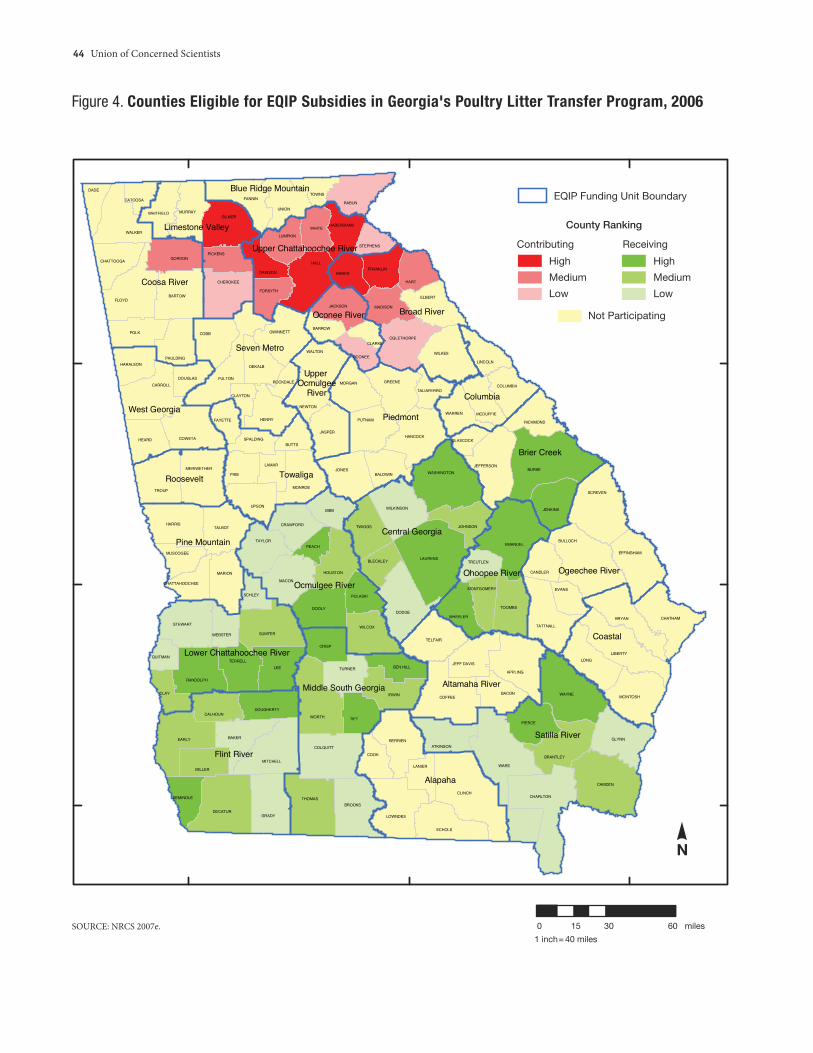
44 Union of Concerned Scientists
WARE
BURKE
CLINCH
LEE
WAYNE
LAURENS
HALL
CAMDEN
EARLY
FLOYD
WORTH
COFFEE
BULLOCH
LONG
EMANUEL
CHARLTON
DODGE
SCREVEN
GLYNN
FULTON
BRYAN
LIBERTY
GRADY
THOMAS
DECATUR
TIFT
TROUP
WILKES
HARRIS
IRWIN
COBB
JONES
APPLING
POLK
SUMTER
BROOKS
DOOLY
GILMER
BIBB
COLQUITT
MACON
TELFAIR
RABUN
BARTOW
CARROLL
WALKER
FANNIN
MITCHELL
BERRIENBAKER
ECHOLS
UNION
CHATHAM
TALBOT
COWETA
LOWNDES
WASHINGTON
TATTNALLWILCOX
GREENE
ELBERT
PIKE
JASPERHANCOCK
TAYLOR
STEWART
HART
PIERCE
HENRY
MCINTOSH
CRISP
UPSON
MARION
JEFFERSON
TWIGGS
MONROE
TOOMBS
HEARD
PUTNAM
BRANTLEY
JENKINS
CLAY
EFFINGHAM
GWINNETT
BACON
WILKINSON
MURRAY
COOK
GORDON
MORGAN
MILLER
RANDOLPH
CHEROKEE
WALTON
HOUSTON
WHITE
TERRELL
MERIWETHER
JACKSON
TURNER
BANKS
DEKALB
ATKINSON
WARREN
LUMPKIN
OGLETHORPE
DADE
JOHNSON
NEWTON
PAULDING
MADISON
WHEELER
RICHMOND
LINCOLN
JEFF DAVIS
PULASKI
COLUMBIA
BALDWIN
BUTTS
CALHOUN
BEN HILL
CRAWFORD
LANIER
EVANS
LAMAR
FRANKLIN
WHITFIELD
PICKENS
DOUGHERTY
CANDLER
FORSYTH
MCDUFFIE
HARALSON
SEMINOLE
CHATTOOGA
DAWSON
TOWNS
FAYETTE
HABERSHAM
PEACH
OCONEE
WEBSTER
BLECKLEY
SCHLEY
DOUGLAS
SPALDING
TREUTLEN
MUSCOGEE
BARROW
QUITMAN
STEPHENS
MONTGOMERY
CATOOSA
TALIAFERROCLAYTON
CLARKE
CHATTAHOOCHEE
GLASCOCK
ROCKDALE
Alapaha
Satilla River
Brier Creek
Coastal
Flint River
Central Georgia
Roosevelt
Piedmont
Ohoopee River
Towaliga
Ogeechee River
Coosa River
Broad River
Seven Metro
Altamaha River
West Georgia
Pine Mountain
Middle South Georgia
Limestone Valley
Ocmulgee River
Oconee River
Blue Ridge Mountain
Columbia
Lower Chattahoochee River
UpperOcmulgeeRiver
Upper Chattahoochee River
Figure 4. Counties Eligible for EQIP Subsidies in Georgia's Poultry Litter Transfer Program, 2006
High
Medium
Low
Contributing
0 15 30 60 miles
1 inch=40 miles
EQIP Funding Unit Boundary
County Ranking
Not Participating
Receiving
High
Medium
Low
N
SOURCE: NRCS 2007e.

CAFOs Uncovered 45
#
##
#
#
##
#
#
#
##
##
#
#
#
#
#
#
#
#
#
#
#
##
#
#
#
#
##
#
#
##
#
#
#
#
#
#
#
#
#
#
#
#
#
#
#
##
#
#
#
#
#
#
#
#
#
##
#
#
#
# #
#
#
#
#
#
#
#
#
##
# #
#
#
#
#
#
#
#
#
#
##
#
#
#
##
##
#
#
#
#
#
#
###
#
#
#
#
#
#
#
##
#
#
#
#
#
#
#
##
#
#
#
#
#
#
#
#
#
#
#
##
#
#
#
#
#
#
##
#
#
Figure 5. Average Atmospheric Ammonium Ion Concentration, 1985–2002
1985–1987 1990–1992
1995–1997 2000–2002
SOURCE: NADP 2003.
0.10 0.15 0.20 0.25 0.30 0.35 0.40 0.45 0.50 0.55
Average Ammonium Ion Concentration as NH+ (mg/L)4
Figure 6. Wet Deposition of Ammonium Nitrogen, 2002
≤ 0.50.5-1.01.0-1.51.5-2.02.0-2.52.5-3.03.0-3.53.5-4.04.0-4.5>4.5
Ammonium as NH+
(kg/ha)4
##
#
#
#
#
#
#
#
#
2.2
2.7
2.3
1.2
1.90.8
1.4
2.4
3.5
3.9
1.0
1.6
1.9
0.1
2.7
1.11.1
2.0
4.6
4.9
2.9
2.12.3
4.0
1.9
2.0
2.5
1.4
1.1
0.4
3.0
3.1
4.6
1.6
0.6
1.1
4.4
2.8
0.8
0.9
3.2
0.6
1.1
0.7
3.8
2.9
2.3
2.2
1.5
1.5
1.7
3.0
3.3
3.5
2.5
2.5
2.1
0.8
2.1
2.0
1.9
3.62.4
2.22.8
0.1
0.6
0.8
0.2
1.4
0.9
0.5
0.5
1.0
0.6
1.6
1.3
0.6
1.5
1.2
1.8
1.2
1.7
1.3
1.2
1.9
3.2
1.4
4.4
4.4
0.70.3
3.6
3.0
3.2
4.9
3.2 3.8
4.0
3.4
3.3
4.63.6
4.12.4
2.1
1.9
1.7
1.6
1.63.9
3.73.8
7.2
3.42.1
3.42.0
4.6
6.1
2.3
3.1
1.0
0.8
0.7
0.9
2.7
2.2
1.9
4.72.4
1.9
3.3
2.0
4.0
2.2
2.8
0.7
0.4
3.5
5.1
2.45.5
2.23.3
3.4
2.2
3.0
3.93.4
3.2
3.6
2.9
3.6
0.2
0.30.2
0.81.0
3.53.8
3.7
2.3
1.4 3.0
2.0
3.42.6
1.4
1.7
1.71.4
2.0
0.6
0.7
1.9
2.9
3.7
3.4
0.6
0.9
4.4
4.9
4.6
5.7
4.8 3.9
2.7
0.8
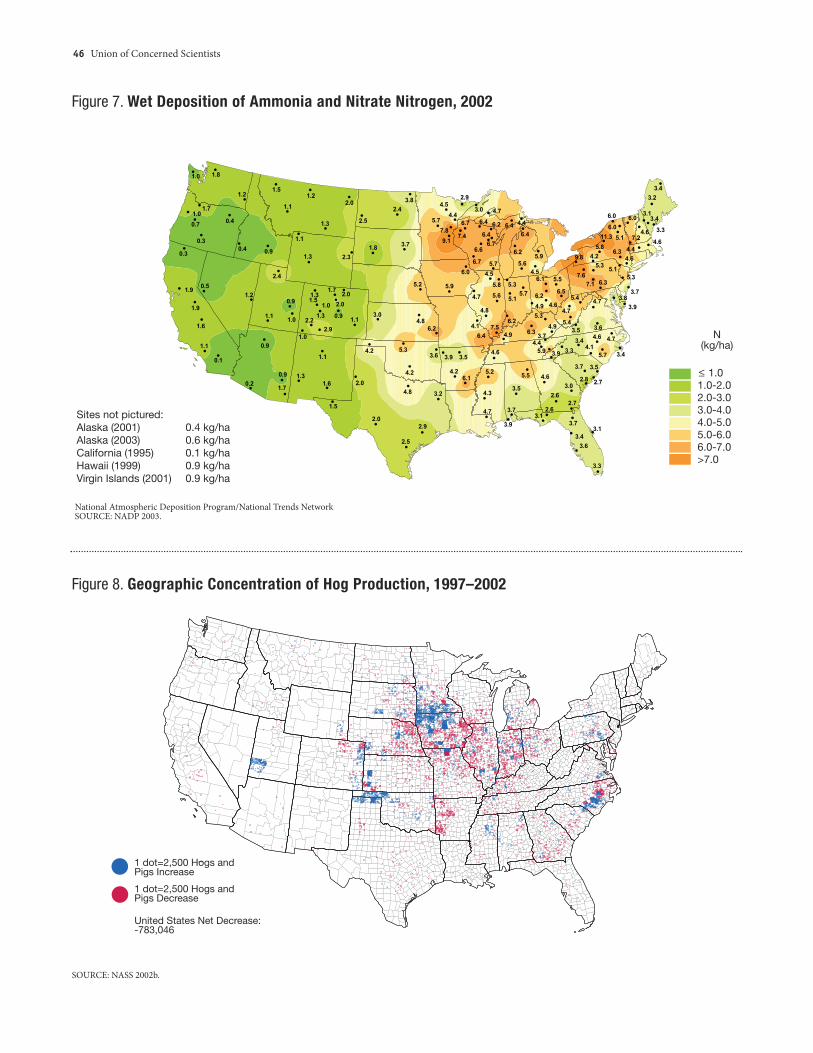
46 Union of Concerned Scientists
Figure 7. Wet Deposition of Ammonia and Nitrate Nitrogen, 2002
≤ 1.01.0-2.02.0-3.03.0-4.04.0-5.05.0-6.06.0-7.0>7.0
N(kg/ha)
Sites not pictured:Alaska (2001) 0.4 kg/haAlaska (2003) 0.6 kg/haCalifornia (1995) 0.1 kg/haHawaii (1999) 0.9 kg/haVirgin Islands (2001) 0.9 kg/ha
National Atmospheric Deposition Program/National Trends NetworkSOURCE: NADP 2003.
#
2.4
4.4
4.4
1.6
1.91.3
2.9
3.0
5.6
6.4
1.6
3.7
3.9
0.1
4.1
2.72.8
3.5
6.7
6.7
4.5
4.73.9
6.4
3.6
2.5
3.6
3.1
1.5
1.0
5.3
4.7
6.1
2.3
0.9
2.2
6.2
5.4
1.3
1.2
4.8
1.1
1.7
1.5
5.8
4.9
4.7
4.6
3.1
2.0
3.4
4.6
6.0
6.1
4.6
5.3
3.7
1.3
3.5
4.4
3.7
5.54.2
3.53.9
0.2
0.9
1.1
0.3
1.9
1.1
1.0
1.3
1.7
0.9
2.0
2.0
1.0
3.7
3.4
3.3
2.6
3.6
3.1
2.7
3.0
4.6
2.6
6.0
5.9
0.90.4
5.6
4.5
4.8
7.5
4.7 5.7
6.2
5.3
5.1
6.24.8
6.34.9
3.8
3.4
3.4
3.2
3.36.4
5.96.2
9.1
4.43.0
4.52.9
5.7
7.8
4.3
5.2
1.3
1.5
1.1
1.2
4.7
3.9
3.4
5.74.1
3.3
3.8
2.4
5.2
4.6
5.3
1.1
0.5
5.8
9.8
5.111.3
4.26.3
6.0
4.6
4.9
6.26.5
5.5
5.3
4.2
4.2
0.3
0.7 0.41.0
1.7
6.37.67.1
5.1
1.8 3.7
3.7
5.94.6
2.0
2.5
2.92.0
3.2
1.0
0.9
3.5
4.7
7.2
6.0
1.8
1.2
6.4
6.6
6.4
7.4
6.7 5.7
5.4
1.1
Figure 8. Geographic Concentration of Hog Production, 1997–2002
SOURCE: NASS 2002b.
1 dot=2,500 Hogs andPigs Increase
1 dot=2,500 Hogs andPigs Decrease
United States Net Decrease:-783,046
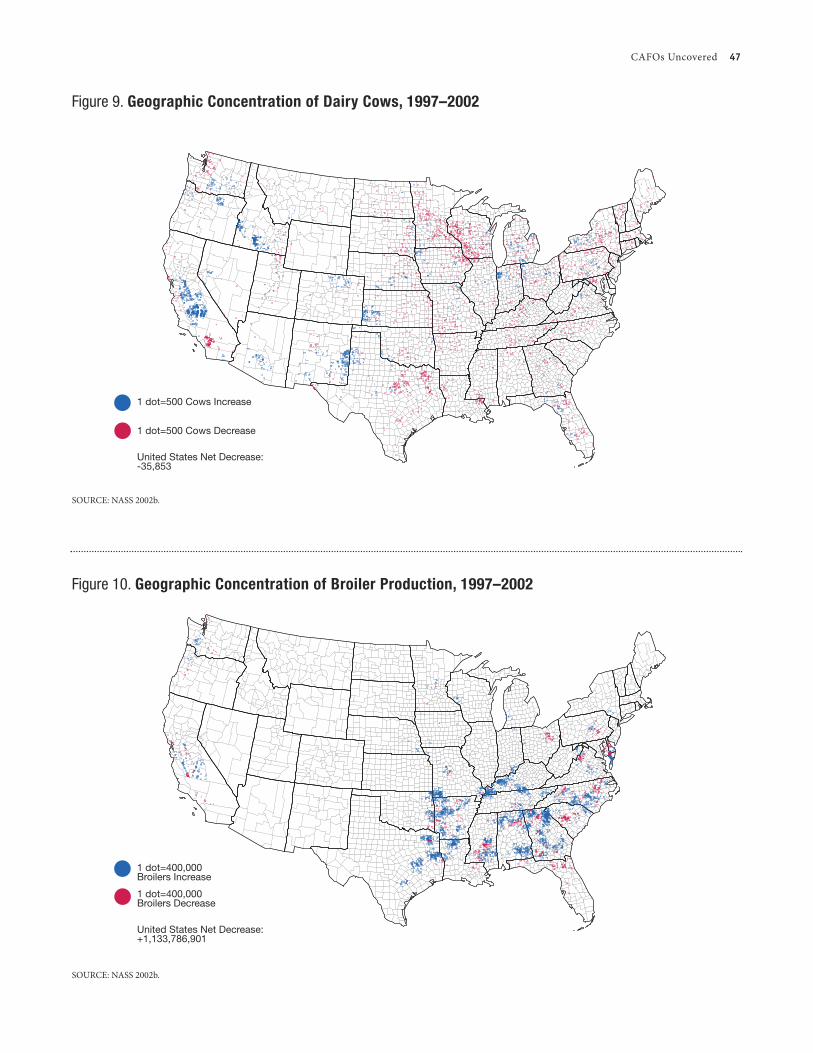
CAFOs Uncovered 47
Figure 9. Geographic Concentration of Dairy Cows, 1997–2002
SOURCE: NASS 2002b.
1 dot=500 Cows Increase
1 dot=500 Cows Decrease
United States Net Decrease:-35,853
Figure 10. Geographic Concentration of Broiler Production, 1997–2002
SOURCE: NASS 2002b.
1 dot=400,000Broilers Increase
1 dot=400,000Broilers Decrease
United States Net Decrease:+1,133,786,901

48 Union of Concerned Scientists
Figure 11. CAFO Manure LagoonLiquid manure from CAFOs is often stored in open-air reservoirs.Photo credit: Courtesy of USDA.
Figure 13.CAFO Manure PileThis enormous pile of manurewas CAFO-generated.Photo credit: Courtesy ofFactoryfarm.org.
Figure 14.CAFO Manure LagoonManure is flushed with water intoa lagoon at this North Carolinahog CAFO.Photo credit: Courtesy of USDA.
Figure 12. Environmental Danger of CAFOsIn this 1999 image, raw manure from hog CAFOs overflows duringflooding caused by Hurricane Floyd.
Photo credit: Courtesy of Rick Dove, www.doveimaging.comand www.neuseriver.com.

CAFOs Uncovered 49
Figure 15.UnsanitaryConditionsin Cattle CAFOThese feedlot cowsare caked in manure.Photo credit:Courtesy ofCARE/Factoryfarm.org.
Figure 16. Alternative Cattle ProductionWell-maintained pasture systems are efficient and safer for theenvironment than CAFOs.
Photo credit: Courtesy of SARE.
aboveFigure 17. Crowding in Chicken CAFOAt least 30,000 birds are packed into chicken CAFOs.
Photo credit: Courtesy of USDA.
rightFigure 18. Alternative Poultry ProductionPasture-raised chickens consume forageand insects as well as grain.
Photo credit: Courtesy of Stan Skillington.

50 Union of Concerned Scientists
Figure 19.Crowding in Hog CAFOAmimals in CAFOs arepacked tightly together.Photo credit: Courtesy ofFarmsanctuary.com.
Figure 21. Alternative Pork ProductionPasture-raised pigs are free to forage onthis Colorado ranch.Photo credit: Courtesy of Doug and Kim Wiley.
Figure 20. Hog Hoop BarnHoop barns give pigs straw beddingmaterial and more room to move.Photo credit: Courtesy of North CarolinaState University.
Kansas alone could amount to $56 million—andKansas is not a national leader in either dairy or hogproduction. States that have a larger number of suchCAFOs (e.g., California, Iowa, Minnesota, NorthCarolina, Wisconsin) may face much more extensivelagoon or pit leakage problems than Kansas, depend-ing on geology and other factors. It has been notedthat the North Carolina coastal plain features manyrisk factors for waste runoff and leakage, such as soilpercolation potential (Mallin and Cahoon 2003).
e extent of leakage and penetration intogroundwater depends on a number of factors thatvary considerably between CAFOs, includingwhether the pit or lagoon is lined, the type of lining,the type of subsoil, the depth of groundwater andaquifers, and the age of the facility. It is clear, how-ever, that leakage is a common problem. It is alsoimportant to consider that once pollution hasreached an aquifer, it may remain for years, decades,or longer.
We have used the Kansas data to calculate arough estimate of the total cost of soil remediationunder U.S. dairy and swine CAFOs. By dividing thetotal number of swine and dairy CAFOs by thenumber of such CAFOs in Kansas (NASS 2002a),then multiplying that figure by $56 million, we ar-rived at a national cost of $4.1 billion.20 We did notextend these calculations to poultry and beefCAFOs because their manure storage methods areoen considerably different than hog and dairyCAFOs. However, poultry and beef CAFOs alsomay contribute to manure leaching into groundwa-ter under their manure collection structures.
Compared with nitrate, phosphorus is usuallymuch less soluble in agricultural soils. It has there-fore been thought that the primary means by whichmanure phosphorus enters water is through therunoff of phosphorus bound to soil particles, whichin turn has led to a focus on conservation practicesintended to limit runoff and soil erosion. Accumula-
tion of phosphorus in soil over a number of yearscan also lead to increased dissolved phosphorus(Toth et al. 2006; Boesch 2001). Recent data suggestthat over several years, phosphorus application atrates above that which can be utilized by crops re-sults in leaching of dissolved phosphorus intogroundwater in saturated and organic soils (Koop-mans et al. 2007; van Es et al. 2004). Measurementsof crop field drainage tiles showed substantial dis-solved phosphorus from some soils aer manure ap-plication (van Es et al. 2004).
Groundwater pollution can also result in surfacewater pollution, because groundwater may entersurface water such as streams or rivers.
Surface water pollutionManure may spill from holding structures intonearby waterways due to severe weather or poor de-sign or construction. Particularly dramatic instancesof surface water contamination have occurred,drawing attention to the vulnerability of these struc-tures and the impact they can have on watersheds.In 1995, for example, 25 million gallons of rawswine waste was released from a single failed lagooninto North Carolina’s New River and its estuary, pol-luting approximately 22 miles of river. is spillcaused fish kills, algal blooms, and fecal bacteriacontamination, as did a poultry lagoon failure thesame year (Burkholder et al. 1997; Mallin et al.1997). Massive contamination also occurred whenHurricanes Fran, Bonnie, and Floyd hit the NorthCarolina coast in the 1990s (Mallin and Corbett2006). Several large spills have also been recorded inother states (Mallin 2000), along with numeroussmaller spills.
Although catastrophic failures of manure la-goons have garnered the most public attention, themost common source of water pollution fromCAFOs may be the intentional application of ma-nure onto farmland. Nutrients and other pollutants
CAFOs Uncovered 51
20 As noted in Chapter 2, NASS data do not have categories corresponding exactly to the EPA definitions of hog and dairy CAFOs, so we used the closestcategories available: 500 or more diary cows and 2,000 or more hogs. e number of Kansas hog CAFOs was obtained by multiplying the number of hogfarms larger than 1,000 animals in the state by a factor equal to the number of U.S. hog farms larger than 2,000 animals divided by the number of U.S. hogfarms larger than 1,000 animals. is estimate may differ from that used in Volland, Zupancic, and Chappelle 2003.
continued from page 42

such as antibiotics, other pharmaceuticals, andheavy metals can move from fields where manurehas been applied (Barker and Zublena 1995) due tostorm runoff into streams or leaching into the soilbelow plant root levels (Karr et al. 2001), eventuallyreaching groundwater or surface water (by transportthrough field drainage tiles). Vegetation buffers in-tended to deter the movement of runoff and nutri-ents into streams and rivers are oen inadequatebecause nutrients—especially nitrogen—may passunder them (Karr et al. 2001).
Damage to aquatic ecosystemsAs indicated above, the two main contributors towater pollution from CAFOs are soluble nitrogencompounds (such as nitrate and ammonia) andphosphorus. Both nitrogen compounds and phos-phorus contribute to the eutrophication of bodies ofwater characterized by algal blooms and fish die-offs. Phosphorus tends to be the key factor in caus-ing freshwater eutrophication, while nitrogen ismore oen important in open marine environ-ments, but both can be important in either environ-ment. In addition, nitrogen in the form of ammoniacan be directly toxic to aquatic organisms, and ni-trous oxides (another product of manure) are potentheat-trapping gases. Ammonia pollution can alsolower the level of dissolved oxygen in streams, lakes,and estuaries through the process of nitrification, bywhich bacteria oxidize ammonia into nitrite and ni-trate (Clark et al. 1977).
Eutrophication has led to hypoxia (oxygen defi-ciency) in extensive areas of the Gulf of Mexico andChesapeake Bay (Boesch, Brinsfield, and Magnien2001; Rabalais, Turner and Wiseman 2001). eseareas are oen called “dead zones” because the levelsof oxygen found there are too low to support manytypes of animals, such as many species of commer-cially important fish and shrimp. Hypoxia thereforehas a substantial economic impact. e hypoxiczone in the Gulf of Mexico is associated with nitro-gen entering from the Mississippi River, and hasbeen expanding in recent years. From 1985 to 1992,the hypoxic zone averaged 8,000 to 9,000 km2; from
1993 to 2000 it reached as much as 16,000 to 20,000km2 (Rabalais, Turner, and Wiseman 2001).
Manure and synthetic fertilizers applied to cropsare largely responsible for the nitrogen that pollutesbodies of water. Animal agriculture that depends ongrain production is also indirectly responsible formuch of the nitrogen from crops, because mostgrain—and therefore most grain crop acreage—isused to feed animals. Livestock have been estimatedto contribute about 15 percent of the inorganic ni-trogen entering the Gulf of Mexico (Goolsby et al.1999), but more recent research has raised the pos-sibility that this figure may actually underestimatethat contribution (Weldon and Hornbuckle 2006).
Pollution and hypoxia in coastal water and estu-aries may be especially important because manyopen-ocean fish spawn at these sites (Boesch et al.2001). For example, up to 90 percent of AtlanticCoast striped bass (Morone saxatilis), an importantcommercial and sport fish, spawn in the Chesa-peake Bay (Chesapeake Bay Project 2007). Catchesof striped bass in the bay have been declining, ashave those of blue crab (Callinectes sapidus), themost important commercial species in the bay(Chesapeake Bay Project 2007). Although these de-clines are likely attributable to several factors, bothspecies inhabit parts of the bay (for parts of their lifecycles) that may be subject to hypoxia. In addition,increased turbidity (poor transmission of lightthrough the water) due in part to eutrophic plank-ton blooms contributes to a decline in submergedgrasses that provide vital habitat for blue crab andother marine life (Boesch et al. 2001). e docksidevalue to Maryland and Virginia of this single fishery(without considering economic multiplier effects)was estimated to be about $52 million in 2002(Chesapeake Bay Commission 2003).
Pollution from airborne nitrogenManure components, especially nitrogen com-pounds, can be important sources of air pollution.Volatilized nitrogen (in the form of ammonia) isalso an important source of terrestrial and waterpollution because, as discussed below, most of it
52 Union of Concerned Scientists
CAFOs Uncovered 53
The regulation of pollution from CAFO manurehas a signi=cant impact on whether this pollu-tion continues to be an externalized cost ofproduction, and therefore whether CAFOscontinue to receive a competitive advantageover alternative types of animal production byavoiding these costs.
As noted earlier, recent changes in theClean Water Act target CAFO water pollutioncaused by over-application of manure to =elds(EPA 2003). One way the Clean Water Act reg-ulates CAFO pollution is through the issuanceand enforcement of permits under the NationalPollution Discharge Elimination System(NPDES). Regulatory changes proposed bythe EPA would affect the issuance of NPDESpermits as well as related ef>uent standardsand comprehensive nutrient manage-ment plans.
After the EPA made some initial changes
to the system in 2003, several environmental
groups sued the agency, claiming the addi-
tional changes it had proposed would be inad-
equate to prevent CAFO pollution. The court
upheld some aspects of the plaintiffs’ argu-
ments while disagreeing with others. This led
to the development of new proposed regula-
tions that would require some CAFOs to hold
permits for manure management and would
set standards for manure application rates to
prevent water pollution (Centner 2006; EPA
2006). Compliance with these new standards
could be expensive, but will depend in part on
the speci=cs of the =nal rule, which the EPA
plans to complete by early 2009 (EPA 2007).
In addition, programs such as EQIP could
subsidize compliance.
Potential roadblocksThe wording of the EPA’s proposed NPDESregulation has raised a question aboutwhether CAFOs could legally avoid the permit-ting process in the absence of a determinationthat they actually “discharge” manure pollution(Centner 2006). Under the current language,the EPA would require “only the owners andoperators of those CAFOs that discharge orpropose to discharge to seek coverage undera permit” (EPA 2006). If this quali=cation is partof the =nal rule, it may give CAFO owners agreat degree of discretion in deciding whetherto obtain a permit (and develop an accompa-nying nutrient management plan) in the ab-sence of actual contamination data.
Furthermore, inconsistent enforcement ofpermit regulations has been a concern in thepast and may be under the new rule as well.For example, although Michigan and Wiscon-sin each had more than 100 CAFOs, Wiscon-sin had issued 110 permits but Michigan hadissued none (GAO 2003).
How these issues are resolved will haveserious implications for whether CAFOs con-tinue to avoid accountability for the water pol-lution caused by their manure.
Regulation of CAFO Manure

returns to the earth within 80 km of its origin(Walker et al. 2000), where it harms vegetation andreaches water sources. Nitrous oxide, another gasproduced from manure and synthetic fertilizers, isan important heat-trapping gas, but the impact ofCAFOs on global warming is not considered here.
Livestock are the biggest source of anthro-pogenic (i.e., influenced by human activity) ammo-nia emissions in the United States. Animal waste isresponsible for about 3 x 10⁹ kg of airborne ammo-nia per year, while the next largest source, syntheticfertilizer, produces about 8 x 10⁸ kg of ammonia.According to some estimates, animal sources con-tribute as much as 75 percent of anthropogenic am-monia, and fertilizer contributes about 20 percent,with all other human sources such as transportationand industry accounting for only about 5 percent(Anderson, Strader, and Davidson 2003). By con-trast, dairy cows raised on pasture have been esti-mated to produce about 5 to 10 times less ammoniaemissions than confined livestock (Anderson,Strader, and Davidson 2003). Recent changes in themethods used by the EPA to determine ammoniaemissions from livestock reduce estimates by about33 percent compared with previous methods, due tomore refined partitioning of animal manure handling(EPA 2004). Nevertheless, this newer method contin-ues to rank livestock as the largest producer of am-monia, by several times more than any other source.
Nitrogen is found in several different forms inmanure, and these different forms have differentfates and effects on the environment. A largeamount of the nitrogen in manure lagoons and pits,for example, takes the form of ammonia—typicallyabout 60 percent for dairy manure, 90 percent forbeef cattle runoff ponds, 73 percent for poultry, and63 percent for hogs (Soil Conservation Service1992). Feed characteristics can alter these values.Ammonia is a simple compound that does not con-tain carbon, and is the primary form of inorganicnitrogen in manure.
Much of the rest of the nitrogen in manure isfound in carbon-containing molecules referred to asorganic nitrogen. is organic nitrogen is convertedinto ammonia and other forms of nitrogen.
How manure is stored and applied to fieldslargely determines how much of the ammoniavolatilizes. Open manure lagoons or pits, for exam-ple, allow substantial amounts of ammonia to es-cape into the air. e amount of inorganic nitrogenin manure and how it is applied to the soil is impor-tant as well. When over-applied, the type of applica-tion method largely determines whether theammonia is volatilized and creates air pollution(and, indirectly, water pollution), or remains in thesoil where some of it can pollute water resources.
Phosphorus from manure, unlike ammonia,does not form a gas, and therefore does not typicallyleave manure via the atmosphere. is differencebetween ammonia and phosphorus has importantimplications for the distribution of manure ontofarmland and for tradeoffs between air and waterpollution discussed below.
A large percentage of volatilized ammonia findsits way back to the ground or water locally or re-gionally. is can occur through dry deposition orwet deposition (facilitated by rain or snow). Re-search in Europe showed that about 50 percent ofvolatilized ammonia is deposited within approxi-mately 50 km of the source (Ferm 1998). Calcula-tions have also predicted that 38,000 of 43,000 shorttons of volatilized ammonia produced by NorthCarolina’s 2,295 CAFOs, or 88 percent, is depositedwithin a radius of 50 km (Murray 2003). is sug-gests that most of the ammonia that is eithervolatilized from CAFOs directly or aer applicationonto farmland will be redeposited across the region.
e growing number of CAFOs has occurredalongside, and may be correlated with, dramaticallyincreased airborne ammonium ion concentrationsin several parts of the United States over the past 18years (Figure 5, p. 45). Ammonia ions are rapidlyformed in the atmosphere from volatilized ammonia.In many areas ammonium ion concentrations haveincreased by a factor of two to four, and areas of highammonium concentration (over 0.5 mg/l) have ex-panded substantially. e areas of greatest ammo-nium concentration correspond roughly with thoseareas that have the largest number of dairy, beef, andhog CAFOs, although areas with the highest num-
54 Union of Concerned Scientists
bers of broiler CAFOs (in the southern part of thecountry) do not show increased ammonium.
Figure 6 (p. 45) illustrates wet deposition of am-monia for 2002, showing that in many areas, sub-stantial amounts of ammonia reach the ground orwater. Areas of high deposition generally corre-spond with regions of high CAFO concentrations,with California an exception. Dry deposition, whichis not measured in this figure, can contribute sub-stantial additional amounts of ammonia, perhaps asmuch as or more than wet deposition under someconditions (Ferm 1998). In North Carolina, ammo-nium concentrations have increased significantly inrecent years in the Neuse River (Burkholder et al.2006) and the northeastern portion of the Cape FearRiver (Burkholder et al. 2006; Mallin and Cahoon2003). ese rivers drain the largest swine-produc-ing areas on the East Coast, which are also areas withhigh levels of ammonia wet deposition (Figure 6,p. 45).
When ammonia returns to the earth, either bywet or dry deposition, it can directly damage terres-trial ecosystems or move through the soil profileinto ground and surface water, causing water pollu-tion of the types discussed earlier. Unlike nitrogenthat enters ground or surface water from crop fieldsor manure storage facilities, airborne nitrogen canbe deposited in unmanaged terrestrial ecosystemssuch as grasslands, forests, and deserts. Many natu-ral ecosystems have evolved under relatively lownitrogen availability, and increased nitrogen deposi-tion may reduce biodiversity in such ecosystems byfavoring those species that benefit from high nitro-gen levels (Vitousek et al. 1997).
Furthermore, ammonia (NH3) typically formsammonium ions (NH4+) aer entering the atmos-phere, which can contribute to acidification of soilsaer deposition (Krupa 2003; Vitousek et al. 1997).Soils and lakes that are not well buffered againstchanges in pH are particularly susceptible to acidifi-cation, which harms plants and the ecosystems thatdepend on them.
e concentration of ammonia deposition inmany areas of the United States now exceeds theamount that may harm forests (termed the “critical
load”). For example, the critical load for deciduousforests has been calculated to range from about 5 to20 kg of nitrogen (N) per hectare per year, and forconiferous forests, from 3 to 15 kg N/ha per year(Ferm 1998). When ammonia wet deposition iscombined with nitrate wet deposition (Figure 7,p. 46), areas at risk for exceeding these critical loadsare revealed, along with higher levels of nitrogendeposition (note the difference in scales used forFigures 6 and 7).
e contribution to water pollution from nitro-gen deposited from the atmosphere can be consider-able. A recent study of 10 estuaries along the EastCoast estimated that atmospheric nitrogen deposi-tion accounted for 15 to 42 percent of total nitrogeninput (Castro and Driscoll 2002). Studies of theChesapeake Bay have attributed 25 to 80 percent ofthe total nitrogen to airborne deposition, but morerecent modeling has suggested a figure closer to 20percent or less (Sheeder, Lynch, and Grimm 2002).However, this remains an important contribution,since other work has estimated that nitrogen inputmay have to be reduced by almost 90 percent toeliminate hypoxia (Boesch et al 2001).
In addition to ammonia, manure from CAFOscontributes to air pollution through the emission ofhydrogen sulfide, particulates, odors, and path-ogens. Fine particulates formed from ammonia canbe a cause of respiratory disease. (Ammonia is alsoan irritant when inhaled, and can cause respiratoryproblems in both livestock and CAFO workers.)
Ammonia ions that form from volatilized am-monia can be an important component of fine par-ticulate matter (categorized as PM2.5). ese smallparticles—less than 2.5 microns in diameter—areparticularly hazardous to respiratory health becausethey lodge more deeply in the lungs than the largerparticles that were previously the main focus of con-cern (McCubbin et al. 2002). PM2.5 may form whenammonia from CAFOs combines in the air with nitro-gen oxides or sulfur dioxide from automobiles, indus-try, or power plants. As of 1995, ammonia comprised47 percent of PM2.5 by mass in the eastern UnitedStates (Anderson, Strader, and Davidson 2003).
CAFOs Uncovered 55

21 Because grain is relatively light when dried, it can be shipped long distances at relatively low cost (as long as fuel costs are low). CAFOs, by relying on grainas their primary feed component, have therefore been able to locate their operations geographically separated, or decoupled, from the areas that producethis feed.
Manure and livestock also produce globalwarming pollution in the form of methane and ni-trous oxides. ese gases are not as abundant as car-bon dioxide (the primary contributor to climatechange) but are much more potent in trapping heat:methane by a factor of about 24 and nitrous oxidesby a factor of about 295.
The Costs of Manure Disposal
Because manure is an effective and valuable fertil-izer, it might be assumed that CAFOs could readilyfind nearby farmers willing to accept or even buy it.is is oen not the case. In some situations, ade-quate farmland is simply too far away from CAFOsfor manure transport to be a viable option, but evenwhen farmland is nearby, manure is not always ac-cepted. For example, corn and soybeans are themost widely grown crops in the United States, butdata show that on average, only about 17 percent ofcorn and 2 to 9 percent of soybean acreage acceptmanure (Ribaudo et al. 2003). For wheat, grown inareas where beef CAFOs are prevalent, the manureacceptance rate has been about 3 percent.
One important consideration for farmers is thatthe nutrient content of manure can vary consider-ably from batch to batch depending on the type ofmanure (i.e., the animal source), what the animalswere fed, how the manure was stored, and how it isapplied to the field. is lack of uniformity requirestesting to determine nutrient content and howmuch manure a field will therefore need.
Noxious odors are a second reason oen givento explain low manure acceptance rates. Odor is pri-marily a problem associated with manure fromCAFOs rather than smaller animal operations duein part to the way it is stored and applied to fields.CAFO manure stored in pits or lagoons is oen lowin oxygen, which can lead to the production ofvolatile compounds with offensive odors. esecompounds include hydrogen sulfide (a gas thatsmells of rotten eggs), ammonia, phenol, indoles,
skatole, volatile fatty acids, acetic acid, cresol, anddimethyl sulfide. Besides being disagreeable, preva-lent CAFO odors have been linked to psychologicaldisturbances and health problems in both livestockand people (Mackie, Stroot, and Varel 1998).Smaller operations do not oen store large amountsof manure in pits and lagoons, so the low-oxygenconditions that exacerbate odors are not as likely todevelop.
As a consequence of the small number of farmerswilling to use CAFO manure and the huge amount ofmanure concentrated in a small locality, CAFOsmust oen transport their manure substantial dis-tances to distribute it over enough farmland to avoidpollution problems and comply with Clean WaterAct standards. Small and medium-sized operations,on the other hand, oen have enough available crop-land to apply manure at rates that do not cause sub-stantial water pollution (Ribaudo et al. 2003).
Manure is heavy due to its high water content,and therefore expensive to transport. Manure storedin holding facilities such as lagoons or pits has par-ticularly high water content because it is a mixtureof feces and urine that is oen flushed out of live-stock housing facilities with water. For example,dairy cow, poultry, and pig manure held in lagoonstypically consists of more than 99 percent water.Poultry litter has lower water content: about 24 per-cent for broilers and 50 percent for layers. Dairycow waste is about 80 to 85 percent water as ex-creted, while hog and beef cattle waste is about 90percent water (Soil Conservation Service 1992).is high water content has encouraged the spray-ing of this waste onto “sprayfields” close to lagoons.
ere can be substantial regional differences inthe amount of farmland in an area and the percent-age willing to accept manure. ese regional limita-tions can increase costs by requiring greatertransportation distances. Because CAFOs have beenable to “decouple” the growing of feed, especiallycorn and soybeans, from animal production,21 theydo not necessarily need to be located in the same
56 Union of Concerned Scientists

regions where feed is grown. For example, the Mid-west’s corn belt has a lot of cropland but relativelyfewer hog CAFOs per acre of cropland than theMid-Atlantic and West (Ribaudo et al. 2003); if thetrend observed over the past several decades of sub-stantial CAFO growth in these latter regions contin-ues, crop availability for CAFO manure maybecome even more of a problem.
Other factors contributing to this problem arethe geographic concentration of CAFOs and the in-creasing size of individual feeding operations. eenvironmental risks associated with these factorsare oen outweighed by financial considerations.For example, some poultry processors demand in-creasingly larger numbers of animals to run throughtheir operations (Ollinger, MacDonald, and Madi-son 2005), and need the animals to be raised nearprocessing plants because transportation can lead tosignificant mortality and weight loss.
A substantial percentage of hog production hasbecome concentrated in the Mid-Atlantic, especiallyNorth Carolina, over the past two decades. NorthCarolina now trails only Iowa in hog production,but was ranked sixth as recently as 1990 (NASS2008a). Hog CAFOs may even be in the process ofbecoming more geographically concentrated withinstates. Figure 8 (p. 46) shows the increasing concen-tration of hog production in specific regions and thesimultaneous decrease in production in surround-ing areas. is trend was already occurring in the1980s and especially the 1990s.
Most beef cattle feedlots have moved to five west-ern Great Plains states. California has emerged as thelargest dairy-producing state even though it does notgrow large amounts of corn or soybeans, joining theranks of such traditional dairy producers as NewYork, Pennsylvania, and Wisconsin (NASS 2008a).
As already mentioned, broiler chicken produc-tion is concentrated in the Southeast (Figure 10,p. 47), another region without enough cropland toadequately utilize all of the manure its CAFOs pro-duce. is concentration has dramatically increasedin recent decades due to rising demand for broilerchickens.
Regional CAFO expansion may make it increas-ingly difficult for greater amounts of manure to beadequately spread onto cropland. As CAFO produc-tion in a given region becomes more dense, accessto local crop fields may decrease while the distanceneeded to reach available fields increases.
Methods for calculating manure disposal costsOne way of estimating the costs of CAFO pollutionis to determine the amount of money CAFO ownerswould have to pay to transport manure away fromtheir operations in order to reduce pollution. esecalculations do not include costs from other sourcesof harm caused by CAFOs, such as leakage frommanure lagoons, and therefore are incomplete costestimates. Nonetheless, it can be said with certaintythat the various costs involved in addressing the un-healthy concentrations of manure on CAFOsamount to a large subsidy for the industry.
Another way to consider the harm done by ex-ternalities is to calculate the value of the societalbenefits lost as a result. Accurate calculations aredifficult because benefits are numerous and dis-persed throughout society. e EPA, for example,calculated the benefits from implementation of the2003 Clean Water Act amendments at about$290 million per year nationally (EPA 2003), butsubstantially underestimated the total by not ad-dressing some specific benefits of reduced CAFOpollution (e.g., reduced estuary eutrophication, re-duced antibiotic use, and benefits to rural commu-nities such as increased property values and betterhealth). And because this regulation does not ad-dress air pollution, no values were assigned for ben-efits such as reduced harm to forests and reducedhealth problems related to fine particulate matter.
Calculations that estimate the cost of reducingmanure pollution through better land distributionmay be more accurate. is approach would addressmore of the environmental damage and some of thehealth damage caused by manure than the limitedanalyses of lost benefits currently available.
Substantial expense would be required to com-ply with Clean Water Act standards for manure
CAFOs Uncovered 57

application in all parts of the country. One study es-timated the cost of compliance for various CAFOsunder different assumptions about farmers’ willing-ness to accept manure (WTAM) as a substitute forsynthetic fertilizer, including WTAM levels consid-erably higher than the current actual percentage(Ribaudo et al. 2003). e study authors acknowl-edged that a 20 percent WTAM may represent amore realistic national average than some of thehigher WTAM values also used in the study. Calcu-lations for applying manure to fields in the Chesa-peake Bay watershed using a WTAM of 20 percentfor a nitrogen-limited standard arrived at a total an-nual cost of $133.8 million.
Environmentally acceptable manure applicationrates can be set based on either nitrogen or phos-phorus limits; the choice should be determined bywhichever nutrient has the greater potential forcausing pollution. is in turn depends on specificcharacteristics of the accepting farm, including thecontent of each nutrient in the soil, the types ofcrops grown, and soil type. Phosphorus oen repre-sents more of a problem than nitrogen, so applica-tion rates based on phosphorus limits may oen bemore appropriate.
Total costs for the Chesapeake Bay regionbased on a phosphorus-limited application ratehave been estimated at $152.8 million, using a 60percent WTAM (Ribaudo et al. 2003). Because fuelcosts have risen dramatically in recent years, thecurrent costs would undoubtedly be higher. Thesame study notes that without such a high WTAMvalue, there is not enough farmland in the regionto adequately distribute manure under a phospho-rus standard. Determining the cost of achieving aphosphorus standard with a WTAM less than 60percent would therefore be complicated by the factthat excess manure would have to be disposed ofby other means, with uncertain costs. For example,at a 20 percent WTAM in the Chesapeake Bay re-gion, more than 1.5 million tons of manure wouldremain after proper field application. Disposing ofthis manure by other means would add substan-tially to the total cost. This dilemma illustrates the
difficulty of achieving adequate distribution ofCAFO manure.
The authors note that the net return for animalproduction in the Chesapeake Bay region at thetime was $313 million. Therefore, the cost ofproper manure application calculated above com-prises about 43 to 49 percent of the net return foranimal production in the region. Even at a WTAMof 100 percent, the cost of proper field applicationunder a phosphorus standard is calculated to be$143 million, or about 46 percent of net return.
Even at low levels of manure acceptance, thestudy found that smaller animal farms could findenough nearby cropland to accept all of their ma-nure, thereby avoiding the costs associated withlonger transportation distances. Because the ani-mals on smaller farms are more dispersed than inCAFOs, more of the farmland will meet EPA appli-cation standards, making manure an asset ratherthan a liability for these farms. For small tomedium-sized animal operations that also growcrops or pasture (diversified farms), some or all ofthe manure produced by the livestock could be usedon the farm.
Costs of reducing air and water pollutionough the proper application of manure on fieldswill reduce air pollution from CAFOs, it may in-crease water pollution. Conversely, some of themethods that reduce water pollution from fieldswhere manure is applied increase air pollution. isis because practices such as spraying manure ontofields, applying manure on top of fields withoutspraying, and leaving manure in uncovered storagefacilities for prolonged periods of time all allow sub-stantial amounts of ammonia to volatilize. Cur-rently, the primary way of avoiding this tradeoffbetween air and water pollution requires both thestorage of manure in ways that reduce ammoniavolatilization and access to more land for manuredistribution, and manure spreading methods thatreduce ammonia volatilization.
Water and air pollution caused by CAFOs aretherefore inextricably linked, and addressing one
58 Union of Concerned Scientists

without the other can have unanticipated harmfulconsequences. ere is currently little incentive tolimit air pollution from manure, however, becauseour primary air pollution law, the Clean Air Act,does not typically address ammonia volatilizationfrom manure. e National Research Council rec-ognized the need to reduce these emissions andrecommended that controls be designed and imple-mented (NRC 2004).
A resulting increase in costs may be a disincen-tive for CAFO owners to adopt practices such ascovering manure lagoons or injecting manure intofield soil; the latter reduces ammonia emissions byabout 50 percent for shallow injection and almostentirely for deep injection (Rotz 2004), but costsmore than spraying or broadcasting manure (Ailleryet al. 2005). e loss of ammonia nitrogen tovolatilization also reduces the quality of the manureas fertilizer, due to the resulting decrease in nitro-gen-to-phosphorus ratio.
What, then, would it cost to apply CAFO ma-nure to enough land to prevent or greatly reduceboth water and air pollution? A detailed USDAstudy built upon previous studies of the amount offarmland needed to avoid water pollution fromCAFO manure, under the assumption that ammo-nia gas reduction measures would apply to all AFOsand water pollution reduction would be based on ei-ther nitrogen or phosphorus limits for CAFOs (Al-liery et al. 2005). e report also considered theindustry’s possible responses to increased costs,such as passing some costs on to consumers and re-ducing production in the case of hogs.
Simply complying with the new Clean WaterAct provisions discussed earlier (i.e., without reduc-ing air pollution from ammonia) would cost CAFOsa total of $534.46 million annually. When bothwater and air pollution reduction practices wereconsidered, the total annual costs rose to as much as$1.16 billion.
Several of the assumptions and values used in theUSDA’s calculations may have substantially underes-timated the actual costs. For example, the reportused a WTAM of 30 percent—well above the current
levels for corn, soybeans, and wheat noted above. Inaddition, the cost of airborne ammonia abatementwas only calculated for values up to a maximum re-duction of 40 percent, because the cost of greater re-ductions could not be accurately determined.Current ammonia wet deposition data suggest that a40 percent reduction in airborne ammonia wouldcontinue to leave many areas with deposition ratesthat may exceed soil critical load levels and cause en-vironmental harm. is may be even more of a prob-lem if dry deposition of ammonia and nitrate areconsidered along with wet deposition.
On the other hand, some aspects of this analysismay have overestimated the costs of reducing airand water pollution. In particular, the report con-sidered air pollution reduction for all AFOs, despitethe fact that CAFOs produce about 65 percent of alllivestock manure. erefore, if the costs of reducingairborne ammonia were proportional to the amountof manure produced, about two-thirds of the costwould be borne by CAFOs.
e USDA’s analysis nevertheless represents themost complete national estimates currently availablefor the costs associated with reducing both air andwater pollution from CAFOs. e measures consid-ered would only partially prevent such pollution,and do not address other dangers such as antibiotic-resistant pathogens and harm to rural communities(discussed below). It is therefore important to re-member that these values only partially cover thecosts of preventing harm from CAFOs.
Other Externalized Costs
CAFOs have numerous environmental, health, andsocial impacts in addition to the ecological harmcaused by manure. Many of these generate costs thatare currently borne by society as a whole; here we willspecifically consider some of the costs to rural com-munities located near CAFOs and some of the costsfrom antibiotic-resistant pathogens that develop inpart due to the overuse of antibiotics in CAFOs. Wewill also briefly discuss how the genetic uniformityencouraged by CAFOs and meat processors to
CAFOs Uncovered 59

facilitate their production methods may also con-tribute to increased disease among livestock.
Public health risks in rural communitiesCAFOs oen reduce the quality of life and thehealth of people living near these operations. eodors emanating from CAFOs may be substantialfor up to several miles and have been found to havenegative effects on well-being. Even worse, exposureto pathogens, harmful airborne particles, and con-taminated water supplies is oen higher for peoplewho live close to CAFOs—especially for employeesof CAFOs and their families. Any of these factorscan lower property values in the surrounding areas.And because CAFOs are oen situated near low-income communities (Donham et al. 2007),residents may be more vulnerable to the dangersbecause these communities typically have lesspolitical clout than others.
Studies show that at least 25 percent of CAFOworkers suffer from respiratory diseases such aschronic bronchitis and occupational asthma (Don-ham et al. 2007; u 2001). People living near swineCAFOs have a higher incidence of specific diseasescompared with control groups in several studies(Donham et al. 2007; Wing and Wolf 2000; uet al. 1997). is is likely due to the fact that CAFOsproduce substantial levels of substances that may beresponsible for respiratory illness, including ammo-nia, hydrogen sulfide, particulate matter, and endo-toxin (a by-product of bacterial membranes).
Adverse effects are oen significant at distancesof up to two or three miles from CAFOs, and be-come more severe as operation size increases. Onestudy in particular noted a strong correlation be-tween the types of symptoms reported by residentsand those studied in CAFO workers, especially res-piratory and gastrointestinal distress, strongly sug-gesting that CAFOs were the cause (Wing andWolf 2000).
Populations living near CAFOs may be at higherrisk of exposure to pathogens in the air or water, orthrough direct contact with animals. Furthermore,these pathogens may have developed resistance to
antibiotics used at the CAFO (see below). Substan-tial levels of antibiotic-resistant pathogens or indica-tor species (bacteria that are not themselvespathogenic, but are oen found together withpathogens) have been isolated from the air in swineCAFOs (Chapin et al. 2005), and potentially patho-genic bacteria—especially Staphylococcus aureus—were found up to 150 m downwind from swineCAFOs (Green et al. 2006), suggesting that signifi-cant risk from airborne pathogens is greatest rela-tively close to CAFOs. However, because pathogenssuch as S. aureus may also spread between peopleaer acquisition, infection originating in or nearCAFOs may be further spread by contact betweenpeople.
Water sources near CAFOs may also act as vec-tors of infection for the nearby population. Antibi-otic-resistant bacteria or resistance genes thatoriginated at swine and other CAFOs have been de-tected in ground and surface water by several studies(Sapkota et al. 2007; Sayah et al. 2005; Chee-Sanfordet al. 2001). Because groundwater supplies 97 per-cent of rural drinking water (USGS 1995) and waterfrom individual wells is oen untreated, exposurefrom these sources could be significant. For exam-ple, one study found fecal indicator bacteria (Entero-cocci and coliforms) in test wells 250 and 400 mdowngradient from swine CAFOs (i.e., wheregroundwater is at a deeper level than directly belowthe CAFO), at levels that exceeded EPA safe drink-ing water guidelines (Sapkota et al. 2007). ese bac-teria also had substantially higher levels of resistanceto several antibiotics compared with samples recov-ered upgradient from CAFOs.
Another study found tetracycline-resistant bac-teria 250 m downgradient from a swine CAFO(Chee-Sanford et al. 2001); these bacteria were con-tinuously present over a three-year period (Koikeet al. 2007). Soil-dwelling bacteria found in ground-water downgradient from CAFOs carried identicaltetracycline-resistance genes as those found in swinemanure lagoons, while bacteria from upgradientsites did not (Koike et al. 2007). is strongly sug-gests not only that lateral gene transfer had occurred
60 Union of Concerned Scientists

between CAFO bacterial species and those betteradapted to surviving and spreading in soil, but alsothat the spread of resistance may be facilitated bytransfer to environmentally adapted species.
Some data suggest that hog CAFOs may repre-sent a particularly serious threat to communityhealth. For example, one study showed that al-though a swine CAFO appeared to have significanteffects on the health of nearby residents, a dairyconfinement operation did not (Wing and Wolf2000). It should be noted that the hog CAFO in thisstudy was much larger (6,000 head) than the dairyoperation (300 head). As noted earlier, larger opera-tions affect people at greater distances than smalleroperations. Most studies to date appear to have fo-cused on the deleterious health effects of hogCAFOs, but elevated levels of substances associatedwith harm to hog CAFO workers have also beenfound in other sectors.
Economic costs to rural communitiesCAFOs also have a more adverse economic impacton rural communities compared with smaller andless industrialized animal farms. One study identi-fied several ways that hog CAFOs threaten the via-bility of rural life: reduced property values, fewerjobs, smaller tax base, increased expenses such asroad repair, and lower or absent economic multi-plier effects (Weida 2004b).
Multiplier effects indicate the number of timesmoney is exchanged within a region and reflect thehigher economic value to the region of an enterprisethat uses its revenues locally compared with an en-terprise that moves money out of the region. Severalstudies suggest that the multiplier effects of smallerand independent hog operations are higher thanthose of CAFOs. For example, smaller farms tend topurchase more of their inputs locally or regionallythan larger operations; farms with gross incomes of$100,000 or less made 95 percent of their expendi-tures locally compared with less than 20 percent forfarms making more than $900,000 (Chism andLevins 1994). A study examining hog farms in Iowafound that smaller farms purchased about
75 percent of their feed from local suppliers, com-pared with 43 percent for larger operations(Lawrence, Otto, and Meyer 1997). Independentand smaller hog operations also generate more jobsfor a given amount of revenue compared with verti-cally integrated CAFOs—almost three times asmany in one study (Weida 2004b).
CAFOs also reduce the local tax base while po-tentially increasing community expenses. For in-stance, CAFOs can take advantage of tax breaks forindustry or farming operations, but several commu-nities have noted higher road maintenance costs dueto CAFO truck traffic (Weida 2004b). Water treat-ment costs may also be substantial for communitiesdownstream from CAFOs or drawing water fromcontaminated aquifers, such as cities in Oklahomaand Texas that sued nearby CAFOs due to pollutionof the watersheds that supply these cites with drink-ing water (Martin 2006). And because property val-ues are reduced near CAFOs, the residential taxbase may suffer as well. Overall, economic growthwas 55 percent slower in communities near hogCAFOs compared with communities with smallerhog operations (Weida 2004b).
One of the most tangible indicators of the harmcaused by CAFOs in rural communities is the sub-stantial reduction in property values. Several studieshave found considerably lower values—5 to 40 per-cent lower or more—within distances of about threemiles from hog CAFOs (e.g., Weida 2004b). Onestudy estimated an average loss of about $2.68 mil-lion for the land within three miles of each CAFO inMissouri (Mubarak, Johnson, and Miller 1999).
ese values cannot be accurately extrapolatedto all CAFOs nationwide because of the large num-ber of differences between CAFO sites, includingthe size and type of operation, management prac-tices, local property values, and distribution ofCAFOs. At any site, the impact on property valuesmay be greater or less than that determined in thestudies described here. It is likely however, that on anational basis the reduction in property values iswidespread and considerable. It is therefore instruc-tive to calculate these costs based on the Missouri
CAFOs Uncovered 61

data to convey the general magnitude rather than aprecise value: using a conservative estimate of 9,884CAFOs nationwide, the total loss in property valuewould be $26.5 billion.
Contribution to antibiotic resistanceAn important disease risk associated with CAFOs isthe evolution of antibiotic-resistant pathogens re-sulting from the misuse and overuse of antibioticsin livestock operations. Non-therapeutic use of an-tibiotics in such operations has been estimated tosurpass all human use by a factor of about eight(Mellon, Benbrook, and Benbrook 2001).
Crowding, stress, and unsanitary conditionsfound in CAFOs result in a reliance on largeamounts of antibiotics not only to treat illness, butalso to promote growth and prevent disease. Becausemany animals are therefore exposed to antibioticsthroughout their lives (oen in the form of a feedadditive), increasing resistance to these antibioticsmay result in diseases that are more difficult to treatin humans and therefore cause greater harm thantheir antibiotic-susceptible counterparts. e admin-istration of antibiotics is not allowed under organicstandards and may also be less prevalent amongCAFO alternatives such as pasture-based systems.
e use of antibiotics—particularly at the lowlevels and over the long periods typical for growthpromotion—is widely acknowledged to increase theprevalence of antibiotic-resistant bacteria (Ingliset al. 2005; Shea et al. 2004; Lipsitch 2002; Smithet al. 2002). e non-therapeutic use of antibiotics inCAFOs may even lead to high levels of resistancemore quickly than therapeutic applications, whichuse higher concentrations of antibiotics (Bacquero2001). erapeutic uses may also contribute to resist-ance (WHO 2003), especially if animals are raisedunder conditions that facilitate disease. On a positivenote, when the European Union prohibited the useof antibiotics for growth promotion, the prevalenceof antibiotic-resistant bacteria generally decreased(Emborg et al. 2003; Aarestrup et al. 2001).
Diseases caused by antibiotic-resistant pathogensare oen more difficult to treat. In some cases, an-
tibiotic resistance may also be associated with in-creased virulence, and initial use of ineffective an-tibiotics delays effective treatment. Such antibioticsmay oen be initially prescribed because the suscep-tibility of the infectious agent will not be known, andthe resulting delay in effective treatment can some-times lead to worse outcomes including longer hos-pital stays or death. For some pathogens, such asmultiple-drug-resistant strains of Enterococcus fae-cium, few effective antibiotics may remain.
Higher health costs resulting from antibiotic re-sistance to food-borne pathogens have been repeat-edly documented, especially for Campylobacterjejuni and Salmonella (Varma et al. 2005a; Varmaet al. 2005b; Molbak 2005; Engberg et al. 2004;Swartz 2002; Travers and Barza 2002). Some studies,however, have argued that farm use is not generallyresponsible, or that higher therapeutic use followingthe discontinuation of use for growth promotionmay be responsible (Phillips et al. 2004). Antibiotic-resistant strains of Salmonella have been associatedwith hospitalization rates more than 2.5 timeshigher than antibiotic-susceptible strains (Varmaet al. 2005a), and with serious bloodstream infec-tions resulting in higher rates of morbidity andmortality (Varma et al. 2005b). In addition, the du-ration of illness associated with quinilone-resistantstrains of Campylobacter (13.2 d) was 28 percentlonger than that associated with quinilone-sensitivestrains (10.3 d) (Engberg et al. 2004).
Although illness from food-borne bacteria isnot always treated with antibiotics, a subset of pa-tients requires hospitalization and antibiotic use.erefore, antibiotic-resistant strains that developdue to CAFO practices may increase hospital costsand suffering compared with non-resistant strains.Campylobacter and Salmonella cause large numbersof illnesses: between 2 and 2.4 million Campylobac-ter infections per year in the United States andabout 1.4 million Salmonella infections (Mead et al.1999). Treatment of Salmonella with antibiotics inthe United States may be as high as 40 percent ofcases (Molbak 2005), and about 10 percent ofCampylobacter infections require hospitalization
62 Union of Concerned Scientists
(Swartz 2002). Several factors may account for in-creased morbidity and mortality from antibiotic-resistant pathogens, including reduced efficacy ofinitial antibiotic choices, more limited choice oftreatment options aer diagnosis, and possible in-creased virulence of strains carrying antibiotic-resistance genes (Molbek 2005).
Resistance generated in animals also extends be-yond familiar pathogens to commensal bacteria(those that commonly reside in animals and peoplewithout causing illness). is is a concern becauseresistance traits may be passed between bacterialspecies—from food-borne bacteria to commensalbacteria residing in our gastrointestinal tract, for ex-ample (Nikolich et al. 1994). Some typically com-mensal bacteria—Enterococci, S. aureus, anduropathogenic strains of Escherichia coli—may alsocause serious disease under certain circumstances(e.g., during surgery, in patients with a compro-mised immune system, in patients using catheters).
In addition to causing disease through food con-sumption, other farm animal-associated bacteria,including S. aureus, may be passed to farmers, veteri-narians, and their families and communities throughdirect contact with animals. Serious “community-acquired” strains of such bacteria (those not acquiredin hospitals) have emerged in the past several years,with nearly 14 percent of MRSA infections acquiredoutside hospitals (Klevins et al. 2007).22
Recent work in the Netherlands has shown thata newly identified strain of MRSA has apparentlyemerged from farm animals and now comprisesmore than 20 percent of MRSA infections in thatcountry (van Loo et al. 2007). e new strain hasbeen found on pigs and cattle, and human infectionhas a strong geographic association with regionswhere these animals are raised. More recently, thisstrain has been isolated from pigs and pig farmers inCanada, and another strain found on Canadian pigsis known to cause infections in humans in theUnited States (Khanna et al. 2007).
Some urinary tract infections (UTIs) have re-cently been associated with antibiotic-resistant bac-teria possibly acquired from animal products. Abouthalf of all women experience at least one UTI dur-ing their lifetime, oen requiring antibiotic treat-ment, and the resulting cost of community-acquiredUTIs in the United States has been estimated to be$1.6 billion per year (Foxman 2002). Althoughmany are resolved relatively easily, some can lead tomore serious outcomes such as pyelonephritis orsepticemia.
Strains of antibiotic-resistant uropathogenicE. coli have been identified that bear substantial simi-larity to strains found on livestock (Ramchandaniet al. 2005). In addition, UTIs caused by strains ofE. coli resistant to multiple antibiotics, or by strainsresistant to ampicillin or cephalosporin antibiotics,have been associated with higher consumption ofpoultry or pork, respectively (Manges et al. 2007).ese studies suggest that antibiotic-resistant UTIsmay be acquired from food sources, and that such in-fections may lead to higher physician or hospitalcosts and other consequences of increased diseaseseverity.
Antibiotic-resistant strains that develop atCAFOs may continue to exist at high frequencieseven aer antibiotic use in animals has been discon-tinued or reduced, as demonstrated with van-comycin-resistant Enterococci in Denmark (Heueret al. 2002a and 2002b). Resistance can sometimespersist due to changes in the bacteria; for example,antibiotic-resistant pathogens that are less fit in theabsence of the antibiotic may acquire compensatorymutations over time that increase their ability topersist (Bjorkman et al. 2000; Levin and Bergstrom2000). Such mutations have been observed, as haveinherently high fitness levels, in antibiotic-resistantstrains of food-borne Campylobacter and Salmonella(Zhang 2006).
CAFOs Uncovered 63
22 S. aureus may be responsible for about 478 million hospitalizations per year in the United States, with MRSA strains causing about 19,000 deaths per year(Klevins et al. 2007).
The economic impact of antibiotic resistanceOne way to quantify the externalities associatedwith the overuse of antibiotics in CAFOs is to calcu-late the costs of the harm caused by antibiotic-resis-tant bacteria. ese costs include lost work days andthe increased medical costs involved in treatingmore severe disease.
One widely cited study estimated the total an-nual cost of antibiotic resistance approaches $30 bil-lion (Phelps 1989); Salmonella infections aloneaccount for about $2.5 billion per year (ERS 2008).e majority of these costs—about 88 percent—aredue to premature deaths. Because multi-drug resist-ance contributes substantially to disease severityand poor outcomes, this factor is likely to contributesubstantially to the cost of premature deaths, al-though no specific calculations are available.
Assuming most U.S. consumers eat animalproducts, eliminating the non-therapeutic use of an-imal antibiotics would cost about $5 to $10 per per-son per year, or an annual total of about $1.5 billionto $3 billion, due to increased production costs thatthe industry would pass on to consumers (NRC1999). ese estimates do not consider costs associ-ated with reducing therapeutic antibiotic use, whichmay be more common in CAFOs than some alter-native types of animal production. ough these es-timates are crude values, they serve to illustrate thesubstantial societal cost of antibiotic resistance asso-ciated with livestock production.
Health risks related to genetic uniformityAlthough disease in animals is an important con-cern with any kind of livestock production, somediseases may be exacerbated in CAFOs and otherAFOs. Concentrating animals in close proximity toone another generally enhances the potential trans-mission of microorganisms (Gilchrist et al 2007).
Under conditions of confinement, the naturalresistance of livestock to pathogens is therefore anespecially important factor in limiting the spread ofdisease—a factor generally strengthened by geneticdiversity among animals (Hedrick 2002; Wills andGreen 1995). Genetic diversity includes specific
variations known to play a role in disease resistance,such as polymorphic alleles in the major histocom-patibility complex (MHC) genes of the immune sys-tem (Vila, Seddon, and Ellegren 2005). Conversely,greater genetic uniformity increases the probabilitythat pathogens to which animals are susceptible willspread and cause harm.
Unlike natural animal populations, which typi-cally have considerable genetic diversity, animals inCAFOs have been bred for uniformity to facilitateindustrial-scale production, processing, and prod-uct consistency. Research has determined that thecontinuing intensification of livestock production,with its emphasis on a few breeds and geneticsources, is contributing to reduced genetic diversity,and that the animals bred for such industrial-scaleproduction may have less ability to resist diversepathogens (FAO 2007).
at study also found that at least 20 percent,and likely more, of the world’s livestock breeds are atrisk for extinction. Although the genetic diversity oflivestock remains relatively high globally, much ofthis diversity exists on small and subsistence farms,and diversity is declining both within breeds andthrough a reduction in the number of breeds. estudy concludes that, without intervention to stopthese trends, reduced genetic diversity could havenegative consequences for disease resistance andour ability to adapt varied methods of raising live-stock, such as pasture-based production, to awarmer climate.
Livestock breeding for CAFOs specifically em-phasizes characteristics such as meat quality andease of processing, rate of weight gain or milk pro-duction, and related properties (Blackburn et al.2003). is results in increasing genetic uniformityfor many species and breeds, reduced diversitywithin breeds, and a reduction in the number of pri-mary breeds. For example, the U.S. dairy herd isnow largely dominated by Holsteins, with muchsmaller numbers of Jerseys and a few other breeds.Swine operations rely on a few paternal lines includ-ing Duroc, Hampshire, and Berkshire, and maternalYorkshire and Landrace breeds. Because the poultry
64 Union of Concerned Scientists

sector uses proprietary lines, it is more difficult todetermine genetic diversity, but it is believed to benarrow.
In contrast to industrialized livestock produc-tion, alternative production systems oen requirebroader genetic diversity to match the needs of re-gional markets, climates, and other considerations.e growth of such systems has been recognized asan important means of preserving genetic diversity(Blackburn et al. 2003).
Summary of CAFO Externalities
CAFOs produce water and air pollution that harmsfisheries and forests, drinking water, and recre-ational facilities. Other externalities include healthproblems caused by fine particles that lodge in thelungs, foul odors, and antibiotic-resistant pathogens.All of these problems are caused largely by the ex-cessive numbers and crowding of animals inCAFOs, which result in too much manure in toosmall an area and the overuse of antibiotics to com-pensate for the stressful and unsanitary conditions.
Although it is difficult to attach monetary valuesto the harm caused by CAFOs, studies have esti-mated the cost of preventing at least some of thisharm through the proper distribution of CAFO ma-nure on farm fields. Even modest reductions ofwater and air pollution would cost more than $1 bil-lion per year, and calculations based on more realis-tic rates of manure distribution would likely pushthis number considerably higher.
Other types of damage caused by CAFOs thatcannot be completely addressed by proper manuredistribution include reduced quality of life for ruralcommunities (as indicated by lower property values),antibiotic-resistant pathogens, and increased geneticuniformity among livestock. Although these externali-ties cannot be adequately monetized at this time, theylikely add billions of dollars to the cost of CAFOs.
CAFOs Uncovered 65

ontrary to what many people believe, the pol-luting and unhealthy system of raising livestock
in crowded confinement facilities is not the most ef-ficient way to produce eggs, meat, and milk in an in-dustrial society, nor is it the inevitable outcome ofmarket forces that provide the United States withsufficient food. is report shows that the CAFOsystem is driven not by efficiency but primarily bythe market power held by large processors and pub-lic policy. Deliberate government policies that costtaxpayers billions of dollars every year helped to es-tablish this system and now keep it afloat.
Food animal production in the United States isdominated by a small number of very large proces-sors that either own animals or purchase themthrough production contracts—a system that favorsCAFOs and limits market access for smaller inde-pendent producers. CAFOs also have relied on arti-ficially cheap grain to offset the high fixed costs ofthe facilities and practices needed to produce largenumbers of animals. e consequences of this sys-tem can be measured in environmental, economic,societal, and health costs.
In contrast, alternatives to CAFOs—especiallymid-sized operations and those centered on pas-ture—have been shown to produce plentiful animalproducts at a comparable cost, and oen at a higherprofit than CAFOs.
Can Technology Fix CAFOs?
Increasing attention has been paid in recent years totechnological means of reducing the harm causedby CAFOs. ese technological “fixes” include feedformulations intended to reduce the nitrogen andphosphorus in manure, use of alum in manure hold-
ing facilities to remove much of the phosphorus,and lagoon covers and injection of manure into cropsoils to reduce ammonia volatilization. Althoughthese techniques and others may be useful—but inmost cases, imperfect—ways of reducing individualproblems caused by CAFOs, they all add to the costof production while failing to address the biggerpicture. Supporting alternative production methodsthat fundamentally avoid many of the problems as-sociated with CAFOs would be a better and morecost-effective approach.
One technological fix that has been attractingconsiderable attention involves the capture ofmethane from manure to produce natural gas (or“biogas”) that can be used as fuel. As discussed inthis report, methane is produced under the anaero-bic conditions found in many manure holding facil-ities such as lagoons.
While this technology would help reduce theodors and heat-trapping pollution created byCAFOs, it currently suffers from several limitations.First and most important, methane capture does notreduce the amount of nitrogen, phosphorus (inmost schemes), or water in manure. All of thesecomponents contribute to serious problems dis-cussed throughout this report. Biogas productionalso does not enhance manure’s value as a fertilizer,because CAFOs will face the same costs and hurdlesto distribute this technology’s liquid residues onfields as with liquid manure.
Finally, biogas production does not address ani-mal health or ethics issues related to overcrowdingand stress, the overuse of antibiotics that can com-promise human health and increase health costs, orsome of the economic impacts of CAFOs on ruralcommunities (such as reduced multiplier effects).
CAFOs Uncovered 67
C h a p t e r 4
CONCLUSIONS AND RECOMMENDATIONS
C
Wanted: Sound Agricultural Policy
Systems that are propped up by billions of dollars inpublic subsidies are not inevitable. e CAFO sys-tem has been nurtured by government policies thatfavor intensive, industrial-style production—oenat the public’s expense. ese policies include heav-ily subsidized feed grain, lack of accountability forwater and air pollution, counterproductive techno-logical fixes such as the non-therapeutic use of an-tibiotics in livestock, and an ill-equipped regulatorysystem that looks the other way rather than con-fronting the growing economic power of largeprocessors.
Because the success of CAFOs has dependedon favorable policies rather than any inherent ad-vantages in production methods, better policiescould reverse the damaging ways agriculture iscurrently practiced in this country. Such policieswould eliminate the artificial advantages currentlygranted to CAFOs, force CAFOs to take financialresponsibility for the environmental harm theycause, and support research that would furtherimprove alternative animal farming methods thathave already proven safer and better for ruralcommunities than CAFOs. Needed actions include:
Strict and vigorous enforcement of antitrustand anti-competitive practice laws under thePackers and Stockyards Act (which covercaptive supply, transparency of contracts, andaccess to open markets)
Strong enforcement of the Clean Water Act asit pertains to CAFOs, including improvedoversight at the state level or the takeover of re-sponsibilities currently delegated to the statesfor approving and monitoring NPDES permits;improvements could include more inspectorsand inspections, better monitoring and enforce-ment of manure-handling practices, andmeasurement of the effectiveness of pollutionprevention practices
Development of new regulations under theClean Air Act that would reduce emissions ofammonia and other air pollutants from CAFOs,and ensure that CAFO operators cannot avoidsuch regulations by encouraging ammoniavolatilization
Continued monitoring and reporting of ammo-nia and hydrogen sulfide emissions as requiredunder the Comprehensive EnvironmentalResponse, Compensation, and Liability Act(CERCLA, commonly referred to as the “Super-fund”) and the Emergency Planning andCommunity Right-to-Know Act (EPCRA)
Replacement of farm bill commodity cropsubsidies with subsidies that strengthen conser-vation programs and support prices whensupplies are high (rather than allowing pricesto fall below the cost of production)
Reduction of the current $450,000 EQIP projectcap to levels appropriate to smaller farms, witha focus on support for sound animal farmingpractices
Revision of slaughterhouse regulations to facili-tate larger numbers of smaller processors,including the elimination of requirements notappropriate for smaller facilities, combined withpublic health measures such as providingadequate numbers of federal inspectors orempowering and training state inspectors
Substantial funding for research to improvealternative animal production methods (espe-cially pasture-based) that are beneficial to theenvironment, public health, and ruralcommunities
We believe that if CAFOs were required to takefinancial responsibility for the harm they cause, andentry into markets for alternatives was not held backby a heavily concentrated processing industry andpublic policies, efficient and safer alternatives wouldflourish.
68 Union of Concerned Scientists
•
•
•
•
•
•
•
•


Aarestrup, F.M., A.M. Seyfarth, H.-D. Emborg, K.Pedersen, R.S. Hendriksen, and F. Bager. 2001. Ef-fect of abolishment of the use of antimicrobialagents for growth promotion on occurrence of an-timicrobial resistance in fecal Enterococci from foodanimals in Denmark. Antimicrobial Agents andChemotherapy 45(7):2054–2059.
Aillery, M., N. Gollehon, R. Johansson, J. Kaplan, N.Key, and M. Ribaudo. 2005. Managing manure toimprove air and water quality. Report no. 9.Economic Research Service, U.S. Departmentof Agriculture.
Anderson, N., R. Strader, and C. Davidson. 2003.Airborne reduced nitrogen: Ammonia emissionsfrom agriculture and other sources. Environment In-ternational 29:277–286.
Badgley, C., J. Moghtader, E. Quintero, E. Zakem,M.J. Chappell, K. Avilés-Vázquez, A. Samulon, andI. Perfecto. 2007. Organic agriculture and the globalfood supply. Renewable Agriculture and Food Sys-tems 22(2):86–108.
Baquero, F. 2001. Low-level antibacterial resistance:A gateway to clinical resistance. Drug Resistance Up-date 4(2):93–105.
Barker, J.C., and J.P. Zublena. 1995. Livestock ma-nure nutrient assessment in North Carolina. Final re-port. North Carolina Agricultural ExtensionService, North Carolina State University.
Becker, M.F., K.D. Peter, and J. Masoner. 2002. Possi-ble sources of nitrate in ground water at swine li-censed-managed feeding operations in Oklahoma,2001. WRI report 02–4257. U.S. Geological Survey.
Bjorkman, J., I. Nagaev, O.G. Berg, D. Hughes, andD.I. Andersson. 2000. Effects of environment oncompensatory mutations to ameliorate costs of an-tibiotic resistance. Science 287:1479–1481.
Blackburn, H.D., T. Stewart, D. Bixby, P. Siegal, andE. Bradford. 2003. United States of America countryreport. In State of the world’s animal genetic resources(Food and Agriculture Organization, United Na-tions). Agricultural Research Service, U.S. Depart-ment of Agriculture.
Boesch, D.F, R.B. Brinsfield, and R.E. Magnien.2001. Chesapeake Bay eutrophication: Scientific un-derstanding, ecosystem restoration, and challengesfor agriculture. Journal of Environmental Quality30:303–320.
Boessen, C., J.D. Lawrence, and G. Grimes. 2004.Production and marketing characteristics of U.S. porkproducers—2003. Working paper no. AEWP 2004-04. Department of Agricultural Economics, Univer-sity of Missouri.
Boody, G., B. Vondracek, D. Andow, M. Krinke, J.Westra, J. Zimmerman, and P. Welle. 2005. Multi-functional agriculture in the United States. Bio-Science 55(1):27–38.
Burkart, M., D. James, M. Liebman, and C. Herndl.2005. Impacts of integrated crop–livestock systemson nitrogen dynamics and soil erosion in westernIowa watersheds. Journal of Geophysical Research110:G01009, doi:10.1029/2004JG000008.
CAFOs Uncovered 71
REFERENCES

Burkholder, J.M., D.A. Dickey, C. Kinder, R.E. Reed,M.A. Mallin, G. Melia, M.R. McIver, L.B. Cahoon,C. Brownie, N. Deamer, J. Springer, H.B. Glasgow,D. Toms, and J. Smith. 2006. Comprehensive trendanalysis of nutrients and related variables in a largeeutrophic estuary: A decadal study of anthropogenicand climatic influences. Limnology and Oceanogra-phy 51:463–487.
Burkholder, J.M., M.A. Mallin, H.B. Glasgow, Jr.,L.M. Larsen, M.R. McIver, G.C. Shank, N. Deamer-Melia, D.S. Briley, J. Springer, B.W. Touchette, andE.K. Hannon. 1997. Impacts to a coastal river andestuary from rupture of a large swine waste holdinglagoon. Journal of Environmental Quality 26:1451–1466.
Castro, M.S., and C.T. Driscoll. 2002. Atmosphericnitrogen deposition to estuaries in the mid-Atlanticand northeastern United States. Environmental Sci-ence and Technology 36:3242–3249.
Centner, T.J. 2006. Governmental oversight of dis-charges from concentrated animal feeding opera-tions. Environmental Management 37(6):745–752.
Chapin, A, A. Rule, K. Gibson, T. Buckley, and K.Schwab. 2005. Airborne multidrug-resistant bacte-ria isolated from a concentrated swine feeding oper-ation. Environmental Health Perspectives 113(2):137–142.
Chee-Sanford, J.C., R.I. Aminov, I.J. Krapac, N. Gar-rigues-Jeanjean, and R.I. Mackie. 2001. Occurrenceand diversity of tetracycline resistance genes in la-goons and groundwater underlying two swine pro-duction facilities. Applied and EnvironmentalMicrobiology 67(4):1494–1502.
Chesapeake Bay Commission. 2003. e blue crab2003: Status of the Chesapeake population and itsfisheries. Blue Crab Technical Work Group.Online at http://www.chesbay.state.va.us/Publications/Blue%20Crab%202003.pdf,accessed on March 11, 2008.
Chesapeake Bay Project. 2007. Striped bass. Onlineat www.chesapeakebay.net/bfg_striped_bass.aspx?menuitem=14491, accessed on March 11, 2008.
Chism, J.W., and R.A. Levins. 1994. Farm spendingand local selling: How do they match up? MinnesotaExtension Service, University of Minnesota.Minnesota Agricultural Economist 676:1–4.
Clark, J.W., W. Viessman, Jr., and M.J. Hammer.1977. Water supply and pollution control. ird edi-tion. New York: IEP.
Clemens, J., and H-J. Ahlgrimm. 2001. Greenhousegases from animal husbandry: Mitigation options.Nutrient Cycling in Agroecosystems 60:287–300.
DeRamus, H.A., T.C. Clement, D.D. Giampola, andP.C. Dickison. 2003. Methane emissions of beef cat-tle on forages: Efficiency of grazing managementsystems. Journal of Environmental Quality 32(1):269–277.
DiGiacomo, G., C.J. Iremonger, L. Kemp, C. vanSchaik, and H. Murray. 2001. Sustainable farmingsystems: Demonstrating environmental and economicperformance. Minnesota Institute for SustainableAgriculture, University of Minnesota.
Donham, K.J., S. Wing, D. Osterberg, J.L. Flora, C.Hodne, K.M. u, and P.S. orne. 2007. Commu-nity health and socioeconomic issues surroundingCAFOs. Environmental Health Perspectives115(2):317–320.
Economic Research Service (ERS). 2008. Foodborneillness cost calculator. U.S. Department of Agricul-ture. Online at http://www.ers.usda.gov/Data/FoodborneIllness.
Economic Research Service (ERS). 2005. Historicand recent costs and returns. U.S. Department ofAgriculture.
72 Union of Concerned Scientists
CAFOs Uncovered 73
Emborg, H.D., J.S. Andersen, A.M. Seyfarth, S.R.Andersen, J. Boel, and H.C. Wegener. 2003. Rela-tions between the occurrence of resistance to an-timicrobial growth promoters among Enterococcusfaecium isolated from broilers and broiler meat.International Journal of Food Microbiology 84:273–284.
Emborg, H.D., and A.M. Hammerum. 2007. DAN-MAP 2006: Use of antimicrobial agents and occur-rence of antimicrobial resistance in bacteria from foodanimals, foods and humans in Denmark. Online athttp://www.danmap.org/pdfFiles/Danmap_2006.pdf,accessed on March 11, 2008.
Engberg, J., J. Neimann, E.M. Nielsen, F.M. Aare-strup, and V. Fussing. 2004. Quinolone-resistantCampylobacter infections in Denmark: Risk factorsand clinical consequences. Emerging Infectious Dis-eases 10(6):1056–1063.
Environmental Protection Agency (EPA). 2007. 40CFR Parts 122 and 412 proposed revised compli-ance dates under the National Pollutant DischargeElimination System permit regulations and effluentlimitations guidelines and standards for concen-trated animal feeding operations. Federal Register72(90):26582–26587.
Environmental Protection Agency (EPA). 2006. 40CFR Parts 122 and 412 revised National PollutantDischarge Elimination System permit regulationand effluent limitation guidelines for concentratedanimal feeding operations in response to Water-keeper decision; proposed rule. Federal Register71(126):37744–37787.
Environmental Protection Agency (EPA). 2005.National emission inventory—ammonia emissionsfrom animal husbandry operations. Revised drareport. Online at p://p.epa.gov/EmisInventory/2002finalnei/documentation/nonpoint/nh3inventory_dra_042205.pdf, accessed onMarch 11, 2008.
Environmental Protection Agency (EPA). 2003. Na-tional Pollutant Discharge Elimination System per-mit regulation and effluent limitation guidelines andstandards for concentrated animal feeding opera-tions (CAFOs). Federal Register 68(29):7176–7274.
Environmental Protection Agency (EPA). 2002.Technical support document for the revisions to theNational Pollutant Discharge Elimination Systemregulations for concentrated animal feeding opera-tions. Water Permits Division, Office of WastewaterManagement. Online at http://www.epa.gov/npdes/pubs/cafo_tech_support.pdf, accessed onMarch 11, 2008.
Fan, A.M., and V.E. Steinberg. 1996. Health implica-tions of nitrate and nitrite in drinking water: An up-date on methemoglobinemia occurrence andreproductive and developmental toxicity. RegulatoryToxicology and Pharmacology 23:35–43
Fanatico, A. 2003. Small-scale poultry processing.National Center for Appropriate Technology.Online at http://attra.ncat.org/attra-pub/PDF/poultryprocess.pdf, accessed on March 11, 2008.
Ferm, M. 1998. Atmospheric ammonia and ammo-nium transport in Europe and critical loads: A re-view. Nutrient Cycling in Agroecosystems 51:5–17.
Food and Agriculture Organization (FAO). 2007.e state of the world’s animal genetic Resources forfood and agriculture. United Nations.
Foxman, B. 2002. Epidemiology of urinary tract in-fections: Incidence, morbidity, and economic costs.American Journal of Medicine 113(suppl. 1A):5S–13S
Gegner, L. 2004. Hog production alternatives. Na-tional Center for Appropriate Technology. Online athttp://www.attra.org/attra-pub/PDF/hog.pdf, ac-cessed on March 11, 2008.

General Accounting Office (GAO). 2003. IncreasedEPA oversight will improve environmental programfor concentrated animal feeding operations. Reportno. GAO-03-285.
General Accounting Office (GAO). 2000. Packersand stockyards program: Actions needed to improveinvestigations of competitive practices. Report no.GAO/RCED-00-242.
Gilchrist, M.J., C. Greko, D.B. Wallinga, G.W. Beran,D.G. Riley, and P.S. orne. 2007. e potential roleof concentrated animal feeding operations in infec-tious disease epidemics and antibiotic resistance.Environmental Health Perspectives 115(2):313–316.
Goolsby, D.A., W.A. Battaglin, G.B. Lawrence, R.S.Artz, B.T. Aulenbach, R.P. Hooper, D.R. Keeney, andG.J. Stensland. 1999. Flux and sources of nutrients inthe Mississippi-Atchafalaya River Basin. Topic paperno. 3. Integrated Assessment on Hypoxia in the Gulfof Mexico, NOAA Coastal Ocean Program decisionanalysis series no. 17. National Oceanic and Atmos-pheric Administration.
Government Accountability Office (GAO). 2006.Packers and stockyards programs: Continuing prob-lems with GIPSA investigations of competitive prac-tices. Report no. GAO-06-532T.
Government Accountability Office (GAO). 2005.Livestock market reporting: USDA has taken somesteps to ensure quality, but additional efforts areneeded. Report no. GAO-06-202.
Grain Inspection, Packers, and Stockyards Adminis-tration (GIPSA). 2002. Captive supply of cattle andGIPSA’s reporting of captive supply. U.S. Depart-ment of Agriculture.
Green, C.F., S.G. Gibbs, P.M. Tarwater, L.C. Mota,and P.V. Scarpino. 2006. Bacterial plume emanatingfrom the air surrounding swine confinement opera-tions. Journal of Occupational and EnvironmentalHygiene 3:9–15.
Hayes, D.J., and H.H. Jensen. 2003. Lessons fromthe Danish ban on feed-grade antibiotics. Briefingpaper 03-BP 41. Center for Agricultural and RuralDevelopment, Iowa State University.
Hedrick, P.W. 2002. Pathogen resistance and geneticvariation at MHC loci. Evolution 56(10):1902–1908.
Heffernan, W.D. 2000. Concentration of ownershipand control in agriculture. In Hungry for profit: eagribusiness threat to farmers, food, and the environ-ment, edited by F. Magdoff, J.B. Foster, and F.H. But-tel. New York: Monthly Review Press, 61–76.
Hendrickson, M., and W. Heffernan. 2005. Concen-tration of agricultural markets, January 2005. De-partment of Rural Sociology, University of Missouri.Online at http://www.foodcircles.missouri.edu/CRJanuary05.pdf.
Hendrickson, M., W. Heffernan. P H. Howard, andJ.B. Heffernan. 2001. Consolidation in food retailingand dairy: Implications for farmers and consumersin a global food system. National Farmers Union.Online at http://www.foodcircles.missouri.edu/whstudy2.pdf
Heuer O.E., K. Pedersen, J.S. Andersen, and M.Madsen. 2002a. Vancomycin-resistant enterococci(VRE) in broiler flocks 5 years aer the avoparcinban. Microbial Drug Resistance 8(2):133–138.
Heuer, O.E., K. Pedersen, L.B. Jensen, M. Madsen,and J.E. Olsen. 2002b. Persistence of vancomycin-resistant enterococci (VRE) in broiler houses aerthe avoparcin ban. Microbial Drug Resistance8(4):355–361.
Hicks, B. 2007. Beef cattle research update. Okla-homa State University. Online at http://oaes.pss.okstate.edu/goodwell/Publications/Animal%20Science/OSU%20Beef%20Cattle%20Research%20Update%20June%202007.pdf, accessed onMarch 11, 2008.
74 Union of Concerned Scientists

Hill, J., E. Nelson, D. Tilman, S. Polasky, andD.Tiffany. 2006. Environmental, economic, and en-ergetic costs and benefits of biodiesel and ethanolbiofuels. Proceedings of the National Academy of Sci-ences 103(30):11206–11210.
Honeyman, M.S., and J.D. Harmon. 2003. Perform-ance of finishing pigs in hoop structures and con-finement during winter and summer. Journal ofAnimal Science 81:1663–1670.
Honeyman, M.S., J.D. Harmon, S.C. Shouse, W.D.Busby, and D.L. Maxwell. 2008. Feasibility of bed-ded hoop barns for market beef cattle in Iowa: Cat-tle performance, bedding use, and environment.Applied Engineering in Agriculture 24(2):1–6.
Honeyman, M.S., and W.B. Roush. 1999. Supple-mentation of mid-gestation swine grazing alfalfa.American Journal of Alternative Agriculture14(3):103–108.
Hoshide, A.K., T.J. Dalton, and S.N. Smith. 2006.Profitability of coupled potato and dairy farms inMaine. Renewable Agriculture and Food Systems21(4):261–272.
Hubbard, R.K., G.L. Newton, and G.M. Hill. 2003.Water quality and the grazing animal. Journal of An-imal Science 82(suppl. E):E255–E263.
Huffman, R.L., and P.W. Westerman.1995. Esti-mated seepage losses from established swine wastelagoons in the lower coastal plain of North Carolina.Transactions of the American Society of AgriculturalEngineers 38:449–453.
Ikerd, J. 2004. Do we need large-scale confinementanimal feeding operations? Online at http://web.missouri.edu/~ikerdj/papers/Kellogg-Taho-CAFOs.htm, accessed on March 11, 2008.
Inglis, G.D., T.A. McAllister, H.W. Busz, L.J. Yanke,D.W. Morck, M.E. Olson, and R.R. Read. 2005. Ef-fects of subtherapeutic administration of antimicro-bial agents to beef cattle on the prevalence ofantimicrobial resistance in Campylobacter jejuni andCampylobacter hyointestinalis. Applied and Environ-mental Microbiology 71(7):3872–3881.
Jacob, M.E., J.T. Fox, J.S. Drouillard, D.G. Renter,and T.G. Nagaraja. 2007. Effects of dried distillers’grain on fecal prevalence and growth of Escherichiacoli O157 in batch culture fermentations from cattle.Applied and Environmental Microbiology 74(1):38–43.
Johnson, C.J., and B.C. Kross. 1990. Continuing im-portance of nitrate contamination of groundwaterand wells in rural areas. American Journal of Indus-trial Medicine 18:449–456.
Karr, J.D., W.J. Showers, J.W. Gilliam, and A.S. An-dres. 2001. Tracing nitrate transport and environ-mental impact from intensive swine farming usingdelta nitrogen-15. Journal of Environmental Quality30:1163–1175.
Kellogg, R.L., C.H. Lander, D.C. Moffit, and N.Gollehon. 2000. Manure nutrients relative to the ca-pacity of cropland and pastureland to assimilate nu-trients: Spatial and temporal trends for the UnitedStates. Natural Resources Conservation Service,U.S. Department of Agriculture.
Key, N., and W. McBride. 2003. Production con-tracts and productivity in the U.S. hog sector. Ameri-can Journal of Agricultural Economics 85(1):121–133.
Khanna T., R. Friendship, C. Dewey, and J.S. Weese.2007. Methicillin-resistant Staphylococcus aureuscolonization in pigs and pig farmers. Veterinary Mi-crobiology 128(3-4):298–303, doi:10.1016/j.vetmic.2007.10.006.
CAFOs Uncovered 75

Klevens, R.M., M.A. Morrison, J. Nadle, S. Petit, K.Gershman, S. Ray, L.H. Harrison, R. Lynfield, G.Dumyati, J.M. Townes, A.S. Craig, E.R. Zell, G.E.Fosheim, L.K. McDougal, R.B. Carey, and S.K. Frid-kin. 2007. Invasive methicillin-resistant Staphylococ-cus aureus infections in the United States. Journal ofthe American Medical Association 298(15):1763–1771.
Kliebenstein, J., B. Larson, M. Honeyman, and A.Penner. 2003. A comparison of production costs, re-turns and profitability of swine finishing systems. De-partment of Economics Working Papers Series,Iowa State University.
Knoeber, C.R., and W.N. urman. 1995. “Don’tcount your chickens . . . ”: Risk and risk shiing inthe broiler industry. American Journal of Agricul-tural Economics 77:486–496.
Koike, S., I.G. Krapac, H.D. Oliver, A.C. Yannarell,J.C. Chee-Sanford, R.I. Aminov, and R.I. Mackie.2007. Monitoring and source tracking of tetracy-cline resistance genes in lagoons and groundwateradjacent to swine production facilities over a 3-yearperiod. Applied and Environmental Microbiology73(15):4813–4823.
Koopmans, G.F., W.J. Chardon, and R.W. McDowell.2007. Phosphorus movement and speciation in asandy soil profile aer long-term animal manure ap-plications. Journal of Environmental Quality 36:305–315.
Krupa, S.V. 2003. Effects of atmospheric ammonia(NH3) on terrestrial vegetation: A review. Environ-mental Pollution 124:179–221.
Kuhn, I., A. Iversen, M. Finn, C. Greko, L.G. Bur-man, A.R. Blanch, X. Vilanova, A. Manero, H. Tay-lor, J. Caplin, L. Domınguez, I.A. Herrero, M.A.Moreno, and R. Mollby. 2005. Occurrence and relat-edness of vancomycin-resistant Enterococci in ani-mals, humans, and the environment in differentEuropean regions. Applied and Environmental Mi-crobiology 71(9):5383–5390.
Lambert, D.K., and W.W. Wilson. 2003. Valuing va-rieties with imperfect output quality measurement.American Journal of Agricultural Economics 85(1):95–107.
Landblom, D.G., W.W. Poland, B. Nelson, and E.Janzen. 2001. An economic analysis of swine rearingsystems for North Dakota. Annual report. Dickin-son Research Extension Center, North Dakota StateUniversity. Online at http://www.ag.ndsu.nodak.edu/dickinso/research/2000/swine00c.htm, accessed onMarch 11, 2008.
Lawrence, J., D. Otto, and S. Meyer. 1997. Purchas-ing patterns of hog producers: Implications for ruralagribusiness. Journal of Agribusiness 15:1–18.
Levin, B.R., and C.T. Bergstrom. 2000. Bacteria aredifferent: Observations, interpretations, specula-tions, and opinions about the mechanisms of adap-tive evolution in prokaryotes. Proceedings of theNational Academy of Sciences 97(13):6981–6985.
Liebig, M.A., J.A. Morgan, J.D. Reeder, B.H. Ellert,H.T. Gollany, and G.E. Schuman. 2005. Greenhousegas contributions and mitigation potential of agri-cultural practices in northwestern U.S.A. and west-ern Canada. Soil Tillage Research 83:25–52.
Lipsitch, M., R.S. Singer, and B.R. Levin. 2002. An-tibiotics in agriculture: When is it time to close thebarn door? Proceedings of the National Academy ofSciences 99(9):5752–5754.
MacDonald, J.M., M.C. Ahearn, and D. Banker.2004. Organizational economics in agriculture pol-icy analysis. American Journal of Agricultural Eco-nomics 86(3):744–749.
MacDonald, J.M., M. Ollinger, K.E. Nelson, andC.R. Handy. 2000. Consolidation in U.S. meatpack-ing. Agricultural economic report no. 785. Eco-nomic Research Service, U.S. Department ofAgriculture.
76 Union of Concerned Scientists

MacDonald, J., J. Perry, M. Ahearn, D. Banker, W.Chambers, C. Dimitri, N. Key, K. Nelson, and L.Southard. 2004. Contracts, markets, and prices: Or-ganizing the production and use of agricultural com-modities. Agricultural economic report no. 837.Economic Research Service, U.S. Department ofAgriculture.
Mackie, R.I., P.G. Stroot, and V.H. Varel. 1998. Bio-chemical identification and biological origin of keyodor components in livestock waste. Journal of Ani-mal Science 76:1331–1342.
Mallin, M.A. 2000. Impacts of industrial-scale swineand poultry production on rivers and estuaries.American Scientist 88:26–37.
Mallin, M.A., J.M. Burkholder, M.R. McIver, G.C.Shank, H.B. Glasgow, Jr., B.W. Touchette, and J.Springer. 1997. Comparative effects of poultry andswine waste lagoon spills on the quality of receivingstreamwaters. Journal of Environmental Quality26:1622–1631.
Mallin, M.A., and L.B. Cahoon. 2003. Industrializedanimal production: A major source of nutrient andmicrobial pollution to aquatic ecosystems. Popula-tion and Environment 24(5):369–385.
Mallin, M.A., and C.A. Corbett. 2006. Multiplehurricanes and different coastal systems: How hur-ricane attributes determine the extent of environ-mental impacts. Estuaries and Coasts 29:1046–1061.
Manges, A.R., S.P. Smith, B.J. Lau, C.J. Nuval, J.N.Eisenberg, P.S. Dietrich, and L.W. Riley. 2007. Retailmeat consumption and the acquisition of antimicro-bial resistant Escherichia coli causing urinary tractinfections: A case-control study. FoodbornePathogens and Disease 4(4):419–431.
Martin, A. 2006. Fowl runoff spurs fierce poultryfight: Amid suits over water pollution from manure,the chicken industry asks Congress for relief.Chicago Tribune, June 13. Online at http://www.redorbit.com/news/science/536438/fowl_runoff_spurs_fierce_poultry_fight_amid_suits_over_water/index.html, accessed on March 11, 2008.
Mattocks, J. 2002. Pastured-raised poultry nutrition.Heifer International. Online at http://www.sustainablepoultry.ncat.org/downloads/chnutritionhpinew.pdf, accessed on March 11, 2008.
May, G., W. Edwards, and J. Lawrence. 2003. Live-stock enterprise budgets for Iowa: 2003. Iowa StateUniversity Extension.
McBride, W.D., and N. Key. 2007. Characteristicsand production costs of U.S. hog farms, 2004. Eco-nomic information bulletin no. 32. Economic Re-search Service, U.S. Department of Agriculture.
McBride, W.D., and N. Key. 2003. Economic andstructural relationships in U.S. hog production.Agricultural economic report no. 818. ResourceEconomics Division, Economic Research Service,U.S. Department of Agriculture.
McCubbin, D.R., B.J. Apelberg, S. Roe, and F. Divita,Jr. 2002. Livestock ammonia management and par-ticulate-related health benefits. Environmental Sci-ence and Technology 36(6):1141–1146.
Mead, P.S., L. Slutsker, V. Dietz, L.F. McCaig, J.S.Bresee, C. Shapiro, P.M. Griffin, and R.V. Tauxe.1999. Food-related illness and death in the UnitedStates. Emerging Infectious Diseases 5(5):607–625.
Mellon, M., C. Benbrook, and K.L. Benbrook. 2002.Hogging it! Estimates of antimicrobial abuse in live-stock. Cambridge, MA: Union of ConcernedScientists.
CAFOs Uncovered 77
Molbak, K. 2005. Human health consequences ofantimicrobial drug-resistant Salmonella and otherfoodborne pathogens. Clinical Infectious Diseases41:1613–1620.
Mubarak, H., T.G. Johnson, and K.K. Miller. 1999.e impacts of animal feeding operations on ruralland values. Report R-99-02. College of Agriculture,Food and Natural Resources, University of Mis-souri–Columbia.
Murray, B. 2003. Full economic feasibility assessmentof the Smithfield Foods agreement: Environmentalmodeling and benefits components. Progress report.Animal and Poultry Waste Management Center,North Carolina State University. Online at http://www.p2pays.org/ref/32/31218/RTImodelingbenefits.pdf, accessed on March 11, 2008.
National Agricultural Statistics Service (NASS).2008a. Quick stats. U.S. Department of Agriculture.Online at http://www.nass.usda.gov/Statistics_by_Subject/index.asp, accessed on March 11, 2008.
National Agricultural Statistics Service (NASS).2008b. Agricultural prices. U.S. Department of Agri-culture. Online at http://www.nass.usda.gov/Charts_and_Maps/Agricultural_Prices, accessed onMarch 11, 2008.
National Agricultural Statistics Service (NASS).2007. Farms, land in farms, and livestock opera-tions: 2006 summary. U.S. Department ofAgriculture.
National Agricultural Statistics Service (NASS).2002a. Census of agriculture. U.S. Department ofAgriculture. Online at http://www.agcensus.usda.gov/ Publications/2002/index.asp.
National Agricultural Statistics Service (NASS).2002b. Agricultural atlas of the United States: Live-stock, poultry, and other animals. U.S. Departmentof Agriculture. Online at http://www.nass.usda.gov/research/atlas02.
National Atmospheric Deposition Program(NADP). 2003. 2002 annual summary. Data report2003-01. Champaign, IL: Illinois State Water Survey.
National Research Council (NRC). 2004. Air emis-sions from animal feeding operations: Current knowl-edge, future needs. National Academies of Science.Washington, DC: National Academies Press.
National Research Council (NRC). 1999. e use ofdrugs in food animals: Benefits and risks. NationalAcademies of Science. Washington, DC: NationalAcademies Press.
Natural Resources Conservation Service (NRCS).2008a. Arkansas 2008 state EQIP sign-up and appli-cation information. U.S. Department of Agriculture.Online at p://p-fc.sc.egov.usda.gov/AR/eqip/Arkansas_2008_State_EQIP_Policy.pdf, accessedon March 11, 2008.
Natural Resources Conservation Service (NRCS).2008b. Iowa EQIP. U.S. Department of Agriculture.Online at http://www.ia.nrcs.usda.gov/programs/stateeqip.html, accessed on March 11, 2008.
Natural Resources Conservation Service (NRCS).2008c. Environmental quality incentives program(EQIP): North Carolina. U.S. Department of Agri-culture. Online at http://www.nc.nrcs.usda.gov/Programs/EQIP/index.html, accessed onMarch 11, 2008.
Natural Resources Conservation Service (NRCS).2007a. Environmental quality incentives program:FY-2006 national livestock cost-share data. U.S. De-partment of Agriculture. Online at http://www.nrcs.usda.gov/programs/eqip/2006_Livestock/2006_national_livestock.pdf, accessed on March 11, 2008.
Natural Resources Conservation Service (NRCS).2007b. Statewide EQIP program initiatives andfunding information. U.S. Department of Agricul-ture. Online at http://www.ca.nrcs.usda.gov/programs/eqip/2007/statepriorities2007.html,accessed on March 11, 2008.
78 Union of Concerned Scientists

Natural Resources Conservation Service (NRCS).2007c. Environmental quality incentives [sic] pro-gram (EQIP) California NRCS statewide waterquality initiative: Dairy-confined animal operationprogram—fiscal year 2007. U.S. Department ofAgriculture. Online at p://p-fc.sc.egov.usda.gov/CA/programs/EQIP/2007/AFO_EQIP_FY07_PD.pdf,accessed on March 11, 2008.
Natural Resources Conservation Service (NRCS).2007d. 2007 Arkansas annual report. U.S. Depart-ment of Agriculture. Online at p://p-fc.sc.egov.usda.gov/AR/pubs/07_annual_report.pdf, accessedon March 11, 2008.
Natural Resources Conservation Service (NRCS).2007e. 2006 Environmental Quality Incentives Pro-gram. Online at http://www.ga.nrcs.usda.gov/programs/eqip06.html.
Natural Resources Conservation Service (NRCS).2003. Environmental quality incentives program.Federal Register 68(104):32337–32355.
Natural Resources Conservation Service (NRCS).2002. Risk assessment for the EQIP program. U.S.Department of Agriculture. Online at http://www.nrcs.usda.gov/programs/Env_Assess/EQIP/EQIP_RA_121002.pdf, accessed on March 11, 2008.
Nikolich, M.P., G. Hong, N.B. Shoemaker, and A.A.Salyers. 1994. Evidence for natural horizontal trans-fer of tetQ between bacteria that normally colonizehumans and bacteria that normally colonize live-stock. Applied and Environmental Microbiology60(9):3255–3260.
Ollinger, M., J.M. MacDonald, and M. Madison.2005. Technological change and economies of scalein U.S. poultry processing. American Journal ofAgricultural Economics 87(1):116–129.
Ollinger, M., J. MacDonald, and M. Madison. 2000.Structural change in U.S. chicken and turkey slaugh-ter. Agricultural economic report no. 787. EconomicResearch Service, U.S. Department of Agriculture.
Phelps, C.E. 1989. Bug/drug resistance. MedicalCare 27:194–203.
Phillips, I., M. Casewell, T. Cox, B. De Groot, C.Friis, R. Jones, C. Nightingale, R. Preston, and J.Waddell. 2004. Does the use of antibiotics in foodanimals pose a risk to human health? A critical re-view of published data. Journal of AntimicrobialChemotherapy 53:28–52.
Pimentel, D., and M. Pimentel. Sustainability ofmeat-based and plant-based diets and the environ-ment. American Journal of Clinical Nutrition78(suppl.):660S–663S
Rabalais, N.N., R.E. Turner, and W.J. Wiseman, Jr.2001. Hypoxia in the Gulf of Mexico. Journal of En-vironmental Quality 30:320–329.
Ramchandani, M., A.R. Manges, C. DebRoy, S.P.Smith, J.R. Johnson, L.W. Riley. 2005. Possible ani-mal origin of human-associated, multidrug-resis-tant, uropathogenic Escherichia coli. Clinical andInfectious Disease 40(2):251–257.
Ray, D., D. De La Torre Ugarte, and K. Tiller. 2003.Rethinking US agricultural policy: Changing course tosecure farmer livelihoods worldwide. AgriculturalPolicy Analysis Center, University of Tennessee.
Ribaudo, M., N. Gollehon, M. Aillery, J. Kaplan, R.Johansson, J. Agapoff, L. Christensen, V. Breneman,and M. Peters. 2003. Manure management for waterquality: Costs to animal feeding operations of apply-ing manure nutrients to land. Agricultural economicreport no. 824. Economic Research Service, Re-source Economics Division, U.S. Department ofAgriculture.
Rotz, C.A. 2004. Management to reduce nitrogenlosses in animal production. Journal of Animal Sci-ence 82(suppl. E):E119–E137.
Russelle, M.P., M.H. Entz, and A.J. Franzluebbers.2007. Reconsidering integrated crop–livestock sys-tems in North America. Agronomy Journal 99:325–334.
CAFOs Uncovered 79

Sapkota, A.R., F.C. Curriero, K.E. Gibson, and K.J.Schwab. 2007. Antibiotic-resistant Enterococci andfecal indicators in surface water and groundwaterimpacted by a concentrated swine feeding opera-tion. Environmental Health Perspectives 115:1040–1045.
Sayah, R.S., J.B. Kaneene, Y. Johnson, and R. Miller.2005. Patterns of antimicrobial resistance observedin Escherichia coli isolates obtained from domestic-and wild-animal fecal samples, human septage, andsurface water. Applied and Environmental Microbiol-ogy 17:1394–1404.
Schingoethe, D.J. 2006. Utilization of DDGS by cat-tle. In Proceedings of the 27th Western NutritionConference, 61–74. Online at http://www.ddgs.umn.edu/articles-dairy/2006-Schingoethe-%20Utilization%20of%20DDGS%20by%20cattle.pdf,accessed on March 11, 2008.
Shea, K.M. 2004. Nontherapeutic use of antimicro-bial agents in animal agriculture: Implications forpediatrics. Pediatrics 114:862–868.
Sheeder, S.A., J.A. Lynch, and J.Grimm. 2002. Mod-eling atmospheric nitrogen deposition and trans-port in the Chesapeake Bay watershed. Journal ofEnvironmental Quality 31:1194–1206.
Singh, K.V., G.M. Weinstock, and B.E. Murray.2002. An Enterococcus faecalis ABC homologue(Lsa) is required for the resistance of this species toclindamycin and quinupristin-dalfopristin. Antimi-crobial Agents and Chemotherapy 46(6):1845–1850.
Smith, D.L., A.D. Harris, J.A. Johnson, E.K. Sil-bergeld, and J.G. Morris, Jr. 2002. Animal antibioticuse has an early but important impact on the emer-gence of antibiotic resistance in human commensalbacteria. Proceedings of the National Academy of Sci-ences 99(9):6434–6439.
Soil Conservation Service. 1992. Agricultural wastecharacteristics. In Agricultural waste managementfield handbook. U.S. Department of Agriculture.
Starmer, E. 2007. Personal communication with theauthor.
Starmer, E., and T.A. Wise. 2007a. Living high on thehog: Factory farms, federal policy, and the structuraltransformation of swine production. Working paperno. 07-04. Global Development and EnvironmentInstitute, Tus University.
Starmer, E., and T.A.Wise. 2007b. Feeding at thetrough: Industrial livestock firms saved $35 billionfrom low feed prices. Policy brief no. 07–03. GlobalDevelopment and Environment Institute, TusUniversity.
Starmer, E., A. Witteman, and T.A. Wise. 2006.Feeding the factory farm: Implicit subsidies to thebroiler chicken industry. Working paper no. 06–03.Global Development and Environment Institute,Tus University.
Swartz, M.H. 2002. Human diseases caused by food-borne pathogens of animal origin. Clinical InfectiousDiseases 34(suppl. 3):S111–S122.
u, K. 2001. Public health concerns for neighborsof large-scale swine production operations. Journalof Agricultural Safety and Health 8(2):175–184.
u, K., K. Donham, R. Ziegenhorn, S. Reynolds, P.orne, P. Subramanian, P. Whitten, and J. Stookes-berry. 1997. A control study of the physical andmental health of residents living near a large-scaleswine operation. Journal of Agricultural Safety andHealth 3(1):13–26.
Tilman, D., K.G. Cassman, P.A. Matson, R. Naylor,and S. Polasky. 2002. Agricultural sustainability andintensive production practices. Nature 418:671–677.
Toth, J.D., Z. Dou, J.D. Ferguson, D.T. Galligan, andC.F. Ramberg, Jr. 2006. Nitrogen- vs. phosphorus-based dairy manure applications to field crops: Ni-trate and phosphorus leaching and soil phosphorusaccumulation. Journal of Environmental Quality35:2302–2312.
80 Union of Concerned Scientists

Travers, K., and M. Barza. 2002. Morbidity of infec-tions caused by antimicrobial-resistant bacteria.Clinical and Infectious Diseases 34(suppl. 3):S131–S134.
U.S. Department of Agriculture (USDA). 2006.Grain Inspection, Packers and Stockyards Adminis-tration’s management and oversight of the packersand stockyards programs. Audit report no. 30601-01-Hy. Office of Inspector General, Northeast Region.Online at http://www.usda.gov/oig/webdocs/30601-01-HY.pdf.
U.S. Geological Survey (USGS). 1995. Groundwater. Fact sheet FS-058-95. Online at http://water.usgs.gov/wid/html/GW.html, accessed onMarch 11, 2008.
van Es, H.M., R.R. Schindelbeck, and W.E. Jokela.2004. Effect of manure application timing, crop, andsoil type on phosphorus leaching. Journal of Envi-ronmental Quality 33:1070–1080.
van Loo, I., X. Huijsdens, E. Tiemersma, A. de Neel-ing, N. van de Sande-Bruinsma, D. Beaujean, A.Voss, and J. Kluytmans. 2007. Emergence of methi-cillin-resistant Staphylococcus aureus of animal ori-gin in humans. Emerging Infectious Diseases13(12):1834–1839.
Varma, J.K., K.D. Greene, J. Ovitt, T.J. Barrett, F.Medalla, and F.J. Angulo. 2005. Hospitalization andantimicrobial resistance in Salmonella outbreaks,1984–2002. Emerging Infectious Diseases 11(6):943–946.
Varma, J.K., K. Mølbak, T.J. Barrett, J.L. Beebe, T.F.Jones, T. Rabatsky-Ehr, K.E. Smith, D.J. Vugia, H.-G.H. Chang, and F.J. Angulo. 2005. Antimicrobial-resistant nontyphoidal Salmonella is associated withexcess bloodstream infections and hospitalizations.Journal of Infectious Diseases 191:554–561.
Vila, C., J. Seddon, and H. Ellegren. 2005. Genes ofdomestic mammals augmented by backcrossingwith wild ancestors. Trends in Genetics 21(4):214–218.
Vitousek, P.M., J.D. Aber, R.W. Howarth, G.E.Likens, P.A. Matson, D.W. Schindler, W.H.Schlesinger, and D.G. Tilman. 1997. Human alter-ation of the global nitrogen cycle: Sources and con-sequences. Ecological Applications 7(3):737–750.
Volland, C, J. Zupancic, and J. Chappelle. 2003. Costof remediation of nitrogen-contaminated soilsunder CAFO impoundments. Journal of HazardousSubstance Research 4:1–18.
Vukina, T. 2004. Livestock production contracts,waste management and the environment. NorthCarolina State Economist, January/February.
Walker, J.T., V.P. Aneja, and D.A. Dickey. 2000. At-mospheric transport and wet deposition on ammo-nium in North Carolina. Atmospheric Environment34:3407–3418.
Wang, Z., S. Cerrate, C. Coto, F. Yan, and P.W. Wal-droup. 2007. Effect of rapid and multiple changes inlevel of distillers dried grain with solubles (DDGS)in broiler diets on performance and carcass charac-teristics. International Journal of Poultry Science6(10):725–731.
Weida, W.J. 2004a. Considering the rationales for fac-tory farming. Presentation. Environmental HealthImpacts of CAFOs: Anticipating Hazards—Search-ing for Solutions, March 29, Iowa City, IA.
Weida, W. 2004b. e CAFO: Implications for ruraleconomies in the US. Global Resource Action Centerfor the Environment (GRACE).
Weldon, M.B., and K.C. Hornbuckle. 2006. Concen-trated animal feeding operations, row crops, andtheir relationship to nitrate in eastern Iowa rivers.Environmental Science and Technology 40:3168–3173.
CAFOs Uncovered 81
Whitney, M.H., G.C. Shurson, L.J. Johnston, D.M.Wulf, and B.C. Shanks. 2006. Growth performanceand carcass characteristics of grower-finisher pigsfed high-quality corn distillers dried grain with sol-ubles originating from a modern Midwesternethanol plant. Journal of Animal Science 84:3356–3363.
Wills, C., and D.R. Green. 1995. A genetic herd-im-munity model for the maintenance of MHC poly-morphism. Immunological Reviews 143:263–292.
Wing, S., and S. Wolf. 2000. Intensive livestock op-erations, health, and quality of life among easternNorth Carolina residents. Environmental Health Per-spectives 108(3):233–238.
World Health Organization (WHO). 2003. Impactsof antimicrobial growth promoter termination inDenmark: e WHO international review panel’sevaluation of the termination of the use of antimicro-bial growth promoters in Denmark. Foulum, Den-mark: Department of Communicable Diseases,Prevention and Eradication, Centre for Antimicro-bial Resistance in Foodborne Pathogens.
Zhang, Q., O. Sahin, P.F. McDermott, and S. Payot.2006. Fitness of antimicrobial-resistant Campylobac-ter and Salmonella. Microbes and Infection 8:1972–1978.
82 Union of Concerned Scientists

CAFOs Uncovered 83
AFO (animal feeding operation)A facility or feedlot where animals are confined athigh densities and fed grain for at least 45 days ayear. Includes CAFOs as well as smaller operations.
Alternative animal productionAnimal farming other than CAFOs, including sus-tainable practices such as access to pasture andmaintaining animals in small enough numbers or atlow enough densities that the nearby land can safelyabsorb the animals’ manure.
Animal unit (AU)A value for counting animals that allows compari-son between livestock species. For example, the EPAdefines one AU as equal to one beef cow of feedlotsize (typically at least 500 lb. when entering thefeedlot) or 2.5 hogs over 55 lb.
BiogasCombustible fuel produced from the methane inCAFO manure.
CAFO (confined animal feeding operation)A large facility with at least 1,000 animal units(AU). e EPA defines a CAFO as a facility thathouses at least 700 dairy cows, 1,000 beef cattle,2,500 hogs over 55 lb., 30,000 broiler chickens pro-ducing wet manure, 125,000 broiler chickens pro-ducing dry manure (litter), or 82,000 laying hens.e EPA also defines smaller operations as CAFOsif they discharge manure directly into waterways.
Captive supplyLivestock owned or controlled (through contractarrangements) by a meat processor. High percent-ages of captive supply can reduce spot markets, po-tentially resulting in lower prices for producers thanin a healthy open market.
Clean Water Acte federal law that regulates water pollution.
CommensalOrganisms, such as bacteria, living in close associa-tion with other organisms in an arrangement that isbeneficial to one party and does not harm eitherparty. Some bacteria have a commensal relationshipwith their livestock hosts but are pathogenic tohumans.
Commodity cropsCrops that are eligible to receive subsidies underTitle I of the federal farm bill, including corn,wheat, rice, soybeans, and cotton.
Contract productionLivestock production based on an agreement tohouse, feed, and maintain animals supplied by ameat processor, then return the animals forprocessing when ready.
Conversion efficiencye amount of feed needed to produce a unit of ani-mal product.
GLOSSARY
84 Union of Concerned Scientists
CR4 (or four-firm concentration)e amount of market share held by the four largestcompanies within an industry. A value higher than40 percent oen indicates a level of concentrationthat can interfere with free-market mechanisms.
Critical loade maximum amount of nitrogen that can be de-posited on a specific type of soil before damage(such as decreased biodiversity) will occur.
Direct subsidyPayment to a business that reduces or compensatesfor production costs. Direct subsidies provided infederal farm bills have compensated grain farmerswhen market prices fell below the cost of production.
Diversified farmFor the purposes of this report, a farm that raisesboth livestock and crops. More generally, a farmthat raises multiple crops or crops and livestock.
DowngradientA point within the earth toward which water from ahigher reference point will flow. In the case ofgroundwater, the gradient may not be reflected in aslope at the surface.
Dried distillers grains with solubles (DDGS)e residue that remains aer corn has been fer-mented to produce ethanol. Can be used to supple-ment livestock feed.
Economies of scaleReductions in the cost of production that accruespecifically to large facilities or companies because1) their costs are distributed over many units of pro-duction and 2) they may have access to efficiency-improving technologies that are not accessible tosmaller companies.
EQIP (Environmental Quality Incentives Program)A federal program that pays farmers to preventsome of the environmental damage they cause.
Eutrophicatione degradation of a body of water due to thegrowth and subsequent death of vegetation thatlowers oxygen content as it decays, killing fish andother aquatic organisms. Excess nitrogen or phos-phorus from CAFOs oen produces eutrophicconditions.
Externalized costsEnvironmental and health costs (related to pollutionor increased illness, for example) that are borne bysociety instead of the enterprise responsible.
Farm billA package of federal laws that establishes U.S. agri-cultural policy and is typically renewed everyfive years.
FeedlotsConfined areas that are open to the air or partiallyroofed and house thousands of beef cattle while theanimals are fattened on grain prior to slaughter.
Finishing operationsFacilities where animals (beef cattle, hogs, broilerchickens) are fattened on grain prior to slaughter.Large finishing operations are usually CAFOs.
ForagePlant material eaten by livestock, such as alfalfa andgrasses, stems, and leaves.
Hoop barnsFacilities that house small to medium-sized invento-ries of hogs in structures with curved roofs and haybedding, oen with access to the outdoors. A moresustainable method of hog production than CAFOs.
HypoxiaIn the context of this report, a condition of low oxy-gen content in bodies of water, oen caused byeutrophication. Hypoxia related to CAFO pollutionhas contributed to the production of “dead zones” inthe Gulf of Mexico and estuaries along the EastCoast that cannot support fish or shellfish.

CAFOs Uncovered 85
Indicator speciesOrganisms such as bacteria whose presence suggeststhe simultaneous presence of other organisms thatmay be more difficult to detect.
Indirect subsidySupport a business receives as a result of direct sub-sidies paid to another party (e.g., low prices for sup-plies resulting from subsidies paid to the supplier).
InputsSupplies such as the feed, water, and antibiotics usedto produce livestock.
Integration (or vertical integration/coordination)Ownership or control of multiple stages of produc-tion by a single entity. In the context of animal pro-duction, meat processors oen control multipleproduction stages (e.g., breeding, rearing, finishing,slaughter, processing, distribution) through live-stock ownership or contract arrangements with ananimal producer (such as a CAFO).
LagoonsOpen-air reservoirs that store liquid manure fromCAFOs.
Littere mixture of poultry manure, excess feed, andbedding material (such as wood chips) that buildsup in broiler facilities.
LivestockAnimals raised for their meat, milk, and eggs. Forthe purposes of this report, the term includes chick-ens along with cattle and pigs.
Loan deficiency paymentsDirect subsidies paid by the federal government tocompensate commodity crop growers for low mar-ket prices.
Management intensive rotational grazing (MIRG)A method of raising livestock on pasture in whichthe animals are moved periodically so no single areais overgrazed. e rate of livestock movement isbased on the optimum grazing levels for different for-age species under different environmental conditions.
MorbidityDisease, or the incidence of disease, in a population.
Multiplier effectAmplification of the value of money by its circula-tion (exchange) in the local community (throughthe purchase of goods and services). e effect in-creases as circulation in the community increases.
National Pollution Discharge Elimination System(NPDES)A pollution control program under the Clean WaterAct that 1) sets limits on the amount of specific pollu-tants that may be discharged from an individual sitesuch as a CAFO, 2) issues permits for pollution dis-charge, and 3) enforces monitoring and reporting re-quirements. e program is administered by the EPA.
PM2.5
Fine particulate matter (2.5 microns in diameter orless) that can cause respiratory disease when inhaled.
Processinge slaughter of livestock, carcass dressing, andpackaging and distribution of the finished animalproducts.
Spot marketA real-time open market for sales of animal prod-ucts; functions as an alternative to contractproduction.
SprayfieldLand that is close to a manure storage facility andfertilized with liquid manure distributed bysprayers.

86 Union of Concerned Scientists
SubsidiesPayments that artificially support an industry by off-setting its costs of production or compensating pro-ducers for low market prices.
TurbidityCondition in which the passage of light throughwater is impeded.
UpgradientA point within the earth toward which water from alower reference point will not flow. In the case ofgroundwater, the gradient may not be reflected in aslope at the surface.
Volatilizatione transformation of pollutants (such as the am-monia in manure) into their airborne form.
Willingness to accept manure (WTAM)e percentage of farmers willing to accept manurefrom CAFOs or AFOs for application on their cropfields or pastures. Typical rates are between 5 and 20percent for farmers of commodity crops such ascorn, soybeans, and wheat.
National HeadquartersTwo Brattle SquareCambridge, MA 02238-9105Phone: 617-547-5552Toll-Free: 800-666-8276Fax: 617-864-9405
Washington, DC, Office1825 K Street NW, Suite 800Washington, DC 20006-1232Phone: 202-223-6133Fax: 202-223-6162
West Coast Office2397 Shattuck Avenue, Suite 203Berkeley, CA 94704-1567Phone: 510-843-1872Fax: 510-843-3785
Webwww.ucsusa.org
Printed on recycled paper usingsoy-based inks
he U.S. livestock industry—a large and vital part of
agriculture in this country—has been undergoing a
drastic change over the past several decades. Huge CAFOs
(confined animal feeding operations) have become the
predominant method of raising livestock, and the crowded
conditions in these facilities have increased water and air
pollution and other types of harm to public health and rural
communities.
CAFOs are not the inevitable result of market forces.
Instead, these unhealthy operations are largely the result of
misguided public policy that can and should be changed.
In this report, the Union of Concerned Scientists
analyzes both the policies that have facilitated the growth
of CAFOs and the enormous costs imposed on society by
CAFOs. We also discuss sophisticated and efficient
alternatives for producing affordable animal products,
and offer policy recommendations that can begin to lead
us toward a healthy and sustainable food system.
T
Union of Concerned ScientistsCitizens and Scientists for Environmental Solutions