cadmium levels in soils and crops in the united states · leafy vegetables (lettuce, spinach ......
TRANSCRIPT

Lead, Mercury, Cadmium and Arsenic in the EnvironmentEdited by T. C. Hutchinson and K. M. Meema@ 1987 SCOPE. Published by John Wiley & Sons Ltd
CHAPTER 10
Cadmium Levels in Soils and Crops in theUnited States
A. L. PAGE, A. C. CHANG AND MOHAMED EL-AMAMY
Dept. of Soil and Environmental Sciences,University of California,Riverside, CA 92521
ABSTRACT
The concentrations of cadmium in agricultural soils depend upon the amountspresent in the parent rocks from which the soils form, the amounts added in theform of fertilizers and soil amendments, the amounts deposited onto soils fromthe atmosphere, and the amounts removed by harvested crops and by leaching.On average, sedimentary rocks contain greater concentrations of Cd than eitherigneous or metamorphic rocks, and therefore, recent soils derived from sedimentaryrock should contain greater concentrations of Cd than those derived from igneousor metamorphic rocks. Among the commercial fertilizers, phosphorus fertilizerscontain somewhat elevated levels of Cd. Results show that the long-term use ofphosphorus fertilizers will slightly increase the concentration of Cd in surface soils.Due to the combustion of fossil fuels and to the smelting and processing of ores, airin rural regions contains Cd. Results show that the amounts of Cd added to soilsvia aerial deposition in rural agricultural regions is of the order of a few gramsper hectare per year and approximately equal to that added to soil from normalphosphorus fertilization operations. All crops contain Cd, and the harvested portionwill serve to remove some Cd from soil. Amounts removed from soil in harvestedcrops, however, are quite small compared with the amounts present. Cadmiumis reasonably immobile in soils, and the available data suggest that the amountsremoved by leaching are also small compared with amounts present.
The concentrations of Cd in non-contaminated agricultural soils in the UnitedStates range from about 0.1 to 1.0 mg/kg. Except for a limited number of soilsderived from parent materials unusually high in Cd, organic soils (Histosols) tendto contain the highest total Cd concentrations, and highly weathered soils (Ultisolsand Alfisols) the lowest. Other soil orders contain concentrations of Cd in amountsapproximately equal to their geological abundance or from about 0.2 to 0.4 mgCd/kg. The fact that highly weathered soils are somewhat depleted in Cd suggestthatgreaterquantitiesof Cdareremovedby cropsandleachingthanareaddedthrough fertilization and atmospheric deposition. Surface soils commonly contain
] ]9
120 Lead, Mercury. Cadmium and Arsenic in the Environment
higher concentrations of Cd than subsurface horizons. The higher concentrationsof Cd in surface horirons are probably due to the cycling of Cd from lower depthsto the surface by plants.
Concentrations of Cd in food chain crops vary substantially within and amongspecies. Research conducted during the past has demonstrated that the variations ob-served are due to differences in the Cd concentrations present in the soil, differencesin the growth conditions among the regions where the crops are grown, differencesin the cuItivars of a particular crop, and differences in soil chemical and physicalproperties. We have grown a number of vegetable crops in fall and spring seasonsand have observed seasonal differences in the amounts of Cd which the crops accu-mulate. Numerous data from a number of sources have demonstrated that differentcultivars of the same plant show differences in their Cd absorption characteristics.Likewise, numerous published data have demonstrated that soil chemical proper-ties, particularly soil pH, influence the amounts of Cd absorbed by crops.
On a dry weight basis the concentration of cadmium in food chain crops grownin non-contaminated soils (except those soils unusually naturally elevated in Cd)range from 0.01 to 1.0 mglkg. Leafy vegetables (lettuce, spinach) usually show thehighest Cd concentrations, grains (wheat, oats, barley) show the lowest concentra-tions and root vegetables (carrot, radish, onion, potato) are intermediate betweenthe two extremes. Concentrations of Cd in crops grown on soils elevated in Cd, ei-ther naturally or from anthropogenic sources, may accumulate substantially greaterthan 1.0 mglkg. The amounts accumulated depend upon the level of Cd present inthe root rone of the soil, the crop species, and the chemical properties of the soil.
INTRODUCTION
Cadmium (Cd) is regarded as one of the most toxic trace elements in the en-vironment. The increased emissions resulting from its production, use, anddisposal, combined with its persistence in the environment, and its relativelyrapid uptake and accumulation by food chain crops contribute to its poten-tial environmental hazards. Cadmium may find its way to the human popula-tion through food and beverage, drinking water, air, and cigarette smoking.Although acute Cd toxicity caused by food consumption is rare, chronic ex-posure to high Cd levels in food can significantly increase the accumulationof Cd in certain body organs. When the concentration in the human bodyreaches levels considered to be harmful (> 200 p,g/gm wet weight in the kid-ney cortex according to Kjellstrom and Nordberg, 1978), cadmium-inducedkidney damage, skeletal disorders as well as other diseases may result.
A highly publicized episode of Cd poisoning of humans (itai-itai disease)was reported in Japan in the mid-1950s (Tsuchiya, 1978). The source ofexcessive Cd to the affected individuals came from rice grown on nearbypaddies which had been irrigated with water from a river contaminated byzinc mining operations. The Cd concentrations of the rice, of the river sedi-ments and of the soil in which the rice was grown were considerably greaterthan those found in uncontaminated regions. However, the actual Cd lev-els in the rice grain were not unusually high. Since the per capita dietary
Cadmium LeveLs in Soils and Crops in the United States 121
consumption of rice among the Japanese population is high, the impact ofCd enrichment in the rice on the indigenous population was proportion-ally magnified. The Japanese incident is the only documented Cd poisoningarising from human consumption of crops grown on Cd-contaminated soils.
For populations not subjected to a Cd-contaminated environment, themain source of Cd human body burden is also from food. Drinking wa-ter and ambient air contribute significantly lesser amounts to the daily in-take. Concentrations of Cd in domestic water supplies seldom exceed a fewpg/litre, and at a consumption of 1-2 litres of water/day the daily intakewould be merely a few micrograms (Friberg et aL., 1974; Tsuchiya, 1978;Pahren et aI., 1979). Cadmium concentrations of ambient air rarely exceed0.01 pg/m3, and at an intake rate of 20 m3 of air/day the daily Cd intakewould not exceed 0.2 pg. Cigarette smoking, however, adds considerably toCd input via inhalation. Friberg et al. (1974) estimated that a daily intake of2 to 4 pg Cd would be expected from smoking one package of cigarettes perday. They further suggested that the daily ingestion of Cd from all sourcesfor the world's population ranged from 25 to 75 pg/day. Based upon resultsof market basket surveys over a seven-year period, the US Food and DrugAdministration (Mahaffey et at., 1975) showed an average intake of 39 pgCd/day for the 15 to 20 year old age group males in the United States. Ifthe figure is adjusted according to the recommended daily caloric intake forother age groups, the average daily intake from birth to age 50 for men andwomen in the US would be 33 and 26 pg/day, respectively (Pahren et aI.,1979). These values, however, were derived with the assumption .that anymarket basket food items analyzed contained at least 0.02 mg Cd/kg. Morerecent data based upon analysis of fecal excretion gave estimated figures offrom 18 to 21 pg Cd/day for teenage males (Ryan et aI., 1982; Kowal, 1984).
The above-cited figures illustrate the importance of Cd in the food chaincrops to the accumulation of CJ in the human body. The concentration ofCd in foods is, in turn, controlled by its concentration in the soil substrateand by the physical and chemical nature of this soil. In the following sectionswe will review concentrations of Cd in crops and soils in the United States.Sources of Cd in soils, as well as factors influencing its absorption by crops,are also discussed.
NATURAL OCCURRENCE
According to Heinrichs et al. (1980), the average concentration of cad-mium in the lithosphere is 0.098 mg/kg. It is a rarer element than mercuryand about 1/700 as abundant as zinc (whose crustal abundance averages 70mg/kg). The ranges and mean concentrations of cadmium for some commonigneous, sedimentary, and metamorphic rocks are presented in Table 10.1.There are very small differences in the overall abundance of cadmium in
122 Lead, Mercury, Cadmium and Arsenic in the Environment
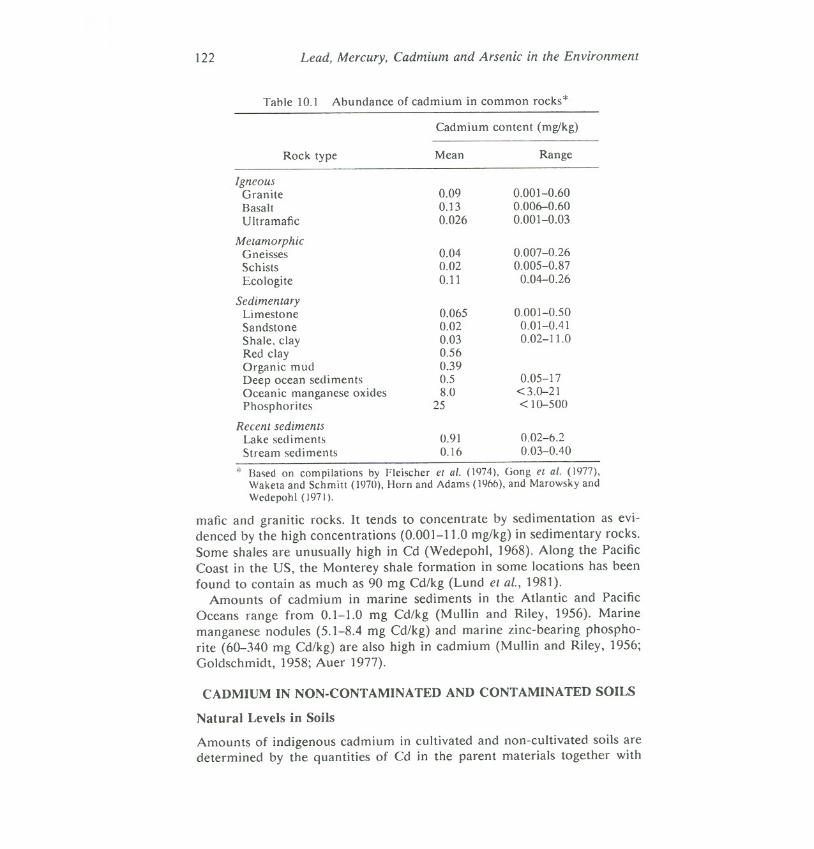
Table 10.1 Abundance of cadmium in common rocks*
Cadmium content (mglkg)
" Based on compilations by Fleischer Cl al. (1974), Gong ct al. (1977),Waketa and Schmitt (1970), Horn and Adams (l96b), and Marowsky and
Wedepohl (1971).
mafic and granitic rocks. It tends to concentrate by sedimentation as evi-denced by the high concentrations (0.001-11.0 mg/kg) in sedimentary rocks.Some shales are unusually high in Cd (Wedepohl, 1968). Along the PacificCoast in the US, the Monterey shale formation in some locations has beenfound to contain as much as 90 mg Cd/kg (Lund el aL.,1981).
Amounts of cadmium in marine sediments in the Atlantic and PacificOceans range from 0.1-1.0 mg Cd/kg (Mullin and Riley, 1956). Marinemanganese nodules (5.1-8.4 mg Cd/kg) and marine zinc-bearing phospho-rite (60-340 mg Cd/kg) are also high in cadmium (Mullin and Riley, 1956;Goldschmidt, 1958; Auer 1977).
CADMIUM IN NON-CONTAMINATED AND CONTAMINATED SOILS
Natural Levels in Soils
Amounts of indigenous cadmium in cultivated and non-cultivated soils aredetermined by the quantities of Cd in the parent materials together with
Rock type Mean Range
IgneousGranite 0.09 0.001-0.60Basalt 0.13 0.006-0.60Ultramafic 0.026 0.001-0.03
MetamorphicGneisses 0.04 0.007-0.26Schists 0.02 0.005-0.87
Ecologite 0.11 0.04-0.26
SedimemaryLimestone 0.065 0.001-0.50Sandstone 0.02 0.01-0.41
Shale. clay 0.03 0.02-11.0
Red clay 0.56Organic mud 0.39Deep ocean sediments 0.5 0.05-17
Oceanic manganese oxides 8.0 <3.0-21
Phosphorites 25 < 10-500
Recent sedimentsLake sediments 0.91 0.02-6.2Stream sediments 0.16 0.03-0.40
Cadmium Levels in Soils and Crops in the United States 123
amounts added through atmospheric deposition, fertilizers, pesticides, andirrigation water, but minus amounts removed by leaching, erosion, and inharvested crops. Based upon Cd concentrations reported for common rocks,one would expect on the average, soils of similar age derived from igneousrocks to b~ lowest in total Cd, soils derived from metamorphic rocks to beintermediate, and soils derived from sedimentary rocks to contain the largestquantities of Cd.
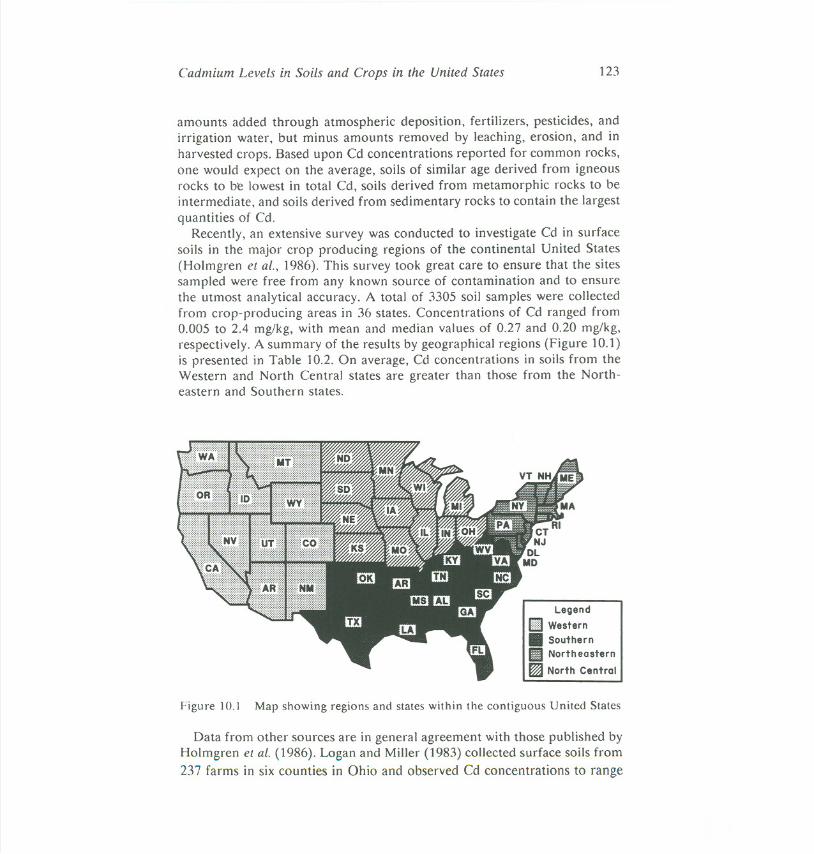
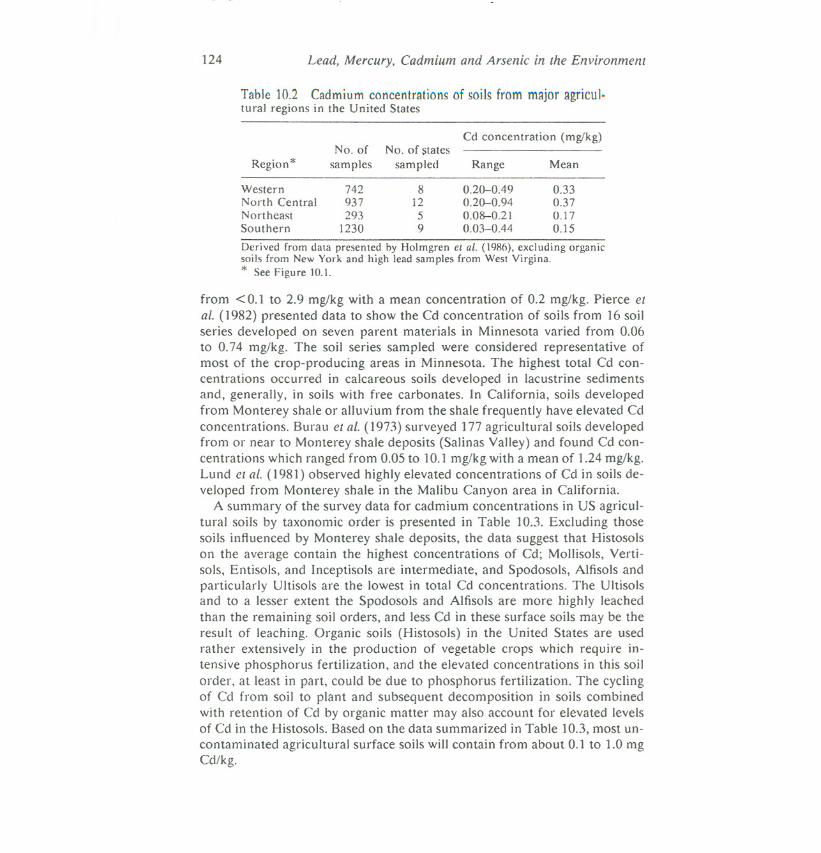
Recently, an extensive survey was conducted to investigate Cd in surfacesoils in the major crop producing regions of the continental United States(Holmgren et al., 1986). This survey took great care to ensure that the sitessampled were free from any known source of contamination and to ensurethe utmost analytical accuracy. A total of 3305 soil samples were collectedfrom crop-producing areas in 36 states. Concentrations of Cd ranged from0.005 to 2.4 mg/kg, with mean and median values of 0.27 and 0.20 mg/kg,respectively. A summary of the results by geographical regions (Figure 10.1)is presented in Table 10.2. On average, Cd concentrations in soils from theWestern and North Central states are greater than those from the North-eastern and Southern states.
Legend[I Western.SouthernII NortheasternFZiI North Central
Figure 10.] Map showing regions and states within the contiguous United States
Data from other sources are in general agreement with those published byHolmgren el at. (1986). Logan and Miller (1983) collected surface soils from237 farms in six counties in Ohio and observed Cd concentrations to range
124 Lead, Mercury. Cadmium and Arsenic in the Environment
Table 10.2 Cadmium concentrations of soils from major agricul.tural regions in the United States
Derived from data presented by Holmgren et at. (1986),excluding organicsoils from New York and high lead samples from West Virgina.* See Figure 10.1.
from < 0.1 to 2.9 mg/kg with a mean concentration of 0.2 mg/kg. Pierce etaL.(1982) presented data to show the Cd concentration of soils from 16 soilseries developed on seven parent materials in Minnesota varied from 0.06to 0.74 mg/kg. The soil series sampled were considered representative ofmost of the crop-producing areas in Minnesota. The highest total Cd con-centrations occurred in calcareous soils developed in lacustrine sedimentsand, generally, in soils with free carbonates. In California, soils developedfrom Monterey shale or alluvium from the shale frequently have elevated Cdconcentrations. Burau et at. (1973) surveyed 177 agricultural soils developedfrom or near to Monterey shale deposits (Salinas Valley) and found Cd con-centrations which ranged from 0.05 to 10.1 mg/kg with a mean of 1.24 mg/kg.Lund el at. (1981) observed highly elevated concentrations of Cd in soils de-veloped from Monterey shale in the Malibu Canyon area in California.
A summary of the survey data for cadmium concentrations in US agricul-tural soils by taxonomic order is presented in Table 10.3. Excluding thosesoils influenced by Monterey shale deposits, the data suggest that Histosolson the average contain the highest concentrations of Cd; Mollisols, Verti-sols, Entisols, and Inceptisols are intermediate, and Spodosols, Alfisols andparticularly Ultisols are the lowest in total Cd concentrations. The Ultisolsand to a lesser extent the Spodosols and Alfisols are more highly leachedthan the remaining soil orders, and less Cd in these surface soils may be theresult of leaching. Organic soils (Histosols) in the United States are usedrather extensively in the production of vegetable crops which require in-tensive phosphorus fertilization, and the elevated concentrations in this soilorder, at least in part, could be due to phosphorus fertilization. The cyclingof Cd from soil to plant and subsequent decomposition in soils combinedwith retention of Cd by organic matter may also account for elevated levelsof Cd in the Histosols. Based on the data summarized in Table 10.3, most un-contaminated agricultural surface soils will contain from about 0.1 to 1.0 mgCd/kg.
Cd concentration (mg/kg)No. of No. of :;tates
Region* samples sampled Range Mean
Western 742 8 0.20-0.49 0.33North Central 937 12 0.20-0.94 0.37Northeast 293 5 0.08-0.21 0.17Southern 1230 9 0.03-0.44 0.15
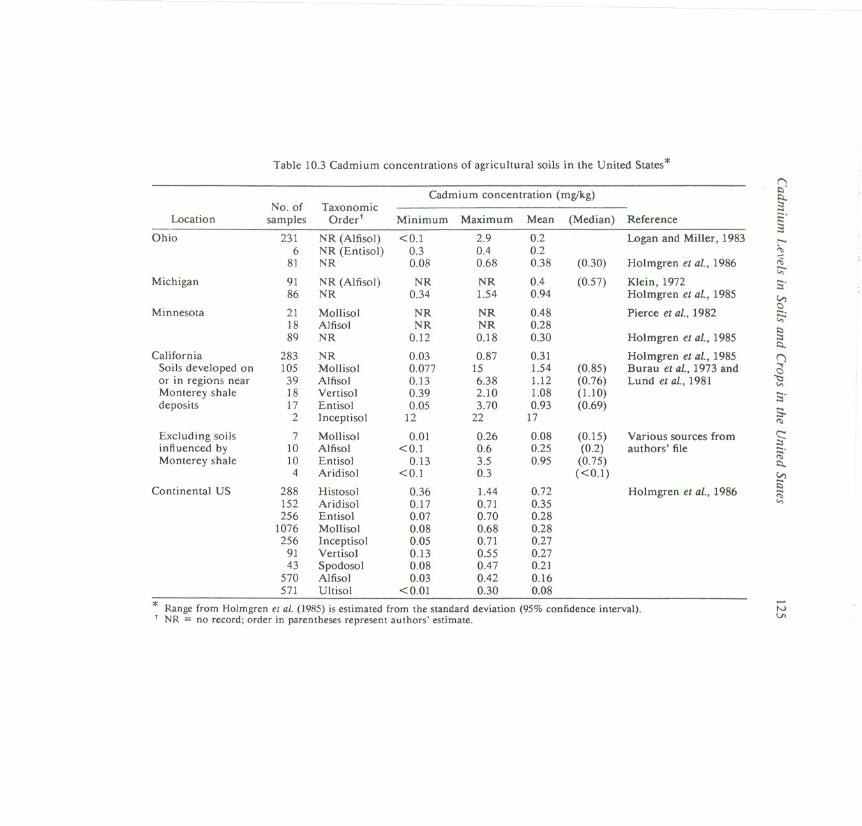
Table 10.3Cadmium concentrationsof agricultural soilsin the United States*
QCadmium concentration (mg/kg) !:<.
No. of TaxonomicLocation samples Order t Minimum Maximum Mean (Median) Reference E'
Ohio 231 NR (Alfisol) <0.1 2.9 0.2 Logan and Miller, 1983 t-6 NR (Entisol) 0.3 0.4 0.2
81 NR 0.08 0.68 0.38 (0.30) Holmgren et ai., 1986 i'"Michigan 91 NR (AlfisoJ) NR NR 0.4 (0.57) Klein, 1972 S.
86 NR 0.34 1.54 0.94 Holmgren et aL, 1985Minnesota 21 Mollisol NR NR 0.48 Pierce et aL, 1982 -.
1;;-18 Alfisol NR NR 0.28 $::089 NR 0.12 0.18 0.30 Holmgren et ai., 1985 ;:s
!:<.California 283 NR 0.03 0.87 0.31 Holmgren et ai., 1985
Soils developed on 105 MollisoJ 0.077 15 1.54 (0.85) Burau el ai., 1973 andor in regions near 39 Alfisol 0.13 6.38 1.12 (0.76) Lund el aI., 1981 '"Monterey shale 18 Vertisol 0.39 2.10 1.08 (1.10) -.deposits 17 Entisol 0.05 3.70 0.93 (0.69)
;:sS.2 Inceptisol 12 22 17 <":>
Excluding soils 7 Mollisol 0.01 0.26 0.08 (0.15) Various sources from <:::;:s
influenced by 10 Alfisol <0.1 0.6 0.25 (0.2) authors' file -.Monterey shale 10 Entisol 0.13 3.5 0.95 (0.75) !:<.
4 Aridisol <0.1 0.3 «0.1) '"Continental US 288 Histosol 0.36 1.44 0.72 Holmgren et aL, 1986
;:;R;
152 Aridisol 0.17 0.71 0.35 '"
256 Entisol 0.07 0.70 0.281076 Mollisol 0.08 0.68 0.28256 Inceptisol 0.05 0.71 0.27
91 Vertisol 0.13 0.55 0.2743 Spodosol 0.08 0.47 0.21
570 Alfisol 0.03 0.42 0.16571 Ultisol <0.01 0.30 0.08
* Rangefrom Holmgrenel ai. (1985)is estimated from the standard deviation (95%confidenceinterval).-tV
t NR = no record; order in parentheses represent authors' estimate.VI
126 Lead, Mercury, Cadmium and Arsenic in the Environment
Only limited data are available pertaining to concentrations ot cadmiumin relation to soil depth. Pierce et al. (1982) showed that levels of Cd insurface horizons of MolIisols and Alfisols are greater than those found insubsurface horizons. Mean concentrations of Cd in surface horizons were0.39 mg/kg compared with 0.23 mg/kg for subsurface horizons. The higherconcentrations in surface horizons suggest that additions of Cd by atmo-spheric deposition, fertilizers, and plant cycling exceed losses by leachingand plant removal in the surface horizon.
Sources and Extent of Cadmium Contamination of Soils
Soils may be contaminated with cadmium by fallout from aerial sources,by application of waters, fertilizers, or pesticides which contain cadmium,or by the discharge of cadmium-containing waste materials from industrial,metallurgical or urban activities.
J. Levels Near Mining and Smelting Operations
Processing of industrial metals is an important source of atmospheric emis-sion of trace metals including Cd. Smelting and sintering of non-ferrousmetals have resulted in Cd contamination of the nearby environment. Theore-smelting furnaces in which metals enter the flue-gas stream as fine par-ticulates or volatiles are responsible for the majority of discharge from thestack and, eventually, the deposition onto soils and vegetation. Airbornedusts and fumes from charging furnaces. transporting metal ores, and sin-tering and metal-reducing furnaces are also sources of metals found in andnear the metallurgical operations. Soils contaminated by smelting operationsexhibited the highest Cd concentrations in the upper horizons near the pointof discharge in the direction of the prevailing winds. The Cd concentrationsat a depth of about 30-40 cm would return to levels close to the backgroundbecause of surface retention especially in organic matter and litter.
The extent to which soils in the United States have been contaminated
by mining and smelting operations can be found in published reports byFulkerson and Goeller (1973), Buchauer (1973), Munshower (1977), Ra-gaini et al. (1977), Johnson et at. (1975), Lagerwerff and Brower (1975) andUS Environmental Protection Agency (1972). Two kilometres northeast ofa lead-zinc smelter in Montana, 29 mg Cd/kg in surface soils was observed(Munshower, 1977). The Cd concentration of surface soil decreased withdistance and reached near background levels 24 kilometres from the source.Likewise, within one kilometre of a zinc smelter at Palmerton, Pennsylva-nia, Buchauer (1973) reported concentrations of Cd in the surface organichorizon as great as 750 mg Cd/kg. The Cd concentrations of the soils de-creased logarithmicaJly with distance and levels exceeding background were
Cadmium Levels in Soils and Crops in the United States 127
observed up to 21 kilometres from the source. Recently adopted emissioncontrol measures should lessen future contamination of soils from miningand smelting. However, those soils already contaminated by past operationswiII remain high in Cd more or less permanently because Cd is quite immo-bile in soil.
The extent of contamination of soils resulting from stack emissions ofcoal-fired power plants varies as a result of differences in emission controldevices. The rate of atmospheric discharge of Cd per ton of coal combustedranges from 3 to 90 mg (Lyon, 1977). With 90% emission control, theannual deposition rate of Cd onto soil adjacent to a 3000 MW coal-firedpower plant is 0.00002 mg/kg soil (Ondov, et at., 1976). Assuming a meanCd concentration of 0.2 mg/kg soil, the enrichment of the soil over thelifetime of the power plant (- 35 years) is approximately 0.35%.
2. Disposal/Recycling of Municipal Sewage Sludges
Sewage sludges from municipalities are frequently applied to soils in dis-posal operations, as soil conditioners, or as a source of plant nutrients. Theconcentrations of Cd in sewage sludge always exceed those normally foundin soils. Municipal sewage sludge contains in the range of approximately 2to 3500 mg Cd/kg sludge. with medians in the order of 5 to 20 mg/kg (Page.1974; Sommers. 1977; Logan and Chaney 1984). Application of sludge as anitrogen fertilizer can increase the cadmium level in surface soils. A 5 tons/haapplication of sludge containing 10 to 15 mg Cd/kg may result in an increaseof cadmium concentration by as much as 10-15% in the surface soil (as-suming background level is 0.22 mg/kg). The applied cadmium may remainavailable to plants for an extended period of time.
Although the use of municipal sewage sludge as a fertilizer or soil con-ditioner will result in increased Cd concentrations in soil, the impact ofthis practice on the Cd concentration of commercial crops which enter themarketing and distribution systems is expected to be minimal. This is sobecause less than 1.0% of the agricultural land in the United States wouldbe affected if 50% of the sludges generated annually were to be appliedto agricultural lands as a source of nitrogen (CAST, 1976). Currently, lessthan 20% of the sludge generated is applied to lands used to produce com-mercial crops. In situations where foods grown on sludged lands made upa substantial percentage of the human diet, over a number of years it ispossible that consumers could accumulate Cd in amounts considered to bea health hazard.
3. Phosphorus Fertilizers
Phosphorus fertilizers frequently contain greater concentrations of cadmium
128 Lead. Mercury. Cadmium and Arsenic in the Environment
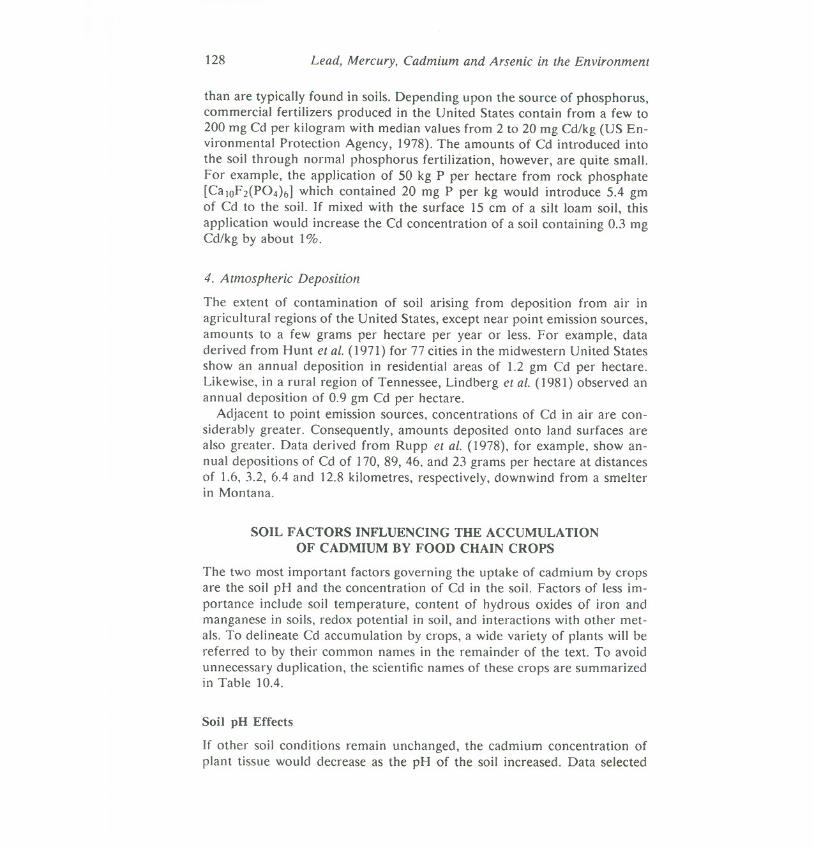
than are typically found in soils. Depending upon the source of phosphorus,commercial fertilizers produced in the United States contain from a few to200 mg Cd per kilogram with median values from 2 to 20 mg Cd/kg (US En-vironmental Protection Agency, 1978). The amounts of Cd introduced intothe soil through normal phosphorus fertilization, however, are quite small.For example, the application of 50 kg P per hectare from rock phosphate[CaIOF2(P04)6] which contained 20 mg P per kg would introduce 5.4 gmof Cd to the soil. If mixed with the surface 15 cm of a silt loam soil, thisapplication would increase the Cd concentration of a soil containing 0.3 mgCd/kg by about 1%.
4. Atmospheric Deposition
The extent of contamination of soil arising from deposition from air inagricultural regions of the United States, except near point emission sources,amounts to a few grams per hectare per year or less. For example, dataderived from Hunt et ai. (1971) for 77 cities in the midwestern United Statesshow an annual deposition in residential areas of 1.2 gm Cd per hectare.Likewise, in a rural region of Tennessee, Lindberg et al. (1981) observed anannual deposition of 0.9 gm Cd per hectare.
Adjacent to point emission sources, concentrations of Cd in air are con-siderably greater. Consequently, amounts deposited onto land surfaces arealso greater. Data derived from Rupp et al. (1978), for example, show an-nual depositions of Cd of 170, 89, 46. and 23 grams per hectare at distancesof 1.6, 3.2, 6.4 and 12.8 kilometres, respectively, downwind from a smelterin Montana.
SOIL FACTORS INFLUENCING THE ACCUMULATIONOF CADMIUM BY FOOD CHAIN CROPS
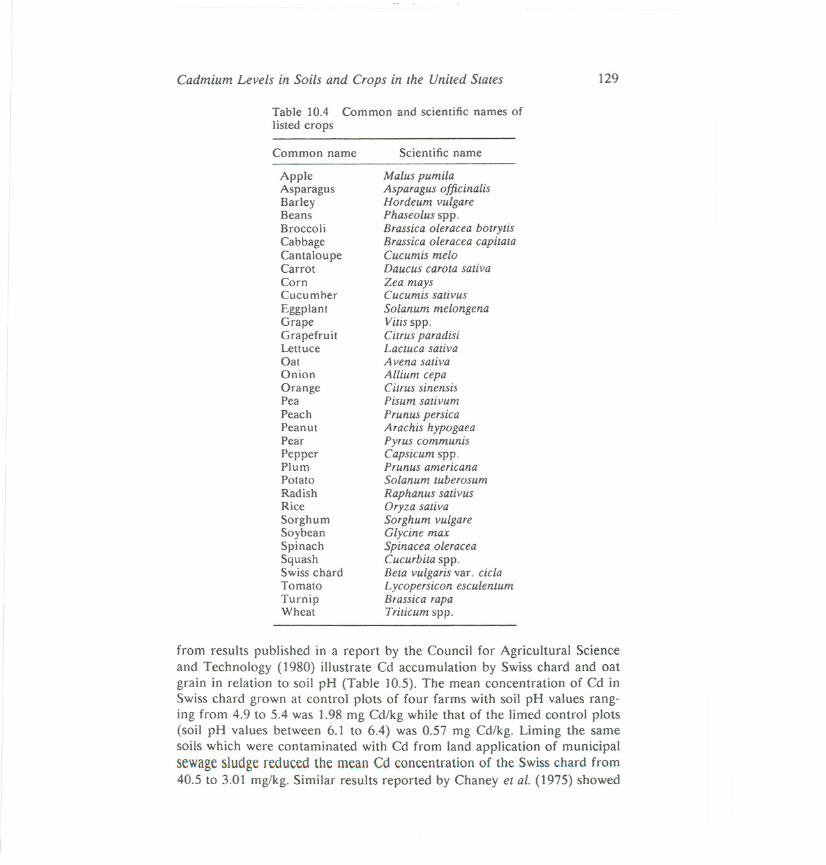
The two most important factors governing the uptake of cadmium by cropsare the soil pH and the concentration of Cd in the soil. Factors of less im-portance include soil temperature, content of hydrous oxides of iron andmanganese in soils, redox potential in soil, and interactions with other met-als. To delineate Cd accumulation by crops, a wide variety of plants will bereferred to by their common names in the remainder of the text. To avoidunnecessary duplication, the scientific names of these crops are summarizedin Table 10.4.
Soil pH Effects
If other soil conditions remain unchanged, the cadmium concentration ofplant tissue would decrease as the pH of the soil increased. Data selected
Cadmium Levels in Soils and Crops in lhe Uniled Slales 129
Table 10.4 Common and scientific names oflisted crops
Common name Scientific name
AppleAsparagusBarleyBeansBroccoliCabbageCantaloupeCarrotCornCucumherEggplantGrapeGrapefruitLettuceOatOnionOrangePeaPeachPeanutPearPepperPlumPotatoRadishRiceSorghumSoybeanSpinachSquashSwiss chardTomatoTurnipWheat
Malus pumilaAsparagus officinalisHordeum vulgarePhaseolus spp.Brassica oleracea botrytisBrassica oleracea capitataCucumis meloDaucus carola sativaZea maysCucumis sativusSolanum melongenaVitis spp.Cilrus paradisiLacluca salivaA vena sativaAllium cepaCitrus sinensisPisum salivum
Prunus persicaArachis hypogaeaPyrus communisCapsicum spp.Prunus americanaSolanum luberosumRaphanus sativusOryza salivaSorghum vulgareGlycine maxSpinacea oleraceaCucurbila spp.Bela vulgaris vaT. ciclaLycopersicon esculenlumBrassica rapaTriticum spp.
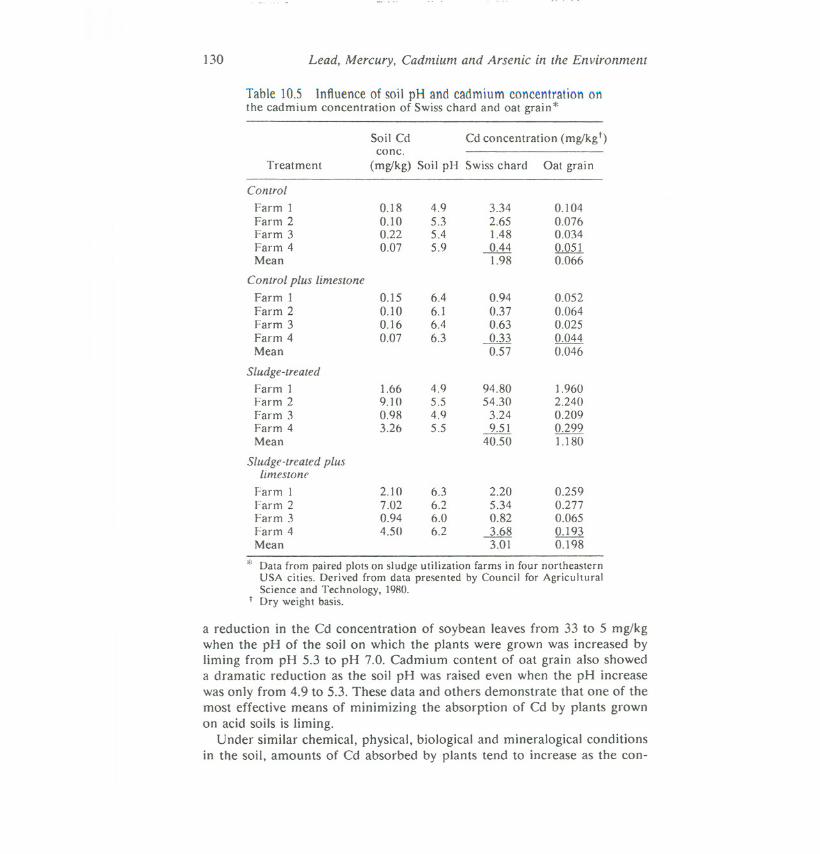
from results published in a report by the Council for Agricultural Scienceand Technology (1980) illustrate Cd accumulation by Swiss chard and oatgrain in relation to soil pH (Table] 0.5). The mean concentration of Cd inSwiss chard grown at control plots of four farms with soil pH values rang-ing from 4.9 to 5.4 was 1.98 mg Cd/kg while that of the limed control plots(soil pH values between 6.] to 6.4) was 0.57 mg Cd/kg. Liming the samesoils which were contaminated with Cd from land application of municipalsewagesludge reduced the mean Cd concentration of the Swiss chard from40.5 to 3.0] mg/kg. Similar results reported by Chaney el al. (1975) showed
130 Lead, Mercury, Cadmium and Arsenic in the Environment
Table 10.5 Influence of soil pH and cadmium concentration onthe cadmium concentration of Swisschard and oat grain*
a reduction in the Cd concentration of soybean leaves from 33 to 5 mg/kgwhen the pH of the soil on which the plants were grown was increased byliming from pH 5.3 to pH 7.0. Cadmium content of oat grain also showeda dramatic reduction as the soil pH was raised even when the pH increasewas only from 4.9 to 5.3. These data and others demonstrate that one of themost effective means of minimizing the absorption of Cd by plants grownon acid soils is liming.
Under similar chemical, physical, biological and mineralogical conditionsin the soil, amounts of Cd absorbed by plants tend to increase as the con-
Soil Cd Cd concentration (mg/kgt)conc.
Treatment (mg/kg) Soil pH Swiss chard Oat grain
Control
Farm 1 0.18 4.9 3.34 0.104Farm 2 0.10 5.3 2.65 0.076Farm 3 0.22 5.4 1.48 0.034Farm 4 0.07 5.9 0.44 0.051Mean 1.98 0.066
Control plus limestoneFarm 1 0.15 6.4 0.94 0.052Farm 2 0.10 6.1 0.37 0.064Farm 3 0.16 6.4 0.63 0.025Farm 4 0.07 6.3 0.33 0.044Mean 0.57 0.046
Sludge-treatedFarm 1 1.66 4.9 94.80 1.960Farm 2 9.10 5.5 54.30 2.240Farm 3 0.98 4.9 3.24 0.209Farm 4 3.26 5.5 9.51 0.299Mean 40.50 1.180
Sludge-treated pluslimestone
Farm 1 2.10 6.3 2.20 0.259Farm 2 7.02 6.2 5.34 0.277rarm 3 0.94 6.0 0.82 0.065Farm 4 4.50 6.2 3.68 0.193Mean 3.01 0.198
* Data from paired plots on sludge utilization farms in four northeasternUSA cities. Derived from data presented by Council for AgriculturalScience and Technology, 1980.
t Dry weight basis.
Cadmium Levels in Soils and Crops in the United Slales 131
centration of Cd in the soil increases (Valadares et al., 1983; Chang et aI.,1983). However, the increased Cd concentration in plants mayor may notbe proportional to the increased concentration in the soil. Also repeatedannual applications of fertilizers or soil conditioners which contain Cd (e.g.municipal sewage sludges), even though they increase the concentration ofCd in the soil each subsequent year, mayor may not increase contents of Cdin the crop from year to year. Repeated applications alter the soil conditionsand in turn the plant availability of Cd. Perhaps the factors which controlthe availability of Cd to the crop are not necessarily the same each year.Additional information on the availability of Cd to crops following repeatedapplications of Cd to soil can be obtained from Chang et al. (1982) andthe Council for Agricultural Science and Technology (1980). These reportsdemonstrate that the magnitude of increased concentrations of Cd in plantsis not always consistent with cumulative amounts applied to soil; and maydepend upon a wide variety of environmental factors.
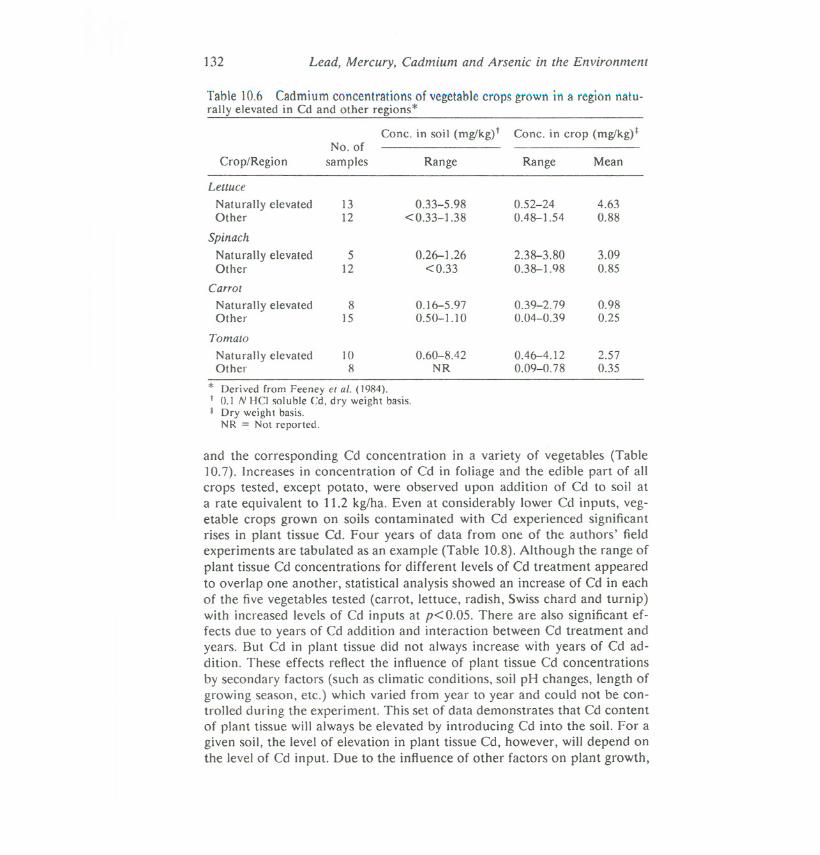
Although only limited data are available, it appears that crops grownon soil naturally elevated in Cd show higher concentrations of Cd thanthose grown on similar soils whose Cd concentrations are low. Feeney et al.(1984) reported results from a national survey of metals content of vegetablespecies. In the region where soils were naturally elevated in Cd (Salinas Val-ley, California) mean concentrations of Cd for lettuce, spinach, carrot, andtomato were, without exception, greater than mean concentrations for thesame crops grown on soils with more or less normal Cd concentrations (Ta-ble 10.6). The Cd concentrations for the soils in the region designated asnaturally elevated are not uniformly high throughout, and vary quite sub-stantially from what would be considered normal (Table 10.3). This naturalvariation among the soils within the region accounts for the wide range ofCd concentrations observed for the vegetable species sampled. Studies byLund et al. (1981) and our laboratory on native vegetation and crops grownon soils naturally high in Cd also show elevated Cd concentrations in plantswhen compared with the same plants grown on soils with normal levels ofCd. The data demonstrate that background levels for crops will vary with,in addition to pH and possibly other soil properties, the level of Cd in soil.
Both field and greenhouse experiments have been conducted to evaluatethe effect of adding Cd to soil on its concentration in plants. Plants grownon Cd-enriched soils in containers in the greenhouse tend to absorb moreCd than the same plants grown on the same soil amended with identicalamounts of Cd in the field (Page and Chang, 1978; DeVries and Tiller,1978). The extension of the field plant roots beyond the contaminated layerresults in less Cd absorption by roots and subsequently less accumulation inthe plant tissues (Page et al., 1981).
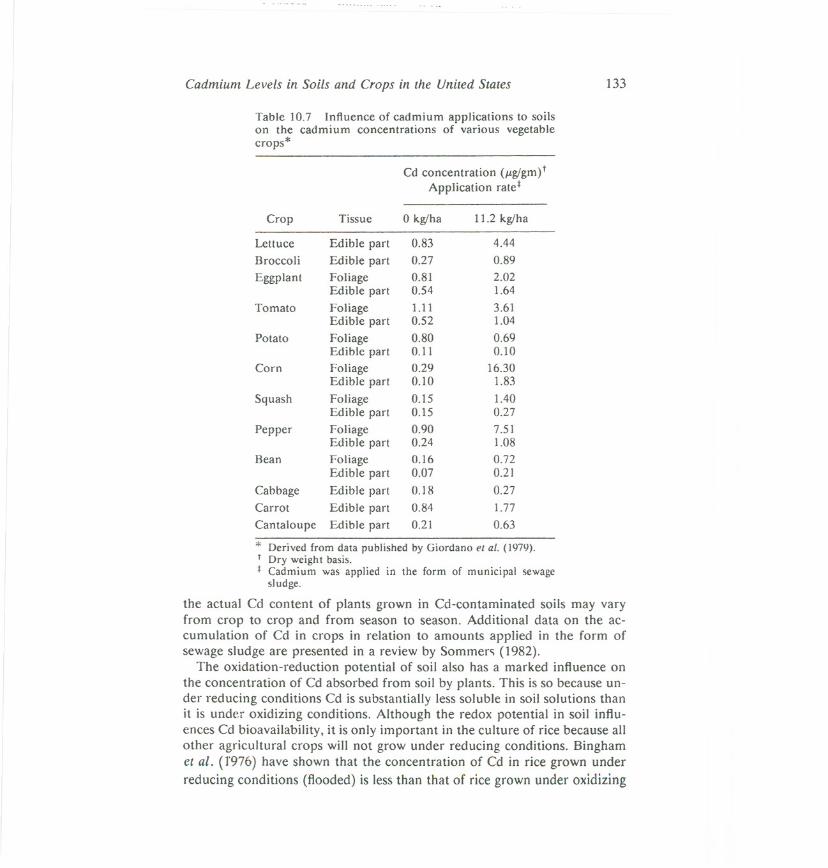
Results derived from field experiments conducted by Giordano et al.(1979), illustrate the relationship between the increased Cd added to soils
132 Lead, Mercury, Cadmium and Arsenic in the Environment
Table 10.6 Cadmium concentrations of vegetable crops grown in a region natu-rally elevated in Cd and other regions*
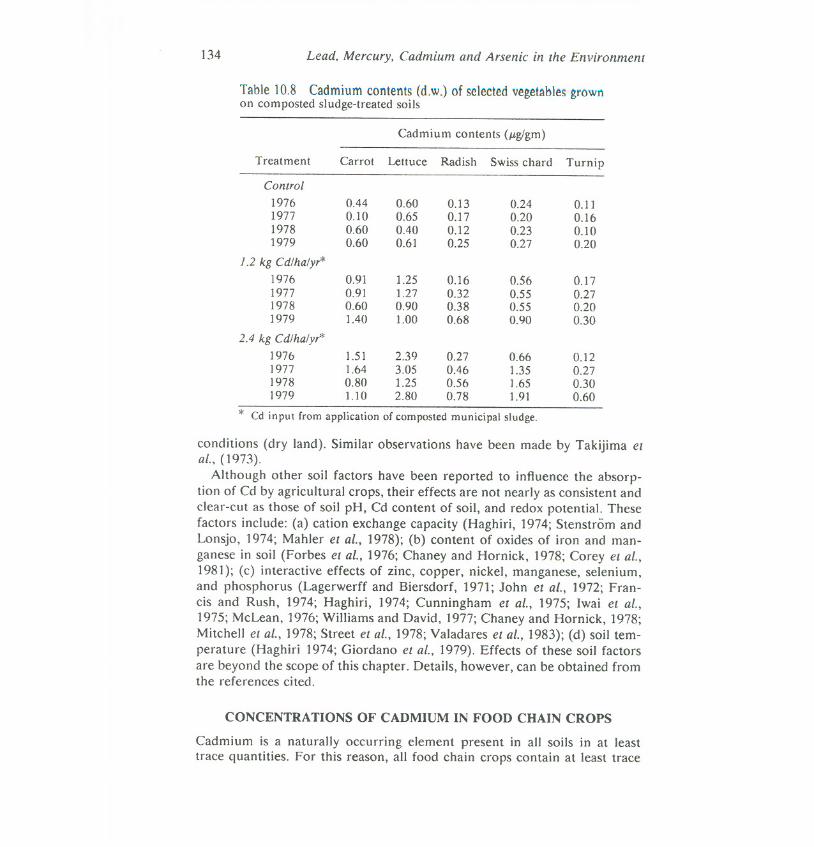
and the corresponding Cd concentration in a variety of vegetables (Table10.7). Increases in concentration of Cd in foliage and the edible part of allcrops tested, except potato, were observed upon addition of Cd to soil ata rate equivalent to 11.2 kg/ha. Even at considerably lower Cd inputs, veg-etable crops grown on soils contaminated with Cd experienced significantrises in plant tissue Cd. Four years of data from one of the authors' fieldexperiments are tabulated as an example (Table 10.8). Although the range ofplant tissue Cd concentrations for different levels of Cd treatment appearedto overlap one another, statistical analysis showed an increase of Cd in eachof the five vegetables tested (carrot, lettuce, radish, Swiss chard and turnip)with increased levels of Cd inputs at p< 0.05. There are also significant ef-fects due to years of Cd addition and interaction between Cd treatment andyears. But Cd in plant tissue did not always increase with years of Cd ad-dition. These effects reflect the influence of plant tissue Cd concentrationsby secondary factors (such as climatic conditions, soil pH changes, length ofgrowing season, etc.) which varied from year to year and could not be con-trolled during the experiment. This set of data demonstrates that Cd contentof plant tissue will always be elevated by introducing Cd into the soil. For agiven soil, the level of elevation in plant tissue Cd, however, will depend onthe level of Cd input. Due to the influence of other factors on plant growth,
Conc. in soil (mglkg)t Conc. in crop (mglkg)*No. of
Crop/Region samples Range Range Mean
Lettuce
Naturally elevated 13 0.33-5.98 0.52-24 4.63Other 12 <0.33-1.38 0.48-1.54 0.88
Spinach
Naturally elevated 5 0.26-1.26 2.38-3.80 3.09Other 12 <0.33 0.38-1.98 0.85
Carrot
Naturally elevated 8 0.16-5.97 0.39-2.79 0.98Other 15 0.50-1.10 0.04-0.39 0.25
Tomato
Naturally elevated 10 0.60-8.42 0.46-4.12 2.57Other 8 NR 0.09-0.78 0.35
* Derived from Feeney el al. (1984).t 0.1 N HCl soluble Cd. dry weight basis.* Dry weight basis.
NR = Not reported.
Cadmium Levels in Soils and Crops in the United States 133
Table to.7 Influence of cadmium applications to soilson the cadmium concentrations of various vegetablecrops*
Cd concentration (JLg/gm)tApplication rate*
the actual Cd content of plants grown in Cd-contaminated soils may varyfrom crop to crop and from season to season. Additional data on the ac-cumulation of Cd in crops in relation to amounts applied in the form ofsewage sludge are presented in a review by Sommer,> (1982).
The oxidation-reduction potential of soil also has a marked influence onthe concentration of Cd absorbed from soil by plants. This is so because un-der reducing conditions Cd is substantially less soluble in soil solutions thanit is under oxidizing conditions. Although the redox potential in soil influ-ences Cd bioavailability, it is only important in the culture of rice because allother agricultural crops will not grow under reducing conditions. Binghamet at. (1'976) have shown that the concentration of Cd in rice grown underreducing conditions (flooded) is less than that of rice grown under oxidizing
Crop Tissue 0 kg/ha 11.2 kg/ha
Lettuce Edible part 0.83 4.44
Broccoli Edible part 0.27 0.89
Eggplant Foliage 0.81 2.02Edible part 0.54 1.64
Tomato Foliage 1.11 3.61Edible part 0.52 1.04
Potato Foliage 0.80 0.69Edible part 0.11 0.10
Corn Foliage 0.29 16.30Edible part 0.10 1.83
Squash Foliage 0.15 1.40Edible part 0.15 0.27
Pepper Foliage 0.90 7.51Edible part 0.24 1.08
Bean Foliage 0.16 0.72Edible part 0.07 0.21
Cabbage Edible part 0.18 0.27
Carrot Edible part 0.84 1.77
Cantaloupe Edible part 0.21 0.63
* Derived from data published by Giordano el at. (1979).t Dry weight basis.* Cadmium was applied in the form of municipal sewage
sludge.
134 Lead, Mercury, Cadmium and Arsenic in the Environment
Table 10.8 Cadmiumcontents(d.w.) of selectedvegetablesgrownon com posted sludge-treated soils
conditions (dry land). Similar observations have been made by Takijima etaI., (1973).
Although other soil factors have been reported to influence the absorp-tion of Cd by agricultural crops, their effects are not nearly as consistent andclear-cut as those of soil pH, Cd content of soil, and redox potential. Thesefactors include: (a) cation exchange capacity (Haghiri, 1974; Stenstrom andLonsjo, 1974; Mahler et aI., 1978); (b) content of oxides of iron and man-ganese in soil (Forbes el ai., 1976; Chaney and Hornick, 1978; Corey el ai.,1981); (c) interactive effects of zinc, copper, nickel, manganese, selenium,and phosphorus (Lagerwerff and Biersdorf, 1971; John et ai., 1972; Fran-cis and Rush, 1974; Haghiri, 1974; Cunningham et aI., 1975; Iwai et al.,1975; McLean, 1976; Williams and David, 1977; Chaney and Hornick, 1978;Mitchell et al., 1978; Street et aI., 1978; Valadares et aI., 1983); (d) soil tem-perature (Haghiri 1974; Giordano et aI., 1979). Effects of these soil factorsare beyond the scope of this chapter. Details, however, can be obtained fromthe references cited.
CONCENTRATIONS OF CADMIUM IN FOOD CHAIN CROPS
Cadmium is a naturally occurring element present in all soils in at leasttrace quantities. For this reason, all food chain crops contain at least trace
Cadmium contents (J.Lglgm)
Treatment Carrot Lettuce Radish Swiss chard Turnip
Control
1976 0.44 0.60 0.13 0.24 0.111977 0.10 0.65 0.17 0.20 0.161978 0.60 0.40 0.12 0.23 0.101979 0.60 0.61 0.25 0.27 0.20
1.2 kg Cdlhalyr*1976 0.91 1.25 0.16 0.56 0.171977 0.91 1.27 0.32 0.55 0.271978 0.60 0.90 0.38 0.55 0.201979 1.40 1.00 0.68 0.90 0.30
2.4 kg Cdlhalyr*1976 1.51 2.39 0.27 0.66 0.121977 1.64 3.05 0.46 1.35 0.271978 0.80 1.25 0.56 1.65 0.301979 1.10 2.80 0.78 1.91 0.60
* Cd input from application of composted municipal sludge.
Cadmium Levels in Soils and Crops in the United States 135
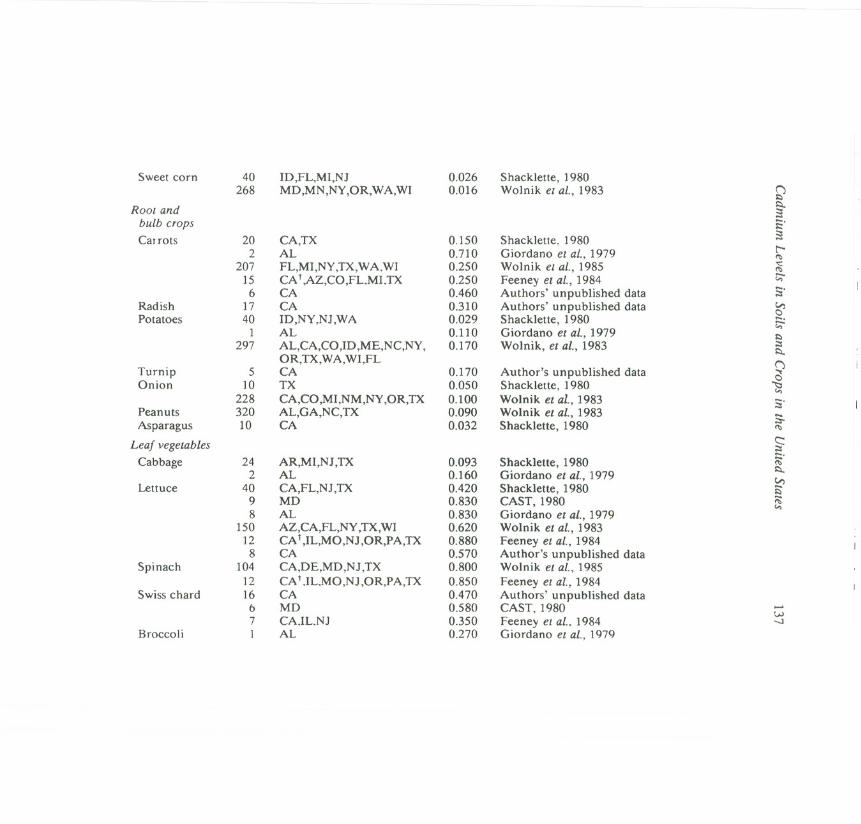
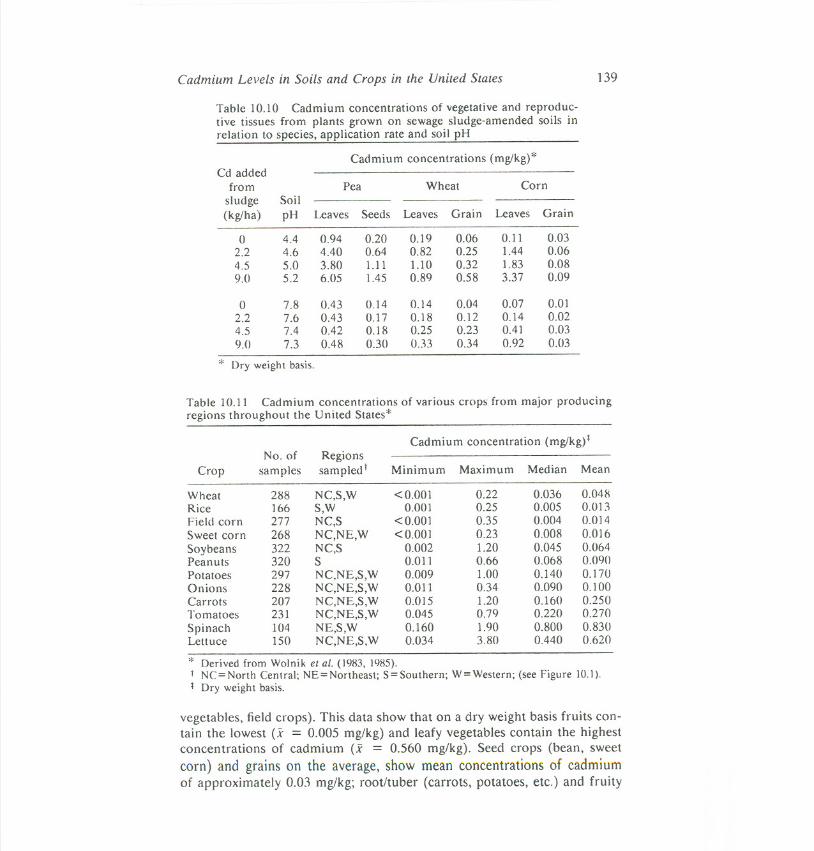
amounts of Cd. The concentrations of Cd in plants vary among speciesand cultivars. Different plant parts (leaves, stems, fruit, roots) accumulatedifferent amounts of Cd (Table 10.9). The concentration of cadmium in theleaves and seeds of pea, wheat and corn (Table 10.10) are representative ofresults reported in the literature. The concentration of Cd in a particularplant part is also influenced by its physiological state of development (Changet al., 1984).
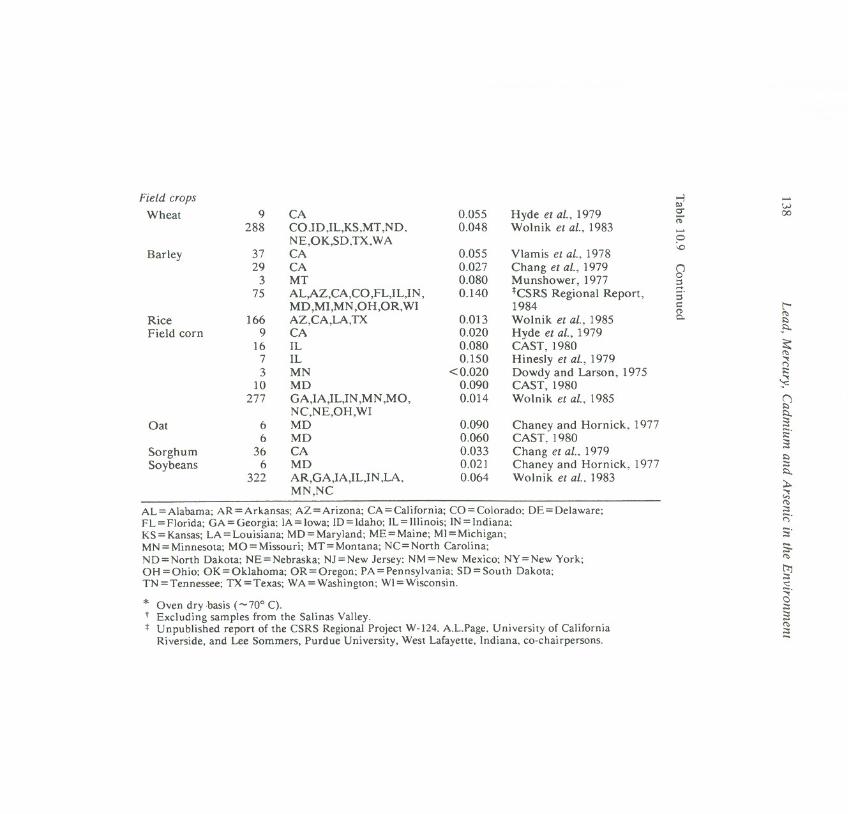
In the past decade numerous reports on the concentrations of Cd in agri-cultural crops grown in the United States have appeared in the literature.Most of these reports, however, deal with a limited number of crops grownat only one location. The recent reports of Shacklette (1980), Wolnick elal. (1983, 1985) and Feeney et al. (1984), however, are exceptions in thatthey deal with a survey of a variety of crops grown in a number of locationsthroughout the continental United States. Data reported in these surveysalong with those obtained from control plots of various field experimentsare presented in Table 10.9. The data pertain to situations where the soils onwhich the crops were grown were not known to be subject to any major ex-ternal sources of Cd contamination. They represent more than one cultivarof the same plant species and a wide variety of soil types and climatic con-ditions. The concentrations of Cd reported for the various crops, therefore,should be representative of natural background levels.
The mean concentrations of the various crops as reported by a numberof investigators vary by a factor of about 2 to 10. For example, the range ofmeans among the various investigators for tomatoes, carrots, lettuce, bar-ley. and field corn are, respectively, 0.08 to 0.52; 0.15 to 0.71; 0.42 to 0.88;0.027 to 0.14 and <0.02 to 0.15 mg/kg (Table ]0.9). The variations are mostlikely due to a combination of differences in substrate Cd concentration, soilproperties such as soil pH, and different cultivars of the crop grown. It isworthwhile to single out the data reported by Wolnik et al. (1983, 1985).These data are derived from a national survey of the main crop produc-tion areas in the United States. The survey was jointly conducted by the USDepartment of Agriculture, Food and Drug Administration, and the Envi-ronmental Protection Agency. Special care was taken to insure that all sitesselected were remote from sources of contamination, and care was takenin the handling, packaging and shipping of samples. All samples were an-alyzed in a specially equipped Food and Drug Administration laboratory.The !ienior author of this review (A.L. Page) served on the advisory com-mittee for the study, and in his opinion the data are among the most reliablein existence. A summary showing maximum, minimum, mean, and medianconcentrations for the various crops surveyed is presented in Table 10.11.Generally, the results of others fall within the range reported by Wolnik etat. (1983. 1985).
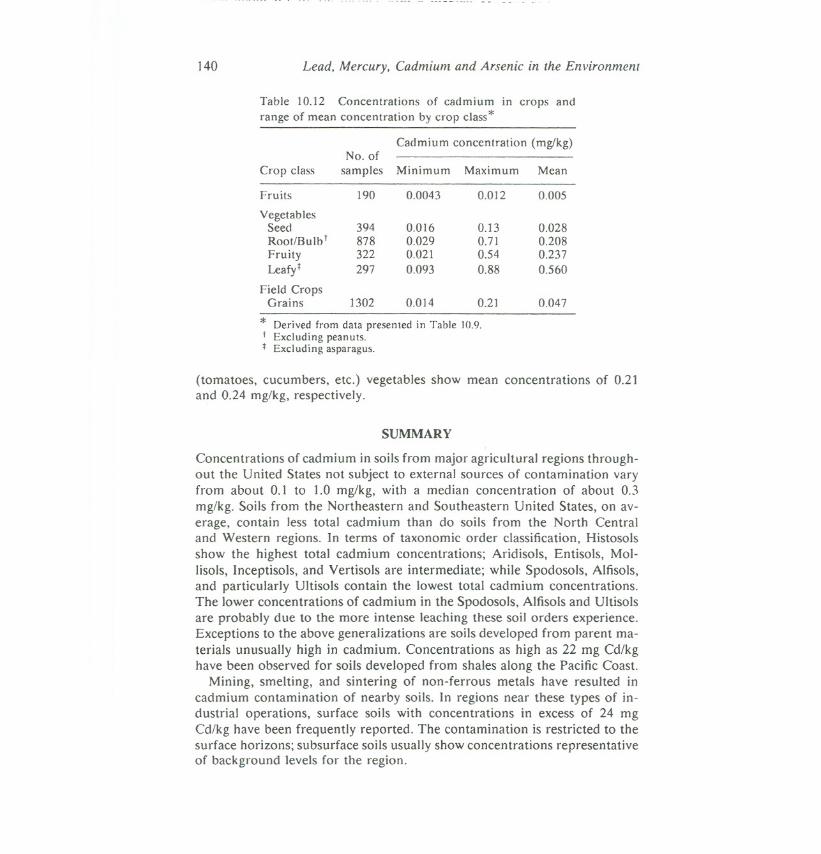
The data presented in Tab]e 10.12 are condensed by crop class (fruits,
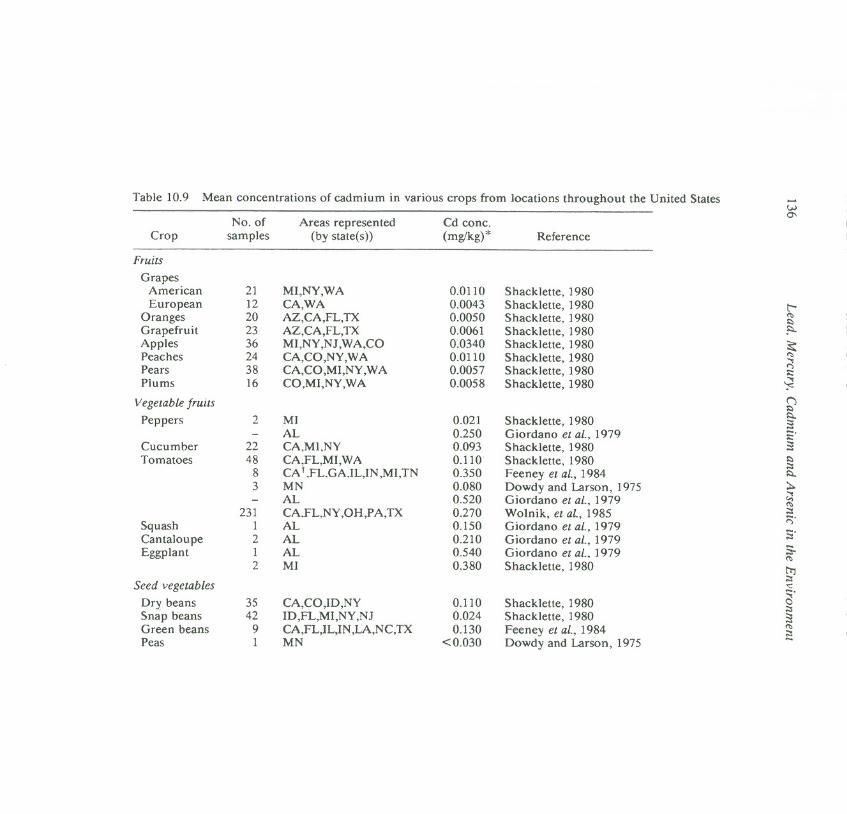
Table 10.9 Mean concentrations of cadmium in various crops from locations throughout the United States w0\.
No. of Areas represented Cd cone.Crop samples (by state( s» (mg/kg)* Reference
Fruits
GrapesAmerican 21 MI,NY,W A 0.0110 Shacklette, 1980European 12 CA,WA 0.0043 Shacklette, 1980 t-
Oranges 20 AZ,CA,FL,TX 0.0050 Shacklette, 1980 '"
Grapefruit 23 AZ,CA,FL,TX 0.0061 Shacklette, 1980Apples 36 MI,NY,NJ,WA,CO 0.0340 Shacklette, 1980Peaches 24 CA,CO,NY,WA 0.0110 Shacklette, 1980 '"..,Pears 38 CA,CO,Ml,NY,WA 0.0057 Shacklette, 1980
"-=Plums 16 CO,MI,NY,WA 0.0058 Shacklette, 1980 .;
Vegetable fruits ('J
Peppers 2 MI 0.021 Shacklette, 1980 ;;:- AL 0.250 Giordano el aI., 1979 -.-=Cucumber 22 CA,MI,NY 0.093 Shacklette, 1980 ;;:Tomatoes 48 CAFL,MI,WA 0.110 Shacklette. 1980 ;::
8 CA t ,FL.GA.IL,IN ,MI,TN 0.350 Feeney el aI., 19843 MN 0.080 Dowdy and Larson, 1975- AL 0.520 Giordano el aI., 1979 '"
231 CAFL.NY ,OH,P A,TX 0.270 Wolnik, el al., 1985 ;::
Squash 1 AL 0.150 Giordano el aI., 1979;::;.
Cantaloupe 2 AL 0.210 Giordano el aI., 1979 S.
Eggplant 1 AL 0.540 Giordano el aI., 1979 ;;.'"2 MI 0.380 Shacklette, 1980 t1j;::
Seed vegetables '<::.
Dry beans 35 CA,CO,ID,NY 0.110 Shacklette, 1980 C);::
Snap beans 42 ID,FL,MI,NY,NJ 0.024 Shacklette, 1980 ;;:Green beans 9 CA,FL,IL,IN ,LA,NC,TX 0.130 Feeney et ai., 1984
'"Peas 1 MN <0.030 Dowdy and Larson, 1975
:::
Sweet corn 40 ID,FL,MI,NJ 0.026 Shacklette, 1980268 MD,MN,NY,OR,WA,WI 0.016 Wolnik exai., 1983 Q
Root andbulb crops
....;:
Carrots 20 CA,TX 0.150 Shacklette, 19802 AL 0.710 Giordano ex ai., 1979 t"'-
207 FL,MI,NY,TX,WAWI 0.250 Wolnik ex ai., 1985 '<::
15 CA r,AZ,CO,FL.MLTX 0.250 Feeney ex ai., 1984 1;;-6 CA 0.460 Authors' unpublished data S.
Radish 17 CA 0.310 Authors' unpublished dataPotatoes 40 ID,NY,NJ,WA 0.029 Shacklette, 1980 ::::
1 AL 0.110 Giordano ex ai., 1979""I:)
297 AL,CA,CO,ID,ME,NC,NY, 0.170 Wolnik, el al., 1983 ;::s
OR,TX,W A,WI,FLQTurnip 5 CA 0.170 Author's unpublished data
Onion 10 TX 0.050 Shack1ette, 1980 .g""228 CA,CO,MI,NM,NY,OR,TX 0.100 Wolnik el al., 1983 S.
Peanuts 320 AL,GA,NC,TX 0.090 Wolnik el al., 1983 -Asparagus 10 CA 0.032 Shacklette, 1980
;:::-
Leaf vegelables c::::=.
Cabbage 24 AR,MI,NJ ,TX 0.093 Shacklette, 19802 AL 0.160 Giordano el al., 1979 V)
Lettuce 40 CA,FL,NJ,TX 0.420 Shacklette, 19809 MD 0.830 CAST, 1980 ""8 AL 0.830 Giordano el al., 1979
150 AZ,CA,FL,NY,TX,WI 0.620 Wolnik el at., 198312 CA r,IL,MO,NJ ,OR,PA,TX 0.880 Feeney el at., 1984
8 CA 0.570 Author's unpublished dataSpinach 104 CA,DE,MD,NJ ,TX 0.800 Wolnik el at., 1985
12 CAt .IL.MO,NJ,OR,PA,TX 0.850 Feeney el at., 1984Swiss chard 16 CA 0.470 Authors' unpublished data
6 MD 0.580 CAST, 1980 -I.J,.)7 CA.IL.NJ 0.350 Feeney et ai., 1984 -..J
Broccoli 1 AL 0.270 Giordano exai., 1979
Field cropsWheat
Barley
RiceField corn
Oat
SorghumSoybeans
.....(;.)00
t"'-t':>!:>.~
~t':>..,<"'>-=
9()!:>~S!:;:'S!;:,;::~~~t':>;::(:;.AL=Alabama; AR=Arkansas; AZ=Arizona; CA=California; CO=Colorado; DE=Delaware;
FL = Florida; GA = Georgia; IA= Iowa; JD= Idaho; IL = Illinois; IN = Indiana;KS=Kansas; LA=Louisiana; MD = Maryland; ME = Maine; MI=Michigan;MN=Minnesota; MO=Missouri; MT=Montana; NC=North Carolina;ND=North Dakota; NE=Nebraska; NJ=New Jersey; NM=New Mexico; NY=New York;OH =Ohio; OK=OkIahoma; OR=Oregon; PA = Pennsylvania; SD=South Dakota;TN = Tennessee; TX = Texas; WA = Washington; WI = Wisconsin.
* Oven dry basis (-700 C).r Excluding samples from the Salinas Valley.; Unpublished report of the CSRS Regional Project W-I24. A.L.Page. University of California
Riverside, and Lee Sommers, Purdue University, West Lafayette, Indiana, co-chairpersons.
s.
;:;'"t'1'];::'<:~.a;::;=t':>:::
...,Q)
9 CA 0.055 Hyde el at., 1979cr-ib
288 CO.ID,IL,KS,MT,ND. 0.048 Wolnik el at., 1983 -NE,OK,SD.TX.WA 0
37 CA 0.055 Vlamis el at., 197829 CA 0.027 Chang el at., 1979 ()
3 MT 0.080 Munshower,19770
75 AL,AZ,CA,CO,FL,IL,IN, 0.140 ;CSRS Regional Report, 5'MD,MI,MN,OH,OR,WI 1984 t:
(I>166 AZ,CA,LA,TX 0.013 Wolnik el al., 1985
0..
9 CA 0.020 Hyde el at., 197916 IL 0.080 CAST, 19807 IL 0.150 Hinesly et at., 19793 MN <0.020 Dowdy and Larson, 1975
10 MD 0.090 CAST, 1980277 GA,IA,IL,IN ,MN ,MO, 0.014 Wolnik el at., 1985
NC,NE,OH,WI6 MD 0.090 Chaney and Hornick, 19776 MD 0.060 CAST, 1980
36 CA 0.033 Chang el at.. 19796 MD 0.021 Chaney and Hornick, 1977
322 AR,GA,IA,IL,IN ,LA, 0.064 Wolnik el at., 1983MN,NC
Cadmium Levels in Soils and Crops in the United States 139
vegetables, field crops). This data show that on a dry weight basis fruits con-tain the lowest ex = 0.005 mg/kg) and leafy vegetables contain the highestconcentrations of cadmium (i = 0.560 mg/kg). Seed crops (bean, sweetcorn) and grains on the average, show mean concentrations of cadmiumof approximately 0.03 mg/kg; root/tuber (carrots, potatoes, etc.) and fruity
Table 10.10 Cadmium concentrations of vegetative and reproduc-tive tissues from plants grown on sewage sludge-amended soils inrelation to species, application rate and soil pH
Cadmium concentrations (mglkg)*Cd added
from Pea Wheat Corn
sludge Soil
(kglha) pH Leaves Seeds Leaves Grain Leaves Grain
0 4.4 0.94 0.20 0.19 0.06 0.11 0.032.2 4.6 4.40 0.64 0.82 0.25 1.44 0.064.5 5.0 3.80 1.11 1.10 0.32 1.83 0.089.0 5.2 6.05 1.45 0.89 0.58 3.37 0.09
0 7.8 0.43 0.14 0.14 0.04 0.07 0.012.2 7.6 0.43 0.17 0.18 0.12 0.14 0.024.5 7.4 0.42 0.18 0.25 0.23 0.41 0.039.0 7.3 0.48 0.30 0.33 0.34 0.92 0.03
* Dry weight basis.
Table 10.11 Cadmium concentrations of various crops from major producingregions throughout the United States*
Cadmium concentration (mglkg)tNo. of Regions
Crop samples sampledt Minimum Maximum Median Mean
Wheat 288 NC,S,W <0.001 0.22 0.036 0.048Rice ]66 S,W 0.00] 0.25 0.005 0.0]3Field corn 277 NC,S <0.00] 0.35 0.004 0.0]4Sweet corn 268 NC,NE,W <0.001 0.23 0.008 0.0]6
Soybeans 322 NC,S 0.002 1.20 0.045 0.064Peanuts 320 S 0.01] 0.66 0.068 0.090Potatoes 297 NC,NE,S,W 0.009 1.00 0.140 0.170Onions 228 NC,NE,S,W 0.0] 1 0.34 0.090 0.]00Carrots 207 NC,NE,S,W 0.Q15 1.20 0.]60 0.250Tomatoes 231 NC,NE,S,W 0.045 0.79 0.220 0.270
Spinach 104 NE,S,W 0.160 1.90 0.800 0.830Lettuce ]50 NC,NE,S,W 0.034 3.80 0.440 0.620
* Derived from Wolnik et al. (]983, 1(85).t NC=North Central; NE=Northeast; S=Southern; W=Western; (see Figure 10.1).t Dry weight basis.
140 Lead, Mercury, Cadmium and Arsenic in the Environment
* Derived from data presented in Table JO.9.r Excluding peanuts.* Excluding asparagus.
(tomatoes, cucumbers, etc.) vegetables show mean concentrations of 0.21and 0.24 mg/kg, respectively.
SUMMARY
Concentrations of cadmium in soils from major agricultural regions through-out the United States not subject to external sources of contamination varyfrom about 0.1 to 1.0 mg/kg, with a median concentration of about 0.3mg/kg. Soils from the Northeastern and Southeastern United States, on av-erage, contain less total cadmium than do soils from the North Centraland Western regions. In terms of taxonomic order classification, Histosolsshow the highest total cadmium concentrations; Aridisols, Entisols, Mol-lisols, Inceptisols, and Vertisols are intermediate; while Spodosols, Alfisols,and particularly Ultisols contain the lowest total cadmium concentrations.The lower concentrations of cadmium in the Spodosols, Alfisols and Ultisolsare probably due to the more intense leaching these soil orders experience.Exceptions to the above generalizations are soils developed from parent ma-terials unusually high in cadmium. Concentrations as high as 22 mg Cd/kghave been observed for soils developed from shales along the Pacific Coast.
Mining, smelting, and sintering of non-ferrous metals have resulted incadmium contamination of nearby soils. In regions near these types of in-dustrial operations, surface soils with concentrations in excess of 24 mgCd/kg have been frequently reported. The contamination is restricted to thesurface horizons; subsurface soils usually show concentrations representativeof background levels for the region.
Table 10.12 Concentrations of cadmium in crops andrange of mean concentration by crop class*
Cadmium concentration (mglkg)No. of
Crop class samples Minimum Maximum Mean
Fruits 190 0.0043 0.012 0.005
VegetablesSeed 394 0.016 0.13 0.028Root/Bulb r 878 0.029 0.71 0.208Fruity 322 0.021 0.54 0.237
Leafy* 297 0.093 0.88 0.560
Field CropsGrains 1302 0.014 0.21 0.047
Cadmium Levels in Soils and Crops in the United States 141
The major soil factors which influence the accumulation of cadmium byplants are soil pH and cadmium concentration. All other soil factors beingequal, the accumulation of cadmium by crops increases as the pH of the soildecreases and as the concentration of cadmium in soil increases. Althoughfertilization and atmospheric deposition are sources of cadmium, amountsadded to rural agricultural soils from these sources are small and amount toa few grams per hectare per year or less.
Concentrations of cadmium in crops vary quite substantially amongspecies and even among cultivars of the same species. Different parts of theplant (leaves, stems, fruit, roots) accumulate different amounts of cadmium.For the above-ground parts, leaves usually contain greater concentrations ofcadmium than the flowering and fruiting parts of the plant. On a dry weightbasis, fruits (e.g. grapes, citrus, apples, peaches, etc.) contain the lowest con-centrations of cadmium (i = 0.005), and leafy vegetables (lettuce, spinach,etc.) the highest total concentration (i = 0.560). Seed crops (bean, sweetcorn) and grains on the average, show mean concentrations of cadmium ofapproximately 0.03 mg/kg; root/tuber (carrots, potatoes, etc.) and vegetablefruits (tomatoes, cucumbers, etc.) show mean concentrations of 0.21 and0.24 mg/kg, respectively. The efficacy with which leafy crops take up Cdand transport it to the foliage suggests caution and monitoring of sewagesludge additions to land on which these crops are or might be grown.
The concentrations of crops grown in the United States vary within andamong crop species. Within any particular plant species the variation inconcentration of crops grown at one location to those of the same crop givenanother location can be as much as a factor of 600; factors ranging from 50to 300 are common. For example, the concentration of cadmium in wheatwas observed to vary from a minimum of 0.001 mg Cd/kg when grown at onelocation to a maximum of 0.22 mg Cd/kg when grown at another. Similarly,from one location to another the concentrations of cadmium for carrots and
potatoes varied from 0.015 to 1.2 and 0.009 to 1.0 mg/kg, respectively.Third World countries, as compared with the Western world, are less
likely to be subjected to a Cd-contaminated environment. The main sourceof Cd human burden for those populations is food. Since the main source ofCd human burden for those populations is food, and the per capita dietaryconsumption of grains is high, the impact of Cd enrichment may be pro-portionately magnified. Food crops imported from or grown in areas highin Cd may result in a greater impact. Other factors such as the less stringentemission control and waste disposal measures for the developing industriescontribute to the potential environmental hazards of Cd.
REFERENCES
Auer, C. (1977). Caflmiumin PhosphateFertilizerProduction.USEnvironmentalProtection Agency, MidwestResearch Institute Report, Washington, DC.
142 Lead. Mercury, Cadmium and Arsenic in the Environment
Bingham, F. T., Page, A. L., Mahler, R. J., and Ganje, T. J. (1976). Cadmium avail-ability to rice in sludge-amended soil under 'flood' and 'nonflood' culture. SoilSci. Sac. Am. J., 40, 715-7]9.
Buchauer, M. J. (1973). Contamination of soil and vegetation near a zinc smelterby zinc, cadmium, copper and lead. Environ. Sci. Technol., 7, 131-135.
Burau, R. G., Kaita, K. Y., Inouye, T. S., and Miller, M. (1973). Chemical Analysisof Soil Samples from the Salinis Valley, California for Cadmium, Zinc, and Phos-phate. Report to State Water Resources Control Board, University of California,Davis.
CAST (Council for Agricultural Science and Technology) (] 976). Application ofSewage Sludge to Cropland: Appraisal of Potential Hazards of the Heavy Metals toPlants and Animals. Council for Agricultural Science and Technology, No. 64,Ames, Iowa, 63 pages.
CAST (Council for Agricultural Science and Technology) (1980). Effectsof SewageSludge on the Cadmium and Zinc Content of Crops. Council for AgriculturalScience and Technology, No. 83, Ames, Iowa, 77 pages.
Chaney, R. L., White, M. C, and Simon, P. W. (1975). Plant uptake of heavy metalsfrom sewage sludge applied to land. In Proceedings of Second National Conference.on Municipal Sludge Management. p. ]69, Information Transfer, Inc., Rockville,MD.
Chaney, R. L., and Hornick, S. B. (1978). Accumulation and effects of cadmiumon crops. In Proceedings of First International Cadmium Conference, p. ]25, SanFrancisco, Metal Bulletin Ltd, London.
Chang, A. C, Page, A. L., Lund, L. J., Pratt, P. F., and Bradford, G. R. (1979).Land application of sewage sludges-a field demonstration. Final report, RegionalWastewater Solids Management Program, Los Angeles/Orange County Metropoli-tan Area (LNOMA Project). 311 pages.
Chang A. C, Page, A. L., Warneke. J. E., and Johanson. J. B. (1982). Effects ofsludge application on the Cd, Pb and Zn levels of selected vegetable plants. Hit-gardia, 50, ]-14.
Chang. A. C, Page. A. L., Warneke, J. E.. Resketo, M. R., and Jones T. E. (1983).Accumulation of cadmium and zinc in barley grown in sludge-treated soils: Along-term field study. J. Environ. Qual. 12,39]-397.
Chang. A. C. Warneke, J. E., Page A. L., and Lund L. J. (1984). Accumulation ofheavy metals in sewage sludge-treated soils. J. Environ. Qual. 13, 87-91.
Corey. R. B., Fujii, R., and Hendrickson, L. L. (1981). Bioavailability of heavymetals in soil-sludge.In Conferenceon Application ResearchPracticesof Municipaland Industrial Waste,p. 449, University of Wisconsin Extension, Madison.
Cunningham. J. D., Keeney, D. R., and Ryan, J. A. (1975). Yield and metal compo-sition of rye grown on sewage sludge-amended soil. J. Environ. Qual., 4, 448-454.
DeVries. M. P. C, and Tiller, K. G. (1978). Sewage sludge as a soil amendmentwith special reference to Cd, Mn, Ni, Pb and Zn comparisons of results fromexperiments conducted inside and outside a glasshouse.Environ. Pollut., 16,231-240.
Dowdy, R. H., and Larson, W. E. (1975). The availability of sludge-horne metals tovarious vegetable crops. J. Environ. Qual., 4, 278-282.
Feeney, S., Peterson, J. R., Zenz, D. R., and Lue-Hing, C (1984). NationalSurvey of the Metals Content of Seven Vegetable Species. Dep!. of Researchand Development-Report No. 84-4 Metropolitan Sanitary District of GreaterChicago, Chicago, Illinois. .
Fleischer, M., Sarofim, A. F., Fassett, D. W., Hammond, P., Shacklette, H. T., Nisbet,
Cadmium Levels in Soils and Crops in the United States 143
I. c., and Epstein, S. (1974). Environmental impact of cadmium; A review by thepanel on hazardous trace substances. Environ. Health Persp., 7, 253-323.
Forbes. E. A., Posner, A M., and Quirk. J. P. (1976). The specific adsorption ofdivalent Cd, Co, Cu. Pb and Zn on geothite. Soil Sci., 27, 154-160.
Francis, C. W. and Rush, S. G. (1974). Factors affecting uptake and distribution ofcadmium in plants. In Hemphill, D. D. (Ed.), Trace Substances in EnvironmentalHealth VI/, p. 75, University of Missouri Press. Columbia.
Friberg, L., Piscator, M., Nordberg, G., and Kjellstrom. T. (1974). Cadmium in theEnvironment. 2nd ed. CRC Press, Cleveland, Ohio, 248 pages.
Fulkerson, W., and Goeller, H. E. (Eds) (1973). Cadmium, the Dissipated Elemall.Oak Ridge National Laboratory, Oak Ridge. Tennessee, ORNUNSF/EP-21.
Giordano, P. M., Mays, D. A, and Behel, A D-Jr. (1979). Soil temperature effectson the uptake of cadmium and zinc by vegetables grown on sludge-amended soil.J. Environ. Qual., 8, 232-236.
Goldschmidt, V. M. (1958). Geochemistry. Oxford University Press, London, 730pages.
Gong, H., Rose, A W., and Suhr, N. H. (1977). The geochemistry of cadmium insome sedimentary rocks. Geochim. Cosmochim. Acta., 41, 1687.
Haghiri, F. (1974). Plant uptake of cadmium as influenced by cation exchangecapacity, organic matter. zinc and soil temperature. J. Environ. Qual., 3, 180-183.
Heinrichs. H., Schulz-Dobrick, B.. and Wedepohl, K. H. (1980). Terrestrial Geo-chemistry of Cd, Bi. Ti, Pb, Zn and Rb. Geochim. Cosmochim. Acta., 44, 1519-1532.
Hinesly, T. D., Ziegler. E. L., and Barrett, G. L. (1979). Residual effects of irrigatingcorn with digested sewage sludge. J. Environ. Qual., 8, 35-38.
Holmgren, G. G. S., Meyer, M. W.. Daniels, R. B., Kubota, 1.. and Chaney. R.L. (1986). Cadmium. lead, zinc. copper, and nickel in agricultural soils in theUnited States. J. Environ. Qua/., 16 (in press).
Horn, M. K., and Adams, J. A S. (1966). Computer-derived geochemical balancesand element abundances. Geochim. Cosmochim. Acta., 30, 279.
Hunt, W. F., Pinkerton, c., McNulty. 0., and Creason, J. A (1971). A study of traceelement pollution of air in 77 midwestern cities. In Hemphill, D. D. (Ed.), TraceSubstances in Environmental Health IV, p. 56, University of Missouri, Columbia.
Hyde, H. c., Page, A. L., Bingham. F. T., and Mahler, R. J. (1979). Effect of heavymetals in sludge on agricultural crops. J. Water PoUut. Comrol Fed., 51, 2475-2486. .
Iwai, I., Hara, T., and Sonoda, Y. (1975). Factors affecting cadmium uptake by cornplant. Soil Sci. Plant Nutr., 21,37-46.
John, M. K., Van Laerhoven, C. J., and Chuah, H. H. (1972). Factors affecting plantuptake and phytotoxicity of cadmium added to soils. Environ. Sci. Technol., 6,1005-1009.
Johnson. R. D., Miller, R. J., Williams, R. E., Wai, C. M., Wies, A c.. and Mitchell,J. E. (1975). The heavy metal problem of Silver Valley, Northern Idaho. InHutchinson. T. C. (Ed.), Proceedings of Imernational Conference on Heavy Met-als in the Environmem. Vol. II, Part 2, p. 465, University of Toronto, Toronto,Canada.
Kjellstrom, T., and Nordberg, G. F. (1978). A kinetic model of cadmiummetabolism in human beings. Environ. Res.~ 16, 248-269.
Klein, D. H. (1972). Mercury and other metals in urban soils. Env. Sci. Techno/., 6,558-559.
144 Lead, Mercury, Cadmium and Arsenic in the Environment
Kowal, N. E. (1984). An overview of public health effects. In Page, A. L., Gleason, T.L., Smith, J. E., Iskandar, I. K., and Sommers, L. E. (Eds), Utilization of MunicipalWastewater and Sludge on Land, p. 329. University of California Press, Riverside,California.
Lagerwerff, J. V., and Biersdorf, G. T. (1971). Interactions of zinc with uptake andtranslocation of cadmium in radish. In Hemphill, D. D. (Ed.), Trace Substancesin Environ.mental Health V, p. 515, University of Missouri Press, Columbia, Mis-souri.
Lagerwerff, J. V., and Brower, D. L. (1975). Source determination of heavy metalcontaminants in the soil of a mine and smelter area. In Hemphill, D. D. (Ed.),Trace Substances in Environmental Health IX, p. 207, University of Missouri Press,Columbia, Missouri.
Lindberg, S. E., Turner, R. R., Shriner, D. S., and Huff, D. D. (1981). Atmosphericdeposition of heavy metals and their interaction with acid precipitation in a NorthAmerican deciduous forest. In Proceedings of International Conference on HeavyMetals in the Environment, p. 306, CEP Consultants Ltd, Edinburgh, U. K.
Logan, T. J., and Miller, R. H. (1983). Background Levels of Heavy Metals in OhioFarm Soils. Research Circular 275. The Ohio State University Agricultural Re-search and Development, Wooster, Ohio.
Logan, T. J., and Chaney, R. (1984). Metals. In Page, A. L., Gleason, T. L., Smith, J.E., Iskandar. I. K., and Sommers, L. E. (Eds), Utilization of Municipal Wastewaterand Sludge on Land, p. 235, University of California Press, Riverside, California.
Lund, L. J., Betty, E. E., Page, A. L., and Elliott, R. A. (1981). Occurrence ofhigh Cd levels in soil and its accumulation by vegetation. J. Environ. Qual.. 10,551-556.
Lyon. W. S. (1977). Trace Element Measurements at the Coal-fired Power Plant. CRCPress. Cleveland, OR 136 pages.
Mahaffey. K. R.. Corneliussen, P. E., Jelinek, C F., and Fiorino, J. A. (1975). Heavymetal exposure from foods. Environ. Health Perspec., 12,63-69.
Mahler, R. J.. Bingham, F. T., and Page, A. L. (1978). Cadmium-enriched sewagesludge application to acid and calcareous soils: I. Effect on yield and cadmiumuptake by lettuce and Swiss chard. J. Environ. Qual., 7, 274-281.
Marowsky, G., and Wedepohl, K. H. (1971). General trends in the behavior of Cd,Hg, Ti, and Bi in some major rock forming processes. Geochim. Cosmochim.Acta., 35, 1255.
McLean, A. J. (1976). Cadmium in different plant species and its availability in soilsas influenced by organic matter and additions of lime, P, Cd and Zn. CanadianJ. Soil Sci., 56, 129-138.
Mitchell, G. A., Bingham, F. T., Page, A. L., and Nash, P. (1978). Yield and metalcomposition of lettuce and wheat grown on soils amended with sewage sludgeenriched with Cd, Cu, Ni and Zn. J. Environ. Qual., 7,165-171.
Mullin, J. B., and Riley, J. P. (1956). The occurrence of cadmium in sea water andin marine organisms and sediments. J. Marine Res., IS, 103.
Munshower, F. F. (1977). Cadmium accumulation in plants and animals of pollutedand nonpolluted grasslands. J. Environ. Qual., 6, 411-413.
Ondov, J. M., Regaini. R. C, Heft, R. E., Fisher, G. L., Silberman, D., and Pren-tice. B. A. (1976). Interlaboratory comparison of neutron activation and atomicabsorption analyses of size-classified stack fly ash. Eighth Materials Research Sym-posium on Methods and Standards for Environmental Measurement. Gaithersberg,MD.
Page, A. L. (1974). Fazeand Effects of Trace Elemenls in Sewage Sludge When Applied
Cadmium Levels in Soils and Crops in the United States 145
10Agricultural Lands. U. S. Environmental Protection Agency Special PublicationEPA 670/2-74-005.
Page, A. L.. and Chang. A. C (1978). Trace elements impact on plants during crop-land disposal of sewage sludges. In Proceedings of Fifth National Conference on Ac-ceplabte Sludge Disposal Techniques, p. 91, Information Transfer Inc., Rockville,Maryland.
Page, A. L., Bingham, F. T., and Chang, A. C (1981). Cadmium in terrestrial plants.In Lepp, N. W.. (Ed.) Effect of Heavy Metal Pollution on Plants. Vol. I. Effects ofTrace Metals on Plant Function, p. 77, Applied Science Publishers, London, U. K.
Pahren, H. R., Lucas, J. B., Ryan, J. A.. and Dotson, G. R. (1979). Health risksassociated with land application of municipal sludge. J. Water Pollul. ControlFed., 51, 2588-2601.
Pierce, F. J., Dowdy, R. H., and Grigal, D. F. (1982). Concentrations of six tracemetals in some major Minnesota soil series. J. Environ. Qual., 11,416-422.
Ragaini, R. C, Ralston, H. R., and Roberts, N. (1977). Environmental trace metalcontamination in Kellogg, Idaho near a lead smelting complex. Environ. Sci. Tech-no/., 11,773-781.
Rupp, E. M., Parzyck. D. C, Walsh, P. J., Booth, R. S., Raridon R. L and Whitfield,B. L. (1978). Composite hazard index for assessing limiting exposures to environ-mental pollutants: Application through a case study. Environ. Sci. TechnoL., 12,802-807.
Ryan. J. A.. Pahren, H. R.. and Lucas, J. B. (1982). Controlling cadmium in thehuman food chain: A review and rationale based on health effects. Enl'iron. Res.,28, 251-302.
Shacklettc, H. T. (1980). Elements in Fruits and Vegetables from Areas of Commer-cial Production in the Conterminous United States. Geological Survey ProfessionalPaper No.1178. US Government Printing Office. Washington. DC 149 pages.
Sommers, L. E. (1977). Chemical composition of sewage sludges and analysis oftheir potential use as fertilizers. J. Environ. Qual.. 6, 225-232.
Sommers, L. E. (1982). Toxic metals in agricultural crops. In Bitton, G.. Damron,B. L., Edds, G. T.. and Davidson, J. M. (Eds), Sludge-Health Risks of Land Ap-plication, p. 105, Ann Arbor Science Publishersn'he Butterworth Group, AnnArbor, Michigan.
Stenstrom, T., and Lonsjo, H. (1974). Cadmium availability to wheat: a study withradioactive tracers under field conditions. Ambio, 3, 87-90.
Street, J. J., Sabey, B. R., and Lindsay, W. L. (1978). Influence of pH, phosphorus,cadmium, sewage sludge, and incubation time on the solubility and plant uptakeof cadmium. J. Environ. Qual., 7, 286-290.
Takijima, Y.. Katsumi, F., and Takezawa. K. (1973). Cadmium contamination ofsoils and rice plants caused by zinc mining. II. Soil conditions of contaminatedpaddy fields which influence heavy metal contents of rice. Soil Sci. Plam Nutr.,19,173-182.
Tsuchiya, K. (Ed). (1978). Cadmium Studies in Japan-A Review. Elsevier/North HoI-land Biomedical Press, Amsterdam.
US Environmental Protection Agency (1972). Helena Valley, Montana Area Envi-ronmental Pollution Study. EPA Office of Air Programs Publ. AP-91 ResearchTriangle Park. North Carolina.
US Environmental Protection Agency. (1978). Cadmium additions 10 AgriculturalLands Via Commercial Phosphate Fercilizers-A Preliminary Assessment, p. 35, Of-fice of Water and Waste Management, Washington DC. Soil Waste ManagementSeries No. SW-718.
146 Lead, Mercury, Cadmium and Arsenic in the Environment
Valadares, J. M. A S., Gal, M., Mingelgrin, U., and Page. A L. (1983). Some heavymetals in soils treated with sewage sludge, their effects on yield, and their uptakeby plants. J. Environ. Qual., 12,49-57.
VIamis, J.. Williams, T. E., Fang, K., and Corey, J. E. (1978). Metal uptake by barleyfrom field plots fertilized with sludge. Soil Sci., 126, 49-55.
Waketa, H., and Schmitt, R. A (1970). Cadmium. In Wedepohl, K. H. (Ed.), Hand-book of Geochemistry. Springer-Verlag, New York, Chapter 48.
Wedepohl, K. H. (1968). Origin and distribution of elements. In Ahrens, L. H. (Ed).International Symposium on the Origin and Distribution of the Elements, p. 999,Pergamon Press, New York.
Williams, C. H., and David, D. J. (1977). Some effects of the distribution of cad-mium and phosphate in the root zone on the cadmium content of plants. Aus-tralian J. Soil Res., 15, 59-68.
Wolnik, K. A, Fricke, F. L., Capar, S. G., Braude, G. L., Meyer, M. W., Satzger,R. D., and Bonnin, E. (1983). Elements in major raw agricultural crops in theUnited States. I. Cadmium and lead in lettuce, peanuts, potatoes, soybeans, sweetcorn and wheat. J. Agric. Food Chern., 31,1240-1244.
Wolnik, K. A, Fricke, F. L., Capar. S. G., Meyer, M. W., Satzger, R. D., Bonnin, E.and Gaston, C. M. (1985). Elements in major raw agricultural crops in the UnitedStates. III. Cadmium, lead and other elements in carrots, field corn, onion. rice,spinach and tomatoes. J. Agric. Food Chern., 33, 807-811.