c82mcp diploma statistics school of psychology university of nottingham 1 designing experiments in...
Post on 19-Dec-2015
221 views
TRANSCRIPT

C82MCP Diploma Statistics
School of PsychologyUniversity of Nottingham
1
Designing Experiments
• In designing experiments we:• Manipulate the independent variable and hold all other
conditions constant.• Any observed changes in the dependent variable can be
attributed to the manipulation of the independent variable.

C82MCP Diploma Statistics
School of PsychologyUniversity of Nottingham
2
Correlational Studies• Sometimes the manipulation of independent variables is only
part of what we do• Sometimes we are more interested in finding out whether two
variables are related to each other.• For Example:
• Are IQ and reading ability associated with each other• In other words,
• Do high IQ scores and high reading ability scores occur together and low IQ scores and reading ability scores occur together

C82MCP Diploma Statistics
School of PsychologyUniversity of Nottingham
3
Correlational Studies
• When we ask about the relationship between two variables we have a correlational design• The null hypothesis associated with correlational designs
is that there is no relationship between variables• The alternative hypothesis associated with correlational
designs is that there is a relationship between variables

C82MCP Diploma Statistics
School of PsychologyUniversity of Nottingham
4
Covariance - A Measure of Association
• Covariance is defined as the sum of the product of two variables
• The value of the covariance is closely related to the relationship between X and Y• The larger the absolute value of the covariance the
stronger the relationship between X and Y.• The sign of the covariance tells us about the kind of
association
Covariance =(x - x )(y - y )
N

C82MCP Diploma Statistics
School of PsychologyUniversity of Nottingham
5
Covariance - A Measure of Association
• A Problem With Covariance• When there is an association between two variables the
value of the covariance depends on:• The degree or size of the association• The ranges of the two variables
X Ys1 1 4 2s2 2 6 0s3 3 8 2Mean 2 6 1.33
(X X )(Y Y ) X Ys1 10 40 200s2 20 60 0s3 30 80 200Mean 20 60 133.33
(X X )(Y Y )

C82MCP Diploma Statistics
School of PsychologyUniversity of Nottingham
6
Pearson's Product-Moment Coefficient of Correlation
• If we divide the covariance of two variables by the standard deviation of each variable we can account for the differences between the ranges• Pearson's Product-Moment Coefficient of Correlation, r, does
precisely this
• or
r Covariance(x, y)
sdx .sdy
r (x x )(y y )N.sdx .sdy
C82MCP Diploma Statistics
School of PsychologyUniversity of Nottingham
7
Pearson's Product-Moment Coefficient of Correlation
• The absolute value of this coefficient always lies between zero and one regardless of the different ranges of the variables
• The sign of the coefficient tells us what kind of association we have
• There are tables of values that estimate the probability of getting a particular value for Pearson's product-moment coefficient.
• Using these we can test the null hypothesis of no association between two variables.

C82MCP Diploma Statistics
School of PsychologyUniversity of Nottingham
8
An Example of a Positive Correlation
• Suppose a researcher measured the reading age and IQ of six 8 year old children
• The results of the measurement are placed on a scatter graph.
IQ vs Reading Age
80
85
90
95
100
105
110
115
120
125
6 6.5 7 7.5 8 8.5 9 9.5 10 10.5

C82MCP Diploma Statistics
School of PsychologyUniversity of Nottingham
9
An Example of a Positive Correlation
• Given these data:
• The critical value of r for N=6 is 0.811• For a correlation to be significant
• robserved rcritical
• For these data there is no evidence of a significant association between IQ and Reading Age.
Reading Age IQs1 7.9 101 3.6049s2 8.2 113 -0.7361s3 6.3 94 30.3669s4 9.4 116 7.5499s5 8.4 107 -0.0501s6 10 121 20.0979mean 8.37 108.67 10.1389s.d. 1.28 10.01
(X X )(Y Y )
r Covariance(x, y)
sdx .sdy
r 10.1389(1.28)(10.01)
0.791

C82MCP Diploma Statistics
School of PsychologyUniversity of Nottingham
10
An Example of a Negative Correlation
• Suppose a researcher measured the reading age and the emotional and behavioural difficulties of six 8 year old children
• The results of the measurement are placed on a scatter graph.
EBD Scale vs Reading Age
0
2
4
6
8
10
12
14
16
18
20
6 6.5 7 7.5 8 8.5 9 9.5 10 10.5

C82MCP Diploma Statistics
School of PsychologyUniversity of Nottingham
11
• Given these data:
• The critical value of r for N=6 is 0.811• For a correlation to be significant
• robserved rcritical
• For these data there is no evidence of a significant association between EBD and Reading Age.
An Example of a Negative Correlation
Reading Age EBDs1 7.9 11 -1.0199s2 8.2 9 -0.0289s3 6.3 17 -16.9119s4 9.4 7 -1.8849s5 8.4 6 -0.0849s6 10 3 -9.5029mean 8.37 8.83 -4.90556667s.d. 1.28 4.83
(X X )(Y Y )
r Covariance(x, y)
sdx .sdy
r 4.9056(1.28)(4.83)
0.793

C82MCP Diploma Statistics
School of PsychologyUniversity of Nottingham
12
Spearman's Rank Correlation Coefficient
• Spearman Rank Coefficient of Correlation is an adaptation of Pearson's product-moment coefficient of correlation for ranks.• For each variable we rank the scores associated with that
variable. • We calculate the covariance and the standard deviations
for the ranks. • Dividing the covariance by the two standard deviations
we get Spearman's Rank Coefficient of Correlation.

C82MCP Diploma Statistics
School of PsychologyUniversity of Nottingham
13
An Example of Spearman's Rank Correlation (Rho)
• For a correlation to be significant
• rhoobserved rhocritical
• For these data there is no evidence of a significant association between IQ and Reading Age.
R.A. Rank IQ Ranks1 7.9 2 101 2 2.25s2 8.2 3 113 4 -0.25s3 6.3 1 94 1 6.25s4 9.4 5 116 5 2.25s5 8.4 4 107 3 -0.25s6 10 6 121 6 6.25mean 3.50 3.50 2.7500s.d. 1.87 1.87
(X X )(Y Y )
rho Covariance(x, y)
sdx .sdy
rho 2.75(1.87)(1.87)
0.775

C82MCP Diploma Statistics
School of PsychologyUniversity of Nottingham
14
Summary of Bivariate Correlations
• There are two regularly used correlation coefficient• Pearson's Product Moment Coefficient
• A parametric correlation coefficient• Spearman's Rho
• A non-parametric correlation coefficient• Correlation coefficient indicate
• The degree of a relationship between two variables• The direction of the relationship between two variables
C82MCP Diploma Statistics
School of PsychologyUniversity of Nottingham
15
Multiple Correlations
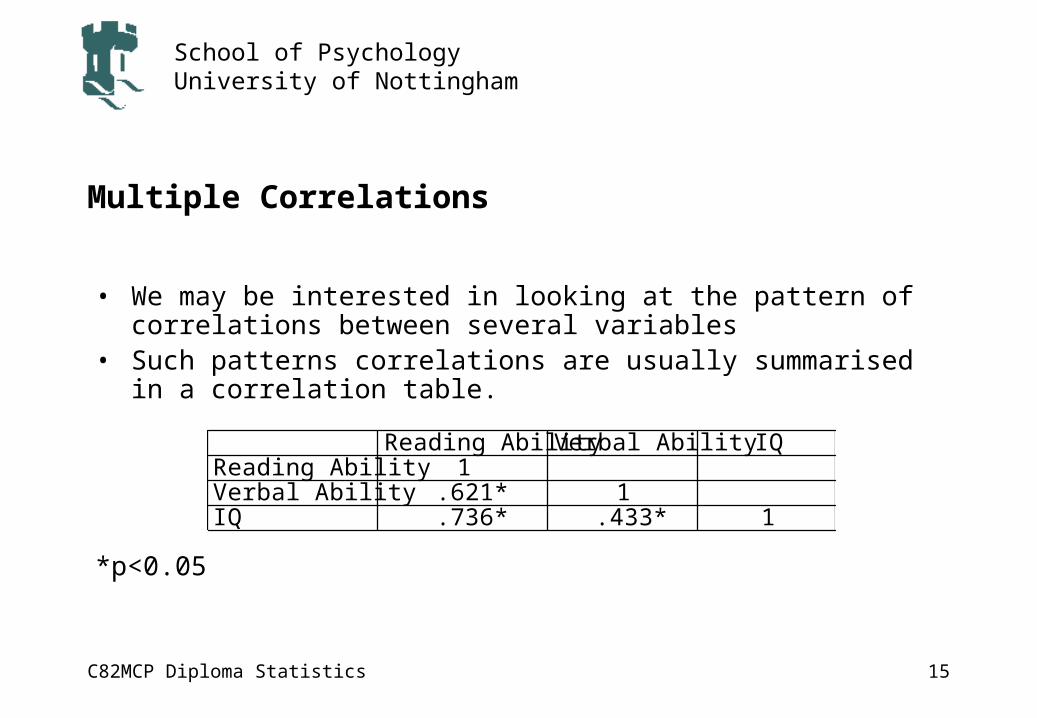
• We may be interested in looking at the pattern of correlations between several variables
• Such patterns correlations are usually summarised in a correlation table.
*p<0.05
Reading Ability Verbal Ability IQReading Ability 1Verbal Ability .621* 1IQ .736* .433* 1

C82MCP Diploma Statistics
School of PsychologyUniversity of Nottingham
16
• There are many different models of the relationships between these variables.
• For example• Reading Ability and Verbal Ability may be caused by IQ
• Reading Ability and Verbal Ability may cause IQ
Correlations and Causal Models
ReadingAbility
VerbalAbility
IQ
ReadingAbility
VerbalAbility
IQ

C82MCP Diploma Statistics
School of PsychologyUniversity of Nottingham
17
Correlations and Causal Models
• It is difficult to know, on the basis of the correlations, which model is the most appropriate.
• We do not know which variables are directly or indirectly causing relationships between the variables
• Even worse some of the correlations may be spurious, i.e. not ‘true’ correlations at all.
C82MCP Diploma Statistics
School of PsychologyUniversity of Nottingham
18
Partial Correlations
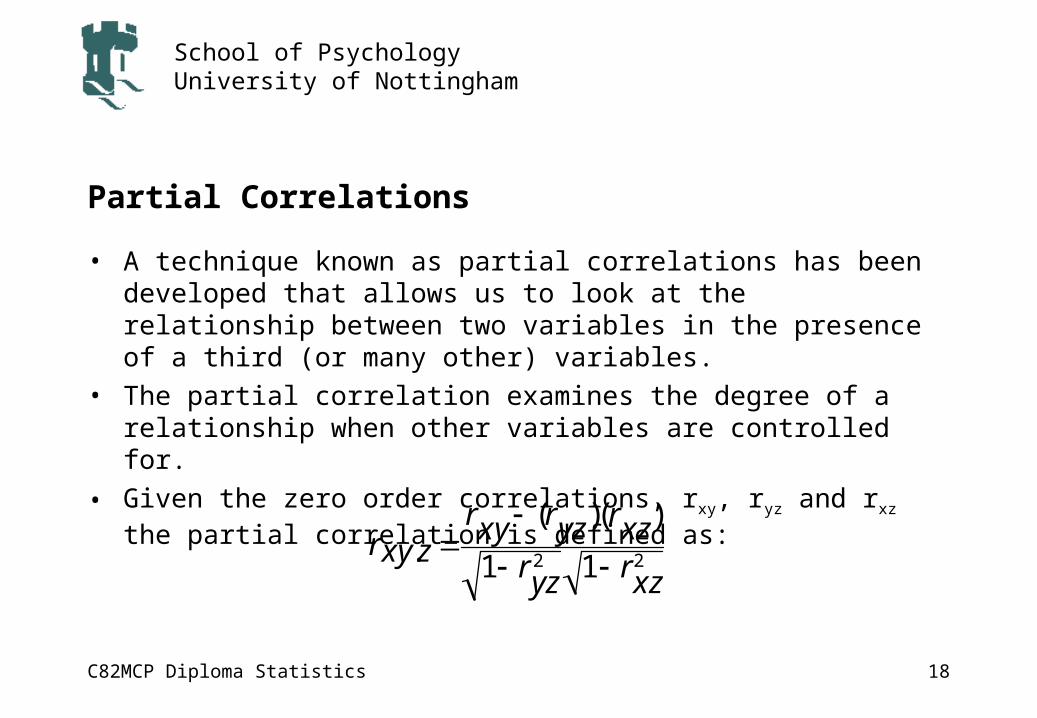
• A technique known as partial correlations has been developed that allows us to look at the relationship between two variables in the presence of a third (or many other) variables.
• The partial correlation examines the degree of a relationship when other variables are controlled for.
• Given the zero order correlations, rxy, ryz and rxz the partial correlation is defined as:
rxy.z rxy (ryz)(rxz)
1 ryz2 1 rxz
2

C82MCP Diploma Statistics
School of PsychologyUniversity of Nottingham
19
Partial Correlations
• Looking at the partial correlation between reading ability and verbal ability controlling for IQ we find:
rRV . IQ rRV (rRIQ)(rVIQ)1 rRIQ
2 1 rVIQ2
rRV . IQ 0.621 (0.736)(0.433)1 0.7362 1 0.4332
rRV . IQ 0.495
C82MCP Diploma Statistics
School of PsychologyUniversity of Nottingham
20
Comparing Zero Order & Partial Correlations
• The zero order correlation between reading ability and verbal ability is 0.621 and the partial correlation when we have taken into account of IQ is equal to 0.495.
• Looking at the relationship between reading ability and IQ, the zero order correlation is 0.736 and the partial correlation when we account for verbal ability is 0.661.
• The zero order correlation for verbal ability and IQ is 0.433. The partial correlation is -0.045.
C82MCP Diploma Statistics
School of PsychologyUniversity of Nottingham
21
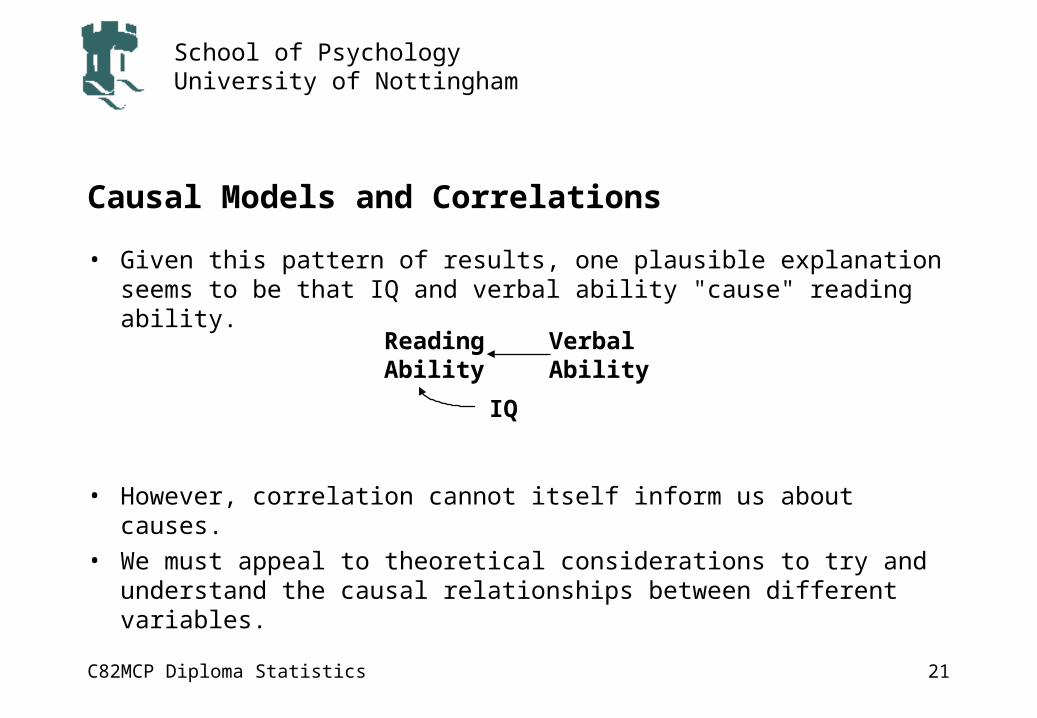
Causal Models and Correlations
• Given this pattern of results, one plausible explanation seems to be that IQ and verbal ability "cause" reading ability.
• However, correlation cannot itself inform us about causes. • We must appeal to theoretical considerations to try and
understand the causal relationships between different variables.
ReadingAbility
VerbalAbility
IQ

C82MCP Diploma Statistics
School of PsychologyUniversity of Nottingham
22
Causal Models and Correlations
• Given the pattern of zero order and partial correlations shown above, there are alternative accounts which are equally plausible.
• There are three other models as far as the statistical methods are concerned
ReadingAbility
VerbalAbility
IQ
ReadingAbility
VerbalAbility
IQ
ReadingAbility
VerbalAbility
IQ