c3 2014 breakout robin smith
TRANSCRIPT

THE ROI OF EARNED MEDIA
Robin Smith
eBusiness Strategy & Programs

2
#C3NY
AGENDA The ROI of Earned Media
• Are You Feeling ROI Pressure
• Establishing Business Successful Practices
• Forecasting and Investment
• Evangelizing Influence of SEO

3
#C3NY
ARE YOU FEELING ROI PRESSURE What’s keeping you up at night?
72% of marketers feel
there is more
pressure to show
return on investment
on marketing spend.
Source: Adobe Digital Distress Survey

4
#C3NY
ARE YOU FEELING ROI PRESSURE What’s keeping you up at night?
82% of marketing decision makers
put ROI as important to proving
business impact.
52% of marketing generalists
expect it to be more important
next year.
Source: Adobe Digital Distress Survey

5
#C3NY
ARE YOU FEELING ROI PRESSURE What’s keeping you up at night?
Where are your gaps
in ROI. Most said...
• Measurement
• Innovative programs
• Customer response
management
Source: Adobe Digital Distress Survey

6
#C3NY
ESTABLISHING SUCCESSFUL BUSINESS PRACTICES Get it in writing
Regardless of your gaps, make sure you are clearly defining what
success is and what the rules are. Who in your company defines ROI?
– Digital Marketing
– Analytics
– Regional Marketing
– Market Development
– Commercial
– Finance

7
#C3NY
ESTABLISHING SUCCESSFUL BUSINESS PRACTICES Get it in writing
Goal: Maximize
performance and drive
incremental ROI
Rules: Measure the impact
SEO has on driving new
customer and increasing
products purchased by
existing customers.
Disclaimer: The data on this slide is just a sample and not Thermo Fisher Scientific data

8
#C3NY
ESTABLISHING SUCCESSFUL BUSINESS PRACTICES Improve technology and processes
The path to ROI is being pro-active VS reactive, solving VS just being
aware & having the foresight to drive organic growth & ROI.
R
OI
Technical and Process Capabilities
Ove
rsig
ht
In
sigh
t
Fo
resi
ght
Oversight Insight Foresight
Effective SEO
Engaged SEO
Ad Hoc SEO

9
#C3NY
FORECASTING AND INVESTMENT Breakdown it down
search volume x ctr = # of clicks x
conversion rate x average order value = $$$

10
#C3NY
FORECASTING AND INVESTMENT Breakdown it down
Disclaimer: The data on this slide is just a sample and not Thermo Fisher Scientific data
#1 - If there is no historical data (starting from zero). Use share to
forecast and then provide investment projections.
11
#C3NY
FORECASTING AND INVESTMENT Breakdown it down
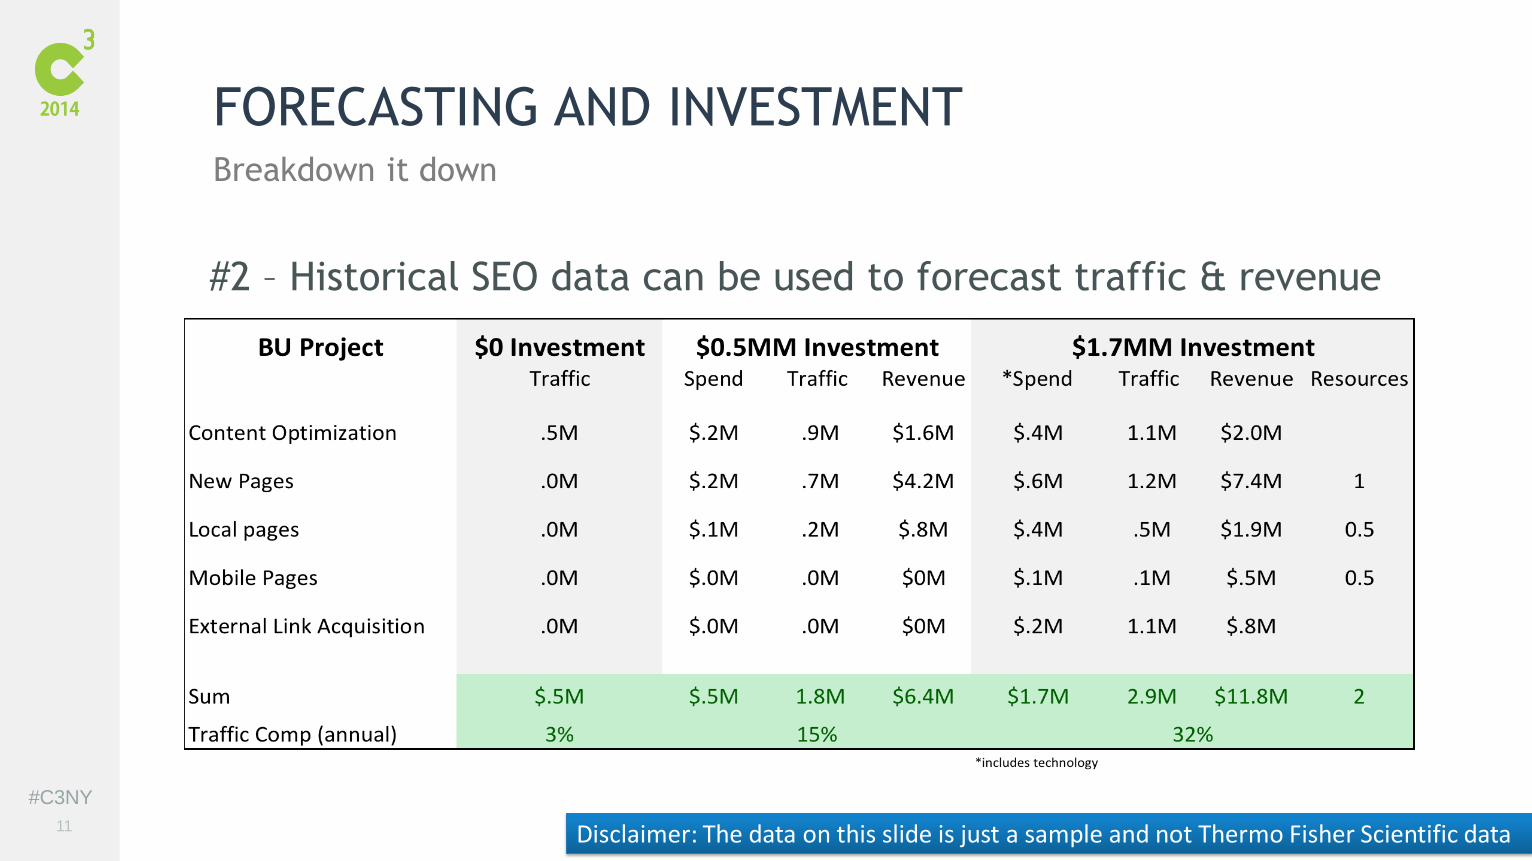
#2 – Historical SEO data can be used to forecast traffic & revenue
Disclaimer: The data on this slide is just a sample and not Thermo Fisher Scientific data

12
#C3NY
FORECASTING AND INVESTMENT Breakdown it down
Once you have the forecast you will want to use it in project plans.
Disclaimer: The data on this slide is just a sample and not Thermo Fisher Scientific data

13
#C3NY
ELEPHANT IN
THE ROOM
3 WAYS TO EVANGELIZE SEO AND GAIN
CONFIDENCE
14
#C3NY
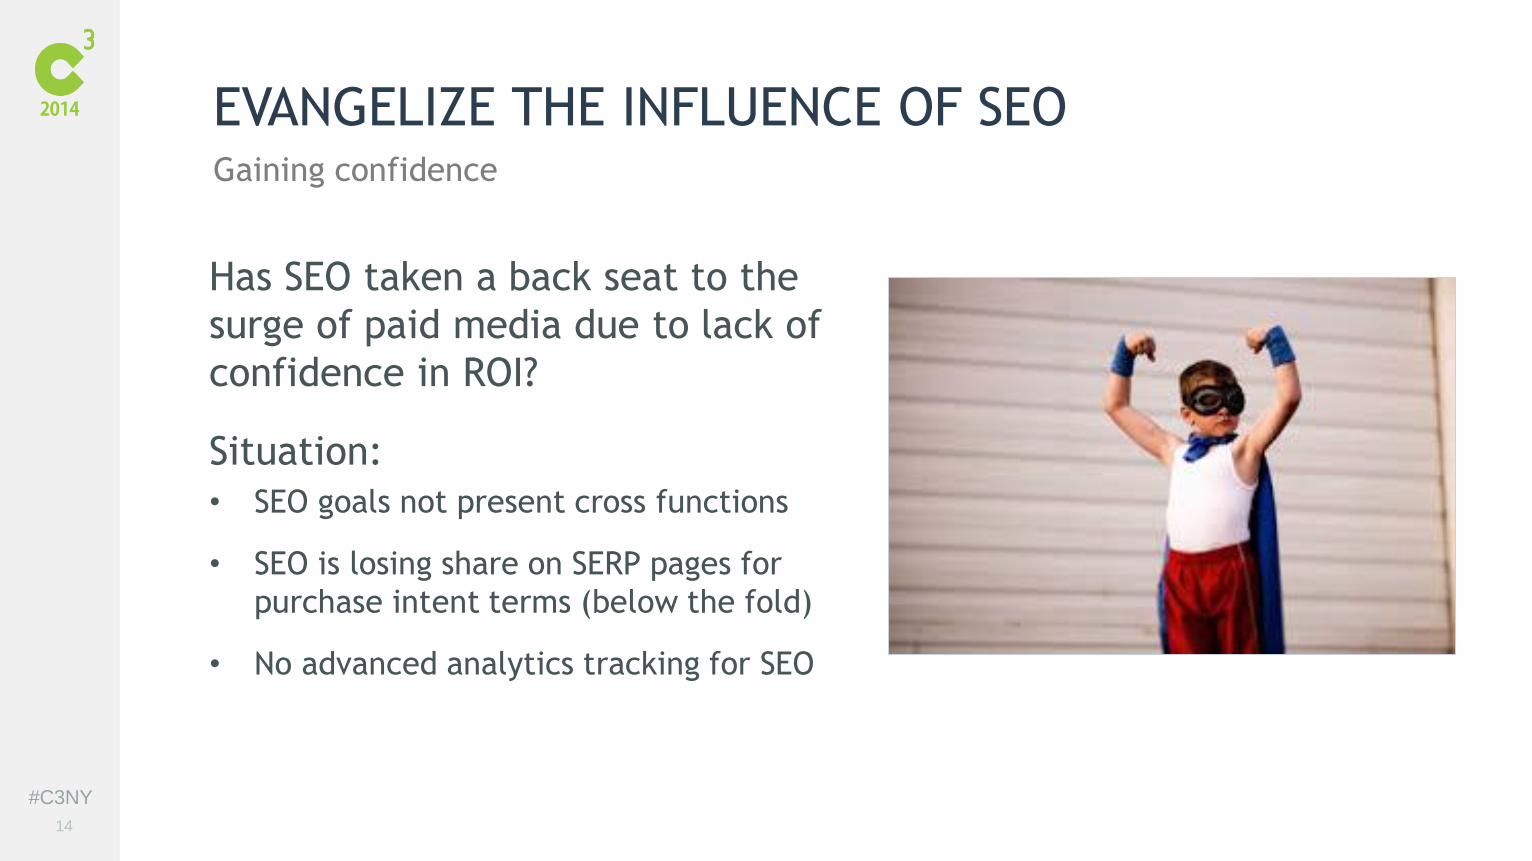
EVANGELIZE THE INFLUENCE OF SEO Gaining confidence
Has SEO taken a back seat to the
surge of paid media due to lack of
confidence in ROI?
Situation:
• SEO goals not present cross functions
• SEO is losing share on SERP pages for
purchase intent terms (below the fold)
• No advanced analytics tracking for SEO

15
#C3NY
EVANGELIZE THE INFLUENCE OF SEO Gaining confidence
#1 Cross collaboration - SEO
needs to be part of the
process, balanced
objectives across
functions set and
measured.

16
#C3NY
EVANGELIZE THE INFLUENCE OF SEO Gaining confidence
#2 Loss of SERP share for
purchase intent terms.
Investment in platform
updates and catalog
optimization is business
critical.
17
#C3NY
EVANGELIZE THE INFLUENCE OF SEO Gaining confidence
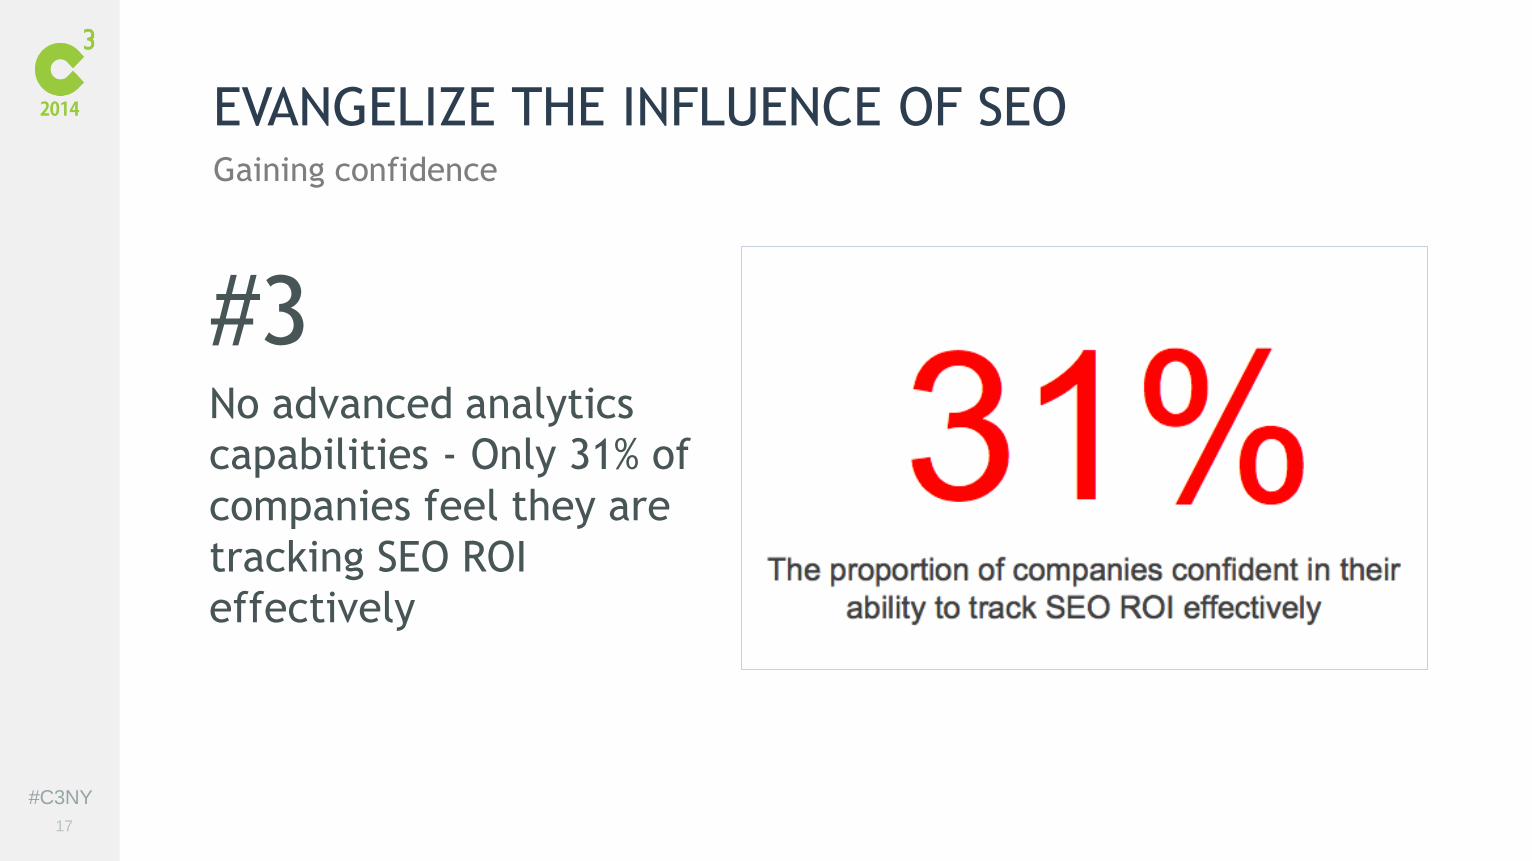
#3 No advanced analytics
capabilities - Only 31% of
companies feel they are
tracking SEO ROI
effectively
18
#C3NY
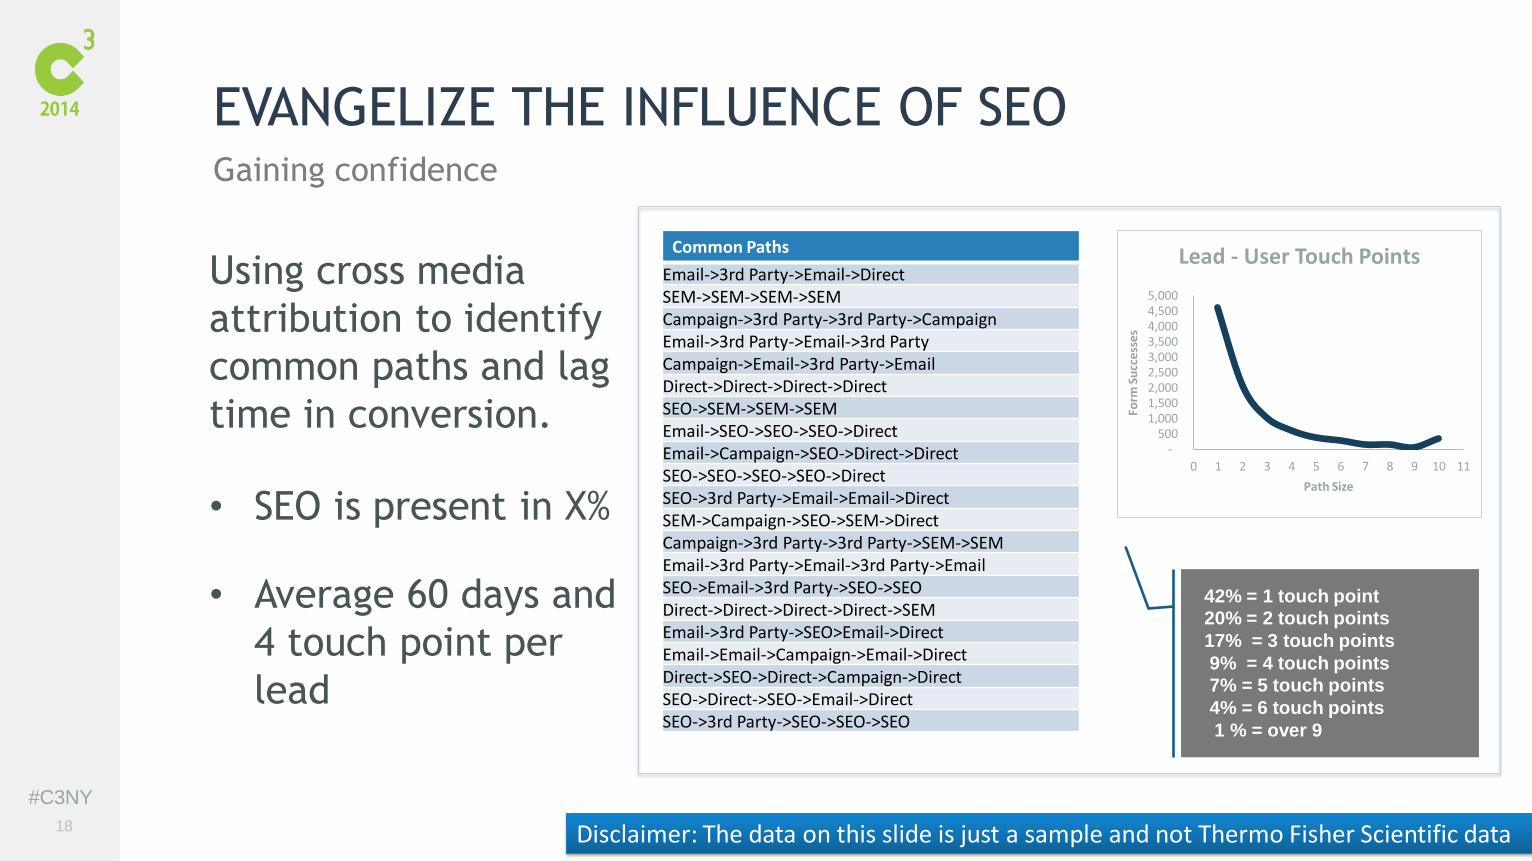
EVANGELIZE THE INFLUENCE OF SEO Gaining confidence
Using cross media
attribution to identify
common paths and lag
time in conversion.
• SEO is present in X%
• Average 60 days and
4 touch point per
lead
Common Paths
Email->3rd Party->Email->Direct SEM->SEM->SEM->SEM Campaign->3rd Party->3rd Party->Campaign Email->3rd Party->Email->3rd Party Campaign->Email->3rd Party->Email Direct->Direct->Direct->Direct SEO->SEM->SEM->SEM Email->SEO->SEO->SEO->Direct Email->Campaign->SEO->Direct->Direct SEO->SEO->SEO->SEO->Direct SEO->3rd Party->Email->Email->Direct SEM->Campaign->SEO->SEM->Direct Campaign->3rd Party->3rd Party->SEM->SEM Email->3rd Party->Email->3rd Party->Email SEO->Email->3rd Party->SEO->SEO Direct->Direct->Direct->Direct->SEM Email->3rd Party->SEO>Email->Direct Email->Email->Campaign->Email->Direct Direct->SEO->Direct->Campaign->Direct SEO->Direct->SEO->Email->Direct SEO->3rd Party->SEO->SEO->SEO
42% = 1 touch point
20% = 2 touch points
17% = 3 touch points
9% = 4 touch points
7% = 5 touch points
4% = 6 touch points
1 % = over 9
- 500
1,000 1,500 2,000 2,500 3,000 3,500 4,000 4,500 5,000
0 1 2 3 4 5 6 7 8 9 10 11
Form
Su
cces
ses
Path Size
Lead - User Touch Points
Disclaimer: The data on this slide is just a sample and not Thermo Fisher Scientific data
ROBBI SMITH Connect with me
www.linkedin.com/in/robbismith