c++ development tools for linux -...
TRANSCRIPT

C++ development tools forLinux
Jesper K. Pedersen<[email protected]>
Copyright © 2004 Jesper K. Pedersen
Table of ContentsTools in general ................................................................................... 1Advanced Development Tools ................................................................ 6
Tools in general
C++ development tools for LinuxIf you are a hobby carpenter, then you might very well get by with a screwdriver only.A screwdriver can be used to drive screws into a wall, you can use it to put nails in thewall, and even to get them out again if you are just a bit of a handy man. If you are aprofessional carpenter, then you do indeed need other and more specific tools than just ascrewdriver.
Likewise a programmer doing assignments in toy programs might get by withsomething as simple as printf statements, while the more serious programmer needsbetter tools.
This article is split in two parts. In first part I will introduce you to some of the commondevelopment tools which you may want to use for software development, these includedevelopment environment, editors, debuggers, version control systems, and systems forspeeding up compilations. In the second part I will focus on some pretty advanced toolsfor finding memory errors, tracing memory usage, plus finding where time is wasted inyour application. All these tools are based on an open source tool called valgrind
Choosing the development environmentAs part of my daytime job I'm giving courses in Qt programming, and have con-sequently seen a lot of people developing software, the environment in which they do
1

so, etc.
Sometimes, I've seen people who would start vi, make some changes, quit it again, andcompile in the shell, sees a syntax error reported from gcc, start vi again, and makesthe changes, and so on. For each error they would spent 10 second to find the right file,find the right line and try an remember what the error was. To say the least this is notvery efficient at all.
Thus when developing software, you have to make sure that your development environ-ment is powerful enough to support your development cycle, both short term (as in com-pile cycle), and long term (as in merging conflicts resulting from several developersworking on the same files).
People often ask me then, which editor they should choose, and even though my favor-ite editor is by far XEmacs, I don't want to get into any religious wars here. Choose theeditor which you know, and become an expert with it - of course if your favorite editoris a simple and limited one, then you may consider changing.
Here are a few suggestions though. If you do not have a favorite editor already, then doconsider KDevelop (see screen shot below), it is very powerful, very intuitive, and isbeing actively developed. If your favorite editor is Vim or one of the Emacs's, just fine,they are powerful enough for software development, just ensure that you get to be anexpert with them
Remember the old story about two men cutting woods. One worked hard all day, whilethe other from time to time took a break. At the end of the day the person taking breakswould have - to the surprise of the other - cut more wood. When asked how that could
2
be, he answered: "Every time I took a break, I sharpened my saw"
I urge you to think of your development environment as your saw, and from time totime spent some time learning about your development environment.
The DebuggerUnfortunately there are not much competitions for debuggers under Linux, which mightalso be the reason for the one and only existing debugger being only semi-good. For mepersonally it crashes up to tens times a day on busy debugging days. There are commer-cial debugger available for Linux, but as they are pretty expensive they are indeed onlyfor professionals.
The debugger under Linux is called GDB, if you prefer you can run it directly from thecommand line. KDevelop has builtin support for GDB, here you simply click on a lineto set a break point, and when execution stops at a break point, the editor will displaythat line for you.
Similar functionality exists for Emacs, with a bit more rough edge of course (settingbreakpoints does not happen by clicking on the line, but rathe by pressing C-x space).Vim has a patch for this (called VimGDB), but otherwise you might choose to use an-other front end for GDB.
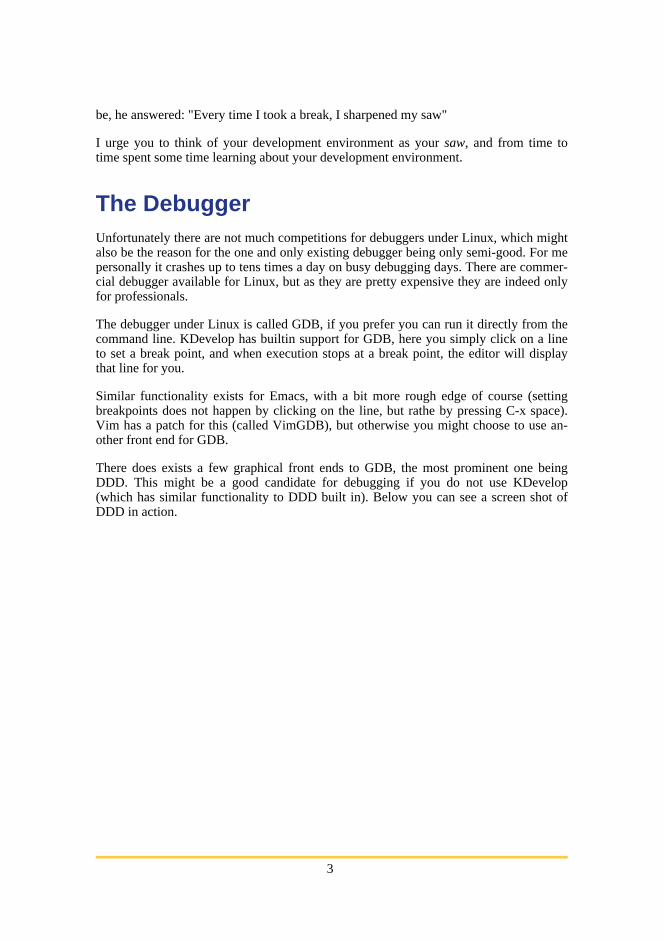
There does exists a few graphical front ends to GDB, the most prominent one beingDDD. This might be a good candidate for debugging if you do not use KDevelop(which has similar functionality to DDD built in). Below you can see a screen shot ofDDD in action.
3

Talking about running gdb from within Emacs or VIM, both also has support to run thecompiler from within the editor. Under Emacs simply press M-x compile, while underVIM press :make. Under Emacs you jump to the next error by pressing C-x ` (i.e. theback ping), while under VIM you press :cnext.
Version Control SystemsWhen many people (that is more than one person) works together on a set of sourcecode, it is of vital importance that the source files are managed by a revision system,which will handle the situation that two persons edits the same file.
Of course, an other important role for a version control system is the capabilities to fig-ure out who changed what and when; being able to tag a number of files for release soyou later can get back to that exact version, etc.
Several version control systems exists under Linux, the most widespread one is calledCVS. It has some annoyances, but is stable like rocks (To my knowledge we never hadmuch trouble with it in KDE).
4

Several free version control systems are actively being developed to replace CVS as thenumber one under Linux, some of these are subversion and arch. A number of com-mercial system also exists, among these are bitkeeper, perforce, SourceSafe, andClearCase.
Speeding up compilationsThe best way to get your applications compiled fast is to buy an ultra fast multi pro-cessor machine with hundreds of processors.
Not an options? Well then the next best and for most mortals most feasible solution is tohave a bunch of computers work together on compiling your application. Three toolsexists for this:
• teambuilder which is a commercial tool from Trolltech (the authors of Qt). Seehttp://www.trolltech.com/.
• distcc - an open source project. See http://distcc.samba.org/.
• icecream - an open source project similar to teambuilder but building on distcc.(Not yet released, but can be downloaded from kde-nonbeta CVS. See ht-tp://developer.kde.org/source/index.html)
Teambuilder and icecream are similar in functionality, with the only difference that te-ambuilder is more stable and commercial, while icecream is open source software. Dist-cc is a bit more stable than icecream, but its scheduling algorithm is round robin, whereicecream and teambuilder tries to allocate the jobs to the best machine.
Having mentioned that icecream is not as stable as the others, its time to point out thatwe are not talking mission critical stuff here, so the scheduler crashing a few times a dayis indeed not a disaster, and by the time you read this, the bugs are likely gone already,and its stable like rocks.
I'll therefore tell you a bit about icecream, as for most purposes this seems to be to bethe best tool.
Icecream is very easy to use, here is how. On one machine you start the scheduler, andon all machines which should participate, you prepend the icecream directory to yourpath, which will ensure that the special versions of gcc, cc etc are in front of the normalones. Next you must start the icecream daemon called iceccd. The compiler must bethe same on all participating machines, but there are no requirements about having thesame set of header files or libraries.
New machines can be put into the network without having to restart anything, and atany point any machine (except the scheduler) can be removed.
When compiling using make, you must add the compile flag -j to ensure that make is-
5

sues more than one gcc compilation at a time. -j takes as an argument a maximum ofsimultaneous compilations, so if you have 5 machines participating, it might be an ideato specify -j 5, to avoid that make prepares say 200 files to compile, just to realize thatthere was an error in the first one.
Icecream comes with a monitor, which can show you which machines is doing what. Ascreen dump of the monitor can be seen below.
Advanced Development ToolsJuli 30th 2002 a tool called valgrind was released in version 1.0.0. If you should build atop 5 of date that changed history for software development under Linux, this would in-deed include this date!
Until valgrind came into existence, open source software developers could just dream ofhaving licenses to commercial tools like purify, Insure++, and BoundsChecker. Atthat time our best bet would probably be tools like electric fence which indeed wasmuch harder to work with plus less powerful.
Valgrind is a modular toolkit from which two major tools has been developed plus anumber of minor tools. In this part we will have a look at memcheck which is used tofind memory errors, calltree which is used to profile applications, and massif whichcan be used to figure out which part of your application uses how much memorythrough the life time of the application.
Valgrind is an open source software which indeed is not a toy. It has been executed onany major C and C++ application you can think of in the Linux world, including KDE,Gnome, OpenOffice etc. The only catch there is to valgrind is that when you run an ap-plication under the control of valgrind then the application will execute in the order ofmagnitude 5-100 times slower.
The mem-check toolAs mentioned above, valgrind is a modular toolkit from which a number of tools arebuild. The fundamentals of valgrind is an X86 simulator, which simulates a real pro-cessor, and meanwhile measures certain things on your program.
The first tool we will look at is mem-check, a tool for tracing memory errors. Lets start
6

with a small example from a very simple C program:
1 #include <stdio.h>#include <stdlib.h>#include <string.h>
5 int main( int /*argc*/, char** /*argv*/ ) {char* str = "Hello World\n";char* copy = (char*) malloc( sizeof(char) * strlen( str ) );
strcpy( copy, str );10 }
Take some time to look at the application above, if you can't spot the error within a mil-lisecond, and if you think you could ever have made that error (and you could), thenmem-check is indeed a tool for you.
The problem with the code above is that we allocate one byte too little for the copy ofthe string, namely the byte for the null terminating character. Nevertheless the strcpyfunction will copy over the null terminating character, and the result is that it writesbeyond the boundary of the array allocated.
It is exactly this kind of problem that the mem-check tool for valgrind is created to de-tect (among a number of others of course). So lets try and see what valgrind says wheninvoked on the program above. To start valgrind with the mem-check tool, write a com-mand similar to: valgrind --tool=memcheck <application-name> Below you cansee the output from valgrind (Notice versions of valgrind older than 2.1.0 uses --skinrather than --tool)
1 ==19989== Memcheck, a memory error detector for x86-linux.==19989== Copyright (C) 2002-2004, and GNU GPL'd, by Julian Seward.==19989== Using valgrind-2.1.1, a program supervision framework for x86-linux.==19989== Copyright (C) 2000-2004, and GNU GPL'd, by Julian Seward.
5 ==19989== For more details, rerun with: -v==19989====19989== Invalid write of size 1==19989== at 0x3C020CAA: strcpy (mac_replace_strmem.c:199)==19989== by 0x804855A: main (main.cpp:9)
10 ==19989== Address 0x3CE29060 is 0 bytes after a block of size 12 alloc'd==19989== at 0x3C021350: malloc (vg_replace_malloc.c:105)==19989== by 0x8048546: main (main.cpp:7)==19989====19989== ERROR SUMMARY: 1 errors from 1 contexts (suppressed: 49 from 1)
15 ==19989== malloc/free: in use at exit: 360 bytes in 11 blocks.==19989== malloc/free: 404 allocs, 393 frees, 9422 bytes allocated.==19989== For a detailed leak analysis, rerun with: --leak-check=yes==19989== For counts of detected errors, rerun with: -v
Each line is prefixed with the process id of the processes printing out messages - this isuseful as valgrind is capable of tracing subprocesses too (using the --trace-children=yes option).
Line 7 is where all the fun starts. Valgrind tells us that there has been an invalid write ofone byte. The following lines are a back trace which shows up where this error oc-curred. But that's not all, on line 10 it tells us that the invalid write is zero bytes after an-other block, and then follows the backtrace telling us where that other block was alloc-
7

ated. Now it is a piece of cake finding and solving the problem.
What can mem-check check?
The following list is from the documentation of mem-check telling what it is capable ofchecking: (for details see the valgrind documentation.)
• Use of uninitialised memory
• Reading/writing memory after it has been free'd
• Reading/writing off the end of malloc'd blocks
• Reading/writing inappropriate areas on the stack
• Memory leaks -- where pointers to malloc'd blocks are lost forever
• Passing of uninitialised and/or unaddressible memory to system calls
• Mismatched use of malloc/new/new [] vs free/delete/delete []
• Overlapping src and dst pointers in memcpy() and related functions
• Some misuses of the POSIX pthreads API
Suppressing errors
Valgrind does not only run your part of the application in its virtual machine, it runs thecomplete application, which for a KDE application for example includes KDE libraries,the Qt library, X11 libraries, the C library etc. Even though you may feel that yourwhole Linux box is pretty stable, a number of more or less harmful errors exists in theaforementioned libraries, which likely is out of your control to fix anyway.
Valgrind therefore has the capability of ignoring certain errors using ignore filters. Bydefault a number of ignore filters are already in action when you start the mem-checktool, but you may also create your own filters, in the not-so-unlikely event that you areusing a third party library which contains errors valgrind doesn't know about, or even inthe situation that the project on which you work are so large that you can not makeevery single part of it valgrind clean.
Suppression rules are not to be written by mere mortals, so fortunately valgrind is cap-able of creating them for you, simply start valgrind using the flag --gen-suppressions=yes. It will then ask you if it should build a rule for you eachtime it sees an error. Cut'n'paste the rules you want into a file, and next time you startvalgrind use --suppressions=<filename>
8

Starting GDB from valgrind
When mem-check encounters an error it is capable of starting gdb for you so you can in-trospect your application in the exact situation where the error is meet. To make thatpossible simply start valgrind using the flag --gdb-attach=yes
Once mem-check encounters an error it will ask you if it should start gdb. Once you aredone looking at the error in gdb, you must quit gdb with the following command: de-tach followed by quit. This will ensure that execution continues in the virtual pro-cessor. In other words do not invoke continue from within gdb.
Using mem-check for detecting memory leaks
The final feature of mem-check I'd like to highlight here is its capability to detectmemory leaks in your application. Simply start valgrind using the option --leak-check=yes, and it will print a report on exit of application.
If you want to get your application 100% leak-free, a good idea is to ensure that allmemory allocated is deleted, including that allocated in main(). Doing so, you may addthe flag --show-reachable=yes, which will make mem-check report on memory towhich there still is a valid pointer upon program termination.
addrcheck
While developing valgrind, the author set out to give valgrind a good exercise, he wouldrun all of his KDE environment under valgrind. After having waited for a long time, herealized that valgrind was simply too slow for running a complete desktop environmentfor several days. What he did was therefore to cut some features of from valgrind tomake it faster. The result is the tool addrcheck which is about twice as fast as valgrind,but does not check for use of uninitialized variables.
The calltree toolAbove we discussed the valgrind tool called memcheck and addrcheck, in the followingwe will look at another tool called calltree. Calltree was initially developed as a tool toannalize cache misses (cache as the fast memory computers have). It was, however,soon discovered that the data that calltree collected was also useful for a much broaderaudience. calltree output is namely useful for analysis of where time is spent in an ap-plication - which is also known as profiling.
calltree's output is viewed using an application called KCacheGrind. The procedure forprofiling is to start the valgrind using a command similar to valgrind --tool=calltree <application> This will generate one or more files namedcachegrind.out.<process-id>. Next you will start KCacheGrind giving it one ofthese file as argument.
9

calltree and kcahegrind are not shipped with valgrind, but must instead be downloadedand installed separately. You download calltree and KCacheGrind from ht-tp://kcachegrind.sourceforge.net/.
Controlling when dumps are made
There are two golden rules when it comes to profiling: First, a human has very seldom aclue at all where in the code time are spent (That's why you want to use tools like call-tree). Second you should never optimize code unless the application feels slow. Thuswhen you want to profile your application, you should first figure out where it feelsslow, and spent your energy on optimizing that part. Optimizations always leads to codethat is harder to read and maintain so over-optimizing is not a good idea.
The application ct_control is used to control a running calltree tool. It basically hastwo options -z and -d. -z tells calltree to zero all its collections while -d tells it todump its current information to file.
So in the situation where you are profiling a graphical user interface, and know thatwhen you select, say a certain menu item from the menu bar, then an action is per-formed, which takes to long, here are the steps to take: Start your application under call-trees control, do whatever you need to do to get to the situation where something is toslow. In a shell execute ct_control -z, this will make calltree behave as if it was juststarted at this point. Now select the action which feels too slow, and when it is done runct_control -d, this will make calltree dump whatever information it has collectedsince the start of the action. Now you may finish the program or even kill it if you want.
In the situation where you by other means have reached the conclusion that a givenfunction is too slow, and want to optimize that, you may control when calltree zeros anddumps information using command line options.
A word of caution when talking about profiling. Make sure to profile your application ina realistic context. Thus if you are profiling an email application which you believe istaking too much time to show an overview of the emails in a given folder, make surethat you profile with a folder with hundreds of emails (which is likely your normal situ-ation) rather than with a folder with say five emails.
When profiling using unrealistic data sizes, the risk is that you will be fooled to believethat a wrong part of the application is what takes time - Imagine that an email could bein one of five states where an icon was used to indicate the state. Now imagine that eachicon takes 100 msec to load from disk, while each email takes 50 msec to load. Profilingwith 5 emails will shows that 500 msec is used in loading icons while 250 msec wasused for loading email. This would indicate that you should spent time optimizing load-ing of icons. However had you profiled with 500 emails, still only 500 msec would havebeen spent on loading icons (there are only 5 different icons to load), while 25 secondswas used on loading the emails.
KCacheGrind
10

KCacheGrind is indeed an impressive application which make otherwise difficult dataeasy accessible. Try looking at how much data calltree dumps per second of programexecution, and imagine you more or less should look at it using a normal editor (whichto some extend is the case with tools like gprof - the open source market leader for pro-filing tools till calltree/KCacheGrind kicked it completely out of the market).
Below you may see a screen dump of KCacheGrind in action, and in the rest of this sec-tion an overview of the part of the KCacheGrind GUI will be given.
The KCacheGrind view is divided in two parts. On the left side you see the functions ofthe application - or rather top 100 with respect to resources used. On the right side yousee one or two views each showing a number of tabs. The tabs can be moved aroundbetween the views, or even be hidden completely, if the tab do not show information ofinterest to you.
The following list described the content of each tab. Some of the information in the tabsare unfortunately unknown to the author and has therefore been skipped.
• Calls - Shows which function the current function calls.
• Callers - Shows which functions calls the current function. (If you think this is thesame as Calls, then please read the text for the two again)
• All Calls - Shows which function the current function calls, plus which functionsthey call and so on.
11

• All Callers - Shows which functions calls the current one, plus which calls them andso on.
• Call Map - Shows the function which are called by the current function as a pyramidlandscape, where the area of a pyramid is proportional to the amount of time spent.See snapshot below.
• Caller Map - Similar to Call Map but for function calling the current one, ratherthan being called by the current one.
• source - Shows the source of the current function intermixed with the time figures.
• Call Graph - This is the most important tab of them all - it shows the call graphgraphically as can be seen in the screen shut above.
The massif toolThe last tool from the valgrind suite we will have a look at is Massif. Massif is at thesame time very simple and very useful. Massif will generate a graph showing at whichtime in your application how much memory has been allocated, and from which part ofthe application the memory was allocated. Simply run your application like valgrind--tool=massif. The snapshot below shows you what a massif graph looks like.
12

13