c a 2019 rental rate survey fortunes - vertikal.net
TRANSCRIPT
23December/January 2020 cranes & access
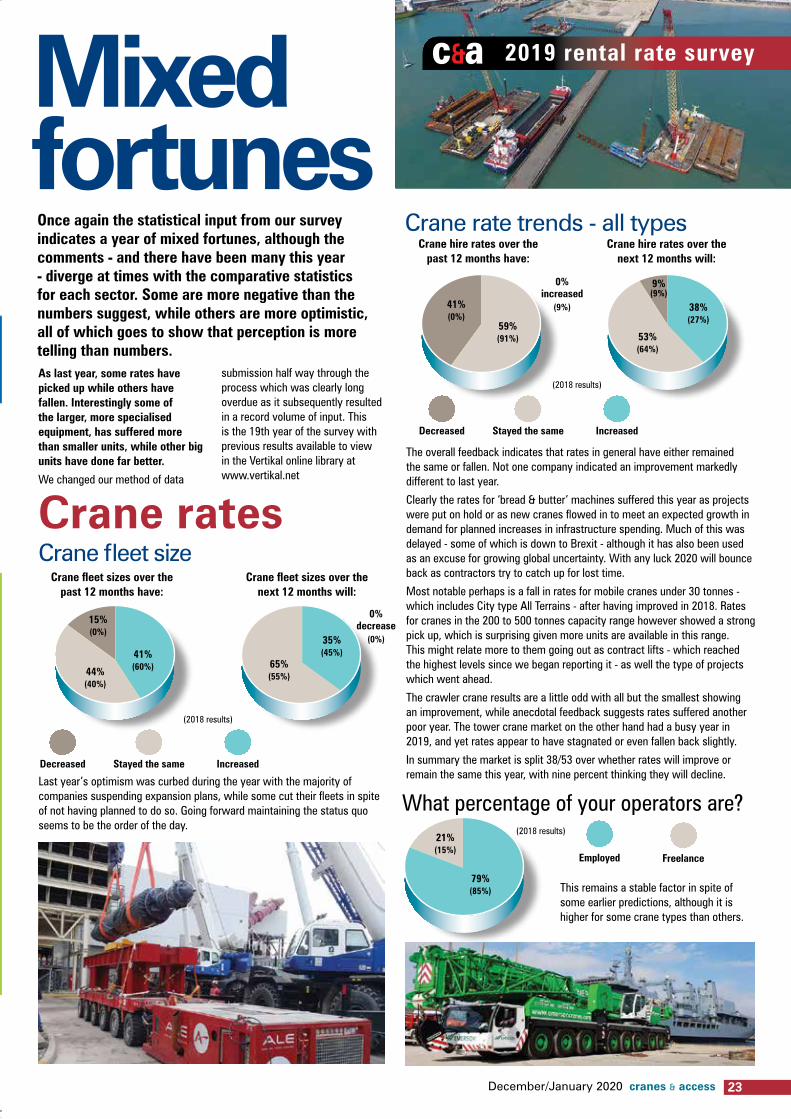
2019 rental rate surveyc&a
Crane fleet size
Last year’s optimism was curbed during the year with the majority of companies suspending expansion plans, while some cut their fleets in spite of not having planned to do so. Going forward maintaining the status quo seems to be the order of the day.
crane fleet sizes over the past 12 months have:
(2018 results)
0% decrease
(0%)
crane fleet sizes over the next 12 months will:
41% (60%)
35% (45%)
44% (40%)
15% (0%)
65% (55%)
once again the statistical input from our survey indicates a year of mixed fortunes, although the comments - and there have been many this year - diverge at times with the comparative statistics for each sector. Some are more negative than the numbers suggest, while others are more optimistic, all of which goes to show that perception is more telling than numbers.
Crane rates
Crane rate trends - all types
The overall feedback indicates that rates in general have either remained the same or fallen. Not one company indicated an improvement markedly different to last year.
Clearly the rates for ‘bread & butter’ machines suffered this year as projects were put on hold or as new cranes flowed in to meet an expected growth in demand for planned increases in infrastructure spending. Much of this was delayed - some of which is down to Brexit - although it has also been used as an excuse for growing global uncertainty. With any luck 2020 will bounce back as contractors try to catch up for lost time.
Most notable perhaps is a fall in rates for mobile cranes under 30 tonnes - which includes City type All Terrains - after having improved in 2018. Rates for cranes in the 200 to 500 tonnes capacity range however showed a strong pick up, which is surprising given more units are available in this range. This might relate more to them going out as contract lifts - which reached the highest levels since we began reporting it - as well the type of projects which went ahead.
The crawler crane results are a little odd with all but the smallest showing an improvement, while anecdotal feedback suggests rates suffered another poor year. The tower crane market on the other hand had a busy year in 2019, and yet rates appear to have stagnated or even fallen back slightly.
In summary the market is split 38/53 over whether rates will improve or remain the same this year, with nine percent thinking they will decline.
crane hire rates over the past 12 months have:
0% increased
(9%)
(2018 results)
crane hire rates over the next 12 months will:
increasedStayed the sameDecreased
increasedStayed the sameDecreased
59% (91%)
41% (0%)
53% (64%)
38% (27%)
9% (9%)
Mixed fortunes
As last year, some rates have picked up while others have fallen. interestingly some of the larger, more specialised equipment, has suffered more than smaller units, while other big units have done far better.
We changed our method of data
submission half way through the process which was clearly long overdue as it subsequently resulted in a record volume of input. This is the 19th year of the survey with previous results available to view in the Vertikal online library at www.vertikal.net
What percentage of your operators are?
This remains a stable factor in spite of some earlier predictions, although it is higher for some crane types than others.
(2018 results)
employed freelance
79% (85%)
21% (15%)
24 cranes & access December/January 2020
2019 rental rate survey c&aWhat percentage of your jobs are contract lifts?
crane size Average (£) Lowest Highest ideal
Pick & Carry <2.5t 565 350 700 695
Pick & Carry 3-5t 633 535 785 812
Pick & Carry 5.5-10t 695 652 785 825
Pick & Carry >10t 947 820 1,200 1,200
Mini crawlers - up to 12t 800 550 1,000 925
Spider cranes up to 1t 721 400 800 845
Spider cranes 2-5t 1,156 700 1,500 1,550
Spider cranes >5t 1,500 900 2,100 1,652
Weekly rates of other cranes
Weekly rates for tower cranesflat tops and saddle jibs Average (£) Lowest Highest ideal
Less than 70t/m 710 500 900 875
120t/m 895 650 1,200 1,056
200t/m 1,300 1,200 1,400 1,463
300t/m 2,040 1,800 2,200 2,425
Luffers Average (£) Lowest Highest ideal
Less than 70t/m 1,183 750 1,600 1,175
100t/m 1,733 1,300 2,100 1,725
180t/m 2,375 2,350 2,800 2,583
300t/m 3,033 2,400 3,500 3,367
Self erectors Average (£) Lowest Highest ideal
Self Erectors 658 590 800 713
Would you recommend the crane hire industry to your children?
contract lifts Pure crane hire
27% (18%)
73% (82%)
(2018 results)
Most telling of all - around 74 percent of respondents once again said that they would recommend the industry to their children. No matter how unsustainable rates might be, those in the industry would not do anything else.
As already mentioned a positive shift - bouncing back to reach record levels.
crane size Average (£) Lowest Highest ideal
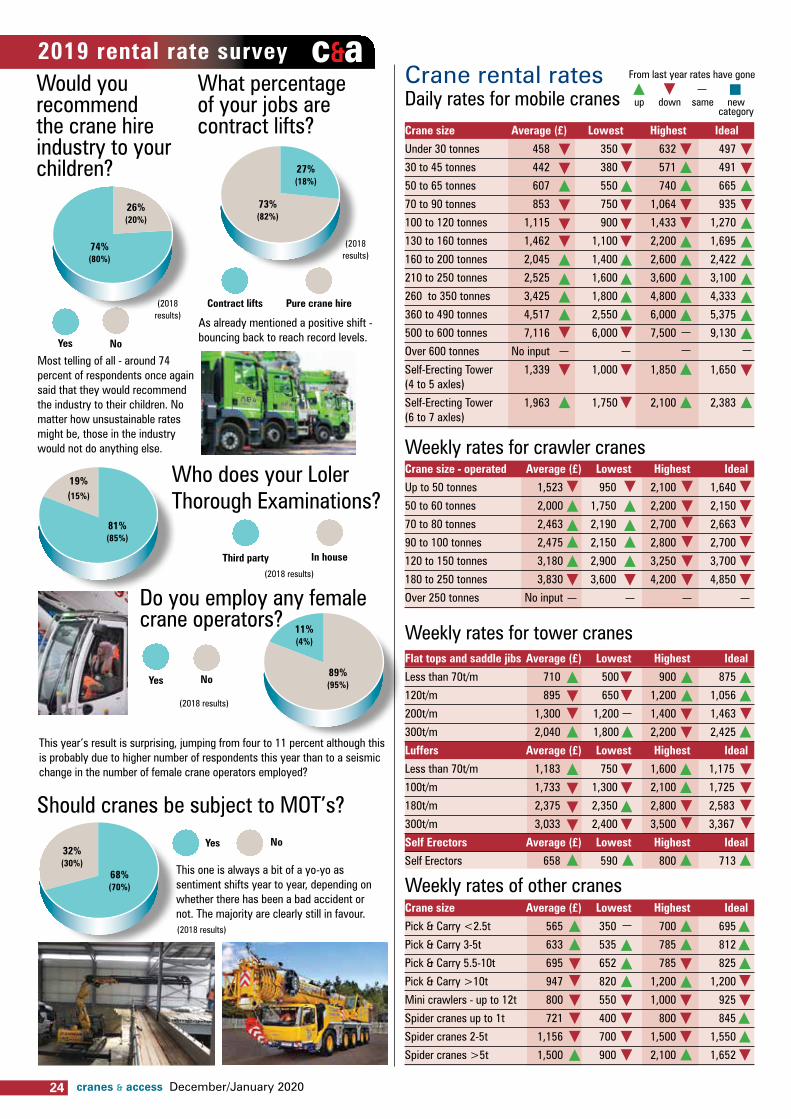
Under 30 tonnes 458 350 632 497
30 to 45 tonnes 442 380 571 491
50 to 65 tonnes 607 550 740 665
70 to 90 tonnes 853 750 1,064 935
100 to 120 tonnes 1,115 900 1,433 1,270
130 to 160 tonnes 1,462 1,100 2,200 1,695
160 to 200 tonnes 2,045 1,400 2,600 2,422
210 to 250 tonnes 2,525 1,600 3,600 3,100
260 to 350 tonnes 3,425 1,800 4,800 4,333
360 to 490 tonnes 4,517 2,550 6,000 5,375
500 to 600 tonnes 7,116 6,000 7,500 9,130
Over 600 tonnes No input
Self-Erecting Tower 1,339 1,000 1,850 1,650 (4 to 5 axles)
Self-Erecting Tower 1,963 1,750 2,100 2,383 (6 to 7 axles)
up down same new category
Crane rental ratesDaily rates for mobile cranes
From last year rates have gone
crane size - operated Average (£) Lowest Highest ideal
Up to 50 tonnes 1,523 950 2,100 1,640
50 to 60 tonnes 2,000 1,750 2,200 2,150
70 to 80 tonnes 2,463 2,190 2,700 2,663
90 to 100 tonnes 2,475 2,150 2,800 2,700
120 to 150 tonnes 3,180 2,900 3,250 3,700
180 to 250 tonnes 3,830 3,600 4,200 4,850
Over 250 tonnes No input
Weekly rates for crawler cranes
Should cranes be subject to MOT’s?
This one is always a bit of a yo-yo as sentiment shifts year to year, depending on whether there has been a bad accident or not. The majority are clearly still in favour.
This year’s result is surprising, jumping from four to 11 percent although this is probably due to higher number of respondents this year than to a seismic change in the number of female crane operators employed?
(2018 results)
Yes no
68% (70%)
32% (30%)
Do you employ any female crane operators?
(2018 results)
Yes no
11% (4%)
89% (95%)
Who does your Loler Thorough Examinations?
(2018 results)
Third party in house
19% (15%)
81% (85%)
(2018 results)
Yes no
74% (80%)
26% (20%)
26 cranes & access December/January 2020
27December/January 2020 cranes & access
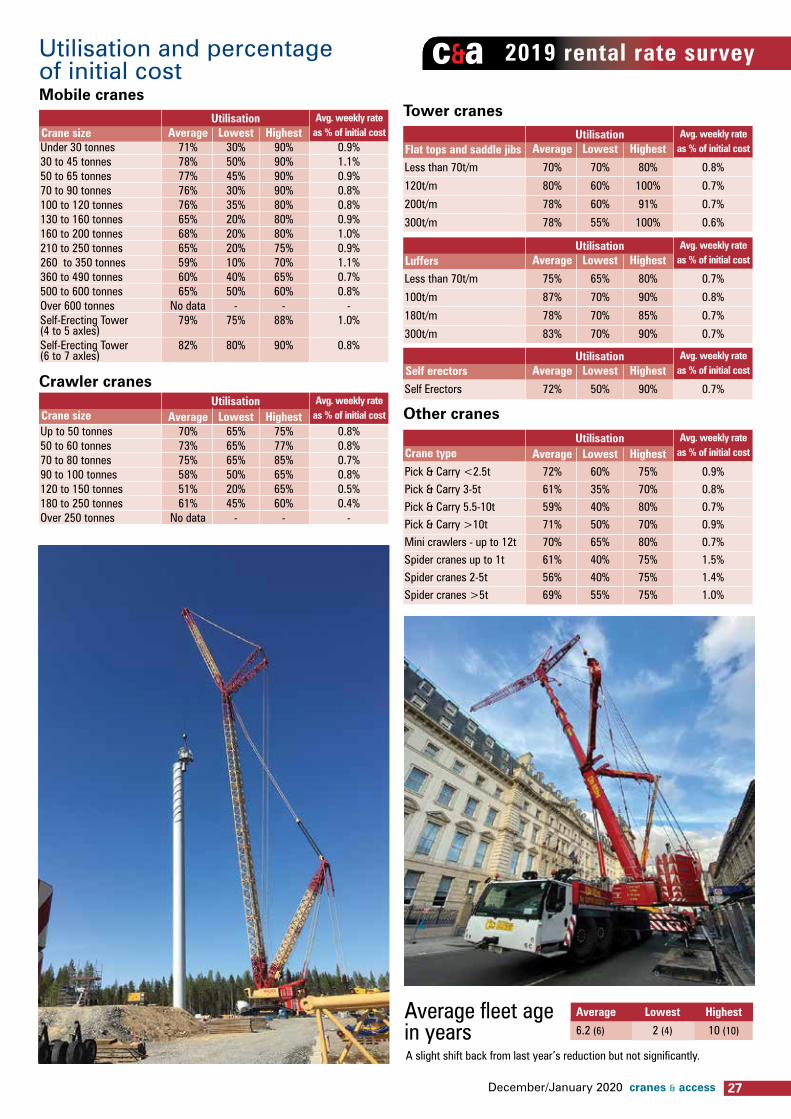
2019 rental rate surveyc&aUtilisation and percentage of initial costMobile cranes
utilisation Avg. weekly rate as % of initial cost Average Lowest Highest
Under 30 tonnes 71% 30% 90% 0.9% 30 to 45 tonnes 78% 50% 90% 1.1% 50 to 65 tonnes 77% 45% 90% 0.9% 70 to 90 tonnes 76% 30% 90% 0.8% 100 to 120 tonnes 76% 35% 80% 0.8% 130 to 160 tonnes 65% 20% 80% 0.9% 160 to 200 tonnes 68% 20% 80% 1.0% 210 to 250 tonnes 65% 20% 75% 0.9% 260 to 350 tonnes 59% 10% 70% 1.1% 360 to 490 tonnes 60% 40% 65% 0.7% 500 to 600 tonnes 65% 50% 60% 0.8% Over 600 tonnes No data - - -Self-Erecting Tower 79% 75% 88% 1.0% (4 to 5 axles) Self-Erecting Tower 82% 80% 90% 0.8% (6 to 7 axles)
crane size
Crawler cranesutilisation Avg. weekly rate
as % of initial cost Average Lowest Highest Up to 50 tonnes 70% 65% 75% 0.8% 50 to 60 tonnes 73% 65% 77% 0.8% 70 to 80 tonnes 75% 65% 85% 0.7% 90 to 100 tonnes 58% 50% 65% 0.8% 120 to 150 tonnes 51% 20% 65% 0.5% 180 to 250 tonnes 61% 45% 60% 0.4% Over 250 tonnes No data - - -
crane size Other cranes
utilisation Avg. weekly rate as % of initial cost Average Lowest Highest
Self Erectors 72% 50% 90% 0.7%
Tower cranesutilisation Avg. weekly rate
as % of initial cost Average Lowest Highest
Less than 70t/m 70% 70% 80% 0.8%
120t/m 80% 60% 100% 0.7%
200t/m 78% 60% 91% 0.7%
300t/m 78% 55% 100% 0.6%
flat tops and saddle jibs
utilisation Avg. weekly rate as % of initial cost Average Lowest Highest
Less than 70t/m 75% 65% 80% 0.7%
100t/m 87% 70% 90% 0.8%
180t/m 78% 70% 85% 0.7%
300t/m 83% 70% 90% 0.7%
Luffers
utilisation Avg. weekly rate as % of initial cost Average Lowest Highest
Pick & Carry <2.5t 72% 60% 75% 0.9% Pick & Carry 3-5t 61% 35% 70% 0.8% Pick & Carry 5.5-10t 59% 40% 80% 0.7% Pick & Carry >10t 71% 50% 70% 0.9% Mini crawlers - up to 12t 70% 65% 80% 0.7%Spider cranes up to 1t 61% 40% 75% 1.5% Spider cranes 2-5t 56% 40% 75% 1.4% Spider cranes >5t 69% 55% 75% 1.0%
crane type
Self erectors
Average fleet age in yearsA slight shift back from last year’s reduction but not significantly.
Average Lowest Highest
6.2 (6) 2 (4) 10 (10)
28 cranes & access December/January 2020
29December/January 2020 cranes & access
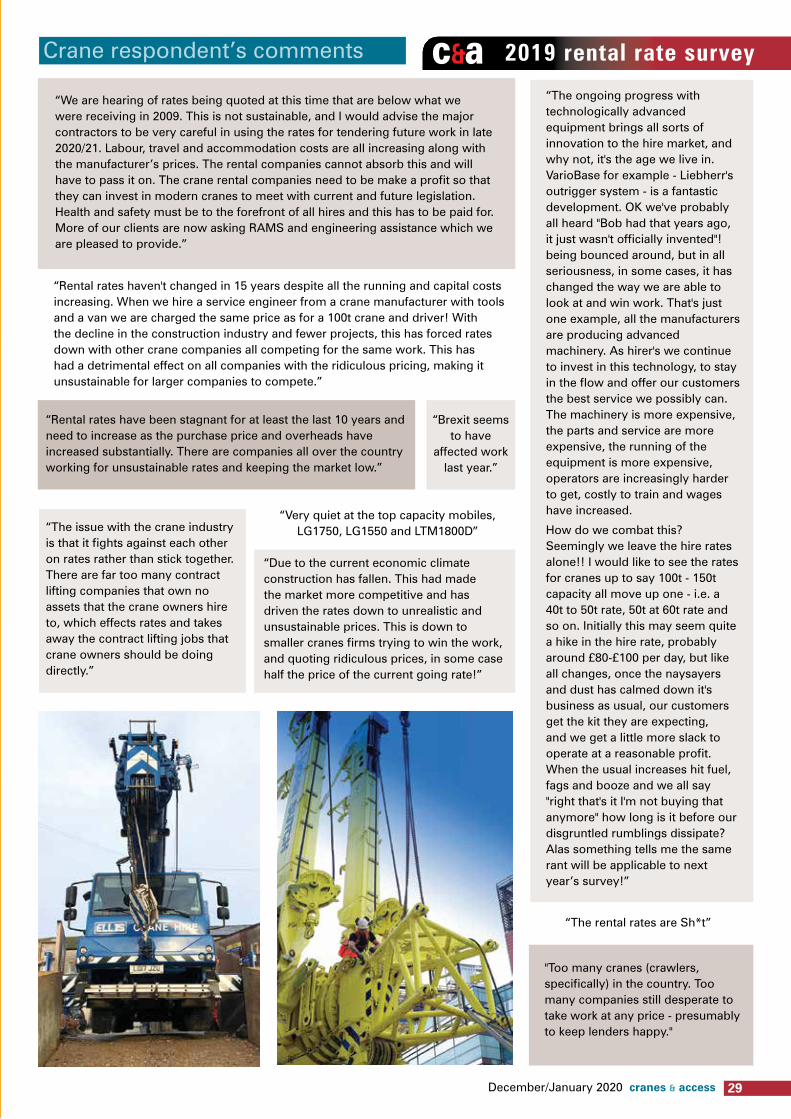
Crane respondent’s comments
“We are hearing of rates being quoted at this time that are below what we were receiving in 2009. This is not sustainable, and I would advise the major contractors to be very careful in using the rates for tendering future work in late 2020/21. Labour, travel and accommodation costs are all increasing along with the manufacturer’s prices. The rental companies cannot absorb this and will have to pass it on. The crane rental companies need to be make a profit so that they can invest in modern cranes to meet with current and future legislation. Health and safety must be to the forefront of all hires and this has to be paid for. More of our clients are now asking RAMS and engineering assistance which we are pleased to provide.”
“Rental rates haven't changed in 15 years despite all the running and capital costs increasing. When we hire a service engineer from a crane manufacturer with tools and a van we are charged the same price as for a 100t crane and driver! With the decline in the construction industry and fewer projects, this has forced rates down with other crane companies all competing for the same work. This has had a detrimental effect on all companies with the ridiculous pricing, making it unsustainable for larger companies to compete.”
“The ongoing progress with technologically advanced equipment brings all sorts of innovation to the hire market, and why not, it's the age we live in. VarioBase for example - Liebherr's outrigger system - is a fantastic development. OK we've probably all heard "Bob had that years ago, it just wasn't officially invented"! being bounced around, but in all seriousness, in some cases, it has changed the way we are able to look at and win work. That's just one example, all the manufacturers are producing advanced machinery. As hirer's we continue to invest in this technology, to stay in the flow and offer our customers the best service we possibly can. The machinery is more expensive, the parts and service are more expensive, the running of the equipment is more expensive, operators are increasingly harder to get, costly to train and wages have increased.
How do we combat this? Seemingly we leave the hire rates alone!! I would like to see the rates for cranes up to say 100t - 150t capacity all move up one - i.e. a 40t to 50t rate, 50t at 60t rate and so on. Initially this may seem quite a hike in the hire rate, probably around £80-£100 per day, but like all changes, once the naysayers and dust has calmed down it's business as usual, our customers get the kit they are expecting, and we get a little more slack to operate at a reasonable profit. When the usual increases hit fuel, fags and booze and we all say "right that's it I'm not buying that anymore" how long is it before our disgruntled rumblings dissipate? Alas something tells me the same rant will be applicable to next year’s survey!”
“The issue with the crane industry is that it fights against each other on rates rather than stick together. There are far too many contract lifting companies that own no assets that the crane owners hire to, which effects rates and takes away the contract lifting jobs that crane owners should be doing directly.”
“Very quiet at the top capacity mobiles, LG1750, LG1550 and LTM1800D”
"Too many cranes (crawlers, specifically) in the country. Too many companies still desperate to take work at any price - presumably to keep lenders happy."
“Due to the current economic climate construction has fallen. This had made the market more competitive and has driven the rates down to unrealistic and unsustainable prices. This is down to smaller cranes firms trying to win the work, and quoting ridiculous prices, in some case half the price of the current going rate!”
“Rental rates have been stagnant for at least the last 10 years and need to increase as the purchase price and overheads have increased substantially. There are companies all over the country working for unsustainable rates and keeping the market low.”
“Brexit seems to have
affected work last year.”
2019 rental rate surveyc&a
“The rental rates are Sh*t”
30 cranes & access December/January 2020
2019 rental rate survey c&a
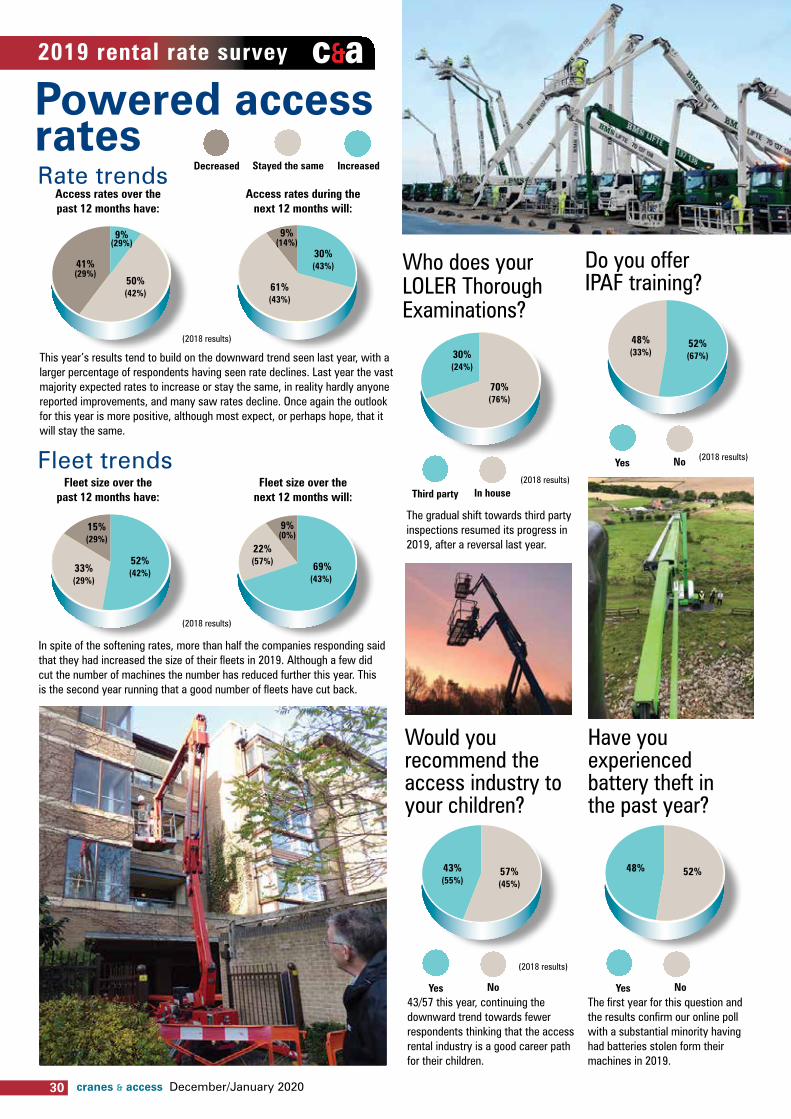
Who does your LOLER Thorough Examinations?
Third party in house
70% (76%)
30% (24%)
(2018 results)
The gradual shift towards third party inspections resumed its progress in 2019, after a reversal last year.
Would you recommend the access industry to your children?
Yes no
57% (45%)
43% (55%)
(2018 results)
43/57 this year, continuing the downward trend towards fewer respondents thinking that the access rental industry is a good career path for their children.
Have you experienced battery theft in the past year?
Yes no
52% 48%
The first year for this question and the results confirm our online poll with a substantial minority having had batteries stolen form their machines in 2019.
Do you offer IPAF training?
(2018 results)Yes no
52% (67%)
48% (33%)
Powered access ratesRate trends
Access rates over the past 12 months have:
Access rates during the next 12 months will:
This year’s results tend to build on the downward trend seen last year, with a larger percentage of respondents having seen rate declines. Last year the vast majority expected rates to increase or stay the same, in reality hardly anyone reported improvements, and many saw rates decline. Once again the outlook for this year is more positive, although most expect, or perhaps hope, that it will stay the same.
Fleet trendsfleet size over the
past 12 months have:fleet size over the
next 12 months will:
In spite of the softening rates, more than half the companies responding said that they had increased the size of their fleets in 2019. Although a few did cut the number of machines the number has reduced further this year. This is the second year running that a good number of fleets have cut back.
(2018 results)
52% (42%)
69% (43%)
33% (29%)
15% (29%)
9% (0%)
22% (57%)
Decreased Stayed the same increased
(2018 results)
9% (29%)
30% (43%)
50% (42%)
61% (43%)
41% (29%)
9% (14%)
2019 rental rate surveyc&a
31December/January 2020 cranes & access
Working Height Average (£) Lowest Highest ideal
12-13 metres (30-38ft) 208 157 260 251
17 metres (50ft) 243 210 340 352
Over 20 metres 325 250 370 450
Trailer lifts
up down same new category
Weekly rental rates by general category (continued) From last year rates have gone
Mast boomsWorking Height Average (£) Lowest Highest ideal
8 metres 90 80 105 110
10 metres 233 190 400 263
12 metres 282 200 390 265
Spider liftsWorking Height Average (£) Lowest Highest ideal
Up to 15 metres 526 400 750 685
16-20 metres 659 525 950 851
20-26 metres 1,095 985 1,250 1,500
28-30 metres 1,253 1,050 1,483 1,950
30-35 metres 1,495 1,190 1,700 2,257
Over 35 metres 1,560 1,350 1,900 2,590
Truck mounts - Daily rates
Working Height Average (£) Lowest Highest ideal
<25m (3.5 t) no operator 179 155 230 228
22-35m with operator 445 440 460 560
36-45 metres 757 520 950 967
46-60 metres 1,150 900 1,400 1,325
60 - 70 metres 1,550 1,300 1,650 1,675
Over 70 metres 2,825 1,900 3,750 3,325
Van mounts - Weekly rates
Working Height Average (£) Lowest Highest ideal
Up to 13 metres 320 290 370 370
13 to 15 metres 339 300 400 420
Over 15 metres 571 465 635 750
Push around liftsWorking Height Average (£) Lowest Highest ideal
Push Arounds 48 40 55 69
Portable 108 95 130 135
Rough Terrain articulated boomsPlatform Height Average (£) Lowest Highest ideal
12-14 metres (39-46ft) 222 200 255 266
15-16 metres (49-52ft) 253 220 320 314
17-19 metres (56-63ft) 310 275 350 373
20-23 metres (65-70ft) 357 330 400 458
24-26 metres (80-86ft) 594 500 825 708
Over 27 metres 1,100 700 1,350 1,150
Straight telescopic boomsPlatform Height Average (£) Lowest Highest ideal
Under 17 metres (40-46ft) 266 230 300 331
20-23 metres (60-70ft) 324 240 365 391
24-26 metres (80-86ft) 418 300 525 460
27-30 metres (90ft) 1,756 1,000 2,250 2,964
Over 30 metres - - -
Diesel/bi-energy scissor liftsPlatform Height Average (£) Lowest Highest ideal
8 metres (26ft) 145 130 150 195
9-10 metres (30-33ft) 155 140 165 193
11-12 metres (36-42ft) 205 150 265 267
13-17 metres (43-56ft) 233 178 310 314
17-22 metres (57-72ft) 313 250 380 348
Over 22 metres (72ft) 970 699 1,250 1,100
Electric self-propelled boomsPlatform Height Average (£) Lowest Highest ideal
Under 11 metres 242 190 300 294
10-12 metres (32-40ft) 248 200 300 287
14-15 metres (45 -51ft) 265 214 340 327
up down same new categoryElectric self-propelled scissor lifts
Platform Height Average (£) Lowest Highest ideal
Under 5 metres 76 55 90 95
6 metres (19/20ft) 107 90 195 124
8 metres (26ft) 115 90 139 147
9-10 metres (30-33ft) 132 95 155 173
11-12 metres (36-40ft) 180 110 230 220
13-17 metres (41-55ft) 265 195 362 289
17-22 metres (55-72ft) 512 337 650 639
22-25 metres (72-82ft) 567 383 705 950
Over 26 metres (85ft) - - -
No data
No data
loader cranes2019 rental rate survey c&a
32 cranes & access December/January 2020
utilisation Average rate as % of initial cost Average Lowest Highest
8 metres 68% 45% 80% 1.3%
10 metres 68% 15% 100% 1.1%
12 metres 66% 38% 88% 1.0%
Working Height
Mast booms
Spider lifts
Van mounts
utilisation
utilisation
Average rate as % of initial cost
Average rate as % of initial cost
Average Lowest Highest
Up to 15 metres 76% 61% 90% 2.8%
16-20 metres 62% 35% 100% 2.3%
20-26 metres 73% 46% 100% 2.5%
28-30 metres 57% 32% 65% 1.5%
30-35 metres 54% 25% 85% 1.0%
Over 35 metres 45% 11% 60% 1.5%
Average Lowest Highest
Up to 13 metres 85% 75% 100% 0.7%
13 to 15 metres 85% 80% 90% 0.8%
Over 15 metres 75% 60% 90% 1.0%
Working Height
Truck mountsutilisation Average rate as
% of initial cost Average Lowest Highest
<25m (3.5t) no operator 74% 50% 90% 1.3%
22-35m with operator 50% 35% 70% 0.5%
36-45m with operator 60% 45% 75% 0.2%
46-60m with opoerator 50% 40% 70% 0.7%
60-70m with operator 75% 45% 90% 1.4%
Over 70m with operator 60% 50% 85% 1.3%
Working Height
Trailer liftsutilisation Average rate as
% of initial cost Average Lowest Highest
12-13 metres (30-38ft) 45% 25% 70% 1.2%
17 metres (50ft) 40% 20% 75% 1.1%
Over 20 metres 59% 30% 75% 0.9%
Working Height
Working Height
utilisation Average rate as % of initial cost Average Lowest Highest
Push Arounds 81% 55% 100% 1.1%
Portable 60% 50% 90% 0.7%
Platform Height
Push around scissor lifts
Utilisation and percentage of initial cost
Diesel bi-energy scissor liftsutilisation Average rate as
% of initial cost Average Lowest Highest
8 metres (26ft) 78% 65% 100% 1.0%
9-10 metres (30-33ft) 64% 35% 100% 0.9%
11-12 metres (36-42ft) 62% 49% 90% 0.8%
13-17 metres (43-56ft) 71% 60% 80% 0.8%
17-22 metres (55-72ft) 77% 60% 85% 0.9%
Over 22 metres (72ft) 70% 40% 85% 0.8%
Platform Height
33December/January 2020 cranes & access
2019 rental rate surveyc&a
The recent aging trend continued with an average fleet age shifting from 3.3 to 4.3 years since 2017.
Average fleet age in years Average Lowest Highest
4.3 (4) 1 (2) 7 (6)
Access respondent’s comments
“The last year has been steady, but competition has certainly grown. Whilst rates have been steady we have had to match a few that were lower than expected. The aim this year is to push rates up and certainly push transport rates up.”
“Generally we feel the sector is fastly growing which has promoted a vast amount of start-ups with readily available funds to buy/finance machinery and hire out at extremely low rates bringing the market down. If these start-ups last or not, they are setting a precedent throughout the industry, bringing the value of the market down. Between these and the larger companies, room is limited for the steady experienced businesses. This doesn't account for all business within the sector, but there is a growing concern that this trend will continue and of the new blood being introduced it will grow even more naive. We can and will continue to more forward and remain competitive.”
“There seem to be more companies out
there in the market now all trying to compete for
the same work.”
“Buying the equipment is the easy part. Getting it out on hire at a sustainable rate which also takes into
consideration overhead recovery is the hard part. Maintaining it and getting paid is equally as hard, but for
some reason the UK hire industry fails to heed these warnings. As our commercial bank manager recently
told me "Turnover is for vanity, profit is for sanity, but cash-flow is no longer king... CASH-FLOW IS GOD"
“My belief is that rental rates have fallen throughout 2019. We have fought hard to retain our average rate but have been forced to walk away from a significant volume of business in doing so. I fear for more of the same in 2020.”
“As the market is very competitive
rates should remain the same.”
“Rates have remained the same.”
“I feel there is still an oversupply in the market”
“We are all are own worst enemy”
RT articulated booms
Electric self-propelled scissor liftsutilisation Average rate as
% of initial cost Average Lowest Highest Under 5 metres 64% 6% 100% 1.4% 6 metres (19/20ft) 63% 28% 85% 1.2% 8 metres (26ft) 73% 20% 100% 1.1% 9-10 metres (30-33ft) 65% 50% 75% 1.1% 11-12 metres (36-39ft) 62% 42% 76% 1.3% 13-17 metres (42-55ft) 71% 65% 85% 1.4% 17-22 metres 76% 60% 100% 0.8% 22-25 metres (72-82ft) 69% 60% 80% 0.8% Over 26 metres (85ft) No data - - -
Platform Height
utilisation Average rate as % of initial cost Average Lowest Highest
12-14 metres (39-45ft) 73% 60% 96% 0.9%
15-16 metres (49-52ft) 74% 61% 86% 0.9%
17-19 metres (56-62ft) 64% 52% 85% 0.9%
20-23 metres (65-70ft) 74% 60% 80% 1.0%
24-26 metres (80-86ft) 86% 65% 92% 1.1%
Over 27 metres 80% 70% 100% 0.8%
Platform Height
Electric self-propelled boomsutilisation Average rate as
% of initial cost Average Lowest Highest
Under 11 metres 62% 21% 80% 0.9%
10-12 metres (32-40ft) 66% 29% 92% 1.0%
Over 14 metres (45ft) 57% 25% 76% 1.0%
Platform Height
utilisation Average rate as % of initial cost Average Lowest Highest
Under 17 metres (40-46ft) 68% 55% 90% 1.2%
20-23 metres (60-70ft) 78% 60% 90% 1.1%
24-26 metres (80-86ft) 91% 60% 100% 0.9%
27-30 metres (90ft) 70% 40% 85% 0.8%
Over 30 metres No data - - -
Platform Height
Straight telescopic booms
34 cranes & access December/January 2020
Lift height Average (£) Lowest Highest ideal
Under 20 metres 1,005 850 1,200 1,200
20 to 25 metres 1,267 1,100 1,550 1,410
Over 25 metres 1,450 1,250 2,100 2,350
Lift height Average (£) Lowest Highest ideal
6 to 7 tonne 510 490 530 585
8 to 9 tonne 950 900 1,050 1,070
360 degree
Heavy Duty
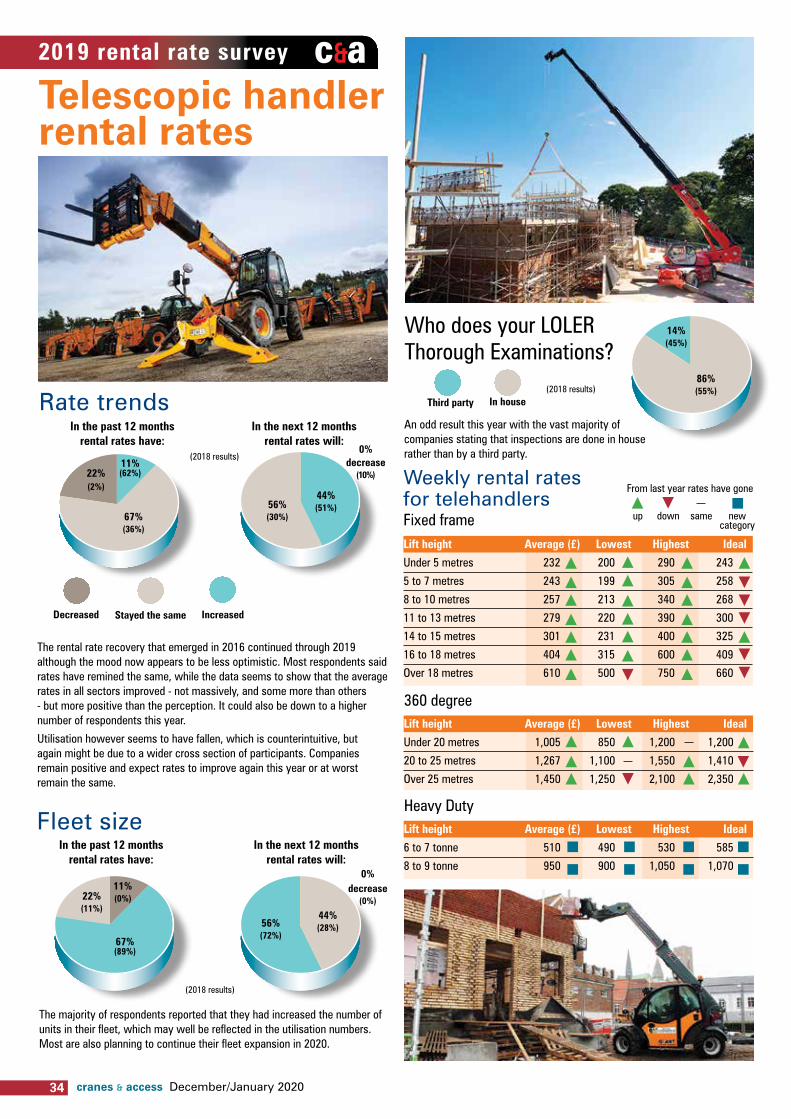
An odd result this year with the vast majority of companies stating that inspections are done in house rather than by a third party.
Who does your LOLER Thorough Examinations?
Third party in house
86% (55%)
14% (45%)
(2018 results)
2019 rental rate survey c&aTelescopic handler rental rates
Rate trendsin the past 12 months
rental rates have:
The rental rate recovery that emerged in 2016 continued through 2019 although the mood now appears to be less optimistic. Most respondents said rates have remined the same, while the data seems to show that the average rates in all sectors improved - not massively, and some more than others - but more positive than the perception. It could also be down to a higher number of respondents this year.
Utilisation however seems to have fallen, which is counterintuitive, but again might be due to a wider cross section of participants. Companies remain positive and expect rates to improve again this year or at worst remain the same.
in the next 12 months rental rates will:
(2018 results)
56% (30%)
44% (51%)
0% decrease
(10%)
Decreased Stayed the same increased
Fleet sizein the past 12 months
rental rates have:
(2018 results)
in the next 12 months rental rates will:
The majority of respondents reported that they had increased the number of units in their fleet, which may well be reflected in the utilisation numbers. Most are also planning to continue their fleet expansion in 2020.
22% (11%)
56% (72%)
11% (0%)
44% (28%)
0% decrease
(0%)
67% (89%)
11% (62%)
67% (36%)
22% (2%)
Lift height Average (£) Lowest Highest ideal
Under 5 metres 232 200 290 243
5 to 7 metres 243 199 305 258
8 to 10 metres 257 213 340 268
11 to 13 metres 279 220 390 300
14 to 15 metres 301 231 400 325
16 to 18 metres 404 315 600 409
Over 18 metres 610 500 750 660
up down same
Weekly rental rates for telehandlersFixed frame
From last year rates have gone
new category
35December/January 2020 cranes & access
(2018 results)
The fleet expansion had the effect of reducing the average age of machines in company fleets, reducing it close to the levels reported in 2017.
Average fleet age in years
Average Lowest Highest
2.8 (3.6) 1.2 (2) 8 (6)
Utilisation and percentage on initial cost
360 degree
Fixed frameutilisation
utilisation
Average rate as % of initial cost
Average rate as % of initial cost
Average Lowest Highest
Under 5 metres 61% 43% 95% 0.7%
5 to 7 metres 76% 43% 95% 0.7%
8 to 10 metres 73% 56% 90% 0.7%
11 to 13 metres 73% 50% 90% 0.5%
14 to 15 metres 72% 46% 90% 0.7%
16 to 18 metres 70% 41% 95% 0.7%
Over 18 metres 68% 31% 95% 0.8%
Average Lowest Highest
Under 20 metres 75% 70% 80% 0.8%
20 to 25 metres 70% 60% 80% 0.8%
Over 25 metres 70% 50% 80% 0.6%
Lift height
Lift height
Heavy Dutyutilisation Average rate as
% of initial cost Average Lowest Highest
6 to 7 tonne 85% 70% 100% 0.6%
8 to 9 tonne 75% 70% 80% 0.5%
Lift height
This is now a fairly stable number, although the number of companies mixing telehandler rental with access equipment is now over 50 percent, mostly down to general rental companies adding aerial lifts to their fleets, rather than access companies adding telehandlers.
What other products do you provide?cranes Access General equipment Tools
11% (5%) 11% (49%) 61% (35%) 16% (20%)
This appears to fairly stable with 360 degree machines being used for this application more than fixed frames. The odd thing is that the sight of fixed frame telehandlers working with platforms is common, yet this does not seem to transfer through to the rental business.
Type Average Lowest Highest
Fixed frame 5% 0% 2%
360 degree 14% 0% 25%
up down same
Percentage of units going out with work platform attachments:
From last year rates have gone
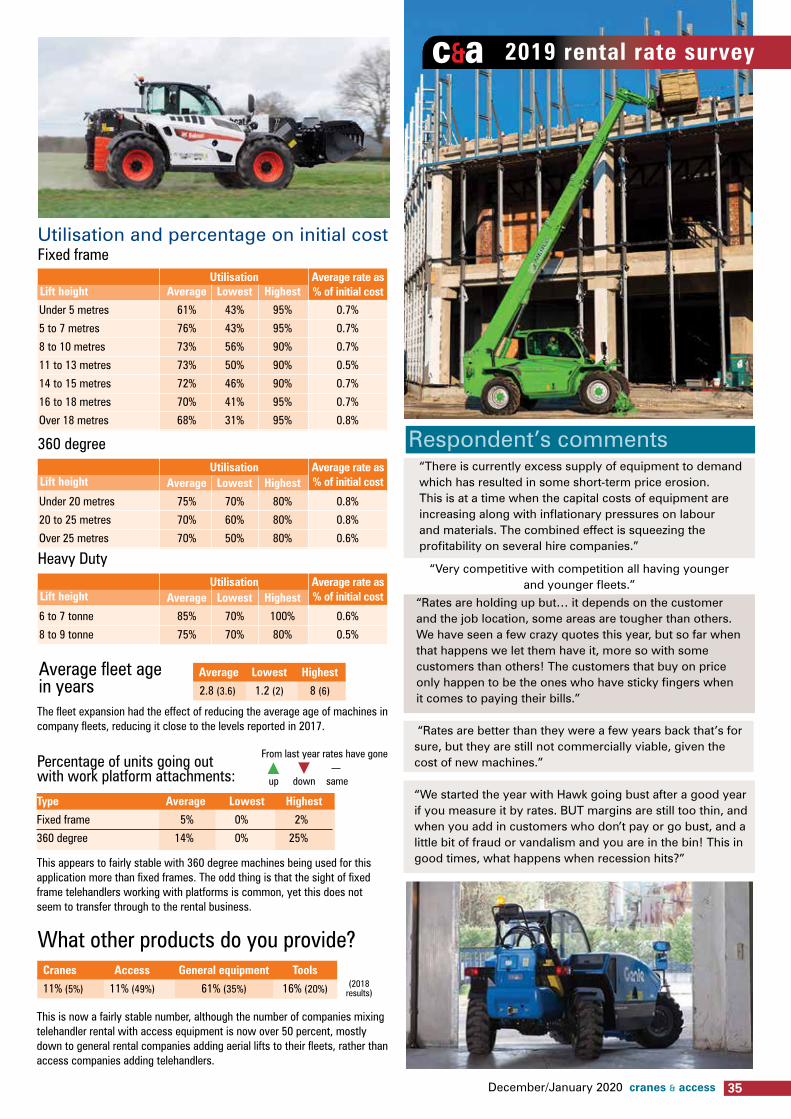
Respondent’s comments
2019 rental rate surveyc&a
“There is currently excess supply of equipment to demand which has resulted in some short-term price erosion. This is at a time when the capital costs of equipment are increasing along with inflationary pressures on labour and materials. The combined effect is squeezing the profitability on several hire companies.”
“Rates are holding up but… it depends on the customer and the job location, some areas are tougher than others. We have seen a few crazy quotes this year, but so far when that happens we let them have it, more so with some customers than others! The customers that buy on price only happen to be the ones who have sticky fingers when it comes to paying their bills.”
“Very competitive with competition all having younger and younger fleets.”
“We started the year with Hawk going bust after a good year if you measure it by rates. BUT margins are still too thin, and when you add in customers who don’t pay or go bust, and a little bit of fraud or vandalism and you are in the bin! This in good times, what happens when recession hits?”
“Rates are better than they were a few years back that’s for sure, but they are still not commercially viable, given the cost of new machines.”