bycatch of sea turtles in the mid-atlantic sea scallop
TRANSCRIPT
Northeast Fisheries Science Center Reference Document 04-11
Bycatch of Sea Turtlesin the Mid-Atlantic Sea Scallop
(Placopecten magellanicus)Dredge Fishery during 2003
by
Kimberly T. Murray
First Issued August 2004Revised and Reissued October 2004

Recent Issues in This Series
03-13 Distribution of the Brown Tide Picoplankter Aureococcus anophagefferens in Western New York BightCoastal Waters. By J.B. Mahoney, D. Jeffress, C. Zetlin, P.S. Olsen, H. Grebe, and J. Brooks. August 2003.
03-14 Assessment of the Gulf of Maine and Georges Bank Witch Flounder Stock for 2003. By S.E. Wigley, J.K.T.Brodziak, and L. Col. September 2003.
03-15 Estimates of the Number of Vessels and Quantity of Gear Deployed in the Lobster and Gillnet Fisheries in1999 off the Northeast Coast of the United States. By K.D. Bisack. September 2003.
03-16 Report of the 37th Northeast Regional Stock Assessment Workshop (37th SAW): Stock Assessment ReviewCommittee (SARC) Consensus Summary of Assessments. [By Northeast Regional Stock Assessment Work-shop No. 37.] September 2003.
03-17 Report of the 37th Northeast Regional Stock Assessment Workshop (37th SAW): Advisory Report. [ByNortheast Regional Stock Assessment Workshop No. 37.] September 2003.
03-18 Estimates of Marine Mammal Bycatch in the Northeast (New England) Multispecies Sink Gillnet Fisheryin 1996. By K.D. Bisack. September 2003.
04-01 Current Fisheries Research and Future Ecosystems Science in the Northeast Center: Collected Abstractsof the Northeast Fisheries Science Center’s Eighth Science Symposium, Atlantic City, New Jersey, Febru-ary 3-5, 2004. By D.L. Johnson, T.W. Finneran, B.A. Phelan, A.D. Deshpande, C.L. Noonan, S. Fromm, andD.M. Dowds. January 2004.
04-02 Salmon PVA: A Population Viability Analysis Model for Atlantic Salmon in the Maine Distinct PopulationSegment. By C.M. Legault. January 2004.
04-03 Report of the 38th Northeast Regional Stock Assessment Workshop (38th SAW): Stock Assessment ReviewCommittee (SARC) Consensus Summary of Assessments. [By Northeast Regional Stock Assessment Work-shop No. 38.] January 2004.
04-04 Report of the 38th Northeast Regional Stock Assessment Workshop (38th SAW): Advisory Report. [ByNortheast Regional Stock Assessment Workshop No. 38.] January 2004.
04-05 Proceedings of the Seventh Meeting of the Transboundary Resources Assessment Committee (TRAC), WoodsHole, Massachusetts, May 27-29, 2003. By W.J. Overholtz, TRAC chairman. [A report of TransboundaryResources Assessment Committee Meeting No. 7]. February 2004.
04-06 Stock Assessment of the Gulf of Maine - Georges Bank Atlantic Herring Complex, 2003. By W.J. Overholtz,L.D. Jacobson, G.D. Melvin, M. Cieri, M. Power, D. Libby, and K. Clark. February 2004.
04-07 Identification and Description of the Common Sponges of Jeffreys Ledge as an Aid in Field Operations. ByK. McCarthy. April 2004.
04-08 Revised Procedures for Calculating Regional Average Water Properties for Northeast Fisheries ScienceCenter Cruises. By D.G. Mountain, M.H. Taylor, and C. Bascuñán. April 2004.
04-09 Estimation of Striped Bass Discards in the Multispecies Groundfish Fishery during the 2002 Fishing Year(May 2002 - April 2003). By G.R. Shepherd. June 2004.
04-10a 39th Northeast Regional Stock Assessment Workshop (39th SAW) Assessment Summary Report. [By North-east Regional Stock Assessment Workshop No. 39.] July 2004.
04-10b 39th Northeast Regional Stock Assessment Workshop (39th SAW) Assessment Report. [By Northeast Re-gional Stock Assessment Workshop No. 39.] July 2004.

Northeast Fisheries Science Center Reference Document 04-11
Bycatch of Sea Turtles in the Mid-AtlanticSea Scallop (Placopecten magellanicus)
Dredge Fishery during 2003
by
Kimberly T. Murray
U.S. DEPARTMENT OF COMMERCENational Oceanic and Atmospheric Administration
National Marine Fisheries ServiceNortheast Fisheries Science Center
Woods Hole, Massachusetts
First Issued August 2004Revised and Reissued October 2004
National Marine Fisheries Serv., Woods Hole Lab., 166 Water St., Woods Hole, MA 02543

Northeast Fisheries Science Center Reference Documents
This series is a secondary scientific series designed to assure the long-term documentation andto enable the timely transmission of research results by Center and/or non-Center researchers,where such results bear upon the research mission of the Center (see the outside back cover forthe mission statement). These documents receive internal scientific review but no technical orcopy editing. The National Marine Fisheries Service does not endorse any proprietary material,process, or product mentioned in these documents.
All documents issued in this series since April 2001, and several documents issued prior to thatdate, have been copublished in both paper and electronic versions. To access the electronic versionof a document in this series, go to http://www.nefsc.noaa.gov/nefsc/publications/series/crdlist.htm.The electronic version will be available in PDF format to permit printing of a paper copy directlyfrom the Internet. If you do not have Internet access, or if a desired document is one of the pre-April 2001 documents available only in the paper version, you can obtain a paper copy bycontacting the senior Center author of the desired document. Refer to the title page of the desireddocument for the senior Center author's name and mailing address. If there is no Center author,or if there is corporate (i.e., non-individualized) authorship, then contact the Center's Woods HoleLaboratory Library (166 Water St., Woods Hole, MA 02543-1026).
This document’s publication history is as follows: manuscript submitted for review -- October28, 2004; manuscript accepted through technical review -- October 29, 2004; manuscript acceptedthrough policy review -- November 5, 2004; and final copy submitted for publication -- November5, 2004. This document may be cited as:
Murray, K.T. 2004. Bycatch of sea turtles in the Mid-Atlantic sea scallop (Placopectenmagellanicus) dredge fishery during 2003. 2nd ed. U.S. Dep. Commer., Northeast Fish. Sci.Cent. Ref. Doc. 04-11; 25 p. Available from: National Marine Fisheries Service, 166 Water Street,Woods Hole, MA 02543-1026.

iii
Table of Contents
Abstract ............................................................................................................................................v Introduction......................................................................................................................................1 Methods............................................................................................................................................2 Spatial and Temporal Boundaries Used for Bycatch Rate Extrapolation...............................2 Data Sources ...........................................................................................................................3 Modeling Approach ................................................................................................................5 Development of a GLM Bycatch Model ................................................................................5 Bycatch Rate Estimates...........................................................................................................7 Total Bycatch ..........................................................................................................................8 Results..............................................................................................................................................9 Data Representativeness .........................................................................................................9 Factors Influencing Bycatch ...................................................................................................9 Total Mortality Estimate .........................................................................................................9 Discussion......................................................................................................................................10 Factors Influencing Bycatch .................................................................................................10 Bycatch Patterns....................................................................................................................11 Data Caveats .........................................................................................................................11 Other Fisheries ......................................................................................................................13 Acknowledgments..........................................................................................................................14 References......................................................................................................................................14
Tables Table 1. Turtle bycatch in 2003 Mid-Atlantic scallop dredge fishery .......................................15 Table 2. Turtles caught on off-watch hauls or which were severely decomposed in the 2003
scallop dredge fishery ..................................................................................................16 Table 3. Categorical variables examined in an analysis of factors affecting sea turtle bycatch
in 2003 Mid-Atlantic scallop dredge fishery ...............................................................17 Table 4. Frequency of observed versus commercial dredge hauls in the Mid-Atlantic scallop
dredge fishery from June-November 2003 ..................................................................18 Table 5. Analysis of deviance table for turtle bycatch model selection ....................................19 Table 6. Total bycatch estimate of turtles from June-November in the Mid-Atlantic sea
scallop dredge fishery...................................................................................................20 Table 6a. Total bycatch estimate of turtles from June-November in the Hudson Canyon
controlled access area and outside this area in the Mid-Atlantic sea scallop dredge fishery ..........................................................................................................................21
Figures
Figure 1. Observed and commercial scallop dredge trips from June-November 2003 in the Mid-Atlantic region .....................................................................................................22
Figure 2. Turtle bycatch in the 2003 Mid-Atlantic scallop dredge fishery .................................23 Figure 3. Partial fit for the General Additive Model (GAM) of sea turtle bycatch with
temperature as a covariate............................................................................................24 Figure 4. Observed hauls where sea surface temperature is greater or equal to 22EC in the
2003 scallop dredge fishery .........................................................................................25

iv
PREFACE The NEFSC has re-estimated takes of loggerhead sea turtles in the Mid-Atlantic sea scallop fishery during 1 June to 30 November 2003, first estimated in the Northeast Fisheries Science Center Reference Document 04-11, issued in August 2004. This revision of the document uses improved data about the location of trips used in the analysis. The resulting estimate changed by 119 animals, from 630 to 749. The August bycatch analysis used actual location data from only those trip reports with recorded lat./long. locations, and prorated the remaining trips (about 32% of the trips used) to areas under analysis. The revised analysis uses trip reports with good trip location information entered either as lat./long. or as loran coordinates (only 1.5% of trips are prorated). Trips and takes that had been previously prorated to areas proved to be distributed differently than was assumed in the first analysis. The analytical method used is unchanged, as are the resulting bycatch rates and the coefficient of variance (CV=0.28) for the estimates. The conclusions of the analysis, that sea surface temperature and tow duration/speed have more influence on the likelihood of loggerhead takes than gear configuration or other observed fishery practices, are also unchanged.

v
Abstract
During 2003, fisheries observers aboard commercial vessels in the U.S. sea scallop
dredge fishery documented sea turtle bycatch in the Mid-Atlantic region, from Long Island, New
York to Cape Hatteras, North Carolina. This study utilizes Generalized Linear Model and
Generalized Additive Model fitting techniques to identify environmental factors and gear
characteristics that influence bycatch rates of sea turtles in the 2003 Mid-Atlantic scallop dredge
fishery, and predicts total bycatch in this area during June-November 2003. Significant factors
affecting sea turtle bycatch were sea surface temperature and tow speed. In estimating total
bycatch, rates were stratified based on sea surface temperature because tow speed was not
available in fishing logbooks. Highest bycatch rates occurred in surface temperatures greater or
equal to 22°C. Total estimated bycatch of sea turtles during 1 June to 30 November 2003 in the
Mid-Atlantic scallop dredge fishery was 749 animals (C.V. = 0.28).


1
INTRODUCTION
During 2001 and 2002, fisheries observers aboard commercial vessels in the sea scallop
dredge fishery documented sea turtle bycatch in two regions of the Mid-Atlantic (Murray 2004).
These areas, termed the ‘Hudson Canyon Controlled Access Area’ and the ‘Virginia Beach
Controlled Access Area’ were closed in April 1998 to allow juvenile scallops to recover and
reopened in May 2001 on a conditional basis. Observers sampled approximately 11% of the
commercial dredge effort in the Hudson Canyon Access Area during 2001 and 2002, and 16% of
the effort in the Virginia Beach Access Area during 2001. No trips were observed in the Virginia
Beach Access Area during 2002 due to low commercial fishing effort in the area. Outside of
these two areas, observer coverage was less than 1%. Over both years, observers documented 27
sea turtle interactions in the Controlled Access Areas (CAAs). Estimated bycatch in the Hudson
Canyon Area was 69 turtles in 2001, and 95 turtles in 2002. Estimated bycatch in the Virginia
Beach Access Area was 5 turtles in 2001, and 0 turtles in 2002.
The spatial extent of observer coverage in the commercial scallop dredge fishery
expanded in 2003. This increase in spatial coverage was needed to properly assess bycatch
outside of the CAAs. Bycatch in these two areas was not estimated in 2001-2002 because of
scientific concerns that bycatch rates differed throughout the broader Mid-Atlantic based on
environmental factors, fishing practices, and dredge gear characteristics. Accounting for
differences in bycatch rates based on these factors reduces bias in the total bycatch estimate.
The purpose of this paper is to identify factors that influenced the bycatch rate of turtles
in the Mid-Atlantic sea scallop dredge fishery in 2003, and to provide a total bycatch estimate
for this fishery. This bycatch assessment is based on new and expanded information about the
fishery in the Mid-Atlantic, taking into consideration fishing practices, environmental variables,
and gear characteristics both inside and outside of the Controlled Access Areas.

2
METHODS
Spatial and Temporal Boundaries used for Bycatch Rate Extrapolation
The 2003 fishing year for the U.S. commercial sea scallop fishery occurred from 1 March
2003 to 28 February 2004 (NEFMC 2002) in the Gulf of Maine, Georges Bank, and Mid-
Atlantic regions. This analysis deals solely with trips operating in the Mid-Atlantic region from
Long Island, NY to Cape Hatteras, NC (approximately 41B09'N/71B00'W to 35B15'N/71B00'W),
from 1 June to 30 November 2003.
It is assumed here that there are no turtle interactions in the scallop fishery in the Georges
Bank and Gulf of Maine regions; as such, commercial fishing effort north of Long Island, NY
was excluded from the bycatch analysis. Compared to the Mid-Atlantic fishery, the Georges
Bank and Gulf of Maine scallop fisheries operate in different ecological conditions. These
fisheries operate north of the general range of loggerhead turtles (~ 41BN latitude as a northern
limit; Shoop and Kenney 1992). There has never been an observed turtle interaction in the
Georges Bank and Gulf of Maine areas; however, observer coverage (% trips observed) in these
areas has been low (< 1.0% in 2001, 2002 and 2003).
A bycatch estimate is provided for the period June to November 2003, rather than
throughout the entire fishing year, because outside of this time frame turtle interactions with the
sea scallop dredge fishery are unlikely to occur. Loggerhead sea turtles inhabit northern
temperate waters seasonally, appearing in early summer and remaining for several months until
migrating south in the fall (Morreale 1999). By December, turtles are near or south of Cape
Hatteras, NC (Shoop and Kenney 1992). Historically, turtle interactions have been observed in
the scallop dredge fishery from late June to late October. The potential for interactions also
exists during November due to the overlap of turtles and dredge fishing effort in the southern
most area of the fishery.

3
Data SourcesObserver Coverage and Observed Turtle Interactions
From June - November 2003, observer coverage (percentage of dredge hours observed)
in the entire Mid-Atlantic was 2.7%. Coverage was higher in the Hudson Canyon Controlled
Access Area (9.7%) than outside this area (1.4%) (Figure 1).
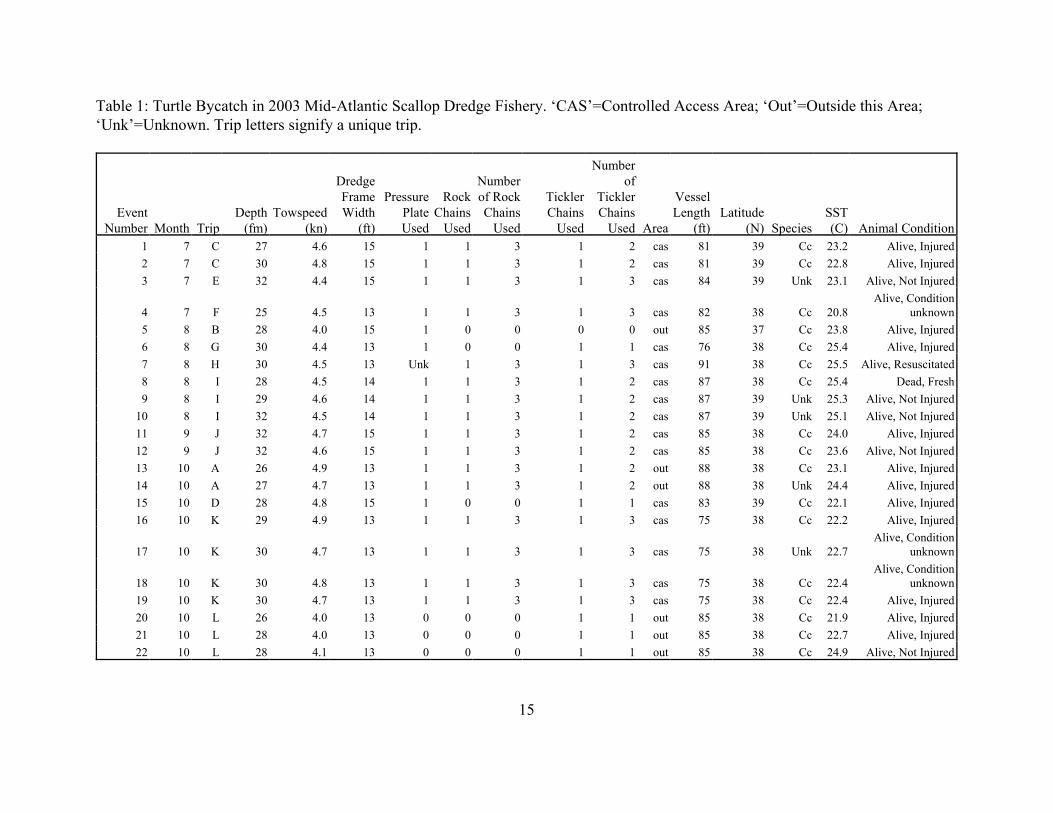
Twenty-two turtle interactions were observed in the Mid-Atlantic region, of which 16
were in the Hudson Canyon Controlled Access Area, and 6 were outside this area (Table 1,
Figure 2). Five turtles were released alive and uninjured, 1 was fresh dead, 12 were alive and
injured, 1 was resuscitated, and 3 were alive yet whose condition was unknown. Four (18%)
interactions occurred during July, 6 (27%) during August, 2 (9%) during September, and 10
(46%) during October.
Seventeen (77%) of the interactions were loggerheads (Caretta caretta), and 5 (23%)
were not positively identified. Four of the 5 unidentified turtles occurred on trips that also
interacted with a loggerhead. According to observer logs, instances where turtles could not be
identified occurred when the turtle fell from the gear and the observer did not have enough time
to positively identify the turtle. Since 2001, only loggerhead species have been positively
identified in the Mid-Atlantic scallop dredge fishery. Because loggerheads have been the only
species of sea turtles observed in the scallop dredge fishery since a dedicated observer program
began in 2001, and 4 out of the 5 unidentified interactions took place in loggerhead territory, it is
assumed that the 5 unidentified species were loggerheads. Therefore, the 2003 total bycatch
estimate is considered to be for loggerhead turtles only.
In addition, two turtles, each on separate trips during October, were captured when an
observer was off-watch (Table 2). One trip was inside the Hudson Canyon Controlled Access
Area and the other was outside. These 2 interactions occurred when the observer was not
collecting information on the haul. These turtles were not included in the count of turtles used to
calculate bycatch rates, though they are subsumed in the extrapolated estimate. Furthermore, 6
severely decomposed turtles wrapped in gillnet gear were captured on a single trip during
September. These interactions occurred in the Hudson Canyon Access Area. These turtles were
also not included in the count of turtle interactions because the mortalities may have occurred

4
from previous interactions with gillnet gear.
Commercial Fisheries Data
Any vessel issued a federal fishery permit with Vessel Trip Report (VTR) requirements
must submit a report for each trip taken. In the report, vessel operators are required to provide
information such as, date and time sailed, date and time catch landed, quantity and size of gear,
average depth fished, statistical area fished, latitude and longitude, average tow time, species
composition and catch weight, and total number of hauls.
Vessel Trip Reports from scallop dredge fishermen operating in Mid-Atlantic waters
from Long Island, NY to Cape Hatteras, NC from June to November 2003 were used in this
analysis. Number of dredge hours from trips without coordinate positions (1.5%) were prorated
between the Mid-Atlantic and Hudson Canyon Controlled Access Area regions based on the
percentage of dredge hours in these regions from trips with known coordinates.
The frequency of commercial and observed dredge hauls were compared for variables
available in both the commercial and observer data to assess how representative the observer
data were of the commercial fleet.
Temperature Data
It was necessary to acquire temperature values for each Observed and VTR fishing event
in order to model and extrapolate bycatch rates for the total mortality estimate. Sea surface
temperature at each position reported in the Observer and VTR databases was extracted from
NOAA Advanced Very High Resolution Radiometer (AVHRR) Coastwatch Satellite Images. A
Visual Basic routine was used to extract temperatures from 7-day composite images (3 days
forward and backward of the haul date), using a 3x3 cell window at 1 km resolution. Therefore, a
9 km2 area of coverage around each coordinate position was used to extract sea surface
temperature. Within the 3x3 cell search radius, the pixel representing the warmest temperature
was used to avoid temperatures affected by cloud coverage.
1In previous years most hauls were 1 hour long with little variation around this time. With an increased sample size in2003, there was more variation in haul durations, making it necessary to standardize for the amount of time each dredge was inthe water.
5
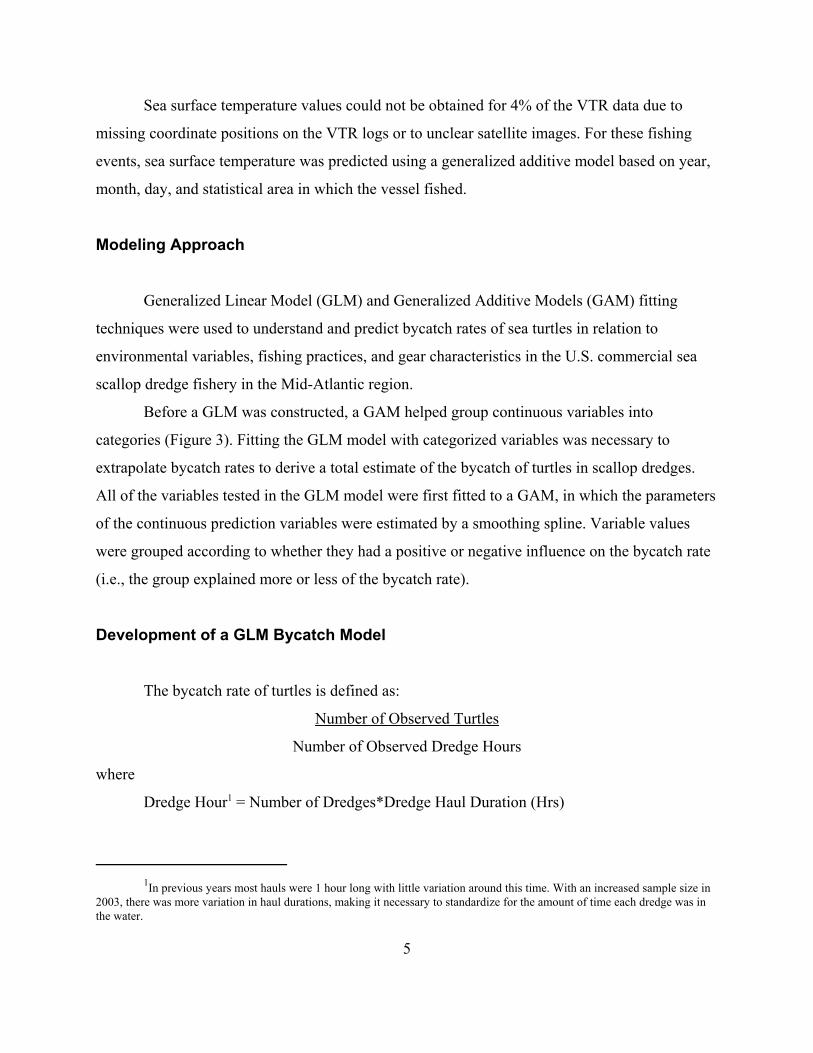
Sea surface temperature values could not be obtained for 4% of the VTR data due to
missing coordinate positions on the VTR logs or to unclear satellite images. For these fishing
events, sea surface temperature was predicted using a generalized additive model based on year,
month, day, and statistical area in which the vessel fished.
Modeling Approach
Generalized Linear Model (GLM) and Generalized Additive Models (GAM) fitting
techniques were used to understand and predict bycatch rates of sea turtles in relation to
environmental variables, fishing practices, and gear characteristics in the U.S. commercial sea
scallop dredge fishery in the Mid-Atlantic region.
Before a GLM was constructed, a GAM helped group continuous variables into
categories (Figure 3). Fitting the GLM model with categorized variables was necessary to
extrapolate bycatch rates to derive a total estimate of the bycatch of turtles in scallop dredges.
All of the variables tested in the GLM model were first fitted to a GAM, in which the parameters
of the continuous prediction variables were estimated by a smoothing spline. Variable values
were grouped according to whether they had a positive or negative influence on the bycatch rate
(i.e., the group explained more or less of the bycatch rate).
Development of a GLM Bycatch Model
The bycatch rate of turtles is defined as:
Number of Observed Turtles
Number of Observed Dredge Hours
where
Dredge Hour1 = Number of Dredges*Dredge Haul Duration (Hrs)

6
Because bycatch events were counts ranging from zero to one, a logistic regression was
used to model the probability of turtle bycatch per unit dredge hour, i.e., the bycatch rate (GLM
function, SPLUS 6.2). The model can be written as:
log( / ) ......turtlebyc dredgehr x x xi i= + + +β β β β0 1 1 2 2
where $i is a parameter coefficient, and xi a predictor variable describing environmental, gear, or
fishing characteristics.
In order to model the bycatch rate (i.e., adjusting for varying time spans), the logarithm
of dredgehr becomes an offset variable with a coefficient set to 1.0 (Allison 1999; Palka and
Rossman 2001). Thus the model can be rewritten as:
log( ) log( ) ......turtlebyc dredgehr x x xi i= + + + +β β β β0 1 1 2 2
A forward stepwise selection method was used to determine the best fitting model. Model
parameters were estimated by maximizing the log-likelihood function. The null model was the
first model in the stepwise process and was specified with the offset variable alone:
: log(turtle bycatch) = log(dredgehr)H0
At each step, a new variable was added to the null model (Table 3) and tested against the
previous model formulation (ANOVA function, Chi-square test) to determine the better fitting
model. Main effects of each variable were tested in the stepwise selection process. If a P-value
was less than or equal to 0.05, then the additional variable was considered to explain more of the
variability in bycatch than a model without that variable.
The order in which variables were tested in the forward stepwise model was determined
by first ranking variables based on their Akaike Information Criterion (AIC) value relative to
other variables in the model (StepAIC function, SPLUS 6.2). The AIC is defined as:

7
AIC L y K= − +2 2log( | ))θ
where is the numerical value of the log-likelihood at its maximum point and K islog( ( | ))L yθ
the number of estimable parameters (Burnham and Anderson, 2002). The AIC is a measure of
the goodness of fit that includes the level of parsimony, defined as a model that fits the data well
and includes as few parameters as necessary (Burnham and Anderson, 2002).
In the StepAIC process, a sequence of models is fitted to the null model in an automated
process, where the first variable added has resulted in the greatest change in AIC relative to all
other variables in the scope of the model. If the AIC value decreases, the new combination of
variables in the model fit the data better. A 2nd variable is then fitted to the previous model based
on the greatest change in AIC and so on, until the AIC value no longer reduces. Each variable in
the final sequence was then tested individually in the forward stepwise selection process
described above. A low AIC value relative to another model does not necessarily mean the
additional variable is significant at "=0.05. P-values, therefore, were used for model selection.
Alias patterns in the full GLM model (i.e., a model with all categorical variables
included) were examined to assess correlation among the explanatory variables. In addition,
scatter plots and Pearson correlation coefficients between variables were examined before
variables were grouped into the GAM categories to assess possible interactions.
Bycatch Rate Estimates
The spatial and temporal stratification of bycatch rates in the Mid-Atlantic was
determined by the explanatory variables in the best-fitting GLM. Parameter estimates from the
best-fitting model were used to predict the bycatch rate for each stratum.
The coefficient of variation (C.V.) for each bycatch rate was estimated by bootstrap
resampling (Efron and Tibshirani, 1993). The resampling unit was a single trip. Replicate
bycatch rates were generated based on the best-fitting GLM model, by sampling with
replacement 1000 times from the original data set. The C.V. was defined as the standard

8
deviation of the bootstrap replicate bycatch rate in a stratum divided by the bycatch rate for that
stratum estimated from the original data.
An annual C.V. from stratified estimates was calculated by taking the square root of the
sum of bycatch rate variances over all strata, and dividing by the sum of bycatch rates over all
strata (Wade and Angliss, 1997):
Annual CV = var( ) /∑ ∑x xi i
where xi = the bootstrap replicate mean bycatch rate in each stratum.
Total Bycatch
The total estimated turtle bycatch in each stratum was calculated as the product of
predicted bycatch per dredgehr (i.e., the predicted bycatch rate) for that stratum and the total
number of dredge hours by the commercial fishery in that stratum:
3Predicted Bycatchi x (Total Dredge Hours)i
3Dredge Houri
where i = stratum
Total bycatch was the sum of the stratified bycatch estimates.

9
RESULTS
Data Representativeness
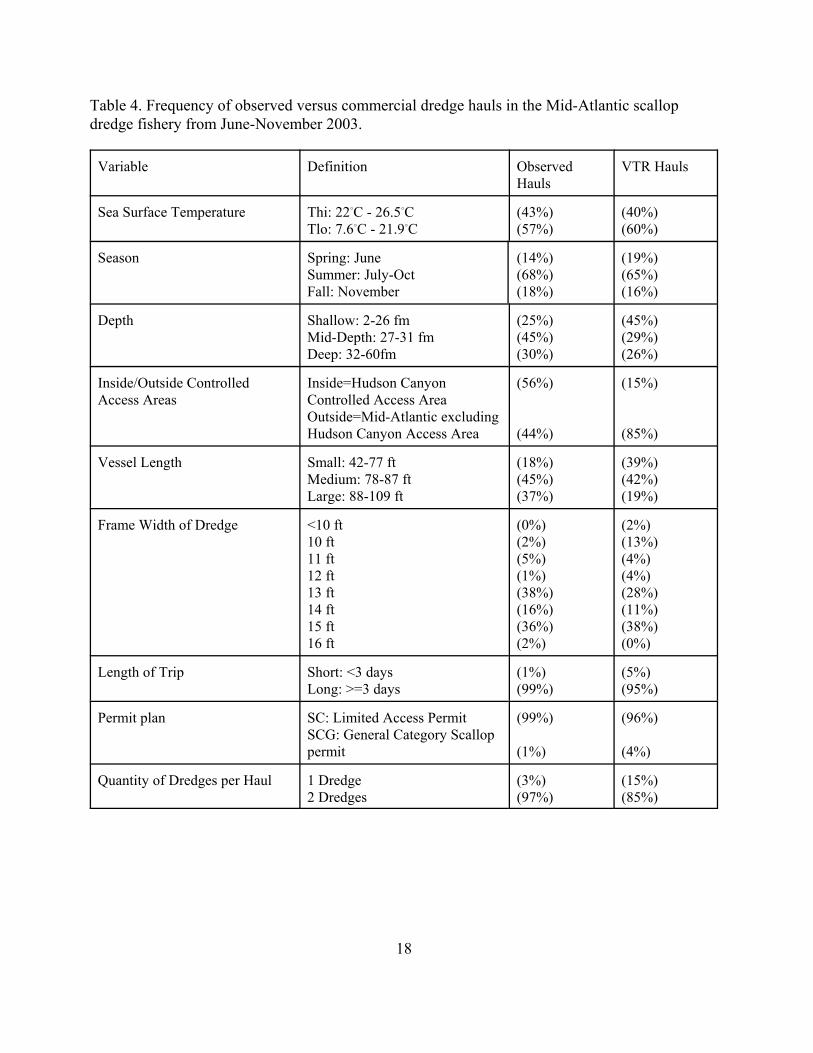
Based on the spatial distribution of commercial dredge fishing effort in the Mid-Atlantic,
the Hudson Canyon Controlled Access Area was over-sampled in 2003 (Table 4). Small vessels
(from 42-77 ft) were under-sampled, as were small dredges (<=10 ft frame width). Fifteen
percent of dredge hauls accomplished by commercial vessels in the Mid-Atlantic used dredges
less than or equal to 10 feet, while only 2% of this size dredge was sampled by observers.
Commercial effort in shallow depths (2-26 fm) was under-sampled, and over-sampled in mid-
depth ranges (27-31 fm).
Some variables, such as tow speed, could not be used to estimate total bycatch because
these data are not recorded on VTR records. Thus, for these variables, it is assumed that
unobserved hauls have the same characteristics as the observed hauls used in the bycatch model.
Factors Influencing Bycatch
Significant factors affecting sea turtle bycatch were sea surface temperature and tow
speed (Table 5). In estimating total bycatch, rates were stratified based on temperature because
tow speed was not available from fishing logbooks. Highest probability of bycatch occurred in
surface waters 22BC or warmer. Hence bycatch rates were stratified based on whether
temperatures were higher or lower than 22BC.
Bycatch rates inside and outside the Hudson Canyon Controlled Access Area were
identical. In addition, rates did not differ due to use and number of rock and tickler chains, vessel
length, or frame width of the dredge.
Total Mortality Estimate
The total estimated bycatch of sea turtles from June to November, 2003 in the Mid-
Atlantic sea scallop dredge fishery is 749 turtles (C.V.=0.28)(Table 6). Five of the 22 observed
turtles were released alive and uninjured, implying a 22.7% survival rate and a 77.3%

10
mortality/injury rate. Hence, of the 749 interactions, an estimated 579 turtles are considered to
have died or have injuries.
Out of the 749 interactions, 122 (16%) occurred in the Hudson Canyon Controlled
Access Area, and 627 (84%) outside of this area (Table 6a). Interactions in the Virginia Beach
Controlled Access Area are subsumed in the total estimate. However, because there was only 1
commercial trip in this Access Area between June and November 2003, the likelihood of a turtle
interaction in this Access Area was very low.
DISCUSSION
Factors Influencing Bycatch
Stratifying bycatch rates by sea surface temperature accounts for much of the temporal
and spatial variation in bycatch rates of turtles in the Mid-Atlantic. Observed hauls in waters
22BC or warmer occurred in offshore waters from New York harbor down to the mouth of the
Chesapeake, with waters closer to shore (i.e. west of the 27fm isobath) warming sooner than
offshore (Figure 4). In general, months for these warm waters, as indicated by the observed
hauls, range from early July to end of October. The timing of surface temperature warming and
cooling on shelf waters in the Mid-Atlantic depends on a variety of factors, including air
temperatures, the position of the Gulf Stream, water transport from the north, and the timing of
vernal warming or fall overturn (Jossi and Benway 2003).
Tow speed was also a significant factor affecting bycatch of turtles. Had bycatch rates
been stratified by tow speed, highest rates would have occurred during hauls having tow speeds
between 4.4 and 4.9 knots.
Tow speed should be investigated further as a factor influencing the bycatch of turtles.
Tow speed may affect how dredges come in contact with the bottom, influencing the potential
for a turtle encounter. According to James Kendall (1998), “with dredge gear, as well as with a
lot of other towed gear including trawls, speed plays an important role.....the fact is that if
fishermen tow too fast, they will actually fly the gear right up off the bottom much as with a kite,
because the gear becomes functionally weightless.” It is possible that there is an optimal speed to
catch scallops that allows for the dredge to maintain contact with the bottom, leading to a higher

11
probability of a turtle encounter if turtles are foraging or crouching on the bottom. Presence or
absence of a pressure plate, which helps keep the dredge frame on the bottom, did not
significantly affect turtle bycatch, though other related factors not considered in this analysis
may play a role.
Bycatch Patterns
Over the last three years, sea surface temperature has been a significant predictor of sea
turtle bycatch in both the Mid-Atlantic Controlled Access Areas [2001-2002], and over the
broader Mid-Atlantic from New York to North Carolina [2003]. In 2001-2002, a higher
probability of turtle bycatch occurred after waters warmed to 19BC, and in 2003, higher
probabilities occurred after waters warmed to 22BC. These differences may reflect inter-annual
variation in sea surface temperatures, turtle distributions, and shifting patterns in the fishery.
Nevertheless, there may be a consistent minimal threshold temperature from year to year above
which turtle bycatch is more likely to occur, though the minimal temperature threshold at which
the observed interaction occurs is likely to fluctuate from year to year.
From 2001-2003, turtle bycatch occurred between depths of 25-35 fm. In general, the
fishery operated in depths from 5-50 fm, with 40-50% operating in depths shallower than 25 fm
over these three years. While depth was not a significant predictor of bycatch in this analysis, the
area in which turtle bycatch occurred over the last three years is worth noting. Hot spots for
turtle bycatch may consistently occur within certain depths that do not coincide with the entire
range of the fishery. More sampling coverage should be accomplished in shallower depth ranges
to further explore this idea.
Data Caveats
While the best-fitting GLM model for predicting turtle bycatch in the scallop dredge
fishery included tow speed, this co-variate had to be removed from the final model because tow
speed information is not available in VTR logbooks. Removing the effect of tow speed from the
final model forces the assumption that bycatch rates are the same for vessels fishing at different

12
speeds. This may cause the bycatch estimate to be biased in certain directions depending on the
variability of tow speeds throughout the Mid-Atlantic.
The disproportionate amount of observer coverage in the area outside of the Hudson
Canyon Access Area relative to total commercial effort may have obscured the ability to detect
differences in bycatch rates among the variables examined. For example, there was very little
coverage on boats using dredges 10 feet wide or smaller. The low sample size of small dredges
may have prevented the detection of a difference in rates due to dredge size. This analysis
assumes that bycatch rates are the same for all dredge sizes. If rates are higher or lower in small
dredges the total estimated bycatch will likewise be biased high or low. Many vessels using
small dredges are fishing under a General Category permit for scallops, where scallop catch is
limited to 400 pounds shucked scallops outside the Controlled Access Areas and 100 pounds
inside. More coverage is needed on boats using small dredges and/or of the General Category
permit boats to ensure that fishing behavior on these boats does not increase the potential for
turtle bycatch.
In this analysis, main effects of each categorical variable were considered in the bycatch
model because there did not appear to be any interaction effects between variables. In other
words, the effect of vessel length and depth on bycatch rates, for instance, are considered
independently from one another in the GLM. The clustered nature of many of the parameter
values, however, may have statistical consequences on the model results. For instance, the
majority of smaller vessels may tow in shallower waters and at lower tow speeds. So, the range
of parameter values is not represented equally across all variables. Further work needs to address
whether this clustering influences the model’s ability to detect significant effects of a single
variable.
Further work should also investigate whether the behavior of particular vessels, other
than what has been examined in this analysis, increase the likelihood of a turtle interaction. For
example, 1 of the observed trips (Trip K, Table 1) took 4 turtles, 2 of the observed trips (I and L,
Table 1) took 3 turtles, and 3 of the observed trips (A, C, and J, Table 1) took 2 turtles. Hence,
16 (73%) of the 22 observed interactions involved multiple interactions. These vessels may have
been behaving in a manner that increased the likelihood of catching a turtle in the dredge.
Identifying such possible behavioral patterns may facilitate mitigation options for reducing

13
interactions. Furthermore, some of these options may need not apply to the entire commercial
fleet.
Finally, given the association between sea surface temperature and turtle bycatch, further
work should examine bycatch rates over a range of different temperature strata. Exploring
changes in rates as a function of temperature may indicate whether predicted bycatch rates are
sensitive to small changes in temperature. Furthermore, this research would help inform the
design of possible time and area closures intended to reduce turtle bycatch, by examining the
percentage of bycatch reduction achieved at various temperature ranges.
Other Fisheries
The bycatch of turtles in the Mid-Atlantic scallop dredge fishery represents only a
portion of the total bycatch of sea turtles in Northwest Atlantic Ocean fisheries. For example,
trawl fisheries targeting a variety of species also operate in the same area and months when
turtles are present in the Mid-Atlantic. Trawls that target scallops may have a different bycatch
rate of turtles than trawls that target fish because scallop trawl gear is of somewhat different
design, is fished closer to the bottom, and is fished at different speeds than trawl gear for fish.
However, there has been very little observer coverage with which to estimate bycatch in the
scallop trawl fishery. Based on reported trips, coverage (% trips observed) from 2001-2003 was
roughly 0.2%. There were 7 trips observed during 2001-2004 [4 in 2001; 1 in 2002; 0 in 2003;
and 2 in 2004 through July] and no sea turtles were observed on any of these trips. Observer
coverage is currently scheduled for late summer and fall of 2004. This coverage may start to
shed light on the magnitude of turtle bycatch in the scallop trawl fishery.

14
ACKNOWLEDGMENTS
Many thanks to Debra Palka for her statistical guidance in the bycatch assessment, as
well as to Andre Punt for his comments on the general modelling approach. David Mountain was
extremely helpful in assembling 2003 Coastwatch Images and writing the Visual Basic routine to
extract temperature data. Paul Rago, Dvora Hart, Debra Palka, Fred Serchuk, and Richard
Merrick provided insightful comments on earlier drafts of the manuscript.
REFERENCES
Allison, P. 1999. Logistic Regression Using the SAS System: Theory and Application. SASInstitute Inc., Cary, NC. 304 pp.
Burnham, K.P. and D.R. Anderson. 2002. Model Selection and Multimodal Inference: APractical Information-Theoretic Approach, 2nd Ed. Springer-Verlag, New York, 488p.
Efron, B. and R. Tibshirani. 1993. An Introduction to the Bootstrap. Chapman&Hall, New York,436 p.
Jossi, J. and R. Benway. 2003. Variability of temperature and salinity in the Middle AtlanticBight and Gulf of Maine based on data collected as part of the MARMAP Ships ofOpportunity program, 1978-2001. NOAA Technical Memorandum NMFS-NE-172.Accessible at http://www.nefsc.noaa.gov/nefsc/publications/
Kendall, J. 1998. Scallop Dredge Fishing. In Effects of Fishing Gear on the Sea Floor of NewEngland (E. Dorsey and J. Pederson eds.), pp 90-93. Conservation Law Foundation,Boston, MA.
Morreale, S. 1999. Oceanic migrations of sea turtles. PhD dissertation, Cornell University. 144p.
Murray, K. 2004. Magnitude and distribution of sea turtle bycatch in the sea scallop(Placopecten magellanicus) dredge fishery in two areas of the Northwestern AtlanticOcean, 2001-2002. Fishery Bulletin 102(4):671-681.
NEFMC [New England Fishery Management Council]. 2002. Framework Adjustment 15 to theAtlantic Sea Scallop Fishery Management Plan. Newburyport, MA. Accessible at http://www.nefmc.org/scallops/index.html.
Palka, D. and M. Rossman. 2001. Bycatch estimates of coastal bottlenose dolphin (Tursiopstruncatus) in U.S. Mid-Atlantic gillnet fisheries for 1996-2000. Northeast FisheriesScience Center Reference Document 01-15. 77p.
Shoop, R. and R. Kenney. 1992. Seasonal distributions and abundances of loggerhead andleatherback sea turtles in waters of the northeastern United States. HerpetologicalMonographs 6:43-67.
Wade, P. and R. Angliss. 1997. Guidelines for Assessing Marine Mammal Stocks: Report of theGAMMS Workshop April 3-5, 1996, Seattle, Washington. U.S. Dep. Commer., NOAATech. Memo. NMFS-OPR-12, 93p.
15
Table 1: Turtle Bycatch in 2003 Mid-Atlantic Scallop Dredge Fishery. ‘CAS’=Controlled Access Area; ‘Out’=Outside this Area;‘Unk’=Unknown. Trip letters signify a unique trip.
EventNumber Month Trip
Depth(fm)
Towspeed(kn)
DredgeFrameWidth
(ft)
PressurePlateUsed
RockChains
Used
Numberof RockChains
Used
TicklerChains
Used
Numberof
TicklerChains
Used Area
VesselLength
(ft)Latitude
(N) SpeciesSST(C) Animal Condition
1 7 C 27 4.6 15 1 1 3 1 2 cas 81 39 Cc 23.2 Alive, Injured2 7 C 30 4.8 15 1 1 3 1 2 cas 81 39 Cc 22.8 Alive, Injured3 7 E 32 4.4 15 1 1 3 1 3 cas 84 39 Unk 23.1 Alive, Not Injured
4 7 F 25 4.5 13 1 1 3 1 3 cas 82 38 Cc 20.8Alive, Condition
unknown5 8 B 28 4.0 15 1 0 0 0 0 out 85 37 Cc 23.8 Alive, Injured6 8 G 30 4.4 13 1 0 0 1 1 cas 76 38 Cc 25.4 Alive, Injured7 8 H 30 4.5 13 Unk 1 3 1 3 cas 91 38 Cc 25.5 Alive, Resuscitated8 8 I 28 4.5 14 1 1 3 1 2 cas 87 38 Cc 25.4 Dead, Fresh9 8 I 29 4.6 14 1 1 3 1 2 cas 87 39 Unk 25.3 Alive, Not Injured
10 8 I 32 4.5 14 1 1 3 1 2 cas 87 39 Unk 25.1 Alive, Not Injured11 9 J 32 4.7 15 1 1 3 1 2 cas 85 38 Cc 24.0 Alive, Injured12 9 J 32 4.6 15 1 1 3 1 2 cas 85 38 Cc 23.6 Alive, Not Injured13 10 A 26 4.9 13 1 1 3 1 2 out 88 38 Cc 23.1 Alive, Injured14 10 A 27 4.7 13 1 1 3 1 2 out 88 38 Unk 24.4 Alive, Injured15 10 D 28 4.8 15 1 0 0 1 1 cas 83 39 Cc 22.1 Alive, Injured16 10 K 29 4.9 13 1 1 3 1 3 cas 75 38 Cc 22.2 Alive, Injured
17 10 K 30 4.7 13 1 1 3 1 3 cas 75 38 Unk 22.7Alive, Condition
unknown
18 10 K 30 4.8 13 1 1 3 1 3 cas 75 38 Cc 22.4Alive, Condition
unknown19 10 K 30 4.7 13 1 1 3 1 3 cas 75 38 Cc 22.4 Alive, Injured20 10 L 26 4.0 13 0 0 0 1 1 out 85 38 Cc 21.9 Alive, Injured21 10 L 28 4.0 13 0 0 0 1 1 out 85 38 Cc 22.7 Alive, Injured22 10 L 28 4.1 13 0 0 0 1 1 out 85 38 Cc 24.9 Alive, Not Injured

16
Table 2. Turtles caught on off-watch hauls or which were severely decomposed in the 2003 scallop dredge fishery. These turtles werenot included in the 2003 total bycatch estimate. Trip letters signify a unique trip.
Off-WatchBycatch Events
Trip Month Species Area Comments
A October Loggerhead Outside
B October Loggerhead HudsonCanyon CA
SeverelyDecomposedAnimals
C September Loggerhead(identified byskull)
HudsonCanyon CA
Turtle brought on board entangled in gillnetgear
C September Unknown HudsonCanyon CA
Turtle brought on board entangled in gillnetgear
C September Unknown HudsonCanyon CA
Turtle brought on board entangled in gillnetgear
C September Unknown HudsonCanyon CA
Turtle brought on board entangled in gillnetgear
C September Unknown HudsonCanyon CA
Turtle brought on board entangled in gillnetgear
C September Unknown HudsonCanyon CA
Turtle brought on board entangled in gillnetgear

17
Table 3: Categorical Variables Examined in an Analysis of Factors Affecting Sea Turtle Bycatchin 2003 Mid-Atlantic Scallop Dredge Fishery. Percentage of Observed Hauls in each category isalso shown.
Variable Definition (%Hauls) Sea Surface Temperature Thi: 22BC - 26.5BC (43%)
Tlo: 7.6BC - 21.9BC (57%)Season Spring: June (14%)
Summer: July-Oct (68%)Fall: November (18%)
Depth Shallow: 2-26 fm (25%)Mid-Depth: 27-31 fm (45%)Deep: 32-60fm (30%)
Latitude Zone 1: 37BN to 38.9BN (56%)2: 39BN (39%)3: 40BN (5%)
Inside/Outside ControlledAccess Areas
Inside (56%)Outside (44%)
Vessel Length Small: 42-77 ft (18%)Medium: 78-87 ft (45%)Large: 88-109 ft (37%)
Tow speed Slow: 2.9-4.3 knots (34%)Medium: 4.4-4.9 knots (54%)Fast: 5.0-6.2 knots (12%)
Presence/Absence of TicklerChains
0: No chains (17%)1: Chains (83%)
Presence/Absence of RockChains
0: No chains (47%)1: Chains (53%)
Number of Tickler ChainsUsed
1: 0 or 1 Chain (44%)2: 2 or 3 Chains (51%)3: 4 to 6 Chains (5%)
Number of Rock ChainsUsed
1: 0 Chains (47%)2: 1-3 Chains (44%)3: 4-11 Chains (9%)
Presence/Absence of aPressure Plate
0: No pressure plate (11%)1: Pressure plate (85)%9: Unknown (4%)
Frame Width of Dredge 10 ft (2%)11 ft (5%) 12 ft (1%)13 ft (38%)14 ft (16%)15 ft (36%)16 ft (2%)
18
Table 4. Frequency of observed versus commercial dredge hauls in the Mid-Atlantic scallopdredge fishery from June-November 2003.
Variable Definition ObservedHauls
VTR Hauls
Sea Surface Temperature Thi: 22BC - 26.5BC Tlo: 7.6BC - 21.9BC
(43%)(57%)
(40%)(60%)
Season Spring: June Summer: July-Oct Fall: November
(14%)(68%)(18%)
(19%)(65%)(16%)
Depth Shallow: 2-26 fm Mid-Depth: 27-31 fm Deep: 32-60fm
(25%)(45%)(30%)
(45%)(29%)(26%)
Inside/Outside ControlledAccess Areas
Inside=Hudson CanyonControlled Access AreaOutside=Mid-Atlantic excludingHudson Canyon Access Area
(56%)
(44%)
(15%)
(85%)
Vessel Length Small: 42-77 ft Medium: 78-87 ft Large: 88-109 ft
(18%)(45%)(37%)
(39%)(42%)(19%)
Frame Width of Dredge <10 ft10 ft 11 ft 12 ft 13 ft 14 ft 15 ft 16 ft
(0%)(2%)(5%)(1%)(38%)(16%)(36%)(2%)
(2%)(13%)(4%)(4%)(28%)(11%)(38%)(0%)
Length of Trip Short: <3 daysLong: >=3 days
(1%)(99%)
(5%)(95%)
Permit plan SC: Limited Access PermitSCG: General Category Scalloppermit
(99%)
(1%)
(96%)
(4%)
Quantity of Dredges per Haul 1 Dredge2 Dredges
(3%)(97%)
(15%)(85%)

19
Table 5: Analysis of Deviance Table for Turtle Bycatch Model Selection. * indicates significant variables affecting turtle bycatch
Model Df Deviance Residual Df Residual Deviance Pr(Chi) AIC
null model only 4919 276.84 278.84
null + temp* -1 -21.75 4918 255.08 0.000003 259.08
null + temp* + towspeed* -2 -9.68 4916 245.40 0.008 253.40
null + temp + speed + season -2 -4.27 4914 241.13 0.118 253.13
null + temp + speed + tickler chains used -2 -2.83 4914 242.56 0.242 254.13
null + temp + speed + latitude zone -2 -0.82 4914 244.06 0.514 254.29
null + temp + speed + pressure plate used -2 -2.29 4914 243.11 0.317 254.88
null + temp + speed + inside/outside cas -1 -0.22 4915 245.18 0.639 254.94
null + temp + speed + number of rock chains -1 -0.03 4915 245.37 0.856 255.04
null + temp + speed + number of ticklerchains
-1 -0.01 4915 245.39 0.942 255.08
null + temp + speed + frame width -1 -0.04 4915 245.36 0.844 255.13
null + temp + speed + depth -2 -2.17 4914 243.23 0.338 255.44
null + temp + speed + vessel length -2 -1.44 4914 243.96 0.486 255.97
null + temp + speed + rock chains used -2 -0.72 4914 244.67 0.696 256.43

20
Table 6: Total Bycatch Estimate of Turtles from June-November in the Mid-Atlantic Sea Scallop Dredge Fishery
WaterTemp
Predictedbycatch rate
TotalObservedDredgeHours
Total VTRDredgeHours
TotalObservedTrips
TotalVTRTrips
TotalBycatch
ObserverCoverage (%Dredge hrsobserved)
CV 95% CI
>=22BC 0.004271 4709.7 156749.8 31 1102 670 3.0% 30.0% 305-1058
<22BC 0.000335 5965.1 235699.6 40 1597 79 2.5% 66.8% 0-192
Totals 10674.8 392449.4 71 2699 749 2.7% 28.2%

21
Table 6a: Total Bycatch Estimate of Turtles from June-November in the Hudson Canyon Controlled Access Area and Outside this areain the Mid-Atlantic Sea Scallop Dredge Fishery
Area WaterTemp
Predictedbycatchrate
TotalObservedDredgeHours
Total VTRDredgeHours
TotalObservedTrips
TotalVTRTrips
TotalBycatch
ObserverCoverage(% Dredgehrsobserved)
CV 95% CI
Hudson Canyon
>=22BC 0.004271 3156.6 25725.8 17 112 110 12.3% 30.0% 50-174
<22BC 0.000335 2796.4 35569.5 17 122 12 7.8 % 66.8% 0-29
Total 5953.0 61295.3 34 234 122 9.7 % 28.2%
Outside
>=22BC 0.004271 1553.1 131024.0 14 990 560 1.2% 30.0% 255-884
<22BC 0.000335 3168.7 200130.1 23 1475 67 1.5% 66.8% 0-163
Total 4721.8 331154.1 37 2465 627 1.4% 28.2%
GrandTotal
10674.8 392449.4 71 2699 749 2.7%

22
Figure 1. Observed and Commercial Scallop Dredge Trips from June-November 2003 in the Mid-Atlantic Region.

23
Figure 2. Turtle Bycatch in the 2003 Mid-Atlantic Scallop Dredge Fishery.

24
Figure 3. Partial fit for the General Additive Model (GAM) of sea turtle bycatch with temperature as a covariate, showing therelationship estimated by a smoothing spline. Temperatures above 22BC have a positive influence on the bycatch rate. 95% confidencebands are also shown. All continuous variables in the GAM were categorized in a similar manner.

25
Figure 4. Observed Hauls where Sea Surface Temperature is greater or equal to 22BC in the 2003Scallop Dredge Fishery.


Procedures for Issuing Manuscriptsin the
Northeast Fisheries Science Center Reference Document (CRD) Series
Clearance: All manuscripts submitted for issuance asCRDs must have cleared the NEFSC 's manuscript/abstract/webpage review process. If any author is not a federalemployee, he/she will be required to sign an “NEFSC Re-lease-of-Copyright Form.” If your manuscript includesmaterial lifted from another work which has been copy-righted, then you will need to work with the NEFSC’s Edi-torial Office to arrange for permission to use that materialby securing release signatures on the “NEFSC Use-of- Copy-righted-Work Permission Form.”
Organization: Manuscripts must have an abstract and tableof contents, and — if applicable — lists of figures and tables.As much as possible, use traditional scientific manuscriptorganization for sections: “Introduction,” “Study Area”/”Experimental Apparatus,” “Methods,” “Results,” “Discus-sion” and/or “Conclusions,” “Acknowledgments,” and “Lit-erature/References Cited.”
Style: The CRD series is obligated to conform with thestyle contained in the current edition of the United StatesGovernment Printing Office Style Manual. That stylemanual is silent on many aspects of scientific manuscripts.The CRD series relies more on the CBE Style Manual.Manuscripts should be prepared to conform with these stylemanuals.
The CRD series uses the American Fisheries Society’sguides to names of fishes, mollusks, and decapod crusta-ceans, the Society for Marine Mammalogy’s guide to namesof marine mammals, the Biosciences Information Service’sguide to serial title abbreviations, and the International Stan-dardization Organization’s guide to statistical terms.
For in-text citation, use the name-date system. A spe-cial effort should be made to ensure that all necessary bib-liographic information is included in the list of cited works.Personal communications must include date, full name, andfull mailing address of the contact.
Preparation: Type a clean/neat, single-spaced version ofthe document. The document must be paginated continu-ously from beginning to end and must have a “Table ofContents.” Begin the preliminary pages of the document— always the “Table of Contents” — with page “iii.” Be-gin the body of the document — normally the “Introduc-tion” — with page “1,” and continuously paginate all pagesincluding tables, figures, appendices, and indices. You caninsert blank pages as appropriate throughout the document,but account for them in your pagination (e.g., if your lastfigure ends on an odd-numbered/right-hand page such as“75,” and if your next page is the first page of an appendix,then you would normally insert a blank page after the lastfigure, and paginate the first page of the appendix as “77”to make it begin on an odd-numbered/right-hand page also).Forward the final version to the Editorial Office as both apaper copy and electronically (i.e., e-mail attachment, 3.5-inch floppy disk, high-density zip disk, or CD). For pur-poses of publishing the CRD series only, the use of MicrosoftWord is preferable to the use of Corel WordPerfect.
Production and Distribution: The Editorial Office willdevelop the inside and outside front covers, the inside andoutside back covers, and the title and bibliographic controlpages (pages “i” and “ii”) of the document, then combinethose covers and preliminary pages with the text that youhave supplied. The document will then be issued online.
Paper copies of the four covers and two preliminarypages will be sent to the sole/senior NEFSC author shouldhe/she wish to prepare some paper copies of the overalldocument as well. The Editorial Office will only producethree paper copies (i.e., two copies for the NEFSC’s librar-ies and one copy for its own archives) of the overall docu-ment.
A number of organizations and individuals in theNortheast Region will be notified by e-mail of the avail-ability of the online version of the document. The sole/senior NEFSC author of the document will receive a list ofthose so notified.

Research Communications BranchNortheast Fisheries Science Center
National Marine Fisheries Service, NOAA166 Water St.
Woods Hole, MA 02543-1026
Publications and Reportsof the
Northeast Fisheries Science CenterThe mission of NOAA's National Marine Fisheries Service (NMFS) is "stewardship of living marine resources forthe benefit of the nation through their science-based conservation and management and promotion of the health oftheir environment." As the research arm of the NMFS's Northeast Region, the Northeast Fisheries Science Center(NEFSC) supports the NMFS mission by "conducting ecosystem-based research and assessments of living marineresources, with a focus on the Northeast Shelf, to promote the recovery and long-term sustainability of theseresources and to generate social and economic opportunities and benefits from their use." Results of NEFSCresearch are largely reported in primary scientific media (e.g., anonymously-peer-reviewed scientific journals).However, to assist itself in providing data, information, and advice to its constituents, the NEFSC occasionallyreleases its results in its own media. Currently, there are three such media:
NOAA Technical Memorandum NMFS-NE -- This series is issued irregularly. The series typically includes: data reports of long-term field or lab studies of important species or habitats; synthesis reports for important species or habitats; annual reports of overallassessment or monitoring programs; manuals describing program-wide surveying or experimental techniques; literature surveys ofimportant species or habitat topics; proceedings and collected papers of scientific meetings; and indexed and/or annotatedbibliographies. All issues receive internal scientific review and most issues receive technical and copy editing.
Northeast Fisheries Science Center Reference Document -- This series is issued irregularly. The series typically includes: datareports on field and lab studies; progress reports on experiments, monitoring, and assessments; background papers for, collectedabstracts of, and/or summary reports of scientific meetings; and simple bibliographies. Issues receive internal scientific review, butno technical or copy editing.
Resource Survey Report (formerly Fishermen's Report) -- This information report is a quick-turnaround report on the distributionand relative abundance of selected living marine resources as derived from each of the NEFSC's periodic research vessel surveysof the Northeast's continental shelf. There is no scientific review, nor any technical or copy editing, of this report.
OBTAINING A COPY: To obtain a copy of a NOAA Technical Memorandum NMFS-NE or a Northeast Fisheries Science CenterReference Document, or to subscribe to the Resource Survey Report, either contact the NEFSC Editorial Office (166 Water St.,Woods Hole, MA 02543-1026; 508-495-2228) or consult the NEFSC webpage on "Reports and Publications" (http://www.nefsc.noaa.gov/nefsc/publications/).
ANY USE OF TRADE OR BRAND NAMES IN ANY NEFSC PUBLICATION OR REPORT DOES NOT IMPLYENDORSEMENT.
MEDIA MAIL