by sibongile mkhize, godwin dube and caroline skinner · street vendors in durban, south africa by...
TRANSCRIPT

Street Vendors in Durban, South AfricaStreet Vendors in Durban, South Africaby Sibongile Mkhize, Godwin Dube and Caroline Skinner
December 2013
Durban
IEMS Informal EconomyMonitoring StudyIEMS Informal EconomyMonitoring Study
Informal Economy Monitoring Study: Street Vendors in Durban, South Africa Field research for this report was conducted in Durban between August - November 2012. The Durban Research Team consisted of: Sithabile Mngadi, Amanda Mthembu, Siphesihle Mubiru, and Phumzile Xulu.
AuthorsGodwin Dube is a social science researcher. He is currently a PhD candidate in the School of Built Environment and Development Studies at the University of KwaZulu-Natal, Durban.
Sibongile Mkhize is a social science researcher with over a decade of experience. She is currently a Specialist Researcher for the Commission on Traditional Leadership Disputes and Claims commissioned by Cooperative Governance and Traditional Affairs in KwaZulu-Natal.
Caroline Skinner is WIEGO’s Urban Policies Programme Director and a senior researcher at the African Centre for Cities.
MBO Co-ordinatorPhumzile Xulu has worked with Asiye eTafuleni as a Project Officer since February 2010 and is currently completing a Law degree through the University of South Africa. She began working with the Informal Sector through co-ordinating the World Class Cities for All (WCCA) campaign at StreetNet International.
AcknowledgementsThe authors would like to thank Asiye eTafuleni for their hard work in coordinating the study and providing the logistical and administrative support. In particular, we would like to thank the following individuals for their contributions in the realization of this report: Richard Dobson, Patrick Ndlovu, Phumzile Xulu, Zama Nkosi, Sithabile Mngadi, Siphesihle Mubiru, Amanda Mthembu, Menziwokuhle Mthethwa, Michael Rogan, Imraan Valodia, Melanie Samson and all the members of the Technical Advisory Team. We would also like to thank all the street vendors who generously shared their experiences with the researchers.
Publication date: December 2013
ISBN number: 978-92-95095-73-1
Published by Women in Informal Employment: Globalizing and Organizing (WIEGO). A Charitable Company Limited by Guarantee – Company No. 6273538, Registered Charity No. 1143510
WIEGO Secretariat WIEGO Limited Harvard University 521 Royal Exchange 79 John F. Kennedy Street Manchester M2 7EN Cambridge, MA 02138, USA United Kingdom
www.wiego.org
Copyright © WIEGO. This report can be replicated for educational, organizing and policy purposes as long as the source is acknowledged.
Full citation: Mkhize, Sibongile, Godwin Dube and Caroline Skinner. 2013. Informal Economy Monitoring Study: Street Vendors in Durban, South Africa. Manchester, UK: WIEGO.
Cover photograph by: Angela Buckland. Street vendor from Warwick Avenue, Durban.
Design by: Julian Luckham of Luckham Creative
About the Informal Economy Monitoring Study The Informal Economy Monitoring Study (IEMS) is a major, longitudinal study of the urban informal economy being undertaken initially at two points in time, 2012 and 2015, in 10 cities around the world: Accra, Ghana; Ahmedabad, India; Bangkok, Thailand; Belo Horizonte, Brazil; Bogota, Colombia; Durban, South Africa; Lahore, Pakistan; Lima, Peru; Nakuru, Kenya; and Pune, India. The study combines qualitative and quantitative research methods to provide an in-depth understanding of how three groups of urban informal workers – home-based workers, street vendors, and waste pickers – are affected by and respond to economic trends, urban policies and practices, value chain dynamics, and other economic and social forces. The IEMS will generate panel data on the urban informal economy.
In each city, a team of five researchers worked in collaboration with a local membership-based organization of informal workers from April 2012 to April 2013 to collect and analyze the first round of the data.
All city research reports, as well as sector reports (one each for home-based work, street vending and waste work), a global report, and other information on the study can be found at www.inclusivecities.org and www.wiego.org.


vStreet Vendors in Durban, South Africa
Table of Contents
Executive Summary 1Findings 1Policy Recommendations 2
Introduction 4Study Objectives 4Conceptual Framework 5Methodology and Sampling 5Research Partner Profile 7Summary of City and Sector 7
Part 1: Characteristics of Workers and Households 101.1 Characteristics of Individual Workers and Households 101.2 Characteristics of Individual Enterprises 121.3 Characteristics of the Sector/Value Chains 15
Part 2: Changes in the Sector 182.1 Driving Forces in the Sector 18 2.1.1 Macroeconomic Forces 18 2.1.2 City/Government Policies & Practices 19 2.1.3 Value Chain Dynamics 24 2.1.4 Other Forces 262.2 Intermediary Factors 27 2.2.1 Responses to Negative Driving Forces 27 2.2.2 Intermediary Institutions 29
Part 3: Linkages & Contributions of the Sector to the City 333.1 Linkages to Formal Sector 333.2 Policy Linkages to City/Urban Planning/Government 363.3 Contribution to the City 37
Part 4: Key Findings & Policy Implications 394.1 Key Findings 394.2 Policy Recommendations 40
References 43 Appendix 1: Profile of Durban Street Vendor Organizations 45 Appendix 2: Summary of Focus Group Interviews 47

vi IEMS Informal Economy Monitoring Study
List of TablesTable 1 - Basic Household Characteristics, by Sex 11Table 2 - Access to Other Types of Household Income, by Sex (%) 12Table 3 - Mean Turnover and Working Hours, by Sex and Location (%) 14Table 4 - Focus Group Findings by Product Sold, Value Addition and Sex 17Table 5 - Reported Problems with Product Markets and Competition 18Table 6 - Negative Forces Related to the City 19Table 7 - Reported Problems with Infrastructure and Institutional Obstacles, by Usual Location (%) 20Table 8 - Negative Forces Related to Value Chain Dynamics 25Table 9 - Positive Forces Related to Value Chain Dynamics 25Table 10 - Other Positive Driving Forces 26Table 11 - Further Positive Driving Forces 28Table 12 - Institutions Identified as Being “Unhelpful”, by Sex and Location (%) 30Table 13 - Institutions Identified as Being “Helpful”, by Sex and Location (%) 30Table 14 - Institutions Helping or Hindering Vendors, Frequency of Responses in Focus Groups 31Table 15 - Vendors’ Contribution to the City, Summary of Focus Group Findings 38Table 16 - Workplace Amenities by City (%) 39
List of Figures, Diagrams and ChartsFigure 1 - Age Range of Street Vendors 10Figure 2 - Education Levels by Sex (%) 11Figure 3 - Paid and Unpaid Employees over the Last Month (%) 13Figure 4 - Types of Goods Sold (%) 15Figure 5 - What Type of Work Do You Do? 16Figure 6 - Negative Forces Related to the City (Rankings) 19Figure 7 - How Rain and Sun Impact on Street Vendors 20Figure 8 - Access to Storage, Toilets and Water, by Location and Sex (%) 21Figure 9 - How Police Harassment Impacts on Street Vendors 22Figure 10 - The Impact of and Response to Lack of Access to Water and Electricity 29Figure 11 - Where Do You Buy Your Goods From, by Sex (%) 33Figure 12 - Main Customers, by Sex (%) 34Figure 13 - Diagram of Economic Linkages 35Figure 14 - Spatial Map of Economic Linkages 36Figure 15 - Causal Flow Diagram: Rent as a Negative Driving Force 37

1Street Vendors in Durban, South Africa
Executive SummaryThe Informal Economy Monitoring Study (IEMS) seeks to provide credible, grounded evidence of the range of driving forces, both positive and negative, that affect conditions of work in the informal economy over time in 10 cities. Three sectors are being explored: home-based work, street vending and waste picking. This report examines street vending in Durban, South Africa.
Both qualitative and quantitative methods are used in this study. The qualitative component consists of a participatory informal economy appraisal (PIEA), an innovative method designed to capture systematically the perceptions and understandings of 75 informal workers, in their own words, in a focus group setting. The quantitative component consists of a survey questionnaire administered to the focus group participants, plus another approximately 75 workers who did not participate in focus groups. The questionnaire is designed to supplement the data collected through the focus groups by collecting information on the household profile and income sources of the workers; the asset profile of the workers’ households; detailed information on the workers’ enterprises; and linkages between the informal economy and the formal economy. The Durban sample was comprised of women and men who trade in the Central Business District, but also in outlying areas. The fieldwork was done between August and November, 2012.
FindingsThe findings on household characteristics suggest that profits from vending are a key source of household income. Six in every 10 respondents reported that their informal enterprise was the main source of household income while one in every two vendors had no other income earner in the household. The average household size was between four and five people.
The research reveals that vendors provide a huge diversity of goods and services. Vendors are linked into the formal economy – both because many source their goods through formal economy channels, and some sell their goods to formal enterprises. Vendors also generate employment, with 3 in 10 respondents reporting they had at least one paid employee working for them.
The research suggests that turnovers are low – the average vendor in this sample reported a monthly turnover1 of R2712 (about US $3252). There was a significant difference between men and women, with male vendors reporting a turnover that was more than double their female counterparts.
Vendors seem to be operating in an increasingly difficult economic environment. The majority of respondents reported a decline in demand for their products and services but also an increase in the cost of supplies. They had largely absorbed these increases, saying they were not able to charge higher prices. Further fully 90 per cent of survey respondents reported they were experiencing increasing competition from new entrants, who started vending due to being unemployed. Vendors also reported an increase in competition from formal retailers. All these combined economic and value chain dynamics cause vendors to say that it is increasingly difficult to keep their enterprises viable.
Access to essential basic and work-related infrastructure was identified as a critical problem – 56 per cent of vendors surveyed did not have access to a toilet while 21 per cent did not have running water. The situation is worse in the city centre than in the outlying areas. Three quarters of the vendors interviewed have no shelter while working so are exposed to rain, sun and wind, while nearly half of the vendors surveyed did not have access to storage. The focus group data shows that when vendors do have access to storage, their goods are often stolen or spoilt while in storage. When these findings are compared to the other four IEMS cities where vendors were also interviewed – Accra, Ahmedabad, Lima and Nakuru – Durban vendors have comparatively poor access to basic amenities. Access to infrastructure was identified as the major issue hindering vendor businesses, cited by 14 of the 15 focus groups.
Police harassment of vendors was reported to be pervasive. Three in every four vendors operating in the periphery and one in every two operating in the centre reported being harassed by the police. The second most serious negative driving force cited by the focus groups (after poor infrastructure)
1 Turnover figures represent the respondents’ reported average monthly income less reported average monthly expenditure on business expenses. However, the literature on income reveals it is very difficult to capture distinctions between turnover, gross earnings, and net earnings reliably. These data should be interpreted with caution.
2 1 South African Rand (ZAR) was equivalent to US $0.12 on September 15, 2012 (www.xe.com, mid-market rate). All conver-sions in the document use this rate.

2 IEMS Informal Economy Monitoring Study
was the police. More than half (53 per cent) of vendors surveyed in Durban identified confiscation of property as an important problem, more than any other city in the IEMS (the average was 32 per cent across the five cities). When goods are confiscated, vendors reported that at best their goods are damaged –at worst, they are never returned at all. Vendors also noted that the fines charged are often very onerous but vary from one officer to the next.
National and local government are regarded by the vast majority of vendors as being unhelpful to vending activities. The findings suggest that for many street vendors, the only interaction they have with local government is through harassment and fines at the hands of the police. In the focus groups interviews, the police, the municipality in general, and the Business Support Unit (BSU) in particular were identified as institutions hindering their work. Only two vendors, of the 150 surveyed, reported that they had received help from any level of government.
The study interrogated the role of intermediaries, especially vendor organizations and non-governmental organizations (NGOs). The findings suggest that while there is solidarity among vendors, their organizations are weak. NGOs, however, were identified as playing a positive role.
The study concluded by exploring the vendors’ views on their contribution to the city. Vendors said they help reduce crime and keep the city clean. They bring goods close to customers and sell goods at low prices. In an interview, the City Manager stated that the municipality collects R36 million per annum from licensing fees, suggesting this group also makes a significant contribution to city coffers.
In summary the study found that street vendors have been negatively affected by a harsh economic environment, lack of access to both basic amenities and the infrastructure necessary to do business, and a largely hostile state. Although membership-based organizations (MBOs) and NGOs are active among street vendors in Durban, they have only partially ameliorated these negative forces.
Policy Recommendations There are 10 recommendations that stem from this study’s findings.
1. Stop police harassment: Police actions are inappropriate for the regulation of economic activity at best, and corrupt at worst. The City Council needs to investigate the conduct of the police and, in parallel with suggestions outlined below, conduct a retraining program.
2. Draft new bylaws: Durban’s Street Trading bylaws (which were promulgated in 1995) criminalize vending. The penalty in the case of violation is confiscation of goods and/or a fine or imprisonment. The study shows confiscation of goods has devastating implications for vendor livelihoods and the households which are dependent on income from street vending. Focus group participants especially reported difficulties paying school fees because of the costs of confiscations, both in terms of stock lost and in terms of the high interest rates they have to pay when borrowing from informal money lenders to replace the lost stock. This is an inappropriate sanction for economic activities. A bylaw redrafting process is well overdue.
3. Review the permitting system: While the municipality reports having issued many thousands of permits, vendors involved in this study argued more permits were needed. It is suggested that the municipal staff work with vendors, area by area, to assess the available public space and together determine a vendor “carrying capacity”, then issue the appropriate number of permits. Vendors feel the requirement that the permit holder needs to be at his or her stall at all times should be removed. They also want the permit application and renewal process streamlined. One focus group suggested that permit monies be specifically earmarked for investment back into the vending sector.
4. Provision of basic amenities and work related infrastructure: The high proportion of vendors who do not have access to toilets and running water is a concern for the health and well-being of vendors and consumers but also the general public. Through an area-based assessment, priority areas where the city needs to provide these facilities should be identified. Shelter from the elements and storage for trading goods are key to the productivity of vendors but also to better functioning and aesthetically pleasing urban environments. Provision of these services should be a priority. Where resources are limited, the municipality should consider community-public-private partnerships.

3Street Vendors in Durban, South Africa
5. Improve council–vendor relations through regular meetings: Vendors specifically stated they wanted to meet with the municipal staff more regularly to proactively deal with issues. Although the municipal officials engage with vendors via the eThekwini Municipality Informal Economy Forum (EMIEF), many vendors point out that the leaders who attend do not represent the majority of vendors (and some even question whether they represent any traders at all). Officials need to hold regular meetings, not only with vendor leaders but also with the broader trading community.
6. Provide business support and training: A large majority of vendors surveyed identified poor access to support centres as a problem. There are existing support services – most notably the Small Enterprise Development Agencies supported by both the eThekwini Municipality and the national Department of Trade and Industry. These support centres need to develop programmes that specifically target the vending population.
The lack of relevant training in business skills was identified as a problem by 66 per cent of vendors surveyed. One group identified having no marketing strategy as their primary problem. The city and/or NGOs working in the sector should consider working with the Department of Labour in general and the Wholesale and Retail Sector Education and Training Association (WRSETA) in particular to design and implement appropriate training for street vendors.
7. Develop trade specific strategies: Street vendors are one point in a continuum of economic activities, with vendors selling different goods operating in different value chains. Understanding where vendors fit into broader value chain dynamics holds the key to more viable and vibrant trading. Building on previous work with, for example, traditional medicine traders and card collectors, municipal staff should develop sector-based strategies for dominant trades.
8. Strengthen vendor organizations: The capacity of MBOs to organize and assist their members needs to be stronger. The study findings suggest that attention should be paid to strengthening internal democratic processes. Both membership and leadership might gain from capacity building programmes (including negotiation and conflict resolution skills). Although interviews with MBO leaders identified negotiating with suppliers and facilitating bulk buying as one of their activities, vendors who participated in the study did not make mention of this. This aspect of the MBOs’ work could be strengthened.
9. Address tensions among foreign and South African vendors: The study unsurprisingly reveals tensions between foreigners (suppliers and vendors) and South African vendors. Local government officials and NGOs working in the sector should consider relationship building interventions.
10. Consider national policy and legislative review: This study of Durban street vendors gives detail to the challenges faced by street vendors in many South African cities and adds impetus to the call for a national policy and legislative review. There is useful international precedent in this regard. Most notably, India’s 2004 National Street Vending Policy has recently become law.

4 IEMS Informal Economy Monitoring Study
IntroductionIt is now widely recognized that the majority of workers in the developing world earn their livelihoods in the informal economy. Advancements in official statistics show that informal employment accounts for more than half of total non-agricultural employment in most regions, and as much as 82 per cent in South Asia and 80 per cent in many sub-Saharan African countries (WIEGO website 2013). Though many studies offer theories to explain the persistence, characteristics and growth of informal employment, few have evaluated the grounded realities of work in the informal economy – and none have done so over time and across a sufficiently large number of sectors and cities. The Informal Economy Monitoring Study (IEMS) seeks to fill this gap.
The IEMS study used both qualitative (i.e. participatory focus group methodology) and quantitative methods (survey questionnaire) to gather data on the impact of three major driving forces on street vending in Durban. These driving forces are the macroeconomic environment, institutions (e.g. government institutions and informal workers’ organizations) and value chain dynamics. This study, which focused only on those street vendors who were members of membership-based organizations (MBOs), sought to establish the extent to which various regulations and institutions helped or hindered the street vendors in their work. The study also looked at the extent of the linkages between street vendors and firms in the formal sector.
The field work for the Durban study was conducted between August and November 2012. A total of 149 street vendors were interviewed; 75 of these also participated in focus groups discussions. The interviews and focus groups were conducted at the premises of the IEMS research partner, Asiye eTafuleni (AeT).3
The results detail how street vendors have been negatively affected by the difficult economic environment (characterized by increased competition in the sourcing and selling of goods), lack of access to basic and vendor related infrastructure, and a largely hostile state. The impact of these forces has not been the same for female and male vendors – the study shows that women seem to have borne the brunt of these forces. The results indicate that not only do male respondents earn more (on average) than female respondents, but also tend to have employees/assistants and therefore have better support when unable to work. There were also differences in the products sold by women and men, with more men selling goods and services that command higher profits compared to the low margin products sold by women.
Study Objectives The objective of the study is to provide credible, grounded evidence of the range of driving forces, both positive and negative, that affect conditions of work in the informal economy over time. The study places informal workers and their organizations at the centre of the analysis, examining not only the impact of these forces but also informal workers’ strategic responses to them. It is based on a collaborative approach between researchers and membership-based organizations (MBOs) of informal workers to monitor, on an on-going basis, the state of the working poor in three sectors – home-based work, street vending, and waste picking – and also to build the capacity of MBOs to assess and mediate the driving forces that affect their work.
3 AeT is an non-profit organization supporting street vendors. They work very closely with MBOs of street vendors.

5Street Vendors in Durban, South Africa
The study is based in 10 cities, as follows:
Sector(s) Local Partner
Africa
Accra, Ghana Street Vending Institute of Statistical, Social and Economic Research (ISSER) and StreetNet Ghana Alliance
Durban, South Africa Street Vending, Waste Picking
Asiye eTafuleni (AeT)
Nakuru, Kenya Street Vending, Waste Picking
Kenya National Alliance of Street Vendors and Informal Traders (KENASVIT)
Asia
Ahmedabad, India Home-Based Work, Street Vending
Self-Employed Women’s Association (SEWA)
Bangkok, Thailand Home-Based Work HomeNet ThailandLahore, Pakistan Home-Based Work HomeNet PakistanPune, India Waste Picking Kagad Kach Patra Kashtakari Panchayat (KKPKP)
Latin America
Belo Horizonte, Brazil Waste Picking Instituto Nenuca de Desenvolvimento Sustentável de Belo Horizonte
Bogota, Colombia Waste Picking Asociación de Recicladores de Bogotá (ARB)Lima, Peru Street Vending Federación Departamental de Vendedores
Ambulantes de Lima y Callao (FEDEVAL)
Conceptual FrameworkIn the IEMS, the term “driving forces” is used to refer to systemic factors that may impact, in either positive or negative ways, the occupations or livelihoods of urban informal workers. Three categories of driving forces anchor the study. First, the IEMS explores the economy as a driving force: that is, the macroeconomic conditions such as inflation, recession, and patterns of growth that may influence working conditions in the informal economy. Second, the IEMS examines government policies and practice, specifically, but not exclusively, at the city level, including urban planning and policies, zoning regulations, sector-specific policies, regulatory norms, and urban infrastructure and service delivery. Third, the IEMS considers sector-specific value chain dynamics, including the power relations between informal workers and their suppliers and buyers, and the role of intermediaries in the value chain. The framework also allows for the identification of other driving forces, such as migration, that may have a significant impact on working conditions in a particular sector or city.
The IEMS assumes that the impact of these driving forces is mediated by institutions and actors related to the particular sector under study in each city. The study examines a range of institutions including government institutions, civil society organizations, and, fundamentally, MBOs of informal workers. It explores the responses of informal workers to key driving forces in each city, as well as the economic, political, and spatial linkages within each sector. Finally, through its sampling design, the study allows for comparisons at the individual level by sex (in cities in which both men and women belong to the partner MBO), employment status, and location of the workplace.
Methodology and SamplingThe IEMS is based on both qualitative and quantitative methods. The qualitative component consists of a participatory informal economy appraisal (PIEA), an innovative method designed to capture systematically the perceptions and understandings of informal workers in their own words, in a
6 IEMS Informal Economy Monitoring Study
focus group setting.4 Each city team conducted 15 focus groups (per sector), in which nine tools – organized around the themes of sector characteristics, driving forces and responses, the institutional environment, and contributions of the sector to the city – were used to generate data related to the conceptual framework. The results of the focus groups were recorded in reports of about 12 pages, on average, immediately after each focus group was conducted, and those reports were then analyzed.
The quantitative component consisted of a survey questionnaire administered to 75 focus group participants per sector, plus another 75 workers in each city-sector. Thus an overall sample size of about 150 was achieved (with minor variation in the sample size in some cities/sectors). The questionnaire is designed to supplement the data collected through the focus groups by collecting information on the household profile and income sources of the workers; the assets profile of the workers’ households; detailed information on the enterprise or occupation of the workers; and linkages between the informal economy and the formal economy. The questionnaires were administered using a data-capture tool. It took approximately 90 minutes for each respondent to complete the questionnaire.
Collectively, the focus groups and questionnaires provide data on the context within which informal workers earn their livelihoods, and the forces that impact, both positively and negatively, on workers’ incomes and working conditions. We are also able to understand how workers adapt their work strategies in the face of these economic, social and institutional forces.
The sampling approach was designed to maintain comparability in the results across the 13 city-sectors, on the one hand, and to allow some flexibility as demanded by local circumstances, on the other hand. To the maximum extent possible, the following principles were followed in every city-sector:
• Only MBO members were included in the sample.5
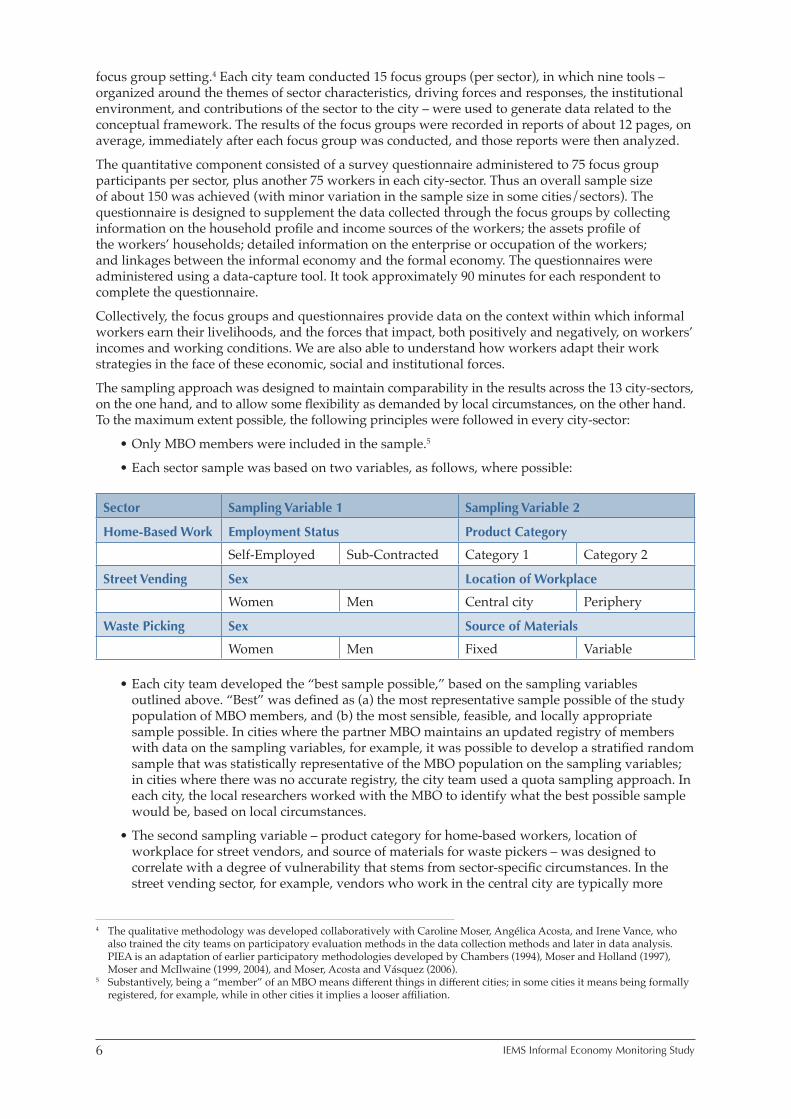
• Each sector sample was based on two variables, as follows, where possible:
Sector Sampling Variable 1 Sampling Variable 2
Home-Based Work Employment Status Product Category
Self-Employed Sub-Contracted Category 1 Category 2
Street Vending Sex Location of Workplace
Women Men Central city Periphery
Waste Picking Sex Source of Materials
Women Men Fixed Variable
• Each city team developed the “best sample possible,” based on the sampling variables outlined above. “Best” was defined as (a) the most representative sample possible of the study population of MBO members, and (b) the most sensible, feasible, and locally appropriate sample possible. In cities where the partner MBO maintains an updated registry of members with data on the sampling variables, for example, it was possible to develop a stratified random sample that was statistically representative of the MBO population on the sampling variables; in cities where there was no accurate registry, the city team used a quota sampling approach. In each city, the local researchers worked with the MBO to identify what the best possible sample would be, based on local circumstances.
• The second sampling variable – product category for home-based workers, location of workplace for street vendors, and source of materials for waste pickers – was designed to correlate with a degree of vulnerability that stems from sector-specific circumstances. In the street vending sector, for example, vendors who work in the central city are typically more
4 The qualitative methodology was developed collaboratively with Caroline Moser, Angélica Acosta, and Irene Vance, who also trained the city teams on participatory evaluation methods in the data collection methods and later in data analysis. PIEA is an adaptation of earlier participatory methodologies developed by Chambers (1994), Moser and Holland (1997), Moser and McIlwaine (1999, 2004), and Moser, Acosta and Vásquez (2006).
5 Substantively, being a “member” of an MBO means different things in different cities; in some cities it means being formally registered, for example, while in other cities it implies a looser affiliation.

7Street Vendors in Durban, South Africa
vulnerable to evictions than those who work in the periphery. Each city team identified the best way to operationalize this variable according to local circumstances.
The implementation of the sampling design for the survey component of the Durban study deviated slightly from the plan for both location and sex variables. For street vendors, a total of 115 women (i.e. 77 per cent of respondents) instead of 105 were sampled. This resulted in the undersampling of men with a sample of 34 male respondents representing 23 per cent of the total instead of 30 per cent as per sampling plan. Of the 149 participants, 114 respondents were from the city centre (20 men and 94 women) and 35 respondents were from the periphery (14 men and 21 women).
The participants were selected by the research partner AeT. Of the 149 street vendors who were interviewed as part of the quantitative survey, 75 of them also participated in focus groups. Appendix 2 contains a summary profile of the participants of the focus group discussions. It is important to note that given that all the street vendors that participated in this study were members of MBOs. This sample is not representative of street vendors in Durban – MBO members are likely to be older and more established vendors. The fact that the final sample was made up of MBO members who were willing to participate (i.e. MBO members were not selected randomly) is also a potential source of bias.
Research Partner Profile Asiye eTafuleni (AeT) (meaning “bring it to the table” in Zulu), is a non-profit organization which champions inclusive urban planning and design for the informal economy. AeT provides technical expertise to assist vendors and other informal workers to acquire skills and understanding of urban development processes. The NGO also serves as a “learning hub” for those interested in urban planning and the informal economy. The overall objective of AeT is to provide comprehensive design and facilitation services to membership-based organizations (MBOs) of the urban working poor (particularly women) to encourage unique partnerships that result in appropriate and enabling urban infrastructure. It is intended that this objective will legitimize the informal economy and result in contextually responsive urban planning that secures urban livelihoods.
AeT was born out of the on-going involvement of local authority officials, academics, urbanists and activists in the Warwick Junction Project,6 an informal market complex at the heart of Durban, South Africa. The organization was co-founded by Richard Dobson and Patrick Ndlovu in 2008. Both Dobson and Ndlovu were involved in this innovative, award winning initiative for over 10 years; Dobson eventually leading the inner city programme. Largely because of this engagement, as well as an improved level of organizing amongst the informal vendors in Warwick Junction through the project, vendors were able to participate more actively and on more equitable terms in consultation processes with city officials.
AeT’s office is located in Warwick Junction, the primary transport node of Durban’s inner city. AeT enables access to technical support for local government officials, vendor organization leaders and their members, who are grappling with how to integrate the working poor into urban plans. Over time, the lessons learnt will be disseminated and the Warwick Junction demonstration sites appropriately replicated in other national and African centres.7
Unlike other partners in the IEMS study, AeT is not an MBO but provides support to MBOs. AeT is an Inclusive Cities Project partner and has worked with other MBOs, NGOs and vendor committees in Durban to conduct the field research for the Durban component of the IEMS study. For more information on the MBOs, please see Appendix 1.
Summary of City and Sector8
The east coast city of Durban is South Africa’s third largest city. According to the 2007 Community Survey (Stats SA 2007:12), eThekwini municipality had a population of 3,486,086 people. It is a commercial and transport hub (it also has the busiest port in Africa). The municipal authority of Durban was renamed the eThekwini Municipality in 2000.
6 For further information about the Warwick Junction Project see Dobson and Skinner (2009). 7 The organization has developed a blog site, www.aet.org.za, an interactive platform where you can learn more about the
projects AeT is doing, ask questions and share your insights about the informal sector.8 This section draws from Rogan (2012).
8 IEMS Informal Economy Monitoring Study
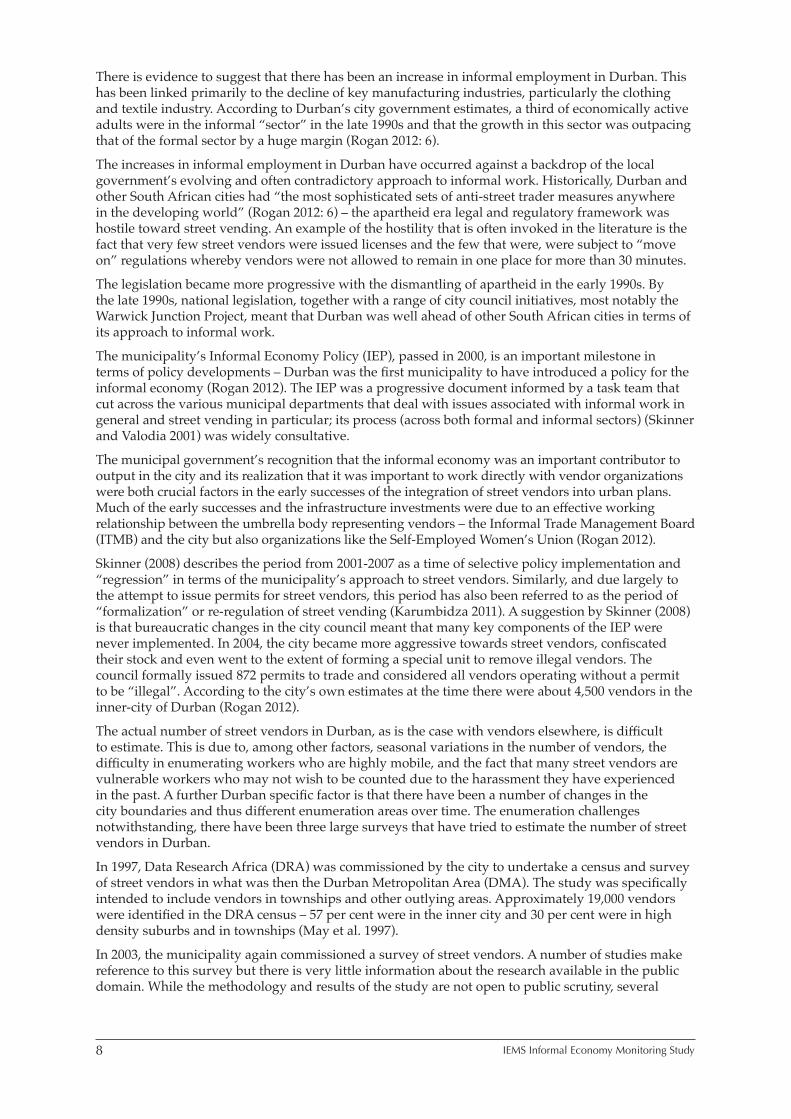
There is evidence to suggest that there has been an increase in informal employment in Durban. This has been linked primarily to the decline of key manufacturing industries, particularly the clothing and textile industry. According to Durban’s city government estimates, a third of economically active adults were in the informal “sector” in the late 1990s and that the growth in this sector was outpacing that of the formal sector by a huge margin (Rogan 2012: 6).
The increases in informal employment in Durban have occurred against a backdrop of the local government’s evolving and often contradictory approach to informal work. Historically, Durban and other South African cities had “the most sophisticated sets of anti-street trader measures anywhere in the developing world” (Rogan 2012: 6) – the apartheid era legal and regulatory framework was hostile toward street vending. An example of the hostility that is often invoked in the literature is the fact that very few street vendors were issued licenses and the few that were, were subject to “move on” regulations whereby vendors were not allowed to remain in one place for more than 30 minutes.
The legislation became more progressive with the dismantling of apartheid in the early 1990s. By the late 1990s, national legislation, together with a range of city council initiatives, most notably the Warwick Junction Project, meant that Durban was well ahead of other South African cities in terms of its approach to informal work.
The municipality’s Informal Economy Policy (IEP), passed in 2000, is an important milestone in terms of policy developments – Durban was the first municipality to have introduced a policy for the informal economy (Rogan 2012). The IEP was a progressive document informed by a task team that cut across the various municipal departments that deal with issues associated with informal work in general and street vending in particular; its process (across both formal and informal sectors) (Skinner and Valodia 2001) was widely consultative.
The municipal government’s recognition that the informal economy was an important contributor to output in the city and its realization that it was important to work directly with vendor organizations were both crucial factors in the early successes of the integration of street vendors into urban plans. Much of the early successes and the infrastructure investments were due to an effective working relationship between the umbrella body representing vendors – the Informal Trade Management Board (ITMB) and the city but also organizations like the Self-Employed Women’s Union (Rogan 2012).
Skinner (2008) describes the period from 2001-2007 as a time of selective policy implementation and “regression” in terms of the municipality’s approach to street vendors. Similarly, and due largely to the attempt to issue permits for street vendors, this period has also been referred to as the period of “formalization” or re-regulation of street vending (Karumbidza 2011). A suggestion by Skinner (2008) is that bureaucratic changes in the city council meant that many key components of the IEP were never implemented. In 2004, the city became more aggressive towards street vendors, confiscated their stock and even went to the extent of forming a special unit to remove illegal vendors. The council formally issued 872 permits to trade and considered all vendors operating without a permit to be “illegal”. According to the city’s own estimates at the time there were about 4,500 vendors in the inner-city of Durban (Rogan 2012).
The actual number of street vendors in Durban, as is the case with vendors elsewhere, is difficult to estimate. This is due to, among other factors, seasonal variations in the number of vendors, the difficulty in enumerating workers who are highly mobile, and the fact that many street vendors are vulnerable workers who may not wish to be counted due to the harassment they have experienced in the past. A further Durban specific factor is that there have been a number of changes in the city boundaries and thus different enumeration areas over time. The enumeration challenges notwithstanding, there have been three large surveys that have tried to estimate the number of street vendors in Durban.
In 1997, Data Research Africa (DRA) was commissioned by the city to undertake a census and survey of street vendors in what was then the Durban Metropolitan Area (DMA). The study was specifically intended to include vendors in townships and other outlying areas. Approximately 19,000 vendors were identified in the DRA census – 57 per cent were in the inner city and 30 per cent were in high density suburbs and in townships (May et al. 1997).
In 2003, the municipality again commissioned a survey of street vendors. A number of studies make reference to this survey but there is very little information about the research available in the public domain. While the methodology and results of the study are not open to public scrutiny, several

9Street Vendors in Durban, South Africa
findings have been cited in the literature. For example, the study is reported to have captured data on 4,705 vendors and, according to figures based on the research, the number of street vendors in the DMA was estimated to be approximately 50,000 (Rogan 2012). Roughly 40 per cent of vendors were interviewed in the inner-city and the rest were identified in outlying areas.
A more recent census and survey of street vendors was commissioned by StreetNet International in 2010. The census was conducted by Reform Development Consulting in three distinct counts (in order to account for seasonal variability) and the differences in each of the counts reflect the inherent difficulty in enumerating street vendors. The first count yielded a weighted estimate of 35,385 vendors in the greater municipal area. A second count resulted in a far lower number of vendors – only 26,292. A third and final count, however, produced a weighted estimate of 87,541 vendors. The researchers then simply averaged these three estimates to arrive at a final figure of 49,739 street vendors (Reform Development Consulting 2010). The great majority (94 per cent) of vendors from the StreetNet survey are classified as African/black. While this is not surprising given the racial distribution of the workforce and of South Africa more generally, the fact is black Africans are, however, still over-represented among Durban street vendors in terms of their share of the overall population (which is 75 per cent of the total South African population according to the 2011 Census).
Part of this study assessed the nature of trader organizations in Durban. Appendix 1 contains detailed information on the MBOs that participants are part of. This information was drawn from interviews conducted with the leaders of the six predominant vendor organizations in the city. Two organizations cited high membership numbers – the Informal Trade Management Board said they had 2,000 members while Masibambisane Traders Organisation (MATO) said they had 3,000. In the case of ITMB, members pay a one-time commitment fee, suggesting that vendors simply need to sign up and then are considered members for life. Masibambisane does require members to pay a monthly membership fee. However, they were unable to report how many members were up to date with their subscriptions. The other organizations reported smaller membership numbers: South African Informal Workers Association (SAIWA), which operates only in the Warwick Junction area, has 478 members; South African Self Employed Women’s Association (SASEWA) reported 400 members; Traders Against Crime (TAC) reported 50 members; and Early Morning Market Traders Association (EMMTA) reported only 14 members. These MBO profiles suggest that many Durban vendors are not actively part of organizations but also that existing organizations have fairly weak internal structures. For example, none of the organizations reported having regular elections. According to AeT staff, who have many years of experience working with street vendors, the predominant form of organizing in street vending in Durban is street committees. A group of traders in a particular area or street will elect leaders, who will represent them. In most streets and areas the election only happens once. Leaders thus hold the position for life. These individuals are often reluctant to relinquish power and to elect new leaders. The Herb Market Committee in the Warwick Junction area is the only committee known to hold regular elections which are monitored by the city.
A recent significant initiative by the municipality has been the decision to merge the department responsible for street vendors – Business Support Unit (BSU) – with the wholesale fresh produce market to form the Business Support and Marketing Unit (BS&MU). As outlined in an interview with a manager from BS&MU (see Rogan 2012: 39) the goal was to improve access to wholesale prices and to remove some of the barriers to purchasing in bulk. It was hoped that as a result of this merger, vendors would work together, form partnerships and develop spin-off enterprises. The city estimates 26 per cent of the market’s sales go to informal vendors. The interviewee argued that informal vendors have continued to compete directly with a number of larger buyers (private purchasing agents). This is largely due to the fact that they operate as individual enterprises and are thus not able to place orders that are large enough to secure discount prices. However little evidence exists to suggest that the council has done much to encourage collective action by street vendors in the purchasing of stock.
An additional important institutional issue is that enforcement of the city’s street vendor regulations is done by the hawker unit which is part of BS&MU. The same unit within the municipality is therefore responsible for raising revenues (through the permit system), enforcement of municipal regulations, and providing vendors with support (Rogan 2012: 38).

10 IEMS Informal Economy Monitoring Study
Part 1: Characteristics of Workers and Households This section presents the results on the characteristics of individual street vendors, their households, their enterprises and the value chain dynamics. The results, which integrate the findings from both the qualitative and quantitative aspects of the study, are disaggregated by the sex of the respondent.
1.1: Characteristics of Individual Workers and HouseholdsThe average age of the street vendors interviewed in the quantitative survey was 45 and the ages ranged from 19 to 74. As shown in figure 1, 83 per cent of all the street vendors were between the ages of 30 and 59. It is important to note that the average age of the participants in this survey was much higher than the average age that was reported in StreetNet census. However, direct comparisons cannot be made between this study and the StreetNet census due to differences in sampling.9
Figure 1 - Age Range of Street Vendors
70-74
65-69
60-64
55-59
50-54
45-49
40-44
35-39
30-34
25-29
20-24
<20
0 5 10 15 20
1.3%
4.0%
3.4%
12.1%
14.1%
12.1%
14.1%
19.5%
11.4%
5.4%
2.0%
0.7%
Source: Durban IEMS survey data (2012), n=149
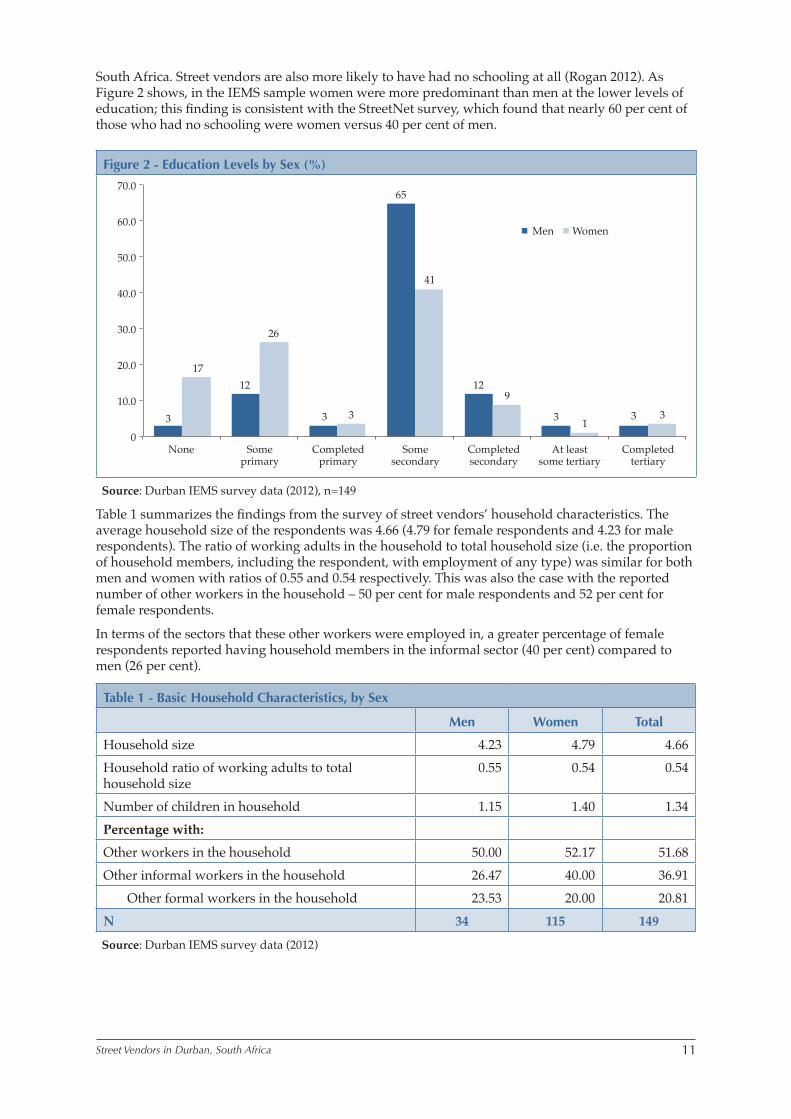
Male vendors in this sample tend to be far better educated than women vendors. As shown in figure 2, 97 per cent of male respondents had received some level of education compared to 83 per cent for women. A much smaller percentage of respondents had obtained some form of post-secondary education (6 per cent for men and 4 per cent for women).
Results from the StreetNet survey indicate that Durban’s “street vendors have lower levels of education compared with the overall adult population more generally and the South African workforce, in particular” (Rogan 2012: 12). From the StreetNet survey, 8 per cent of the sample had no schooling, 25 per cent only had completed primary school, 64 per cent had a secondary level of education and only 3 per cent had some type of post-secondary education (Reform Development Consulting 2010). Rogan (2013: 12), who used weighted estimates from the 2010 Quarterly Labour Force Survey (QLFS), found that “6.7 per cent of adult South Africans (and 3.3 per cent of the employed) have had no schooling, about 17 per cent of the population has only a primary school education (13.6 per cent of the employed) and 10.5 per cent have attended a tertiary institution”. The results from both the IEMS and StreetNet survey therefore suggest that street vendors tend to have lower levels of education, on average, than both the adult population and the workforce in
9 The street vendors that participated in this study were members of MBOs who were not selected randomly. Therefore, they are neither a representative sample of street vendors in Durban nor are they a representative sample of the MBOs they were drawn from.
11Street Vendors in Durban, South Africa
South Africa. Street vendors are also more likely to have had no schooling at all (Rogan 2012). As Figure 2 shows, in the IEMS sample women were more predominant than men at the lower levels of education; this finding is consistent with the StreetNet survey, which found that nearly 60 per cent of those who had no schooling were women versus 40 per cent of men.
Figure 2 - Education Levels by Sex (%)
70.0
60.0
50.0
40.0
30.0
20.0
10.0
0 None Some Completed Some Completed At least Completed primary primary secondary secondary some tertiary tertiary
Men Women
3
1712
26
3 3
65
41
129
3 13 3
Source: Durban IEMS survey data (2012), n=149
Table 1 summarizes the findings from the survey of street vendors’ household characteristics. The average household size of the respondents was 4.66 (4.79 for female respondents and 4.23 for male respondents). The ratio of working adults in the household to total household size (i.e. the proportion of household members, including the respondent, with employment of any type) was similar for both men and women with ratios of 0.55 and 0.54 respectively. This was also the case with the reported number of other workers in the household – 50 per cent for male respondents and 52 per cent for female respondents.
In terms of the sectors that these other workers were employed in, a greater percentage of female respondents reported having household members in the informal sector (40 per cent) compared to men (26 per cent).
Table 1 - Basic Household Characteristics, by Sex
Men Women Total
Household size 4.23 4.79 4.66Household ratio of working adults to total household size
0.55 0.54 0.54
Number of children in household 1.15 1.40 1.34Percentage with:
Other workers in the household 50.00 52.17 51.68Other informal workers in the household 26.47 40.00 36.91
Other formal workers in the household 23.53 20.00 20.81N 34 115 149
Source: Durban IEMS survey data (2012)

12 IEMS Informal Economy Monitoring Study
Women reported having more children in the household (1.40) on average, compared to men (1.15). Female respondents also reported having more working age adults, on average, in their households than male respondents – the numbers reported were 3.12 and 2.82 respectively. However, in spite of having more working age adults in their households, the number of dependents (i.e. members of the household that were unemployed) was higher for female respondents – 4.32 for women and 3.81 for men. The number of pensioners (0.15 for men and 0.13 for women) and the number of household members who had completed high school (0.74 for men and 0.72 for women) was similar for both sexes.
Respondents were asked about the main source of household income. The majority of respondents (59 per cent) reported this to be their own informal enterprise. There was, however, a significant difference between male and female vendors: 82 per cent of men reported their own enterprise as the primary source of income in contrast to only 53 per cent of women.
South Africa has an extensive cash transfer system. The child support grant, introduced in 1998, is awarded to caregivers of poor children. The old age pension (which was primarily intended for a section of the population during apartheid) was extended (in terms of coverage and benefits) after 1994. There is clearly a high dependency on these state grants, particularly in female vendors’ households. Among those interviewed, 36 per cent of women (but only 12 per cent of men) cited social assistance from the state (pensions and grants) as their primary source of household income. Interestingly very few respondents (3 per cent of the men and 4 per cent of the women) reported that formal sector work was the primary source of household income.
Respondents were asked what other types of household income they had access to. Unsurprisingly cash transfers were by far the most common source of other household income received by both female and male respondents (72 per cent and 38 per cent respectively). Table 2 shows the extent to which cash transfers support these households.
Table 2 - Access to Other Types of Household Income, by Sex (%)
Men Women Total
Government grants 38.24 72.17 64.43Pension 26.47 20.87 22.15Child maintenance 5.88 4.35 4.70Remittances 2.94 5.22 4.70Unemployment payout 2.94 1.74 2.01Retrenchment package 0.00 1.74 1.34Worker’s compensation 0.00 0.87 0.67Rental income 2.94 0.00 0.67N 51 98 149
Source: Durban IEMS survey data (2012)
In analyzing the sources of the street vendors’ household income, it is important to note the role that cash transfers play in their enterprises. A number of respondents did mention that they used money from pensions and other government grants both to start their business and to maintain it, particularly in purchasing supplies.
1.2 Characteristics of Individual EnterprisesAccording to the International Labour Organization (ILO) there are two main forms of employment in the informal economy: self-employment (i.e. own account worker, employer) or wage employment in an informal enterprise (2002). When asked about their employment status (i.e. whether they were employers, employees or own account workers) all the respondents said that they were own account workers. Later in the questionnaire, they were asked whether they had employed at least one person in their enterprise over the previous month. Twenty eight per cent of all respondents reported at least one paid employee working for them, thus suggesting that nearly 3 in every 10 vendors in the sample is, in fact, an employer at least some of the time. A further 16 per cent of respondents reported that they had at least one unpaid family member working for them.

13Street Vendors in Durban, South Africa
Figure 3 presents the percentage of vendors surveyed who had either paid or unpaid employees. The data is broken down by the respondents’ sex and whether they were located in the city centre or in the periphery. From this it is clear that the percentage of men who had an employee/assistant (whether paid or unpaid) was much higher than that of women (58 per cent and 30 per cent respectively). Men had more paid employees in both the centre and the periphery than women. Women, especially those from the periphery, tended to depend more on unpaid family members.
Figure 3 - Paid and Unpaid Employees over the Last Month (%)
60
50
40
30
20
10
0 Men Women Men Women
Centre Periphery
Paid Unpaid family Unpaid non-family
55
25
10
24
12
2
29
7
0
14
33
0
Source: Durban IEMS survey data (2012), n=149
Twenty five per cent of the male respondents in the centre had at least one unpaid family member working for them, compared to 12 per cent for the female respondents. Among male respondents in the centre, 10 per cent had at least one unpaid non-family member working for them, compared to 2 per cent of the female respondents.
For those operating from the periphery, 29 per cent of the men had at least one paid employee compared with 14 per cent of the women. However, 33 per cent of women – compared to just 7 per cent of men – had at least one unpaid family member working for them. None of the respondents in the periphery had an unpaid non-family member working for them.
When asked questions about the number of paid and unpaid employees during the busiest time of the year, these responses are very similar to those in figure 3. Sixty per cent of the male respondents in the centre said that they had a paid employee (compared to 30 per cent of the female respondents). Interviewees were asked what their total turnover was before deducting taxes or any other expenses related to their work.10 Based on this question, the average vendor in this sample reported a turnover of R2,712 (US $325) per month. Women’s turnover figures however are much lower than those of men. On average, male vendors’ turnover in this sample was R4,476 a month. This was more than twice as high as the women’s average of R2,050 a month. The mean monthly turnover for street vendors working in the periphery was R2,962; the average for inner city vendors was lower at R2,626/month. Women
10 The data presented here were generated through a question designed to capture turnover—that is, the total value of sales. They do not take into consideration the cost of sales (opening stock plus later purchases of stock) or other expenses incurred in generating the sales, such as transport, storage, and fees. The literature on income is clear that it is very difficult to capture distinctions between turnover, gross earnings, and net earnings reliably, and as with similar studies, these data should not be taken out of context and should be interpreted with caution. Data on turnover from all cities included in the IEMS study showed very high standard deviations and means that far exceeded medians.

14 IEMS Informal Economy Monitoring Study
vendors operating in the centre of the city are the worst off, reporting an average turnover of R1,938. Table 3 contains the details of earnings by sex and location as well as information about work hours.
Table 3 - Mean Turnover and Working Hours, by Sex and Location (%)
Centre Periphery
Men Women Men Women TOTAL
Mean monthly turnover (Rands)
5194.73 1938.00 3500.00 2518.00 2711.65
N 19 71 14 17 121
Mean hours per week (last week)
62.65 53.56 61.36 56.95 55.99
N 20 94 14 21 149
Mean months per year
11.70 10.86 11.57 11.00 11.15
N 20 94 14 21 149
Source: Durban IEMS survey data (2012)
Respondents were asked how many hours a week and how many months a year they worked. On average, vendors interviewed worked a 56 hour week and 11.2 months per year. This is an extremely long working week and averages out to eight hours, seven days a week, or over nine hours a day for a six-day working week. Despite these long hours, over 4 in every 10 vendors interviewed responded positively to the question “during the past 7 days, would you have liked to work more hours than you actually worked?” Men reported working longer hours that women (62 hours compared to 54 hours for women) and more months per year (an average of 11.6 compared to 11 for women).
Vendors were asked if their income or revenue had fallen over the past 12 months. The vast majority – 81 per cent – reported that their income had fallen. Vendors were asked if they had a second job. Unsurprisingly given the work hours reported above, very few street vendors (with only one male and five female respondents) reported that they had a second job.
Vendors were also asked if they received any support when they were unable to work. Most street vendors (73 per cent) do not receive any type of support. Men were more likely to have an employee taking over when they are unable to work (26 per cent for men compared to 6 per cent for women). Women who received any form of support, both in the centre and the periphery, tended to rely more on household members when unable to work (15 per cent compared with 12 per cent for male respondents).
In summary the survey found that vendors’ turnover was on average R2,712 in a month. This is a very low figure given the number of hours worked by the respondents (56 hours per week on average). It also found male vendors’ turnover was a lot more (on average) than their female counterparts. The survey found that street vendors were generating employment, with nearly 3 in every 10 reporting having a paid assistant. Men also have more employees/assistants and tend to work more hours, on average, than women. As has been pointed out in other studies, there are a number of factors that cause these differences such as the products sold (men tend to sell goods and services that command higher profits) and the longer working hours reported by men (with women having to contend with domestic chores and other household responsibilities). Men also have better support when unable to work with an employee running their enterprise – this is consistent with the higher number of employees/assistants reported by male respondents.
15Street Vendors in Durban, South Africa
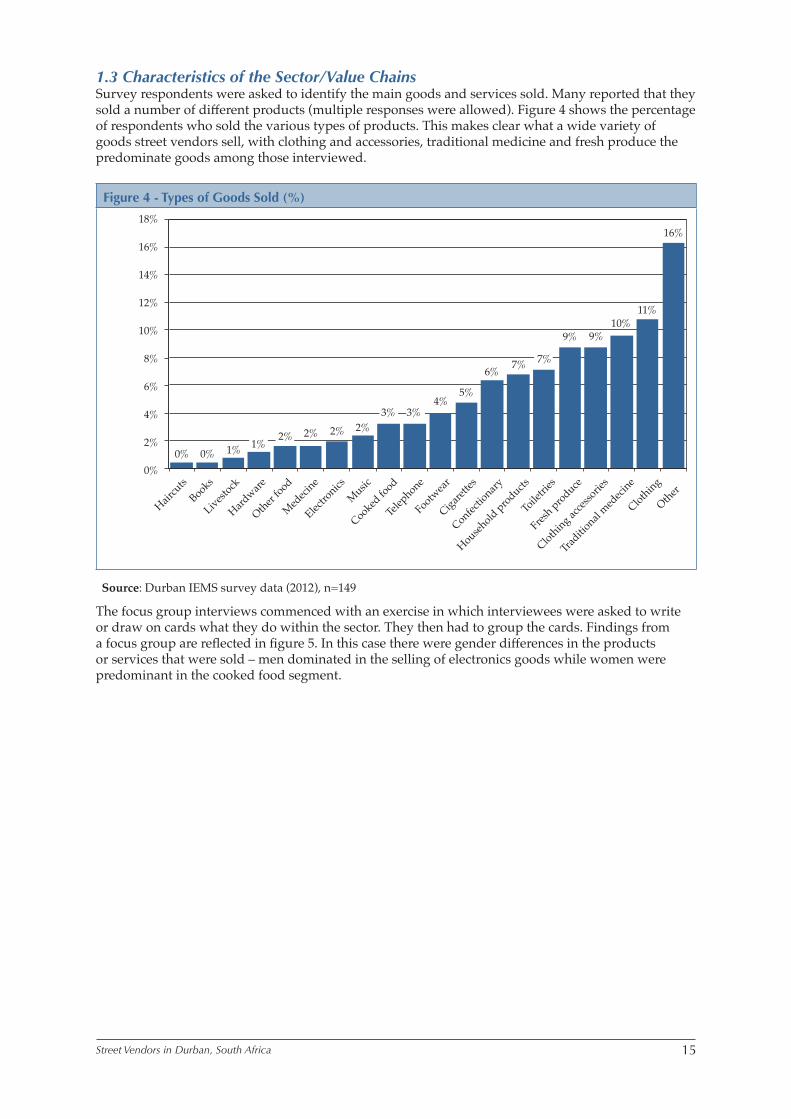
1.3 Characteristics of the Sector/Value ChainsSurvey respondents were asked to identify the main goods and services sold. Many reported that they sold a number of different products (multiple responses were allowed). Figure 4 shows the percentage of respondents who sold the various types of products. This makes clear what a wide variety of goods street vendors sell, with clothing and accessories, traditional medicine and fresh produce the predominate goods among those interviewed.
Figure 4 - Types of Goods Sold (%)
18%
16%
14%
12%
10%
8%
6%
4%
2%
0%
Haircu
tsBooks
Livestock
Hardware
Other food
Medeci
ne
Electro
nicsMusic
Cooked fo
od
Telep
hone
Footwear
Cigarette
s
Confectio
nary
Household products
Toile
tries
Fresh produce
Clothing acces
sories
Traditio
nal med
ecine
Clothing
Other
0% 0% 1%2% 2% 2%
4%5%
6% 7%
9% 9%10%
11%
16%
1%2%
3% 3%
7%
Source: Durban IEMS survey data (2012), n=149
The focus group interviews commenced with an exercise in which interviewees were asked to write or draw on cards what they do within the sector. They then had to group the cards. Findings from a focus group are reflected in figure 5. In this case there were gender differences in the products or services that were sold – men dominated in the selling of electronics goods while women were predominant in the cooked food segment.

16 IEMS Informal Economy Monitoring Study
Figure 5 - What Type of Work Do You Do?
DVDs
CDs
Computer repairs
Refreshments
Towels
Fish
Cosmetics
Russians
Hats
Fried chips
Pleated Skirts
Polony
Beads
Bags
Fat cakes
Umbrellas
Source: FG 12, three female and two male street vendors in Durban City
Two men in this group sell CDs and DVDs. One man goes beyond selling and provides a service: “I also repair computers,” he said. In this group, the women’s activities included the selling of accessories11 and cooked food as mentioned by one: “I sell fried fish and chips, Russians,12 polony and fat cakes.”
The diverse products, both within and between the focus groups, were further categorized according to whether there was any addition of value. In the focus groups, women were dominant in the activities or products that required value addition (e.g. cooked food). Table 4 shows the product categories and identifies where those value additions occur.
The focus group findings suggest that women tend to sell goods they have made themselves. An example is a female vendor (FG 12) who made beaded products; she said, “I sell beaded accessories which include necklaces, bracelets, earrings and pleated beaded skirts.” Male vendors, however, largely sold ready-made products. For example, a male vendor in the same focus group said, “I sell umbrellas and DVDs,” an activity that entails no value addition.
Street vendors in Durban sell a wide variety of products. It is clear from this and previous research on the topic that Durban residents can source almost any good or service from informal vendors. There do seem to be differences in the products that are sold by men and women. Men tend to dominate the more lucrative clothing accessories and electronics products while women are dominant in the areas of cooked food and traditional medicine – products which tend to command lower profits. The focus group results suggest that the activities that women are engaged in result in more value addition than those of men. Men tend to buy products from wholesalers and then go on to sell them to consumers without adding much value.
11 Accessories included towels, cosmetics, hats, beads, bags and umbrellas.12 Russians is the same as a frankfurter: a thin-skinned sausage, originally from Germany, made of finely minced smoked pork
or beef and grilled, fried, or boiled.

17Street Vendors in Durban, South Africa
Table 4 - Focus Group Findings by Product Sold, Value Addition and Sex
Product sold Value Addition Sex
Crafts Yes WomenClothes Yes WomenClothing accessories - MixedHousehold goods - WomenFood items Yes WomenFresh produce - WomenCooked food Yes WomenSnacks - MixedCigarettes - MenTraditional medicine Yes WomenPublic phone/Airtime - MenMusic, CDs and DVDs - MenStationery - MenHardware - MenElectrical appliances - MenToiletries - More MenServices Yes MenOther (gazebos, religious books) Yes Mixed
Source: Durban IEMS survey data (2012), n=149
18 IEMS Informal Economy Monitoring Study
Part 2: Changes in the Sector
2.1. Driving Forces in the SectorThis section summarizes the findings from the survey and focus group discussions on factors that respondents identified as being helpful and unhelpful in their work. These factors (or driving forces) were grouped into three categories – the macroeconomic environment, government policies and practices, especially at the city level, and value chain dynamics.
2.1.1 Macroeconomic ForcesRespondents were asked if they were are able to sell more, less or the same amount of products/services compared with the same period last year. A decline in demand for their products over the past year was reported by a majority (54 per cent) of the respondents (the percentages for women and men were similar – 54 per cent and 56 per cent respectively). The percentage of respondents in the periphery reporting this decline in demand was higher (63 per cent) compared with those in the centre (52 per cent). Only 20 per cent of respondents said there had been no change in demand, while 21 per cent said that demand had increased.
Respondents were also asked about the price of their supplies. Sixty three per cent of the respondents reported that supply prices had increased over the past year; 20 per cent said that prices had stayed the same and only 6 per cent said prices had actually decreased. This suggests that for many vendors, there has been both a drop in demand and an increase in the cost of supplies.
In spite of the increases in the price of supplies, only 30 per cent of the respondents said they were able to charge higher prices for their goods and services over the past year. More than a third of the street vendors (36 per cent) reported charging the same amount and 30 per cent actually reported charging less.
The vast majority of respondents (71 per cent) said competition for customers had increased over the past year – there were more informal vendors selling similar goods and services. In the periphery, 86 per cent of the respondents reported that competition had increased over the past year while the percentage was lower in the centre with 67 per cent of the respondents saying this had been the case. Only 16 per cent of the street vendors felt there had been no change in the number of informal vendors over the past year and 8 per cent said that the number of street vendors had decreased.
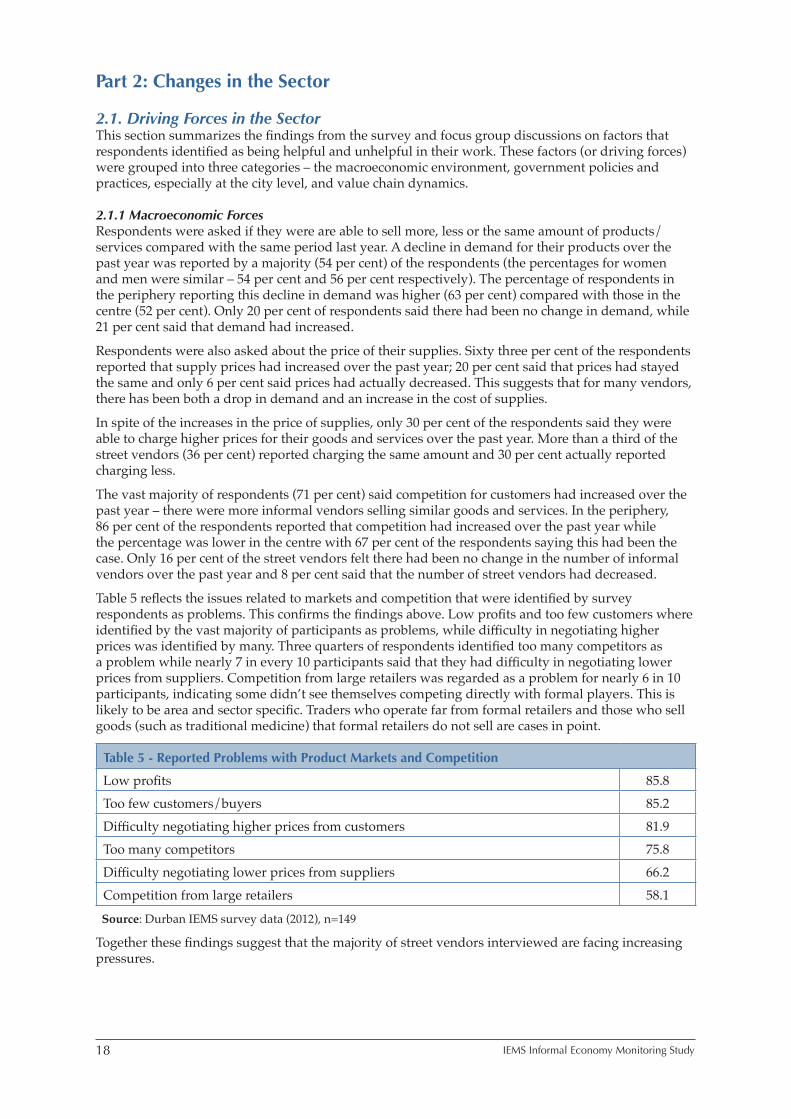
Table 5 reflects the issues related to markets and competition that were identified by survey respondents as problems. This confirms the findings above. Low profits and too few customers where identified by the vast majority of participants as problems, while difficulty in negotiating higher prices was identified by many. Three quarters of respondents identified too many competitors as a problem while nearly 7 in every 10 participants said that they had difficulty in negotiating lower prices from suppliers. Competition from large retailers was regarded as a problem for nearly 6 in 10 participants, indicating some didn’t see themselves competing directly with formal players. This is likely to be area and sector specific. Traders who operate far from formal retailers and those who sell goods (such as traditional medicine) that formal retailers do not sell are cases in point.
Table 5 - Reported Problems with Product Markets and Competition
Low profits 85.8Too few customers/buyers 85.2Difficulty negotiating higher prices from customers 81.9Too many competitors 75.8Difficulty negotiating lower prices from suppliers 66.2Competition from large retailers 58.1
Source: Durban IEMS survey data (2012), n=149
Together these findings suggest that the majority of street vendors interviewed are facing increasing pressures.
19Street Vendors in Durban, South Africa
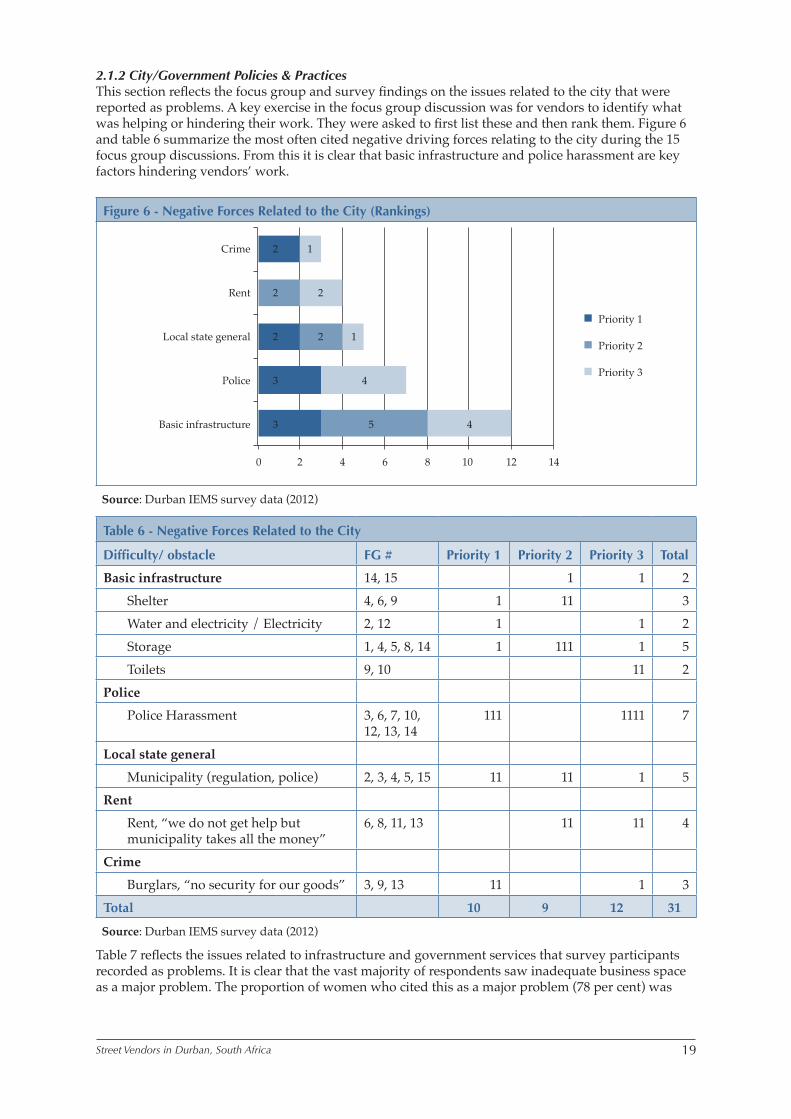
2.1.2 City/Government Policies & PracticesThis section reflects the focus group and survey findings on the issues related to the city that were reported as problems. A key exercise in the focus group discussion was for vendors to identify what was helping or hindering their work. They were asked to first list these and then rank them. Figure 6 and table 6 summarize the most often cited negative driving forces relating to the city during the 15 focus group discussions. From this it is clear that basic infrastructure and police harassment are key factors hindering vendors’ work.
Figure 6 - Negative Forces Related to the City (Rankings)
Crime
Rent
Local state general
Police
Basic infrastructure
Priority 1
Priority 2
Priority 3
2 1
2 2
2 2 1
3 4
3 5 4
0 2 4 6 8 10 12 14
Source: Durban IEMS survey data (2012)
Table 6 - Negative Forces Related to the City
Difficulty/ obstacle FG # Priority 1 Priority 2 Priority 3 Total
Basic infrastructure 14, 15 1 1 2 Shelter 4, 6, 9 1 11 3 Water and electricity / Electricity 2, 12 1 1 2 Storage 1, 4, 5, 8, 14 1 111 1 5 Toilets 9, 10 11 2Police
Police Harassment 3, 6, 7, 10, 12, 13, 14
111 1111 7
Local state general
Municipality (regulation, police) 2, 3, 4, 5, 15 11 11 1 5Rent
Rent, “we do not get help but municipality takes all the money”
6, 8, 11, 13 11 11 4
Crime
Burglars, “no security for our goods” 3, 9, 13 11 1 3Total 10 9 12 31
Source: Durban IEMS survey data (2012)
Table 7 reflects the issues related to infrastructure and government services that survey participants recorded as problems. It is clear that the vast majority of respondents saw inadequate business space as a major problem. The proportion of women who cited this as a major problem (78 per cent) was

20 IEMS Informal Economy Monitoring Study
slightly higher than that of men (73 per cent). Inadequate access to toilets or rubbish removal was a problem cited by 73 per cent of the respondents. This confirms that basic infrastructure is a critical problem but suggests that in addition, there is poor access to small business support centres and training facilities. Lack of information about local regulations is also identified as a problem by 7 in every 10 participants.
Table 7 - Reported Problems with Infrastructure and Institutional Obstacles, by Usual Location (%)
Same location every day
Vending from different locations Total
Poor access to small business support centers 83.33 100.00 83.89Inadequate business space 77.08 80.00 77.18Inadequate access to toilets or rubbish removal 72.22 100.00 73.15Poor access to infrastructure (electricity, water, lights) 70.14 80.00 70.47Inadequate or lack of storage space 67.36 80.00 67.79Occupational hazards affecting safety of workers or self 64.58 100.00 65.77Treatment by the local authority 63.89 80.00 64.43Can’t obtain a business licence 50.00 100.00 51.68Cost of infrastructure (electricity, water, telephone) 46.85 80.00 47.97Expensive rent 47.18 40.00 46.94N 144 5 149
Source: Durban IEMS survey data (2012)
Access to Basic Infrastructure –Shelter, Toilets, Water and Storage
As is clear from the table and figure, access to basic infrastructure was cited as a major issue hindering vendor businesses. This category was cited by 14 of the 15 focus groups, with three focus groups ranking it as the most serious negative driving force (i.e. assigning it the highest priority).
The impact of lack of shelter was well demonstrated in one of the focus group interviews. This group identified rain and sun as the most serious problem hindering their work activities. The details they gave on how this affects their businesses are presented in figure 7.
Figure 7- How Rain and Sun Impact on Street Vendors
Impact Response
Stock gets wet
Sun burns stock
Drains are blocked
Closing down the business
We starve
Throwing them away
Rain and Sun
We lose customers
Source: FG 11, five male street vendors operating in central and outside Durban City

21Street Vendors in Durban, South Africa
Vendors outlined how the sun burns their stock and when it rains, their stock gets wet. A vendor also noted “The municipality does not sort the problems of clogged drains. When it rains, water is prevented from going through the path because drains are blocked. This compels us to close business until the rain stops.” Vendors noted how they end up throwing these damaged goods away (if they fail to sell them at low prices). They went on to outline the serious consequences of this: they lose customers, they consider closing their businesses and this has direct implications for their well-being – participants noted that they could starve.
In the survey, street vendors were asked whether they had access to toilets, running water and storage facilities for their goods. They were also asked questions on how far these facilities were from their place of work. The findings are summarized in figure 8.
Figure 8 - Access to Storage, Toilets and Water, by Location and Sex (%)
Women
Men
Women
Men
0.0 20.0 40.0 60.0 80.0 100.0
C
entr
e Pe
riphe
ry
Storage
Toilet
Running water
8652
38
7136
21
3944
21
9045
5
Source: Durban IEMS survey data (2012), n=149
Toilets and running water are an essential component of a decent work environment. The lack of these facilities poses not only a health risk to vendors but also to their customers. The majority of vendors surveyed – 56 per cent– did not have access to a toilet. This is more than was reported in the previously cited StreetNet census, which found that 4 in 10 vendors did not have access to toilets (Rogan 2012: 24). Far fewer vendors in the IEMS study – only 21 per cent – had access to running water and again, this was lower than StreetNet’s finding that 44 per cent of all vendors had access to running water (Rogan 2012: 24). The differences by sex and location are outlined in figure 8, highlighting that the situation is worse in the centre with only 21 per cent of women and 5 per cent of men reporting access to running water. This is an issue that needs to be addressed urgently.
Access to secure and affordable storage is an essential element of any vendors’ business. If this is lacking, it can hinder business growth. While 56 per cent of all respondents reported that they had access to storage, interestingly men had much better access to storage than women (82 per cent and 48 per cent respectively). As shown in figure 8 above, women in the centre fared particularly badly, with only 39 per cent saying that they had access to storage.
Although survey respondents were not asked directly about their access to shelter, the StreetNet survey found that only 7 per cent of street vendors displayed or sold their goods from municipal shelters and 6 per cent sold their goods from a tent (Reform Development Consulting 2010: 36). According to the StreetNet survey, 32 per cent of street vendors sold their goods from a table and 14 per cent sold their goods directly on the ground. The lack of shelter is also a problem that needs urgent attention.

22 IEMS Informal Economy Monitoring Study
Experiences with the Police
The most common form of interaction that street vendors have with the city council (according to both the survey respondents and focus group participants) was with the police. The survey asked questions about the problems street vendors encounter in running their enterprises. Police harassment, confiscation of goods and evictions were the main problems cited, and those in the periphery were more affected than those in the centre. Respondents in the periphery reported much higher levels of harassment (74 per cent) than those in the centre (49 per cent). Two thirds (65 per cent) of respondents in the periphery said that their goods had been confiscated while the percentage was lower in the centre with 48 per cent of respondents reporting their goods had been confiscated. Evictions – including lack of support during evictions, and/or lack of protection from or warnings before evictions – were cited as problematic by 63 per cent of vendors in the periphery and 37 per cent of those in the centre.
Street vendors were asked whether there had been a change in police harassment over the past year. Responses were mixed: 26 per cent of the respondents (37 per cent from the periphery and 23 per cent from the centre) reported that harassment had increased; 17 per cent (31 per cent from the periphery and 16 per cent from the centre) said there had been no change; and 21 per cent (31 per cent from the periphery and 18 per cent from the centre) said that it had actually decreased. The remaining 36 per cent of respondents said they did not experience police harassment so the question was not applicable to them.
The second most serious negative driving force cited by the focus groups (after poor infrastructure) was the police, mentioned by seven focus groups (with three of these groups ranking the police as the most serious problem impacting on their business). Figure 9 relays the findings from one of these focus groups detailing the negative impact that police harassment has on street vendors and their activities.
Figure 9 - How Police Harassment Impacts on Street Vendors
They confiscate our stock
Unnecessary fines
They steal our goods
We are left with nothing
We report
Police
They harass us
Source: FG 10, three female and three male street vendors operating in the inner city and the periphery
What was clear from the focus group discussions was that harassment by the police was pervasive. This was mentioned by four focus groups. Experiences are reflected in some of the quotes below.
“The police are harassing us, they take away our goods, we need to run away from them with our goods in order to be safe.” (Male vendor, FG 7)
“The police are a big problem, they are confiscating our goods and take our permits away.” (Female vendor, FG 3)
“We really suffer in their presence.” (Female vendor, FG 14)
Vending permits are clearly a critical issue. Half of the vendors interviewed in the survey cited not being able to obtain a business licence as a problem. However as one male vendor stated, “They confiscate our stock even if the permits are produced” (FG 10), suggesting that having a permit does not necessarily protect traders from harassment. A number of vendors reported that police issue fines and/or confiscate their goods if the permit is valid but the permit holder is not there.

23Street Vendors in Durban, South Africa
“Police are a problem. If they are at your table they ask for the permit. If someone else produces the permit on behalf of the owner, they say they need to see the person whose picture is on the permit. If the owner is not in the table, they issue a ticket for a fine of about R300 or R250 or R100 depending on the mood of that police officer at that time.”
Male Vendor, FG 6
As is clear from the previous section, many vendors have assistants. There are numerous reasons why the permit holder might need to be away from their stall for short periods – for example going to the toilet or taking a break to buy food. Or a permit holder may be absent for longer periods, to negotiate with suppliers, purchase stock or attend a vendor organization meeting. If they or a member of their family is unwell, they may need to be away for a few days. This is a particular issue for women. Vendors felt strongly that they could not be expected to be at their vending stalls all the time.
When fines were issued and goods confiscated, vendors had a number of complaints. The first was that their goods were damaged. Vendors explained that when police confiscate their goods, they leave a ticket that vendors can use to reclaim their goods. Vendors claimed police do not handle their goods with care – that there are a lot of breakages, and that fresh produce gets spoiled or damaged in the process. Vendors reported that when they reclaim their goods, they usually find them in an appalling condition.
“When police confiscate our goods they do not pack them properly. They just throw them in their trucks. By the time you reclaim them, their condition will be compromised as a result, and some of them have to be thrown away or sold at a discount.”
Male vendor, FG 6
Vendors also noted that they were not compensated for these losses. There were several cases reported where some of the goods, and in some cases all of the goods, were not at the police station. Vendors thus argued that the police were in fact stealing their goods. Seven focus groups reported this challenge. The participants in FG 10 openly stated that police steal their stock: “Police steal our stock, they are thieves!” one woman complained. “Yes, they steal our items during their raid. We report the matter at the police station but nothing happens as the very same police are the ones guilty of these wrong-doings!” a male vendor added, throwing his hands about to express his frustration.
Many vendors noted that the police are very forceful when dealing with vendors. Some vendors reported being verbally and physically abused by the police. A woman said, “Sometimes when we are running away, if they are chasing us, they spray us with teargas, they hit us and they also swear at us” (FG 7). This heavy-handedness by the police makes street vendors feel that they are being treated like criminals.
Another issue raised was that the fines charged were very onerous. Vendors reported that they often had to turn to loan sharks as their only source of financial assistance. The impact of these police confiscations and raids are serious, setting vendors’ business back for months and in some cases destroying businesses.
Access to Permits and Rent
According to the City Manager’s office (interview 18 June 2013), the city has issued 44,000 vendor licences. This suggests a system of wide-scale permitting in Durban, yet half of the vendors surveyed reported not being able to obtain a business licence as a problem. Vendors are charged between R40 and R120 a month. In the survey expensive rent was cited as a problem by 47 per cent of vendors interviewed. Four focus groups mentioned expensive rent as a challenge, as articulated by a male vendor in FG 11: “Rent is very high and it is being increased unnecessarily. We end up failing to pay it, which results in us losing our tables. This destroys our business.”
The vendors argued that they do not get services equivalent to the rent they pay. They also mentioned that the rate charged per vending site is the same for all, even though the sizes of sites vary. They do not get positive response when they report their dissatisfaction to the local authority. As one trader noted, “We report our dissatisfactions to the BSU but they respond by reducing the same small sites to something not conducive for operating our businesses” (FG 13).
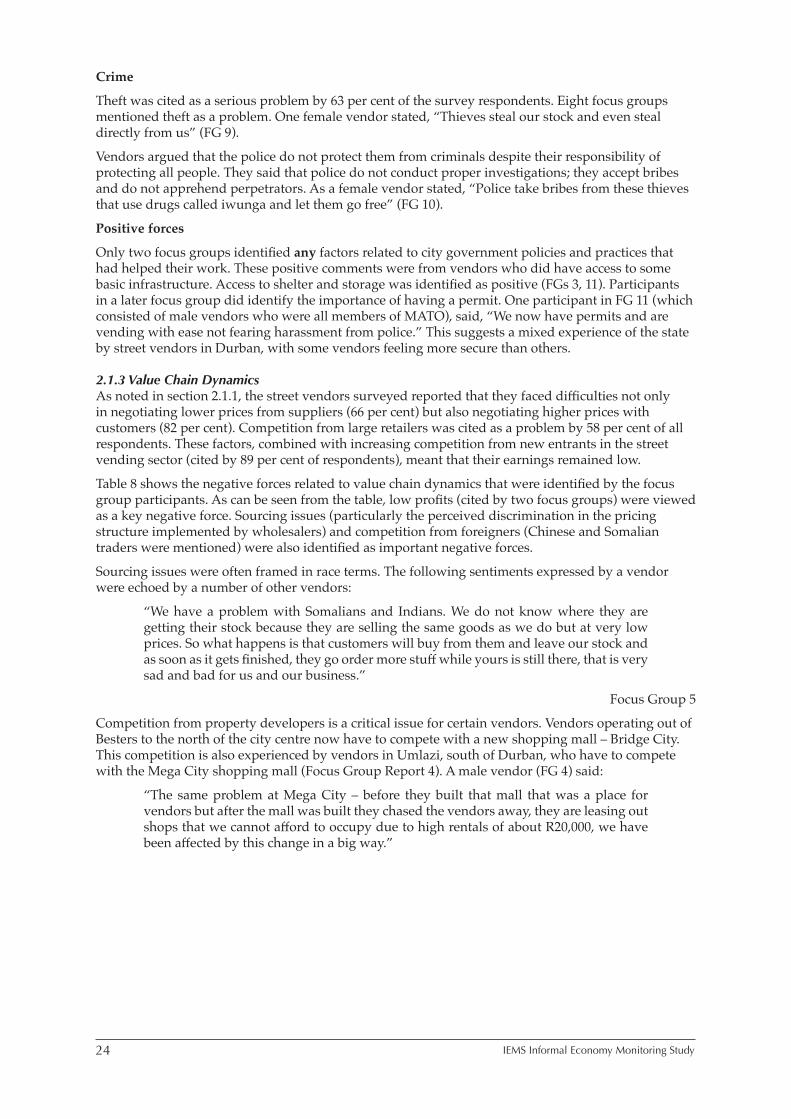
24 IEMS Informal Economy Monitoring Study
Crime
Theft was cited as a serious problem by 63 per cent of the survey respondents. Eight focus groups mentioned theft as a problem. One female vendor stated, “Thieves steal our stock and even steal directly from us” (FG 9).
Vendors argued that the police do not protect them from criminals despite their responsibility of protecting all people. They said that police do not conduct proper investigations; they accept bribes and do not apprehend perpetrators. As a female vendor stated, “Police take bribes from these thieves that use drugs called iwunga and let them go free” (FG 10).
Positive forces
Only two focus groups identified any factors related to city government policies and practices that had helped their work. These positive comments were from vendors who did have access to some basic infrastructure. Access to shelter and storage was identified as positive (FGs 3, 11). Participants in a later focus group did identify the importance of having a permit. One participant in FG 11 (which consisted of male vendors who were all members of MATO), said, “We now have permits and are vending with ease not fearing harassment from police.” This suggests a mixed experience of the state by street vendors in Durban, with some vendors feeling more secure than others.
2.1.3 Value Chain DynamicsAs noted in section 2.1.1, the street vendors surveyed reported that they faced difficulties not only in negotiating lower prices from suppliers (66 per cent) but also negotiating higher prices with customers (82 per cent). Competition from large retailers was cited as a problem by 58 per cent of all respondents. These factors, combined with increasing competition from new entrants in the street vending sector (cited by 89 per cent of respondents), meant that their earnings remained low.
Table 8 shows the negative forces related to value chain dynamics that were identified by the focus group participants. As can be seen from the table, low profits (cited by two focus groups) were viewed as a key negative force. Sourcing issues (particularly the perceived discrimination in the pricing structure implemented by wholesalers) and competition from foreigners (Chinese and Somalian traders were mentioned) were also identified as important negative forces.
Sourcing issues were often framed in race terms. The following sentiments expressed by a vendor were echoed by a number of other vendors:
“We have a problem with Somalians and Indians. We do not know where they are getting their stock because they are selling the same goods as we do but at very low prices. So what happens is that customers will buy from them and leave our stock and as soon as it gets finished, they go order more stuff while yours is still there, that is very sad and bad for us and our business.”
Focus Group 5
Competition from property developers is a critical issue for certain vendors. Vendors operating out of Besters to the north of the city centre now have to compete with a new shopping mall – Bridge City. This competition is also experienced by vendors in Umlazi, south of Durban, who have to compete with the Mega City shopping mall (Focus Group Report 4). A male vendor (FG 4) said:
“The same problem at Mega City – before they built that mall that was a place for vendors but after the mall was built they chased the vendors away, they are leasing out shops that we cannot afford to occupy due to high rentals of about R20,000, we have been affected by this change in a big way.”

25Street Vendors in Durban, South Africa
Table 8 - Negative Forces Related to Value Chain Dynamics
Difficulty/ obstacle FG # Priority 1 Priority 2 Priority 3 Total
Sourcing issues
Foreigners / Indians “they charge lower prices”
5 1 1
“Difference in prices charged to vendors”
8 1 1
Inflation – “Ever rising prices … we need a special market to buy our goods”
11 1 1
Low profits
Low profits, “shortage of income” 1, 7 1 1 2Demand
Somalians and Chinese “take our customers”
2 1 1
Competition
“Emergence of malls” 10, 4 2 2 Competition – “Lots of vendors” 7 1 1Other
No marketing strategy 1 1 1
Source: Durban IEMS survey data (2012)
Another male vendor in the same group elaborated, “There are goods that they do not want us to sell because they have them inside the mall, things like cell phone airtime, cakes, etc.”
Interestingly one group, which predominantly sold clothing, identified lacking a marketing strategy as the main problem they faced.
Positive Forces
In terms of the value chain dynamics, good working relationships with suppliers and customers came out strongly from some groups as helping their work. These were cited by vendors participating in three different focus groups who mentioned that they were offered discounts and were able to buy goods on credit. The support from customers who buy their products was also cited as a positive factor in their work.
Table 9 - Positive Forces Related to Value Chain Dynamics
Difficulty/ obstacle FG # Total
Relationships with suppliers
Get credit from supplier 6 1 See drop in prices (discounts from suppliers) 10 1 Buy anywhere (access to suppliers) 11 1Relationships with customers
Market attraction (giving customers access to products) 15 1 Month end (a period of high demand for products) 10 1Support services
Porters 15 1
Source: Durban IEMS survey data (2012)

26 IEMS Informal Economy Monitoring Study
2.1.4 Other ForcesApart from the macroeconomic, value chain dynamics and government policy and practice driving forces, there were other negative and positive driving forces that were cited which did not fit into these categories. Two focus groups mentioned the undermining or belittling of vendors as a negative driving force, noting that vendors are regarded as poor people engaged in activity that is at a very low level.
Street vendors cited a number of positive forces related to their work. The findings are summarized in table 10. Earning capacity was cited by four focus groups. One female street vendor said, “As a result of the sales that we make, we make money – that is positive for us” (FG 13). Vendors mentioned information sharing amongst themselves and with others (e.g. students), as another positive driving force. Organizing and vendor solidarity as well as support services were mentioned as positive factors in trade.
Table 10 - Other Positive Driving Forces
Difficulty/ obstacle FG # Total
Earning capacity
Sales of stock (our products are brought and we are able to make money) 8, 10, 12, 13 4Information
Assisting students (sharing of information) 15 1 Meeting different people and sharing ideas 8, 13, 15 3Vendors Solidarity
Being part of the street vending community, harmony/multiracial ambience
7, 15 2
Organizing 10 1
Programmes and initiatives by vendor organization, South African Informal Workers Association (SAIWA) and Traders Against Crime (TAC)
2 1
Urban Management “Reduce crime in our area” 8 1
Support services Increased access to markets, training and facilitating maintenance of the vending spaces by NGO Asiye eTafuleni (AeT)
2 1
Psychological factors Stress relief 13 1
Source: Durban IEMS survey data (2012)
Playing a role in the fighting of crime in the city gave street vendors a sense of pride. Others mentioned that their work offers them a form of stress relief. One female vendor said, “I like meeting people. I also manage to relieve stress by talking to people at my vending site. For me participating in this activity gives me hope that I will get money to support my kids” (FG 13).
The factors impacting on street vendors in Durban were analyzed in terms of three main driving forces – the economy (e.g. increases in the prices of supplies as a result of inflation and the failure of street vendors to pass on these increases to consumers due to depressed demand), national/local government policies and practices (e.g. access to infrastructure, police heavy-handedness in dealing with street vendors, inadequate business support services, lack of clarity on rules and regulations) and value chain dynamics (e.g. unfair business practices encountered in the purchase of supplies, competition from foreigners resulting in low demand and profits for their products).
The findings from this study suggest that the most serious problems identified by the street vendors had to do with local government – the lack of infrastructure and the harassment of street vendors.

27Street Vendors in Durban, South Africa
As previously noted, access to toilets and running water is an essential component of a decent work environment. Nearly 6 in every 10 vendors surveyed did not have access to a toilet, while nearly 8 in every 10 vendors reported not having access to running water. This is a real health concern. Street vendors’ access to water does not refer only to the availability of drinking water. For many of them, particularly women (due to the products that they sell), water is an essential ingredient in their value addition activities. It is required in the preparation of food and traditional medicine, products that are predominantly sold by women. As is the case with water, a street vendor’s access to storage for her goods does have an impact on her enterprise. If the goods are not properly stored, there is a chance that the quality will deteriorate or the goods will be stolen. In terms of infrastructure, the results show that men generally had better access to storage and running water. Clearly a lack of infrastructure could be one of the reasons why there are such large differentials in earnings between men and women.
2.2: Intermediary Factors
2.2.1 Responses to Negative Driving Forces Survey participants were asked the question “If your revenues/turnover from your primary activity have fallen over the past 12 months, how did you manage?” One in every two respondents said that they did nothing. Others (19 per cent) said they cut down on their personal expenses and a further 16 per cent said they borrowed money.
In the focus groups, after vendors had identified the two most important factors hindering their work, they were asked to reflect on their responses to these factors. Table 11 summarizes the main findings from this exercise.
From this summary it is clear that borrowing money is a common response to many of the problems vendors face. Sometimes it is specified that money is borrowed from loan sharks who are known to charge extremely high interest rates.
The response to the lack of basic infrastructure is largely to purchase these goods – to buy water and tents where water and shelters are not provided and to buy generators or batteries where electricity is needed and not available; to negotiate with local shops to store goods when there is no storage. These are all additional costs when incomes are already low. These challenges were well captured in a focus group that identified lack of access to water and electricity as a key difficulty. They constructed the diagram in figure 10 – the impacts are shown on the left, the responses on the right. Most responses involve costs on the part of vendors as they have to either pay for these goods or lose earnings. Some require physical effort, for example carrying water from their homes to the vending site (with all the transport difficulties this option entails). Another option is to take the items home for repairs – an option that usually requires much physical effort and is time-consuming. The most challenging option is that of having to refer customers to other street vendors, thus losing income. Clearly, lack of access to water and electricity limits the vendors’ ability to fulfill their potential and increase their earnings.

28 IEMS Informal Economy Monitoring Study
Table 11 - Further Positive Driving Forces
Category Driving Force Response FG#
City government policies and practices
Police We borrow money.We pay fines.We go to the courts to request fine reduction.
6, 7
We report misconduct to municipality. 7, 14, 10Rent We report to traders’ committee and BSU.
We negotiate for more time to earn enough money.
11, 13
Basic infrastructure
No Storage We borrow money from loan sharks to pay for storage. We store our goods in shops and pay.
4, 5, 8, 14
No Shelter We buy tents to shelter our goods.We throw spoiled goods away.
6, 9
Water & Electricity We buy water. We form organizations to represent us when fighting for services.
12
Local State General
Municipality We buy generators, batteries and water.We borrow money from loan sharks.
2, 3, 5
Attend monthly meetings 15No service delivery We hold meetings with municipality
representatives and our committee.We write letters.
15
CrimeThieves
We loan money to replenish stolen stock. 9
Value chains Emergence of shopping malls
We starve. 10
Somalians/ChineseForeigners
We replenish stock.We report to BSU and security.
2, 13
Difference in pricing We hold meetings with those traders who price differently.We resort to violence if we do not reach consensus.
8
Economic Shortage of incomeLack of moneyLow profits
Poverty increases.We borrow money from loan sharks.
1, 3, 7
Lack of marketing business
We have to lower our prices so that people can afford buying our items.
1
Other We let customers go if they complain about our prices.
12
Undermining of vendors
We are organizing – SAIWA. 12
The 24 hour operation of vending was stopped.
We do not make enough money, so we have to borrow money to pay rent
4
Rain and sun We close down business due to impact of this weather condition. We throw spoiled goods away.
11
Source: 15 focus groups

29Street Vendors in Durban, South Africa
Figure 10 - The Impact of and Response to Lack of Access to Water and Electricity
Impact Response
We can’t cook without water
No operation without electricity
No repairs without electricity
I buy water
I take work home
I bring my own water
I lose profit
Water and Electricity
It is unhygienic without water
We can’t arrive early due to crime
I lose profit
I lose profit
I refer customers to other salons
I deliver to customers’ shops
Source: FG 12, three female and two male street vendors in Durban City
The response to the challenges related to the local authority is a mix of writing letters, calling meetings and negotiating. The discussions suggested that these representations seldom yielded results, as articulated by a male vendor: “We report the challenges we are faced with to the municipality, but there is no help from them” (FG 11). As is clear from table 11 one of the responses to police harassment was to simply pay the fines, with some vendors reporting that they go to the courts requesting fine reductions – however, this too is a very time consuming process. Street vendors expressed a sense of powerlessness. A woman said, “We do not have power over police, they do as they please. They harass us a lot” (FG 14).
Although in some cases vendor organizations are looked to (in response to lack of basic services and the undermining of vendors), the vast majority of these responses were at the individual level.
2.2.2 Intermediary InstitutionsSurvey respondents were asked how helpful certain institutions were in their vending activities. Tables 12 and 13 reflect the institutions vendors identified as unhelpful and helpful respectively.
From the tables, it is clear that national government and local government are regarded by the vast majority of vendors as being unhelpful to vending activities. Unsurprisingly the police were also reported to be largely unhelpful, although a small group (17 per cent) felt that they did help.
Supermarkets or large retailers were also identified primarily in a negative way, although again a small group felt that they were helpful. The former group is likely to compete with formal players, while the latter source their goods from them.
With respect to institutions that help vendors, the findings suggest there is solidarity between vendors – with “other workers” being identified by 6 in every 10 vendors as helpful. MBOs were reported by 54 per cent of the sample as helpful. Non-governmental organizations (NGOs) also featured positively. Few if any vendors, however, appear to be part of worker cooperatives.

30 IEMS Informal Economy Monitoring Study
Table 12 - Institutions Identified as Being “Unhelpful”, by Sex and Location (%)
Centre Periphery TOTAL
Men Women Men Women
National government 90.00 75.53 78.57 76.19 77.85Supermarkets or large retailers 70.00 74.47 78.57 85.71 75.84Local government 85.00 68.09 85.71 76.19 73.15Police 70.00 63.83 85.71 85.71 69.80Trade union 80.00 58.51 78.57 85.71 67.11Worker’s cooperative 60.00 54.26 71.43 71.43 59.06NGOs 10.00 41.49 35.71 42.86 36.91Other workers 30.00 32.98 42.86 47.62 35.57MBO 15.00 27.66 28.57 38.10 27.52N 20 94 14 21 149
Source: Durban IEMS survey data (2012)
Table 13 - Institutions Identified as Being “Helpful”, by Sex and Location (%)
Centre Periphery
Men Women Men Women TOTAL
Other workers 70.00 60.64 57.14 42.86 59.06MBO 85.00 50.00 64.29 38.10 54.36NGOs 75.00 42.55 57.14 33.33 46.98Local government 15.00 21.28 14.29 14.29 18.79Police 25.00 19.15 7.14 4.76 16.78Worker’s cooperative 20.00 10.64 21.43 4.76 12.08National government 5.00 11.70 14.29 14.29 11.41Supermarkets or large retailers 20.00 9.57 14.29 9.52 11.41Trade union 10.00 3.19 7.14 0.00 4.03N 20 94 14 21 149
Source: Durban IEMS survey data (2012)
The focus groups were an opportunity to delve into these issues. Vendors again were asked to identify the institutions that were helping or hindering their work. The police, the municipality in general, and the Business Support Unit, in particular were identified as institutions hindering their work, while vendor organizations and NGOs were identified as positive intermediaries. Table 14 reflects the number of times different institutions were mentioned in the focus group discussions.

31Street Vendors in Durban, South Africa
Table 14 - Institutions Helping or Hindering Vendors, Frequency of Responses in Focus Groups
Positive or negative
Institution Frequency + - +-
Municipality 111111111 (9) 11111111 (8) 1 (1)
General Police 1111111111 (10) 1111111111 (10) BSU 1111 (4) 1111 (4) Councilor 1 (1) 1 (1)Public Rail Association of South Africa (PRASA)
11 (2) 11 (2)
Community Policing Forum 1 (1) 1 (1)Vendor Organizations
ITMB 11 (2) 11 (2) MATO 1111111 (7) 111111 (6) 1 (1) SAIWA 111 (3) 111 (3) TAC 1111 (4) 111 (3) 1 (1) Ubumbano Alliance 1 (1) 1 (1) SASEWA 1(1) 1(1) Vendor Committee 11 (2) 1 (1) 1 (1)NGO 11 (2) 11 (2)AeT 11111111111 (11) 1111111111 (10) 1 (1)StreetNet 111 (3) 11 (2) 1 (1)WIEGO 1(1) 1(1)Legal Resources Centre 1 (1) 1 (1)Private Sector
Retail competitors 11 (2) 11 (2) Advertisers 11 (2) 1 (1) 1 (1)Foreigners 1 (1) 1 (1)Other
Social Indaba 1 (1) 1 (1) UKZN 1 (1) 1 (1)
Source: Durban IEMS survey data (2012)
Seven focus group discussions addressed the issue that police impose huge fines and confiscate their stock. There were also reports of confiscated stock getting lost while held by police. The vendors said that police want vendors to pay bribes. They also reported cases of theft and physical abuse.
The municipality was also reported in two focus group reports to be confiscating goods, and was cited by five focus groups to be of no help to vendors. In fact, they were perceived to be operating against vendors. There were also reports of abuse, making profit from permit fees that they collect from vendors, as well as taking their permits.

32 IEMS Informal Economy Monitoring Study
In terms of the BSU, there were reports that they harass vendors by sending police to harass them. They do not help vendors, as mentioned by two focus groups. One male respondent said, “Business Support Unit (BSU) does not help us in any way.” Another man added, “They have to be called Business Destroyers because that is exactly what they do to our business” (FG 8).
The traders operating out of the Early Morning Market made particular mention of the surcharge the municipality imposes on their goods but also the opening hours of the market. A male trader explained, “We are charged 7 per cent if we bring fresh produce from the farms, while retailers can buy from farms at no surcharge. We open our market at 06h00 and close at 15h00 while they can open at 06h00 and close as late as 19h00. They outsource directly, which we cannot do.” They thus argued that the municipality was generating unfair competition.
The view of the private sector was also negative. Two big retailers – Cambridge Meats and Jwayelani – were identified as purchasing goods directly from farms and selling fresh produce at discount prices respectively, so vendors were struggling to compete. Another retailer, Checkout, had extended its trading hours. Vendors often rely on providing goods to early morning and late night commuters. The experience with advertisers was also mixed.
A review of the 15 focus group reports finds that experience with AeT has been overwhelmingly positive. Vendors reported that AeT had assisted them to access markets, promoting small organizations, skills development, awareness and exposure and facilitating training workshops on street vending law. AeT was also reported to play a role in the fight for vendors’ rights. Vendors said, “They are our voice.” In addition, AeT, it was reported, is assisting with communication with the city council.
A number of vendor organizations were reported to play a positive role. MATO was mentioned in six focus groups. They fight for vendors’ rights and facilitate discussions with the municipality. There was only one focus group in which MATO was viewed negatively. Two focus groups reported that TAC fights crime and makes the city safe. However, one male participant in FG 8 said, “TAC is useless. They contribute to the harassment of people.” A second participant added, “They do not do what they were meant to do. They require us to pay them R50. They are no longer combating crime, but they have become thieves who exacerbate crime amongst us” (FG 8). Vendors reported that SAIWA helps them when they have problems. They help with pricing (negotiating with suppliers) and they also teach vendors about their rights.
Focus group participants were also asked what these institutions should be doing to improve their working conditions. Vendors said that the police must stop harassing them and confiscating their goods. With respect to the municipality in general and BSU in particular, vendors said that they need to listen to their concerns and consult them much more regularly. They argued that the number of vending sites should be increased, that they should be assisted in both securing permits, and that the process of renewing permits should be streamlined. It was pointed out that BSU was meant to be providing support services to vendors. Finally, the vendors suggested that a portion of their permit fees should be used to contribute to an unemployment insurance fund.
In particular, AeT’s intervention in assisting with removing middlemen and extending vendors’ exposure worldwide was highly regarded. The remaining institutions, including SAIWA, MATO and TAC, had to intervene by addressing the issue of permits, shelter and rent, including the expansion of sites for vending and production purposes.
In summary street vendors view local/national government as being unhelpful in their work. For many street vendors, the only interaction they have with local government is through harassment and fines at the hands of the police. The BSU was viewed in a very negative light with some focus group participants actually saying that it destroys businesses. NGOs and MBOs while generally viewed more favorably, also elicited a number of negative comments from focus group participants. It is important to take note of some of the negative comments that were made particularly about some MBOs by their members.

33Street Vendors in Durban, South Africa
Part 3: Linkages & Contributions of the Sector to the City
3.1 Linkages to Formal SectorA point of policy contention has been the relationship between the formal and informal economies (See Devey, Skinner and Valodia 2006 for an overview of these debates). The survey findings show evidence of strong backward linkages to the formal economy. When asked where they bought their goods, almost all the male respondents (94 per cent) said that they bought their goods from a business in the formal sector. The proportion of women who bought their goods from formal enterprises was much lower (28 per cent), with many of the women (41 per cent) saying that they make/grow the products they sell. This is because, in part, a number of female interviewees traded in traditional medicine, one of the few sectors that does not source its products from the formal economy.
Figure 11 - Where Do You Buy Your Goods From, by Sex (%)
100
90
80
70
60
50
40
30
20
10
0 Make or grow Acquire them Buy them from Buy them from Other them myself for free an informal a formal business buiness
42
0 0
103
21
94
28
30
Men Women
Source: Durban IEMS survey data (2012)
Although street vendors did report that they sold their goods mainly to the general public, 16 per cent of the women (and none of the men) said that they also sell their goods to the formal sector, as shown in figure 12.
34 IEMS Informal Economy Monitoring Study
Figure 12 - Main Customers, by Sex (%)
100.0
80.0
60.0
40.0
20.0
0.0 Men Women
0 36
15
88
9
0
1620 17
13
92
17
2
Formal business
Informal business
Other informal workers
Family/friends
General public
Private individual
Other
Source: Durban IEMS survey data (2012), n=149
Street vendors from the focus groups reported that they interact with a range of large formal sector players. Those selling clothes purchase goods from KwaMtapuna, a chain of fabric shops, who largely import fabrics from the East. A person who sells mobile phone airtime and provides telephone services explained: “I need airtime which I buy through depositing money at the bank. It is automatically loaded to my phones. I then go to my vending stall where I let people use my pay phones at a cost.”
In the focus groups, participants were asked what materials or inputs they buy/acquire and from whom, and what products they sell and to whom. In the process they constructed diagrams of the economic linkages among the group. An example of such a diagram is given in figure 13. This shows the huge diversity of linkages into the formal economy. In this case the big formal suppliers are Clairwood Bulk Market which is the bulk fresh produce market run by the municipality,13 banks, the supplier of fabric and other sewing inputs (KwaMtapuna) but also China Mall, which is a shopping centre close to the beach front that is owned and run by Chinese migrants. These shops specialize in servicing vendors. Small formal retailers are also supported by vendors – in this case Shweta Shop for inputs for hairdressing and AH Shop for inputs for confectioneries and airtime.
13 Farmers sell their fresh produce directly to the bulk market.

35Street Vendors in Durban, South Africa
Figure 13 - Diagram of Economic Linkages
Community
Community Community
Community
KwaMtapuna
China mall
Community
Bank
Clairwood Bulk Market
Shweta Shop
Community
A.H. Shop
STREET VENDOR
Fabric & buttons
Traditional Aprons
AirtimeHairpiece
Hair dressing
Fruits & vegetables
Sweets & airtimeMen &
women’s hats
Source: FG 13, four female and two male street vendors in central city
Focus group participants were asked to draw a map of where they work and then identify where they buy or acquire their materials/inputs and where they sell their products. An example from one focus group is shown in figure 14. This suggests that vendors are frequently traveling extremely long distances to both go to work but also to source their inputs. Consider for example the vendor who sells fresh produce and sources his inputs from the Clairwood Bulk Market. The Market is only 10 kilometres from the inner city by private car but due to a lack of public transport between the market and the inner city, this trader has to route his trip very circuitously entailing much time and expense. A trader in another focus group lives in Adams Mission south of the city. The other group members immediately made comments like, “Oh all your money is spent on travelling. Adams is very far! You have to take a number of taxis to reach the city!” Considered together the spatial maps from all 15 focus groups powerfully demonstrate how apartheid-era urban planning, in which the poor live on the periphery that is poorly serviced by public transport, remains today. Vendors travel long distances from their homes to the city – usually the only source of their supplies, incurring high travel costs they can ill-afford and taking lots of time.

36 IEMS Informal Economy Monitoring Study
Figure 14 - Spatial Map of Economic Linkages
Source: FG 4, three male and three female vendors from central city
3.2 Policy Linkages to City/Urban Planning/GovernmentStreet vendors do contribute to the municipality. One way in which they do so is through the licence and permit fees that they pay. In Durban, the survey findings indicate that street vendors pay a licence fee of R75.18 per month, on average. Women reported that they paid more every month, on average, than men (R76.88 and R64.24 respectively).
Street vendors also pay high stall rental fees. According to a female vendor, “We pay the municipality a lot of money, about R450, for a small space of about 2.5 or 2.4 square metres per month!” (FG 1). This is one of a number of problems reported by several focus group participants in relation to rental payments. Four of the focus groups reported high stall rentals as their main negative driving force. Figure 15 shows the challenges participants experience in terms of rental payments.

37Street Vendors in Durban, South Africa
Figure 15 - Causal Flow Diagram: Rent as a Negative Driving Force
How does this negative force affect your sector?
Impact Response
Increase of rent
We lose tables
No work
No services
No help
We report to the committee
Rent
We don’t know why we are renting
Source: FG 11, five male vendors from central city
Participants reported that they pay rent for their vending sites in the form of permits but the amount is too high with very few benefits (from the municipality) in return. A male vendor, said, “In all fairness, we do not know why we are paying rent because there are no facilities or services worth paying for, simply a white line” (FG 11).
All the participants in the 15 focus groups mentioned the issue of rent as one factor hindering their business – if they fail to pay they are fined and/or stock is confiscated.
Vendors want to benefit from the permit fees that they pay. A female vendor said, “We are paying for permits. The municipality should set aside a Unemployment Insurance Fund (UIF) from the permits fees that we pay so that we will have something when we leave this sector” (FG 12). Another female vendor in the same group agreed with this statement, saying, “Some vendors worked until their last days. I recall that others died while at work because they could not afford to stay at home without income, as there is no UIF in this sector.”
3.3 Contribution to the CityThe final exercise in the focus group discussions was a reflection on the contribution street vendors make to the city. The findings from this are summarized in table 15.
The most frequently cited contribution was to the economy. This was well captured by one participant who said, “We purchase and resell. We contribute to the economy or revenue of the city and country at large” (FG 15). A woman in another group echoed this: “I contribute to the development of the economy when I purchase my stock from the suppliers” (FG 9).
The vendors also pointed out that they are providing a very valuable service – bringing goods close to customers and selling at low prices. As a male participant put it, “We help the community by providing them with their basic needs at affordable prices cheaper and closer to their homes.” Another male vendor in the same group said, “Vendors are important because they bring every good that people need closer to them” (FG 2).
It was noted that vendors create jobs and pay taxes.
In terms of their contribution to the city, crime prevention was cited by 11 of the 15 focus groups. A male participant said, “I also protect the community from thieves and bad people. Our presence on the roads enables those pedestrians to walk freely knowing that they are safe and will not be robbed” (FG 2).

38 IEMS Informal Economy Monitoring Study
Table 15 - Vendors’ Contribution to the City, Summary of Focus Group Findings
Economic Contribution Focus group where the issue is raised, (frequency of response)
Priority
Contribute to the economy Bring goods close to customers Selling at low prices Provide people with their needs Provide jobs Reduce unemployment Pay government taxes Provide jobs to suppliers and farmers Sell quality goods Attract tourists
1, 2, 4, 5, 7, 8, 9, 10, 11, 12, 13, 15 (12)2, 4, 6, 7, 11, 12, 13, 14 (8)4, 6, 8, 9, 12 (5)8, 9, 10, 11 (4)3, 4, 15 (3)11 (1)2, 11 (2)3, 4 (2)3 (1)6 (1)
1345687788
City Contribution
Prevent crime Keep the city clean Attend to accidents Help stranded with transport fareHelp people who are lost Provide temporary storage to customers Paying government taxes
2, 4, 5, 6, 7, 9, 10, 11, 12, 13, 15 (11)7, 8, 9, 11 (4)4, 8, 9 (3)14 (1)5, 12 (2)12, 13 (2)2, 11 (2)
2568777
Social Contribution
Poverty alleviation Give food to poor and hungryWe solve people’s problems
3, 5, 10, 11 (4)4, 14 (2)5 (1)
578
Household contribution
Educate our childrenWe feed our families
14 (1)7 (1)
88
Source: Durban IEMS survey data (2012)
The same sentiment was expressed by a female vendor who said, “My presence is very important because I help in fighting crime, as we are always alert. If thieves try to steal, we run after them, as a result they are also scared of robbing people in front of us. Imagine what would happen without us” (FG 7). Another woman said: “I contribute to my community by helping fight against crime, if a person is being robbed while buying from us, or if it happens in our presence, we make sure that the person responsible gets punished” (FG 5).
They also mentioned that they keep the city clean. A male vendor said, “We clean our vending sites thus keeping the city clean” (FG 11). Other contributions, such as attending to road accidents and helping people who are lost, were also mentioned.
Vendors placed less emphasis on social or household contributions. Four out of 15 focus groups reported that they contribute to alleviating poverty. A female vendor said, “We help fight poverty when we are selling our goods to generate income. Our families no longer suffer from hunger; we are able to provide for our families” (FG 5).
Vendors reported that they also helped the needy. One female vendor said, “I give food to poor and hungry people” (FG 14).
In terms of the contribution to the household, vendors reported that the income they generate in their activities makes a difference in their households as well as the city at large. A female vendor pointed out: “We pay for our children’s education. We have educated children who are now professionals benefitting the city with the skills which were paid for by the money from this sector” (FG 14).

39Street Vendors in Durban, South Africa
Part 4: Key Findings & Policy ImplicationsThis section outlines the key findings from the Durban IEMS street vendor study – household and enterprise characteristics, vendors’ experiences of economic and value chain dynamics and the state and also their organizations and NGOs. The key issues vendors identified that were hindering their businesses are also considered. This lays the foundation for the 10 policy recommendations that stem from this study’s findings.
4.1 Key FindingsThe findings on household characteristics suggest that profits from vending are a key source of household income. Six in every 10 respondents reported that their informal enterprise was the main source of household income while one in every two vendors had no other income earner in the household. The average household size was between four and five people. Further, government cash transfers are being used for enterprise start-up and maintenance. Among survey respondents, 92 per cent reported they received government grants. Vendors often noted they used money from pensions and other cash transfers both to start their business but also to maintain it, particularly in purchasing supplies.
The research shows the huge diversity of goods and services provided by vendors. Vendors are linked into the formal economy – many source their goods there, while just under one in every five female vendors reported selling their goods to formal enterprises. Vendors are also generating employment, with 3 in 10 respondents reporting they had at least one paid employee working for them. The research suggests that turnovers are low – the average vendor in this sample reported a monthly turnover of R2,712. There was a significant difference between men and women, with male vendors reporting a turnover that was more than double their female counterparts.
Vendors seem to be operating in an increasingly difficult economic environment. The majority of respondents said that there was a decline in demand for their products and services but also that there had been an increase in the cost of supplies. They had largely absorbed these increases, saying they were not able to charge higher prices. Further, 9 out of every 10 survey respondents reported they were experiencing increasing competition from new entrants. Vendors also reported an increase in competition from formal retailers. There have been a number of new shopping malls established in both the northern and southern suburbs. All these economic and value chain dynamics combined mean that vendors perceive that it is increasingly difficult to keep their enterprises viable.
Access to essential basic and work-related infrastructure was identified as a critical problem – 56 per cent of vendors surveyed did not have access to a toilet while 21 per cent did not have running water. The situation is worse in the city centre than in the outlying areas. Three in every four vendors interviewed have no shelter so are exposed to rain, sun and wind while they work, while nearly half of all vendors surveyed did not have access to storage. The focus group data shows that when vendors do have access to storage, their goods are often stolen or spoilt while in storage. Table 16 shows findings on access to infrastructure from the other four IEMS cities where surveys were conducted with street vendors. The data suggests that Durban vendors have very poor access to basic amenities in comparison to their counterparts in these other four cities.
Table 16 - Workplace Amenities by City (%)
Running Water Toilet Storage
Accra 86.3 91.2 90.4Ahmedabad 30.4 51.9 52.4Durban 21.5 45.5 60.1
Lima 61.0 95.9 75.3Nakuru 34.8 86.7 91.0Total 47.3 74.6 73.5
Source: Durban IEMS survey data (2012)

40 IEMS Informal Economy Monitoring Study
Access to infrastructure was identified as the major issue hindering vendor businesses. This was cited by 14 of the 15 focus groups.
Police harassment of vendors was reported to be pervasive. Three in every four vendors operating in the periphery and one in every two operating in the centre reported being harassed by the police. The second most serious negative driving force cited by the focus groups (after poor infrastructure) was the police. More than half (53 per cent) of vendors surveyed in Durban identified confiscation of property as an important problem, more than any other city in the IEMS (the average was 32 per cent across the five cities). When goods are confiscated, vendors report that at best their goods are damaged but at worst are not there at all. They note that fines charged are often very onerous but vary from one officer to the next.
National and local government are regarded by the vast majority of vendors as being unhelpful to vending activities. The findings suggest that for many street vendors, the only interaction they have with local government is through harassment and fines at the hands of the police. In the focus groups’ interviews, the police, the municipality in general, and the BSU, in particular were identified as institutions hindering their work. Only two vendors, of the 149 surveyed, reported that they had received help from government.
The study interrogated the role of intermediaries, especially vendor organizations and NGOs. The finding suggests that while there is solidarity among vendors, their organizations are weak. Six in every 10 street vendors surveyed identified “other workers” as helpful, and NGOs were identified as playing a positive role.While 54 per cent of respondents did identify MBOs as helping them, an analysis of the focus group responses to challenges that vendors face reveals that organizations are seldom called upon to resolve critical issues. Further the MBO profiles suggest that vendor organizations have weak internal structures – for example, none of them reported having regular elections.
The study concluded by interrogating vendors’ views on their contribution to the city. Vendors said they help reduce crime and keep the city clean. They bring goods close to customers and sell goods at low prices. The City Manager stated that the municipality collects R36 million rand per annum14 from licencing fees, suggesting that this group is also making a significant contribution to city coffers.
In summary the study found that street vendors have been negatively affected by a harsh economic environment, lack of access to basic and vendor related infrastructure, and a largely hostile state. Although MBOs and NGOs are active among street vendors in Durban, they have only partially ameliorated these negative forces.
4.2 Policy RecommendationsBefore moving on to the specific recommendations, a general point is worth making. Street vendors are an integral part of Durban’s economy and should be viewed as such. A particular view of the city that looks at these vendors as a nuisance in a municipality aspiring to “first world” status not only ignores South Africa’s economic realities but also fails to appreciate the important role played by the informal economy in general and street vendors in particular.
1. Stop police harassment: This study shows that police harassment is pervasive. Many street vendors reported that they feel that they are being treated like criminals. Police actions are inappropriate for the regulation of economic activity at best, and corrupt, at worst. The council needs to investigate the conduct of the police and, in parallel with suggestions outlined below, conduct a retraining program.
2. Draft new street vending bylaws: Durban’s Street Trading bylaws15 were promulgated in 1995, so predate the Informal Economy Policy,16 but also more recent policy commitments like the 2012-7 Integrated Development Plan (IDP).17 The emphasis in the bylaws towards sanction and control is exemplified in the penalty in the case of violation – confiscation of goods and/
14 Interview with City Manager’s Office, 18 June 2013.15 To view these bylaws go to http://www.durban.gov.za/Resource_Centre/Pages/By-Laws.aspx. 16 The Policy (2001:24) specifically suggests a review of bylaws, stating ‘Bylaws should reflect the overall policy move away
from sanction and control, towards support and the creation of new opportunities in a well-managed environment.’.17 See references made to the informal economy in http://www.durban.gov.za/City_Government/City_Vision/IDP/
Documents/Final%20Adopted%20idp%2030%20May%202012.pdf. Mostly notably on page 120 it states that the Informal Economy Policy “forms the basis for appropriate and workable legislation”.

41Street Vendors in Durban, South Africa
or a fine or imprisonment. This is an inappropriate sanction for economic activities. The study shows confiscation of goods has devastating implications for vendor livelihoods and the households which depend on income from street vending. Focus group participants especially reported difficulties paying school fees because of the costs of confiscations, both in terms of stock lost and in terms of the high interest rates they have to pay when borrowing from informal money lenders to replace the lost stock. Further the constitutionality (on the basis of the right to property) of this section of the bylaws is in question.18 A bylaw redrafting process should be initiated.
3. Review the permitting system: While the municipality reports having issued many thousands of permits,19 vendors involved in this study argued more permits were needed. It is suggested that the Council work with vendors area by area, assessing the available public space and together with vendors determining vendor “carrying capacity” and then issuing the appropriate number of permits. (There is precedent in the Warwick Junction Urban Renewal project in general and the re-design of the Brook Street Market in particular – see Dobson and Skinner 2009, chapter 4, for more details.)
Part of this review should include:
• Streamlining permit application and renewal process: Vendors reported that the process of securing and renewing permits was confusing and cumbersome. As part of the review of the permitting system, ways to streamline these processes need to be found.
• Revisiting permit conditions: The requirement that that the permit holder needs to be at his or her stall at all times needs to be removed.
• Revisiting use of permit monies: Currently street trading permit monies – which, as noted contribute R36 million annually to the city – are not ring fenced for further development of the sector. Vendors in one focus group interview suggested that these monies be allocated to social protection systems for vendors. A portion of these monies could also be allocated to improvements in vendors’ working environments.
4. Provide basic and work-related infrastructure: The high proportion of vendors who do not have access to toilets and running water is a concern for the health and well-being of vendors and consumers but also the general public. In conducting the area-based assessment, priority areas where the city needs to provide these facilities should be identified. Shelter from the elements and storage for trading goods are key to the productivity of vendors but also to better functioning and aesthetically pleasing urban environments. Provision of these services should be a priority. Where resources are limited, the city should consider community-public-private partnerships. (See, for example, the case of Bhubaneshwar in India documented by Kumar 2012.)
5. Improve council–vendor relations through regular meetings: Vendors specifically stated they wanted to meet with the municipal staff more regularly to proactively deal with issues. Although the city engages with vendors via the eThekwini Municipality Informal Economy Forum (EMIEF), many vendors point out that the leaders who attend do not represent the majority of vendors (and some even question whether they represent any vendors at all). The city needs to have regular meetings, not only with vendor leaders (who do not represent all vendors) but also with the broader trading community.
6. Provide business support and training: Eighty four per cent of vendors surveyed identified poor access to support centres as a problem. There are existing support services – most notably the Small Enterprise Development Agencies supported by both the eThekwini Municipality and the national Department of Trade and Industry. These support centres need to develop programs that specifically target the vending population.
No relevant training in business skills was identified as a problem by 66 per cent of vendors surveyed. Lacking a marketing strategy was identified by one group of predominantly clothing sellers as their primary problem. The city and/or NGOs working in the sector should consider working with the Department of Labour in general and the Wholesale and Retail
18 The Legal Resources Centre is considering launching a case to challenge this in court. If successful this will be precedent set-ting for the whole country.
19 According to the City Manager’s Office, the city has issued 44,000 vendor licenses (Interview 18 June 2013).
42 IEMS Informal Economy Monitoring Study
Sector Education and Training Association (WRSETA) in particular to design and implement appropriate training for street vendors.
7. Develop trade specific strategies: Street vendors are one point in the continuum of economic activities, with vendors selling different goods operating in different value chains. Understanding where vendors fit into broader value chain dynamics holds the key to more viable and vibrant trading. Building on previous work with, for example, traditional medicine traders and cardboard collectors,20 municipal staff should develop sector based strategies for dominant trades.
8. Strengthen vendor organizations: The capacity of MBOs to organize and assist their members needs to be strengthened. The study findings suggest that attention should be paid to strengthening internal democratic processes. Both membership and leadership might gain from capacity building programmes (including negotiation and conflict resolution skills). Although interviews with MBO leaders identified negotiating with suppliers and facilitating bulk buying as one of their activities, vendors who participated in the study did not make mention of this. Vendors did, however, report what they regarded as unfair competition from foreign vendors (who are known to buy collectively) and suppliers. This is an aspect of MBOs’ work that could be strengthened.
9. Address tensions among foreign and South African vendors: The study unsurprisingly reveals tensions between foreigners (suppliers and vendors) and South African vendors. Local government officials and NGOs working in the sector should consider relationship building interventions. There have been initiatives in Johannesburg where foreign vendors worked with local vendors on business management strategies (e.g. bulk buying and pricing strategies).
10. Consider national policy and legislative review: Street vendors in other South African cities often face similar challenges. There is evidence from Johannesburg21 and Cape Town,22 for example, that vendors are subject to ongoing police harassment. The Durban IEMS case study gives detail to the challenges street vendors face and adds impetus to call for a national policy and legislative review (see Karumbidza 2011, among others). There is useful international precedent in this regard – most notably India’s 2004 National Street Vending Policy that has recently been promulgated into law. (See Sinha and Roever 2011 for a review of the process and content of India’s Street Vending Policy.)
20 See Dobson and Skinner 2009, chapter 3 for a summary of these interventions. 21 See for example “Joburg hawker takes a stand on corrupt cops” Corruption Watch (24 August 2012), (http://www.corrup-
tionwatch.org.za/content/joburg-hawker-takes-stand-corrupt-cops). 22 See for example “Hawkers Challenge Cape Town’s Swoop.” IOL News Online (21 May 2012) by Fatima Schroeder (http://
www.iol.co.za/news/crime-courts/hawkers-challenge-cape-town-s-swoop-1.1301055) and “Railway Security Guards Ac-cused of Burning Down Hawkers Goods,” SA Breaking News (10 May 2013) by Eden Weiss (http://www.sabreakingnews.co.za/2013/05/10/railway-security-guards-accused-of-burning-down-hawkers-goods/).
43Street Vendors in Durban, South Africa
ReferencesChambers, Robert, 1994. “The Origins and Practice of Participatory Rural Appraisal.” World Development, Vol. 22 (7), July, pp. 953-969.
Devenish, A. and Skinner, C. 2006. “Collective Action for those in the Informal Economy: The Case of the Self Employed Women’s Union”, in Ballard, R., Habib, A. and Valodia, I. (eds), Voices of Protest: Social Movements in Post-Apartheid South Africa, University of KwaZulu-Natal Press: Durban.
Devey, Richard, Caroline Skinner and Imraan Valodia. 2006. “The State of the Informal Economy” in Buhlungu, S., Daniel, J., Southall, R. and Lutchman, J. (eds). The State of the Nation, 2005-2006. Cape Town: Human Science Research Council Press.
Dobson, Richard and Caroline Skinner. 2009. Working in Warwick: Including Street Vendors in Urban Plans. Durban: School of Development Studies, University of KwaZulu-Natal.
eThekwini Municipality, 2001. Informal Economy Policy. http://www.durban.gov.za/Documents/Invest_Durban/Business_Support_Market_Unit/INFORMAL%20ECONOMIC%20POLICY%20FINAL%20DOCUMENT.pdf.
eThekiwini Municipality, 2012. Draft Integrated Development Plan. Five Year Plan 2012-17. http://www.durban.gov.za/City_Government/City_Vision/IDP/Documents/Final%20Adopted%20idp%2030%20May%202012.pdf.
International Labour Organization (ILO). 2002. “Women and Men in the Informal Economy: A Statistical Picture.” Available at http://www.ilo.org/public/libdoc/ilo/2002/102B09_139_engl.pdf (accessed December 11, 2012).
Karumbidza, Blessing. 2011. Criminalising the Livelihoods of the Poor: The Impact of Formalising Informal Trading on Female and Migrant Vendors in Durban. Johannesburg: SERI Research Report. Socio-Economic Rights Institute of South Africa (SERI).
Kumar, Randhir. 2012. The Regularization of Street Vending in Bhubaneshwar, India: A Policy Model. WIEGO Policy Brief (Urban Policies) No. 7. Cambridge, MA, USA: WIEGO.
May, J., Phelan, C. and van Schalkwyk. 1997. Street Vendors Survey of the Durban Metropolitan. Report produced for the Durban Metropolitan Council, Economic Development Department.
Moser, Caroline and Jeremy Holland. 1997. Urban Poverty and Violence in Jamaica. Washington, DC: IBRD/World Bank Latin American and Caribbean Studies.
Moser, Caroline and Cathy McIlwaine. 1999. “Participatory Urban Appraisal and Its Application for Research on Violence.” Environment and Urbanization, Vol. 11, No. 2, pp. 203–226.
Moser, Caroline and Cathy McIlwaine. 2004. Encounters with Violence in Latin America. Urban Poor Perceptions from Colombia and Guatemala. New York and London: Routledge.
Moser, Caroline, Angélica Acosta and María Eugenia Vásquez. 2006. Mujeres y paz. Construcción de consensos. Bogota: Social Policy International.
Reform Development Consulting. 2010. “A Census of Street Vendors in eThekwini Municipality.” Report prepared for StreetNet International, Durban.
Rogan, Michael. 2012. “Profile of Street Vendors and Waste Pickers in Durban, South Africa.” IEMS City Profile Report.
Sinha, Shalini and Sally Roever. 2011. India’s National Policy on Urban Street Vendors. WIEGO Policy Brief (Urban Policies) No. 2. Cambridge, MA, USA: WIEGO.
Skinner, Caroline. 2008. “The Struggle for the Streets: Processes of Exclusion and Inclusion of Street Vendors in Durban, South Africa.” Development Southern Africa, 25(2), pp. 227-242.
Skinner, Caroline and Imraan Valodia. 2001. “Globalisation and Women’s Work in South Africa: National and Local Approaches to Economic Transformation.” Agenda, 48, pp. 75-89.
44 IEMS Informal Economy Monitoring Study
Statistics South Africa, 2007. Community Survey: Basic Results for Municipalities. Statistics South Africa: Pretoria. www.statssa.gov.za.
WIEGO website. 2013. “Statistical Picture.” Available at http://wiego.org/informal-economy/ statistical-picture (accessed 01 May 2013).

45Street Vendors in Durban, South Africa
Appendix 1: Profile of Durban Street Vendor Organizations23
This section gives a brief overview of the organizations that vendors involved in this study are members of. The information was gleaned through an initial set of interviews conducted with leaders during the months of May and June; follow up interviews were done over the December 2012 – January 2013 period.
Early Morning Market Traders Association
The Early Morning Market (EMM) is a fresh produce market located in the centre of Warwick Junction, the primary commuter point in inner city Durban. It is fondly known as the “Mother Market” as fresh produce has been sold from the current site for over 100 years. The market was originally a primary distribution point for market gardeners who were former indentured labourers from India. Under apartheid the market was referred to as the Indian Market since licences to operate were only granted to Indian South Africans. The formation of the Early Morning Market Traders Association dates back to the early 1950s. For many years this organization has been the voice of the vendors who are stall owners and their assistants, in raising their issues with the market management who are city officials. The organization also helps vendors in the market maintain good relations and manage disputes.
In 2008 the city approved plans to demolish this market to build a mall. The Early Morning Market Traders Association played an important role in preventing this from happening. They took the City to court, with the help of lawyers. To pay for these services, stall owners, assistants and porters working in the EMM had to contribute a weekly fee. This was seen as a commitment to be part of this organization, even though it was not a subscription to be a member. It is estimated that there are over 2,000 vendors working in this market. Currently the EMMTA operates with 14 members who pay a subscription of R10 per week. The membership is made up of stall owners in the market. This membership functions as a committee that services the whole of the EMM vendor community; this includes around 450 stall owners, 1,500 stall owners’ assistants and about 50 barrow operators.
According to the association’s secretary, EMMTA is in the process of registering as NPO with the Directorate of the Non Profit Sector (Interview, 5 December, 2012). They are currently developing a constitution which will set guidelines for managing and directing the organization. The organization holds monthly meetings with the market officials to discuss the issues of the EMM. They operate their office from the market, and use an unused stall as their office.
Informal Traders Management Board
Informal Traders Management Board (ITMB) was founded in 1995 by vendor committee leaders within the eThekwini Municipality. The purpose of ITMB was to create an umbrella body for all vendor committees and MBOs who represent street vendors in Durban. It was to be an alliance of entities representing street vendors to create one voice, one purpose and one strategy in dealing with the issues and difficulties they were facing as street vendors and particularly when presenting these to the city.
In 2010, ITMB was registered with the Directorate of the Non Profit Sector as a membership-based non-profit organization. The secretary of this organization said during the interview that they have recruited over 2,000 street vendors and estimate that that 70 per cent of these vendors are women. Members pay a once off commitment fee of R20. Members have the right to vote for an executive committee to represent them.
The objectives of the ITMB are to mobilize informal vendors and make them aware of their rights as workers. Further they aim to develop skills and empowerment programmes for the members to be able to grow their businesses. The chairperson of the organization said that the city perceived the ITMB to be troublesome. He felt that vendors were excluded and sidelined in most processes and decisions that concerned informal vendors.
ITMB has regular leadership meetings. It does not have an office from which to operate, so meetings are conducted in hired municipality halls and from places where they trade.
23 This section of the report was drafted by Phumzile Xulu; she is the Project Officer at Asiye eTafuleni and the MBO coordinator for the IEMS in Durban.

46 IEMS Informal Economy Monitoring Study
Masibambisane Traders Organization
Masibambisane Traders Organization (MATO) is registered as a non-profit membership-based organization. This organization was formed in 2007 and was formally launched in 2009. The organization represents street vendors across the region of KwaZulu-Natal. MATO has members in areas in and around Durban – KwaMashu, uMlazi, Pinetown, Verulem, Tongaat, Isipingo and Durban central.
The organization has recruited over 3,000 members in KwaZulu-Natal and has its head office in Durban. Seventy per cent of members are women. Members pay monthly membership fees of R10 deposited directly into the organization’s bank account. Members have rights to vote for an executive committee which then represents them.
Specific strategies and interventions of MATO for its members are:
1. to mobilize informal vendors and educate them on their rights as workers
2. to offer skills development and empowerment programmes
3. to form partnerships and networks that will enable members to progress from informal to small and, in time, large businesses
4. to provide access to material members need to produce their products and bulk buying through the establishment of co-operatives
The South African Informal Workers Association
The South African Informal Workers Association (SAIWA) has its roots in the nine markets of Warwick Junction in Durban. Prior to South Africa hosting the 2010 Soccer World Cup, vendors in Warwick Junction in the inner city of Durban decided they wanted to showcase their market area to local and international tourists. With the support of Asiye eTafuleni tours of the area were initiated.24 A market committee comprised of at least two representatives from each market was established. Asiye eTafuleni arranged a series of capacity building workshops. Through this process, the vendor committee identified a need for a collective voice in order to enable them to address the myriad of challenges they experience on a daily basis. This culminated in the birth of the South African Informal Workers Association in July 2011. This organic worker-centred process is currently led by an interim structure made up of workers from diverse sectors and is registered with the Directorate of the Non Profit Sector as a non-profit association.
SAIWA has its headquarters in Durban and its membership is open to all individual South African informal workers under several categories/sectors who subscribe to SAIWA’s mission, vision and values. SAIWA has recruited 478 paid members; 95 per cent of these members are women. The largest represented sector is arts and crafts, which has 94 per cent of members; out of these members, 97 per cent are women. Other sectors represented are textile, fruit and vegetables, catering and cooked food, tourism, communication, traditional medicine and herbs and fashion and accessories. These members have paid an annual membership fee of R20 and each has a membership card.
According to the information document that SAIWA developed, it has multiple strategies and interventions. They aim to lobby and advocate for the promotion and protection of the rights of informal workers and elevate their status as significant contributors to job creation, social cohesion and economic development. This implies inclusion of informal workers in urban policies, planning, development and management processes. SAIWA also works to develop economically viable and socially empowering sector-specific formations such as cooperatives and to forge unity and cooperation amongst informal workers. They facilitate access to resources, raw materials and bulk purchasing.
The South African Self Employed Women’s Association
The South African Self Employed Women’s Association (SASEWA) is a non-profit women’s association based in KwaZulu-Natal that was formed in November 2008 by ex-members of Self Employed Women’s Union (SEWU).25 The membership is currently made up mainly of street vendors
24 For more information on the Markets of Warwick tours see www.marketsofwarwick.co.za.25 Devenish, A. and Skinner, C. 2006. “Collective Action for those in the Informal Economy: The Case of the Self Employed
Women’s Union”, in Ballard, R., Habib, A. and Valodia, I. (eds), Voices of Protest: Social Movements in Post-Apartheid South Africa, University of KwaZulu-Natal Press: Durban. This book analyzes the rise and decline of SEWU.

47Street Vendors in Durban, South Africa
but it does include women who work in home-based activities such as sewing, farming, recycling, child-minding, home-based care, small contractors and co-operative craft workers. In terms of geographical spread, SASEWA has members in Durban and the surrounding areas of Port Shepstone, Stanger, Hammarsdale, Kokstad, Matatiele, Inchanga, Madadeni and Eshowe. SASEWA operates out of offices in the Durban central business district.
SASEWA currently has about 400 members; each has paid a joining fee of R10 and the association is able to issue membership cards and hold meetings of its membership. Their membership includes street vendors, home-based workers and waste pickers. The association was formed to provide a unified platform for members to empower themselves so that they are able to assert their rights.
Specific strategies and interventions of SASEWA for its members are:
1. improving members’ enterprises by providing members with relevant and appropriate training and development
2. advocating for a more conducive operating environment
3. advocating for and assisting members to obtain greater access to banking services and facilities
4. providing a facility where members can get advice on legal and health issues
Traders Against Crime
According to Dobson and Skinner (2009: 110) in 1996 it was estimated that there were over 50 murders in the Warwick Junction area. During this time a group of vendors formed the TAC and were working together on an entirely voluntary basis to try and deal with the problem of crime and to protect their businesses as well as their customers. These vendors initially operated under very dangerous conditions and had to know how to defend themselves. Initially the methods used by the group to catch criminals were controversial, often violent and almost always illegal.
A concern of TAC members was that the criminals they handed over to the police were often back on the street again within hours. Through liaison with the South African Police Service, the staff of the Warwick Junction Urban Renewal Project working in Warwick Junction realized that there were a number of explanations for this – for example the citizen’s arrest had not been performed correctly or there was insufficient evidence to charge a person. Also the vendors had often assaulted the criminal, so it was difficult to establish who was in the wrong. Police officers feared that they would be accused of the assault. It was clear change was needed and TAC volunteers would have to be made more aware of the rights of suspects and how to apprehend them properly. A bigger police presence was also needed in the area. In conjunction with this project, the South African Police Service and Durban Metropolitan Police organized a training programme for TAC members to explain the rights of both vendors and of all individuals, including crime suspects.
TAC members were also supplied with t-shirts and whistles. For a couple of years a group of 50 operated in Warwick, some patrolling at night. TAC had members in most of the densely traded sites throughout Durban. In 2005 one of the TAC members was stabbed in Warwick and died. Although TAC is still functioning, this event significantly impacted on the morale of members. Initially over 800 vendors volunteered to became members of the TAC. There was no subscription to be a member, just commitment to fight crime at all times.
In 2009 a decision was taken to register the organization as a co-operative and have members pay an annual subscription of R100. To date, there are 60 members who are paying their annual subscription, of which 80 per cent of them are men. TAC does not have an office from which to operate, they conduct their meetings in hired municipality halls and in storage rooms.

48 IEMS Informal Economy Monitoring Study
Appendix 2: Summary of Focus Group Interviews
Focus Groups with Street Vendors: Summary of Application of Sampling Approach
FG no. Date
No. of partici-pants
Sex of partici-pants MBO
Location of vending site
(name)*
City cen-tre versus periphery
Predominant products sold (if applicable)
1 15-08-2012 6 Women SASEWA City Centre & Periphery
Clothing
2 4-07-2012 6 Men TAC Berea Station City Clothing accessories
3 16-08-2012 6 Women SASEWA Beach front and Workshop
City Beads
4 20-08-2012 6 Mixed MATO City Centre & Periphery
Fruits and vegetables
5 21-08-2012 6 Women MATO City Centre & Periphery
Fruits and accessories
6 22-08-2012 5 Men MATO City Centre & Periphery
Music DVDs and CDs
7 23-08-2012 6 Mixed MATO Pinetown City Centre & Periphery
Clothing accessories
8 27-08-2012 6 Men SAIWA Berea Station City Snacks9 28-08-2012 6 Women ITMB Bester Periphery Vegetables10 29-08-2012 6 Mixed ITMB Bester Periphery Snacks11 04-09-2012 5 Men MATO City Centre
& PeripheryClothing accessories
12 06-09-2012 5 Mixed SAIWA Berea City Beaded accessories
13 11-09-2012 6 Mixed SASEWA & ITMB
Different streets in the city
City Cell phone services & accessories
14 12-09-2012 5 Women PPSTA Phoenix Plaza Periphery Fruits and vegetables
15 11-10-2012 4 Mixed EMMTA & BSC
Early Morning market
City Fruits and vegetables
*Note: Location of vending site is left blank for those vending in City Centre & Periphery because they vary.

49Street Vendors in Durban, South Africa
The Informal Economy Monitoring Study (IEMS) is a part of the Inclusive Cities project. Inclusive Cities is a collaboration of membership-based organizations (MBOs) of the working poor, international alliances of MBOs and support organizations working together as partners to improve the situation of the working poor. Launched in late 2008, Inclusive Cities aims to strengthen MBOs in the areas of organizing, policy analysis and advocacy in order to ensure that urban informal workers have the tools necessary to make themselves heard within urban planning processes.
The Informal Economy Monitoring Study is being led by Women in Informal Employment: Globalizing and Organizing – WIEGO (see www.wiego.org) – a global action-research-policy network that seeks to improve the status of the working poor in the informal economy, especially women. WIEGO has convened a Technical Advisory Committee (TAC) to guide the project.
Core Members of the TAC are:
Imraan Valodia (University of KwaZulu-Natal), IEMS Director
Martha Chen (Harvard University), TAC Chair
Sally Roever (WIEGO), IEMS Qualitative Research Coordinator
Michael Rogan (University of KwaZulu-Natal), IEMS Quantitative Research Coordinator
Additional Members of the TAC:
Sonia Dias (WIEGO Waste Sector Specialist and Federal University of Minas Gerais)
Rhonda Douglas (WIEGO Global Projects Director)
Zoe Horn (WIEGO Research Officer, IEMS)
Francie Lund (University of KwaZulu-Natal)
Melanie Samson (WIEGO Africa Waste Picker Programme Coordinator and PARI)
Shalini Sinha (WIEGO Home-based Work Sector Specialist)
Caroline Skinner (WIEGO Urban Policies Programme Director, African Centre for Cities and University of Cape Town)
Caroline Moser, Angélica Acosta and Irene Vance led the development of, and training for, the qualitative modules of the study.