bwm: wetlands restoration carbon economics 10... · bwm: wetlands restoration carbon economics...
TRANSCRIPT

Bringing people with diverse perspectives
together to solve problems they could never
solve by working alone.
BWM: Wetlands Restoration Carbon EconomicsPreliminary Analysis of Herring River Tidal Restoration
Tom Walker
Manomet Center for Conservation Sciences
10 December 2014
ACES Conference 2014

Presentation Outline
• Herring River Case Study Overview
• Social Cost of Carbon—basis for estimating economic benefits of GHG reductions.
• Herring River--preliminary economic assessment of carbon benefits
• Sale of carbon credits—initial insights
• Future refinements to the analysis

Project Overview: Location
National Park Service
Cape Cod National Seashore

4
National Park Service
Cape Cod National Seashore
NO TIDAL
INLETS
Current Herring River “Estuary”
Alewife
Spawning
Habitat
Cape C
od B
ay
Wellfleet Harbor
Duck Harbor
Mill Creek
Pole Dike Creek
Bound Brook

6
National Park Service
Cape Cod National Seashore
Herring River Dike at Chequessett Neck
RIVER SIDE BAY SIDE

Herring River Carbon Fluxes with Tidal Restoration

Social Cost of CarbonBWM Approach to Estimating Methane
Benefits of Tidal Restoration
• Identify appropriate measures of the social cost of carbon—damages per ton of carbon (CO2) released.
• Estimate CH4 emissions change for Herring Creek and convert to CO2
equivalents.
• Apply social cost of carbon to CO2e reductions from Herring Creek project.

Social Cost of Carbon
Integrated Assessment Models
Source: Nordhaus, W. 2013. The Climate Casino. Yale University Press. © William Nordhaus
Climate change
causes economic
damages and
adaptive responses
Rising CO2
concentrations lead
to climate change
Economic growth
leads to CO2
emissions
Climate change
policies reduce
emissions and
economic damages
8
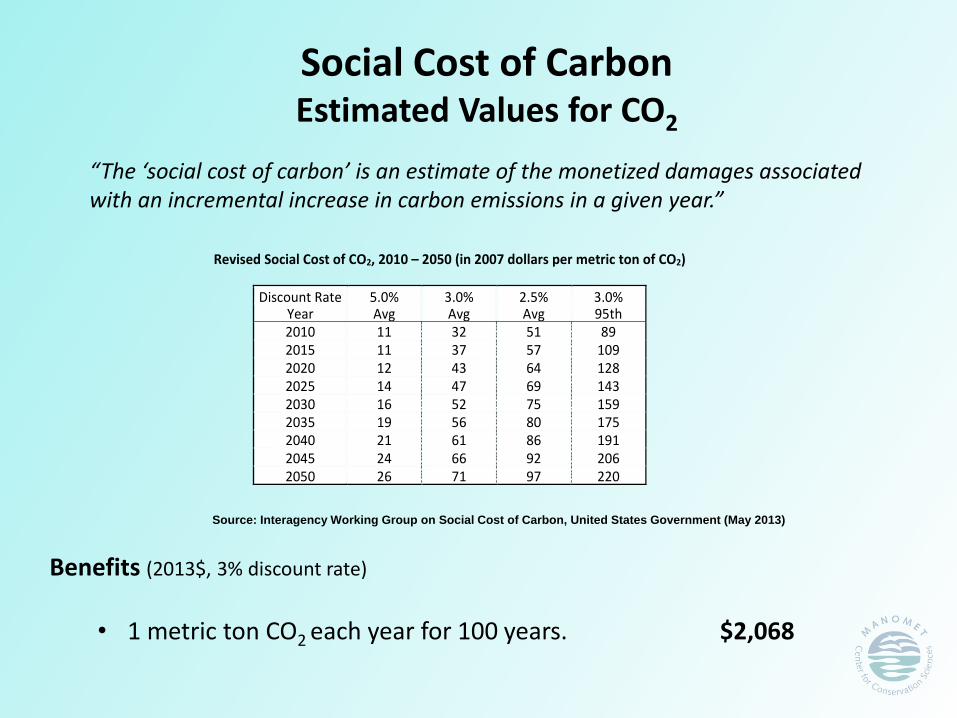
Social Cost of CarbonEstimated Values for CO2
3
Revised Social Cost of CO2, 2010 – 2050 (in 2007 dollars per metric ton of CO2)
Discount Rate 5.0% 3.0% 2.5% 3.0% Year Avg Avg Avg 95th 2010 11 32 51 89 2015 11 37 57 109 2020 12 43 64 128 2025 14 47 69 143 2030 16 52 75 159 2035 19 56 80 175 2040 21 61 86 191 2045 24 66 92 206 2050 26 71 97 220
Source: Interagency Working Group on Social Cost of Carbon, United States Government (May 2013)
Benefits (2013$, 3% discount rate)
• 1 metric ton CO2 each year for 100 years. $2,068
“The ‘social cost of carbon’ is an estimate of the monetized damages associated with an incremental increase in carbon emissions in a given year.”

Preliminary Methane Emission Rates for Herring River Analysis

Herring River Habitat Changes

Herring River—Preliminary Estimate of Social Benefits of Methane Reduction
• More recent literature on social cost of methane emissions suggests GWP method may actually understate benefits.

(Very) Preliminary Thoughts on Marketability of Methane Credits
Herring River
• Investigating feasibility of selling carbon credits from the Herring River project under Verified Carbon Standard (VCS) wetland protocols.
• Social cost of carbon higher than the market price for carbon credits—current credit prices approximately 20-25% of SCC.
• Transaction costs of selling carbon credits substantial, particularly for early entrants to wetland carbon markets.
• Nonetheless, based on carbon flux analyses presented earlier and initial cost analysis, sale of carbon credits from the Herring River project looks promising.
General Considerations
• Acceptance of models or proxy analyses could significantly reduce transaction costs.
• Approaches for aggregating projects will increase the feasibility for smaller projects to sell credits.
Summary of Initial Insights
• Potential exists for significant GHG economic benefits from tidal restoration projects—but needs to be verified through further on-site quantification of carbon fluxes.
• Larger tidal restoration projects may find it economically beneficial to sell carbon credits even given relatively high transaction costs.
• Where selling credits isn’t economically feasible, there’s still the potential for significant societal economic benefits from methane reductions and these should be part of any benefit-cost analysis of tidal restoration projects.
• And last but certainly not least…..don’t forget about all those other non-carbon ecosystem services from restoring coastal marsh—maybe $5,000-$10,000 per hectare per year.
Future Refinements
• Revisit GHG benefits analysis using carbon flux data better tailored to Herring River—including other carbon pools.
• Complete the transaction cost analysis for Herring River to determine potential for credit sales to reduce project costs.