business strategy formulation for market …
TRANSCRIPT

Volume 2 Issue 6 (December 2020) PP. 55-73
DOI 10.35631/AIJBES.26006
Copyright © GLOBAL ACADEMIC EXCELLENCE (M) SDN BHD - All rights reserved
55
ADVANCED INTERNATIONAL JOURNAL OF
BUSINESS, ENTREPRENEURSHIP AND SMES
(AIJBES) www.aijbes.com
BUSINESS STRATEGY FORMULATION FOR MARKET
DEVELOPMENT TO INCREASE SALES REVENUE IN FISH
FEED BUSINESS USING BUSINESS MODEL CANVAS: A CASE
STUDY OF MAKMUR ABADI TAMBAK
Tyalintika Angelinrizki Sari1*, Alibasjah Inggriantara2
1 School of Business and Management, Institut Teknologi Bandung (ITB), Indonesia
Email: [email protected] 2 School of Business and Management, Institut Teknologi Bandung (ITB), Indonesia
Email: [email protected] * Corresponding Author
Article Info: Abstract:
Article history:
Received date: 30.11.2020
Revised date: 16.12.2020
Accepted date: 27.12.2020
Published date: 31.12.2020
To cite this document:
Sari, T. A., & Inggriantara, A. (2020).
Business Strategy Formulation For
Market Development To Increase
Sales Revenue In Fish Feed Business
Using Business Model Canvas: A
Case Study Of Makmur Abadi
Tambak. Advanced International
Journal of Business, Entrepreneurship
and SMEs, 2 (6), 55-73.
DOI: 10.35631/AIJBES.26006.
This work is licensed under CC BY 4.0
Makmur Abadi Tambak is a fish feed sales business that has customers
consisting of small fish pond farmers, medium fish pond farmers, large fish
pond farmers, and small fish pond shops. The research begins by looking for
problems experienced by the company through an interview with the owner
who is at the same time being a manager of the company using the 5 why’s a
method. From the interview results, it was found that the company had a
problem with decreasing in sales revenue in 2011 because its customer who
came from large fish pond farmers left the company due to a change in the
payment system from debt to cash and after that, in the following years the
company experienced fluctuating sales revenue. In order to solve a company
problem, an analysis of the company’s internal and external conditions was
carried out. Analysis of the company’s internal conditions uses the existing
Business Model Canvas (BMC) and sales revenue performance analysis, while
the analysis of the company’s external conditions uses PEST analysis and
Porter’s Five Forces analysis. Analysis of the company’s internal and external
conditions will then be summarized into a SWOT analysis as an input which
will then be entered into the IE Matrix. IE Matrix results show that the
company’s position is in the cell I which results in two strategic choices,
namely intensive strategy and integrative strategy. To get the right strategy for
the company, the two strategies were compared using the QSPM technique and
it was found that the intensive strategy was the right strategy to be implemented
by the company, in the form of market development through opening a new
fish feed store and selling fish feed online through the e-commerce platforms
and social media consisting of Instagram and Facebook.

Volume 2 Issue 6 (December 2020) PP. 55-73
DOI 10.35631/AIJBES.26006
Copyright © GLOBAL ACADEMIC EXCELLENCE (M) SDN BHD - All rights reserved
56
Keywords:
Business Model Canvas, IE Matrix, Management Strategic, Market
Development
Introduction
Based on data reports from the Association of Animal Feed Companies (GPMT), in 2017 the
production of manufactured fish feed only reached 1,555,939 tons, while the need for fish feed
in the same year reached 8,650,260 tons. In 2018 the need for fish feed increased to around
9,667,620 tons and for 2019 the need for fish feed is estimated to increase by around 10,800,960
tons. This fish feed need is for both freshwater fish (Nile Tilapia, Carp, Catfish, Gold Fish, and
Pangas Catfish) and sea water fish (White Snapper, Bawal Bintang, Grouper and Shrimp).
According to Slamet Soebjakto, the KKP’s Director General of Cultivated Fisheries explained
that 41.5% of the total aquaculture production target in 2024 of 22.65 million tonnes is fish and
shrimp commodities that require feed for its achievement. He further explained that the
estimated feed demand from the aquaculture production target in 2024 could reach up to 12 to
13 million tons of feed, therefore support is needed for the availability of fish feed both from
manufacturers and independent fish feed production. The increasing need for manufactured
fish feed can provide opportunities for the business of selling fish feed, including one of the
opportunities that can be exploited by Makmur Abadi Tambak.
Makmur Abadi Tambak is a fish feed sales business that sells various kinds of fish feed which
has four types of customers consisting of small fish pond farmer, medium fish pond farmer,
large fish pond farmer, and small fish pond shop starting in 2007, where prior to 2007 the
company only had two types of customers who came from small fish pond farmers and medium
fish pond farmers. Since having four types of customers that began in 2007, the company has
received increasing sales revenue every year.
Even so, the company still experience unhealthy financial conditions due to delays in debt
repayments made by large fish farming farmers who are far from the deadline for debt payment
provisions. This made the company difficult to buy fish feed from fish feed factories and to
respond this condition, in early 2011, the company decided to change the payment system for
large pond farmers slowly from debt to cash. This change in the payment system resulted in
large pond farmers leaving the company in the middle of 2011 which resulted in a drastic drop
in fish feed sales revenue in 2011 and after 2011 the company experienced fluctuating sales
revenue. The solution to this problem will be the main objective for this research.
Literature Review
Strategic Management
Strategic management is a collection of managerial decisions and actions that can affect the
long-term performance of a company (Wheelen & Hunger, 2012). Meanwhile, according to
David (2011) strategic management is an art and science that is used to formulate, implement,
and evaluate cross-functional decisions that help an organization achieve its goals and it has a
focus on several areas such as management, marketing, finance, and knowledge structures that
are useful in order to understand organizational success. Thus, this makes strategic
management involve important steps such as scanning the environment for information,
selecting the right data and analyzing it, building strategic models, testing, and finally

Volume 2 Issue 6 (December 2020) PP. 55-73
DOI 10.35631/AIJBES.26006
Copyright © GLOBAL ACADEMIC EXCELLENCE (M) SDN BHD - All rights reserved
57
implementing it (Cray and Mallory, 1998). According to Rothaermel (2017) strategic
management consists of three stages, namely the stages of analyzing, formulating, and
implementing, these three stages into one unit to assist managers in planning and implementing
strategies that can enable performance improvements and provide competitive advantages.
Meanwhile, according to Wheelen & Hunger (2012) strategic management consists of four
processes, namely environmental scanning, strategy formulation, strategy implementation,
evaluation and control. According to Chang & Huang (2006), the strategic management
process has three stages, namely strategy formulation, strategy implementation, and strategy
evaluation. Same as the explanation from Chang & Huang (2006), according to David (2011)
in his book Strategic Management: Principles and Cases, the strategic management process has
three series of flows, namely: strategy formulation, strategy implementation, and strategy
evaluation. This research will follow the stages given by David (2011), but due to limitations,
this research will only explain the formulation and strategy implementation strategy, while the
evaluation strategy will not be discussed in this research.
In order to produce a strategy, an analysis of the organization that aims to evaluate the
objectives, situation analysis and planning must be carried out through the strategy formulation
methodology. According to David (2011), strategy formulation includes things such as
determining the vision and mission of a company, identifying opportunities and threats from
the external conditions of a company, identifying the strengths and weaknesses of the internal
conditions of a company, and selecting strategies to be implemented in a company (David,
2011). Sadler (2003) states that the methodology begins with the formulation of strategic
planning which can be defined as a way to diagnose and analyze current competitive positions
and strategic issues affecting the company. The formulation of strategic planning must be used
as a guide in visualizing what the company wants to achieve and how a company can achieve
it. Steps taken in making the correct formulation of strategic planning is to identify the
company’s current competitive position and market so that this can guide the company to have
a better fate. After a number of strategies have been chosen at the formulation stage, this stage
allows a firm to set annual goals, create procedures, empower staff and assign resources so that
formulated strategies can be implemented. In the strategy implementation, effective execution
of the plan relies on the ability of managers to inspire workers, which is more an art than a
method.
Strategy Formulation Analysis Framework
The strategy formulation technique is divided into three stages which are useful for making
decisions consisting of the input stage, the matching stage, and the decision stage. These
techniques can be implemented at all sizes and types of organizations, making it easier for
strategists to identify, evaluate, and choose strategies.
Stage 1: The Input Stage
According to David (2011), the input stage is the first stage of the analytical process strategy
formulation, which attempts to summarize the essential input details required to establish the
strategy. Tehrani (2017), the input stage is a stage to summarize the basic information that must
be taken which aims to evaluate all strategic factors, detect, and prioritize according to the level
of importance and significance. Techniques at the input stage used in this research are:
• Internal Factors Evaluation (IFE) Matrix
IFE Matrix is a strategic analysis tool that is useful for summarizing the internal
condition of an organization (Capps & Glissmeyer, 2012) and can also be used to

Volume 2 Issue 6 (December 2020) PP. 55-73
DOI 10.35631/AIJBES.26006
Copyright © GLOBAL ACADEMIC EXCELLENCE (M) SDN BHD - All rights reserved
58
evaluate the weaknesses and strengths of the organization. According to Arabi (2006),
IFE offers diagnosis from all companies with different functions.
• External Factors Evaluation (EFE) Matrix
According to (Chladkova & Formankova, 2016), the EFE Matrix aims to summarize
and evaluate external factors in the form of opportunities and threats that influence the
company negatively or positively. Katsioloudes & Abouhanian (2016), EFE Matrix can
be useful to be able to summarize and evaluate economic, social, cultural, demographic,
government, legal, technology, and competition information that can provide
significant benefits or disadvantages to organizations in the future. Meanwhile,
according to Pratiwi et al., (2017) provide a suggestion about the EFE Matrix with the
aim of evaluating the spin-off of a company as a result that the company has more
strengths than weaknesses when the EFE value is > 2.5.
Stage 2: The Matching Stage
The matching stage focuses on the ability to establish effective alternative strategies by
changing the key external and internal variables. The internal-external (IE) matrix will be used
in the stage 2 of this research. According to Allen (1977), the IE Matrix is a tool that aims to
evaluate an organization by taking into account internal factors (strengths and weaknesses) and
external factors (opportunities and threats). The IE matrix is based on the information obtained
from the IFE and EFE matrices which will then place the results of each matrix into one of the
nine quadrants in the IE matrix. The IE matrix has two main dimensions: the x-axis which is
the total IFE weight score and the y-axis is the total EFE weight score (David, 2011: 188).
Stage 3: The Decision Stage
According to David (2011), the third stage involves only one technique called the Quantitative
Strategic Planning Matrix (QSPM). QSPM works by including the analysis obtained from the
first stage and the corresponding results from the second stage which will then objectively
decide the appropriate strategy from the available strategies. Conceptually, QSPM is a tool that
aims to determine the relative attractiveness of various strategies based on the extent to which
the main external and internal critical success factors are utilized. The relative attractiveness of
each strategy in a set of alternatives is determined by evaluating the overall influence of each
external and internal critical success factor.
Market Development
Market development is one of the strategies of the Ansoff matrix developed by H. Igor Ansoff
published in the Harvard Business Review in 1957 in which this strategy focuses on entering
new markets while still using existing products. According to Hussey (2007), market
development allows quite high synergy because development here can generally provide
economies of scale in production and general management. Market development includes an
identifier for a product or service for a new geographic area (David, 2011). There are various
ways to achieve a market development strategy, such as by expanding the market to a new
geographic area either abroad or to a new city, creating new distribution channels, create new
dimensions or packaging for existing products as a whole in the new market, and creating
different pricing in order to attract new customers (Team FME, 2013).
PEST Analysis
PEST analysis is a framework that provides categories and analysis for a series of important
external factors consisting of politics, economy, socio-culture, technology, ecology, and law,
where these factors can be both opportunities and threats for companies (Rothaermel, 2017:

Volume 2 Issue 6 (December 2020) PP. 55-73
DOI 10.35631/AIJBES.26006
Copyright © GLOBAL ACADEMIC EXCELLENCE (M) SDN BHD - All rights reserved
59
67). According to Ward & Peppard (2002), PEST analysis is used with the aim of being able
to assess the market of a business unit or organization.
Porter’s Five Forces Analysis
Porter’s five forces analysis is a framework that can be used to identify five strengths consisting
of rivalry among existing competitors, threat of new entrants, threat of substitute product,
bargaining power of suppliers, and bargaining power of buyers, which can determine the
potential benefits of an industry and can shape the company’s competitive strategy
(Rothaermel, 2017: 73). The intensity of competition between companies varies greatly
between industries, where the intensity of competition between companies is highest usually
occurs in industries with low income (David, 2011). In such a condition, the impact is that the
market is clearly unattractive from the point of view of profit-seeking purposes, new
competitors can easily enter the industry and there is considerable bargaining from both
suppliers and customers.
Business Model Canvas (BMC)
The business model canvas is a business model that demonstrates the reasoning for how a
company produces, delivers and collects value (Osterwalder and Pigneur, 2010). This business
model canvas comes from a summary analysis of external conditions (PEST and Porter’s Five
Forces) and the company’s internal conditions (existing business model canvas and sales
revenue performance analysis).
Sales Revenue Performance Analysis
Financial condition is generally considered to be the best measure of a company’s competitive
position and can determine the strengths and weaknesses of an organization’s financial
strengths to make effective strategy formulation (David, 2011:188). This research will discuss
the conditions of sales revenue earned by the company.
SWOT Analysis
SWOT is an acronym that stands for Strengths, Weaknesses, Opportunities, and Threats.
SWOT analysis is a framework that can be used to synthesize the knowledge obtained from
internal analysis which provides information about the strengths and weaknesses of the
company and external analysis which provides information about opportunities and threats
from outside the company, which are carried out to obtain strategic implications. (Rothaemel,
2017: 130). According to Wheelen & Hunger (2012), the external condition of the company
which consists of opportunities and threats originating from outside the organization so that in
general it cannot be controlled by short-term top management, where these variables describe
the context in which a corporation is located. Meanwhile, the internal condition of the company
which consists of strengths and weaknesses comes from within the organization so that this can
be controlled by short-term top management where these variables create a context regarding
how the work should be done which includes the structure, culture and resources of a company.
Conceptual Framework
The conceptual framework is a brief description of the chronological phase of the study.
According to McGaghie et al. (2001), the conceptual framework “sets the stage” for the
presentation of the actual research issue that triggers the investigation is followed by the
assertion of the event. The problem statement of the thesis provides the context and the
problems that prompted the researcher to carry out the analysis. The following is the conceptual
framework that will be used in this research:

Volume 2 Issue 6 (December 2020) PP. 55-73
DOI 10.35631/AIJBES.26006
Copyright © GLOBAL ACADEMIC EXCELLENCE (M) SDN BHD - All rights reserved
60
Figure 1: Conceptual Framework
Source: Author, 2020
Research Methodology
Research methodology is a scientific method used to obtain data that will be used for research
purposes. This research will use a qualitative research methodology with quantitative data to
support the statements in the qualitative data. Qualitative research methodology is a research
methodology based on philosophy for researching scientific or experimental conditions where
researcher as a instruments and data collection techniques are analyzed qualitatively which
emphasizes more on meaning (Sugiyono, 2018). This research uses primary data obtained
through interviews with company owner who is also being manager and secondary data is also
used in this research to support the problems faced and other findings from primary data.
Secondary data were obtained from several sources such as text books, articles and research
publications.
The interview will be carried out with the owner who is also being the manager of Makmur
Abadi Tambak to determine the current external condition of the company using PEST analysis
and Porter’s Five Forces analysis as well as the current internal condition of the company using
the existing Business Model Canvas (BMC) and sales revenue performance analysis which will
then be summarized into a SWOT analysis. Not only that, this interview also continues to be
able to give weight and rating to the EFE matrix and IFE matrix so that then an IE matrix can
be obtained which is useful for determining where the company’s current position is and what
business strategies are available for the company according to the position where the company
is located. The business strategy options available for the company will then be further
analyzed using a tool called the Quantitative Strategic Planning Matrix (QSPM) to determine
which business strategy is the right for the company to be implemented by giving weight and

Volume 2 Issue 6 (December 2020) PP. 55-73
DOI 10.35631/AIJBES.26006
Copyright © GLOBAL ACADEMIC EXCELLENCE (M) SDN BHD - All rights reserved
61
rating by the owner who is at the same time be the manager of Makmur Abadi Tambak who
will be conducted through interviews.
From figure 1 above, it can be shown that the first step of the conceptual framework is to define
business issue, the business issue is collected by doing interview with top management of the
company. After knowing the business issue, next step is analysing. This research will analyse
external factors and internal factors of the company. The external factors that can be obtained
through PEST analysis and Porter’s five forces, while to conduct internal factors, the researcher
using existing business model and sales revenue performance analysis to explain the
company’s financial condition. Furthermore, the internal and external analysis will be included
in the SWOT as input for the IE Matrix and after selecting the right solution for the company,
the next step is to create a new business model canvas for the company.
Results and Discussion of Findings
PEST Analysis
Table 1: PEST Analysis Summary
PEST Low Medium High
Political – Legal Factors Opportunity
Economic Factors Opportunity
Sociocultural Factors Opportunity
Technological Factors Threat
Source: Author, 2020
PEST analysis is a framework used to analyze the external conditions of a company. PEST
analysis in this research was divided into three categories, namely low, medium, and high.
From the table above, it can be known that overall the four PEST analysis factors consisting of
political-legal factors, economic factors, sociocultural factors, and technological factors are
included into the high category. The four factors from this PEST analysis can create
opportunities as well as threats for the company. From the research results obtained, three of
the four factors consisting of political-legal, economic, and sociocultural factors create
opportunities for companies, while one other factor from PEST analysis that comes from
technological factors creates a threat to the company. A more detailed explanation of the
opportunities and threats from this PEST analysis will be explained in the SWOT analysis
section.
Porter’s Five Forces Analysis
Table 2: Porter’s Five Forces Analysis Summary
Five Key Competitive Forces Low Medium High
Rivalry Among Existing Competitors Opportunity
Threat of New Entrants Opportunity
Threat of Substitute Product Opportunity
Bargaining Power of Suppliers Opportunity
Bargaining Power of Buyers Threat
Source: Author, 2020

Volume 2 Issue 6 (December 2020) PP. 55-73
DOI 10.35631/AIJBES.26006
Copyright © GLOBAL ACADEMIC EXCELLENCE (M) SDN BHD - All rights reserved
62
Similar to PEST analysis, Porter’s Five Forces analysis is used as a framework to analyze the
company’s external conditions which can create opportunities as well as threats for the
company. There are three categories for the assessment of each of the forces from Porter’s five
forces consisting of low, medium, and high categories. From the summary table of Porter’s
five forces analysis above, it can be known that rivalry among existing competitors, threat of
new entrants, and threat of substitute product are included in the low category or it can be said
that these three forces create opportunities for the company. Meanwhile, the other two forces,
consisting of power of suppliers and bargaining power of buyers, can be included in the
medium category. Even though the two forces are categorized as medium, both have different
impacts for the company where the bargaining power of suppliers creates opportunities for the
company, while the bargaining power of buyers poses a threat to the company. The
opportunities and threats of this Porter’s five forces will be explained in more detail in the
SWOT analysis section.
The Existing Business Model Canvas (BMC)
Figure 2: Existing Business Model Canvas (BMC) of Makmur Abadi Tambak
Source: Author, 2020

Volume 2 Issue 6 (December 2020) PP. 55-73
DOI 10.35631/AIJBES.26006
Copyright © GLOBAL ACADEMIC EXCELLENCE (M) SDN BHD - All rights reserved
63
The existing business model canvas above is used as a tool to analyze the internal conditions
of the company where the company will then be able to find out its strengths and weaknesses
at the same time. Similar to the framework used to analyze the external conditions of the
company, the tools or frameworks used to analyze the internal conditions of the company are
divided into three categories consisting of low, medium, and high categories. From the analysis
of the existing business model canvas obtained through interviews with the owner who is also
the manager of the company, it can be known that the six elements of the nine elements of the
business model canvas fall into the high category or in other words, these are the strengths for
the company, the six elements of this business model canvas consist of Customer Relationships,
Value Propositions, Key Activities, Key Resources, Key Partners, and Cost Structure. While
the other three elements consisting of Customer Segments, Channels, and Revenue Streams are
classified into the low category or it can be said that those three elements are the weaknesses
of the company. The strengths and weaknesses obtained from the existing business model
canvas will then be included in the SWOT analysis.
Sales Revenue Performance Analysis
Figure 3: Sales Revenue Performance of Makmur Abadi Tambak
Source: Author, 2020
From the figure above, it can be seen that the sales revenue earned by Makmur Abadi Tambak
from 2007 to 2010 has increased every year, this is because since 2007 Makmur Abadi Tambak
started to change its business model by developing customer segments to the part of large fish
pond farmers and small fish pond shops, so that since 2007 where Makmur Abadi Tambak has
four types of customers that consisting of small fish pond farmers, medium fish pond farmers,
large fish pond farmers, and small fish pond shops, where before 2007 Makmur Abadi Tambak
business customers only came from small fish pond farmers and medium fish pond farmers.

Volume 2 Issue 6 (December 2020) PP. 55-73
DOI 10.35631/AIJBES.26006
Copyright © GLOBAL ACADEMIC EXCELLENCE (M) SDN BHD - All rights reserved
64
The payment system made by these four customers are different where the cash payment
system is applied to small fish pond farmers, medium fish pond farmers, and mostly small fish
pond shops while the debt payment system is applied for large fish pond farmers and several
small fish pond shops. Even though the company has a fairly sufficient number of customers
for each month, this business still finds an unhealthy financial condition due to delays in
customer payments made by large fish pond farmers. After continuously experiencing
unhealthy financial condition, even if seen from the sales revenue graph above where from
2007 to 2010, Makmur Abadi Tambak’s income increased, but in fact the debt owed by large
fish pond farmers is large so that the company experiences difficulties in buying fish feed from
the factories because the money they have is stuck in the large fish pond farmers.
Due to this unhealthy financial condition, finally Makmur Abadi Tambak in early 2011 decided
to slowly change its business model which would only sell fish feed using cash payment
methods for both small fish pond farmers, medium fish pond farmers, mostly small fish ponds,
and large fish pond farmers which has resulted in Makmur Abadi Tambak’s sales revenue
starting to decline in 2011. Meanwhile, for several small fish pond shops, which still use a “pay
money-send fish feed” payment system, which means that small fish pond shops have to pay
their old debts first, then Makmur Abadi Tambak will send new orders for small fish pond
shops by giving them new debts. In the middle of 2011, Makmur Abadi Tambak stopped total
sales with a debt system payment for large pond farmers so that in the middle of 2011 where
Makmur Abadi Tambak has 3 customer segments that consisting of small fish pond farmers,
medium fish pond farmers, and small fish pond shops. Makmur Abadi Tambak’s sales revenue
continued to decline from 2012 to 2014, where the sales revenue decreased drastically from
the sales revenue of Rp 9,007,000,000 in 2013 to Rp 3,588,500,000 in 2014 or in other words,
the sales revenue in 2014 decreased by 60.16% from the sales revenue in 2013.
This decline hasn’t been overcome by Makmur Abadi Tambak for 4 years, this sharp decline
in sales revenue actually could be minimized by Makmur Abadi Tambak if the company has a
marketing team to market fish feed products to attract more buyers to buy the fish feed,
considering that so far the company has only relied on the strength of its word of mouth to
market the sale of fish feed from past buyers who make repeat orders or from old buyers who
then told to their family or friends who were both fish pond farmers who ended up buying fish
feed at Makmur Abadi Tambak. However, even though the sales revenue that Makmur Abadi
Tambak earned decreased very sharply from 2011 to 2014, Makmur Abadi Tambak business
was still able to survive because it had financial backups from family finance. In 2015, slowly,
Makmur Abadi Tambak’s sales revenue began to increase and continued to increase again in
2016. Even though after that the sales revenue began to decrease by around 28.4% in 2017
when compared to the sales revenue in 2016. This decline continued until 2018 although the
amount of the decline in sales revenue in 2018 was not too large compared to 2017. In 2019,
Makmur Abadi Tambak’s sales revenue began to increase to Rp 9,913,580,000 from what
previously in 2018 Makmur Abadi Tambak’s sales revenue was Rp 8,483,140,000.

Volume 2 Issue 6 (December 2020) PP. 55-73
DOI 10.35631/AIJBES.26006
Copyright © GLOBAL ACADEMIC EXCELLENCE (M) SDN BHD - All rights reserved
65
SWOT Analysis
Table 3: SWOT of Makmur Abadi Tambak
Strengths Weaknesses
• Long term relationship with customers
(BMC)
• Providing various brands of fish feed to
suit the purchasing power of different
customers (BMC)
• Providing competitive prices for each
brand of fish feed (BMC)
• Providing consultations for customers
(BMC)
• Receiving delivery of fish feed to the
buyer’s destination (BMC)
• Top management level comes from
families who have a good education
background (BMC)
• Workers who are loyal and have very
strong stamina (BMC)
• Family financial backups (BMC and
Sales Revenue Performance Analysis)
• Good connections to various kinds of
fish feed factories (BMC)
• The cost structure is managed
efficiently and effectively (BMC)
• Has fewer types of customers (BMC)
• Using mouth power as the main tool for
marketing fish feed products (BMC)
• Doesn’t have a marketing division
(BMC and Sales Revenue Performance
Analysis)
Opportunities Threats
• Easy political-legal requirements
(PEST)
• Support from Indonesia’s economic
growth, Fishery GDP, and Aquaculture
production (PEST)
• The incessant GEMARIKAN program
or the Movement to Popularize Fish
Eating program (PEST)
• Loose rivalry among existing feed fish
business competitors (Five Porter’s
Forces)
• Complicated for new entrants to enter
the market in order to sell fish feed
(Five Porter’s Forces)
• Only one substitute products (Five
Porter’s Forces)
• Various types of fish feed brands (Five
Porter’s Forces)
• Technological developments that cause
the number of competitors to increase
(PEST)
• Medium bargaining power of buyers
(Five Porter’s Forces)
Source: Author, 2020

Volume 2 Issue 6 (December 2020) PP. 55-73
DOI 10.35631/AIJBES.26006
Copyright © GLOBAL ACADEMIC EXCELLENCE (M) SDN BHD - All rights reserved
66
The table above describes the SWOT analysis which is a summary of the results obtained from
an analysis of the company’s internal and external conditions. Analysis of the company’s
internal conditions is carried out using the existing business model canvas and sales revenue
performance analysis, which allows the company to find out its strengths and weaknesses.
Meanwhile, the analysis of the company’s external conditions is carried out using PEST
analysis and Porter’s five forces analysis, which can create opportunities as well as threats for
the company. This SWOT analysis will then be entered into the EFE matrix and the IFE matrix
as input by giving weight and rating to each factor that will be given by the owner who is also
the manager of the company.
EFE Matrix
Table 4: EFE Matrix for Makmur Abadi Tambak
Opportunities Weight Rating Weighted
Score
O1 Easy political-legal requirements 0.114 3 0.342
O2
Support from Indonesia’s economic
growth, Fishery GDP, and Aquaculture
production
0.276 4 1.104
O3
The incessant GEMARIKAN program or
he Movement to Popularize Fish Eating
program
0.114 3 0.342
O4 Loose rivalry among existing feed fish
business competitors 0.033 3 0.099
O5 Hard for new entrants to enter the market 0.033 3 0.099
O6 Only one substitute products 0.114 4 0.456
O7 Various types of fish feed brands 0.168 4 0.672
Threats Weight Rating Weighted
Score
T1 Technological developments that cause the
number of competitors to increase 0.114 1 0.114
T3 Medium bargaining power of buyers 0.034 3 0.102
Total Score 1.000 3.330
Source: Author, 2020
Opportunities and threats in the SWOT analysis will then be used as input to be entered into
the EFE matrix by providing weight and rating. From the table above, it can be seen that the
results of the EFE matrix are 3.330 where the results of the EFE matrix can be categorized as
a high category which indicates that the company’s external condition is quite promising.
Volume 2 Issue 6 (December 2020) PP. 55-73
DOI 10.35631/AIJBES.26006
Copyright © GLOBAL ACADEMIC EXCELLENCE (M) SDN BHD - All rights reserved
67
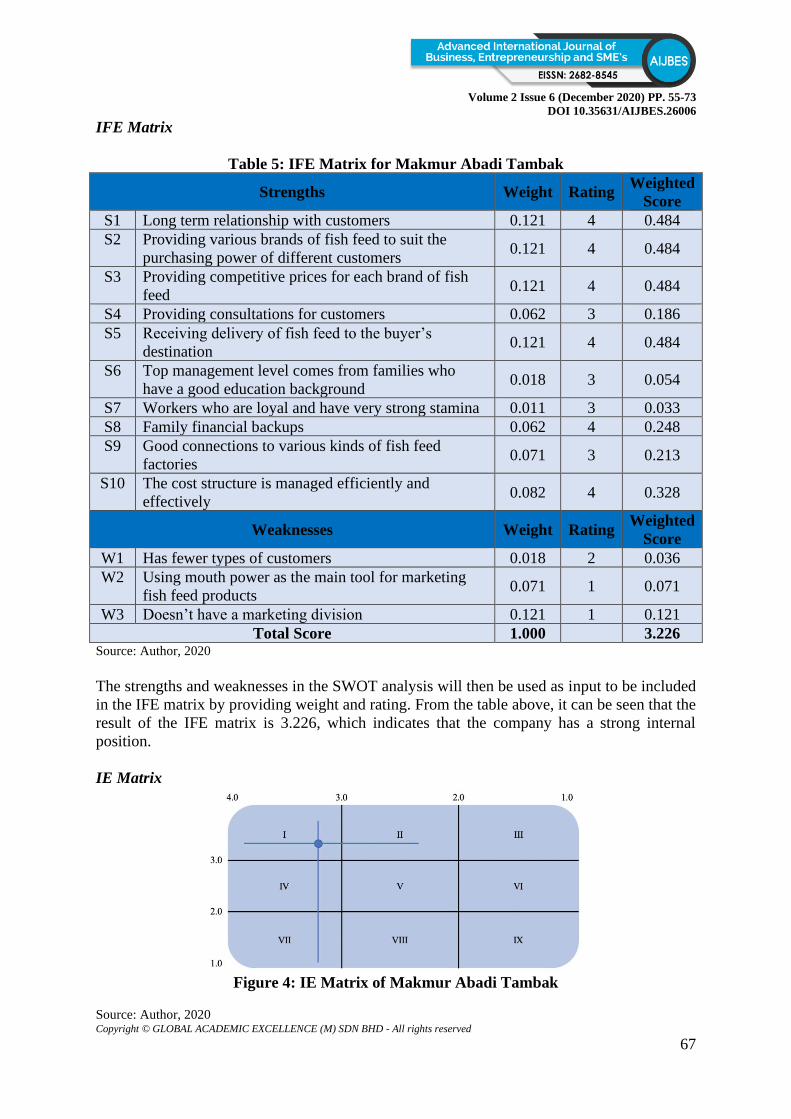
IFE Matrix
Table 5: IFE Matrix for Makmur Abadi Tambak
Strengths Weight Rating Weighted
Score
S1 Long term relationship with customers 0.121 4 0.484
S2 Providing various brands of fish feed to suit the
purchasing power of different customers 0.121 4 0.484
S3 Providing competitive prices for each brand of fish
feed 0.121 4 0.484
S4 Providing consultations for customers 0.062 3 0.186
S5 Receiving delivery of fish feed to the buyer’s
destination 0.121 4 0.484
S6 Top management level comes from families who
have a good education background 0.018 3 0.054
S7 Workers who are loyal and have very strong stamina 0.011 3 0.033
S8 Family financial backups 0.062 4 0.248
S9 Good connections to various kinds of fish feed
factories 0.071 3 0.213
S10 The cost structure is managed efficiently and
effectively 0.082 4 0.328
Weaknesses Weight Rating Weighted
Score
W1 Has fewer types of customers 0.018 2 0.036
W2 Using mouth power as the main tool for marketing
fish feed products 0.071 1 0.071
W3 Doesn’t have a marketing division 0.121 1 0.121
Total Score 1.000 3.226 Source: Author, 2020
The strengths and weaknesses in the SWOT analysis will then be used as input to be included
in the IFE matrix by providing weight and rating. From the table above, it can be seen that the
result of the IFE matrix is 3.226, which indicates that the company has a strong internal
position.
IE Matrix
Figure 4: IE Matrix of Makmur Abadi Tambak
Source: Author, 2020
Volume 2 Issue 6 (December 2020) PP. 55-73
DOI 10.35631/AIJBES.26006
Copyright © GLOBAL ACADEMIC EXCELLENCE (M) SDN BHD - All rights reserved
68
The results of the EFE matrix and IFE matrix will then be entered into the IE matrix to
determine the position of Makmur Abadi Tambak company. After entering the EFE matrix of
3.330 into the y-axis and the IFE matrix of 3.226 into the x-axis, the position of the Makmur
Abadi Tambak is obtained in cell I. Thus, according to Fred R. David in his book entitled
Strategic management: concepts and cases where the most appropriate strategy that must be
carried out by the company are intensive strategy (market penetration, market development,
and product development) or integrative strategy (backward integration, forward integration,
and horizontal integration). To be able to choose which strategy is right for the company to
implement, the QSPM technique will be implemented.
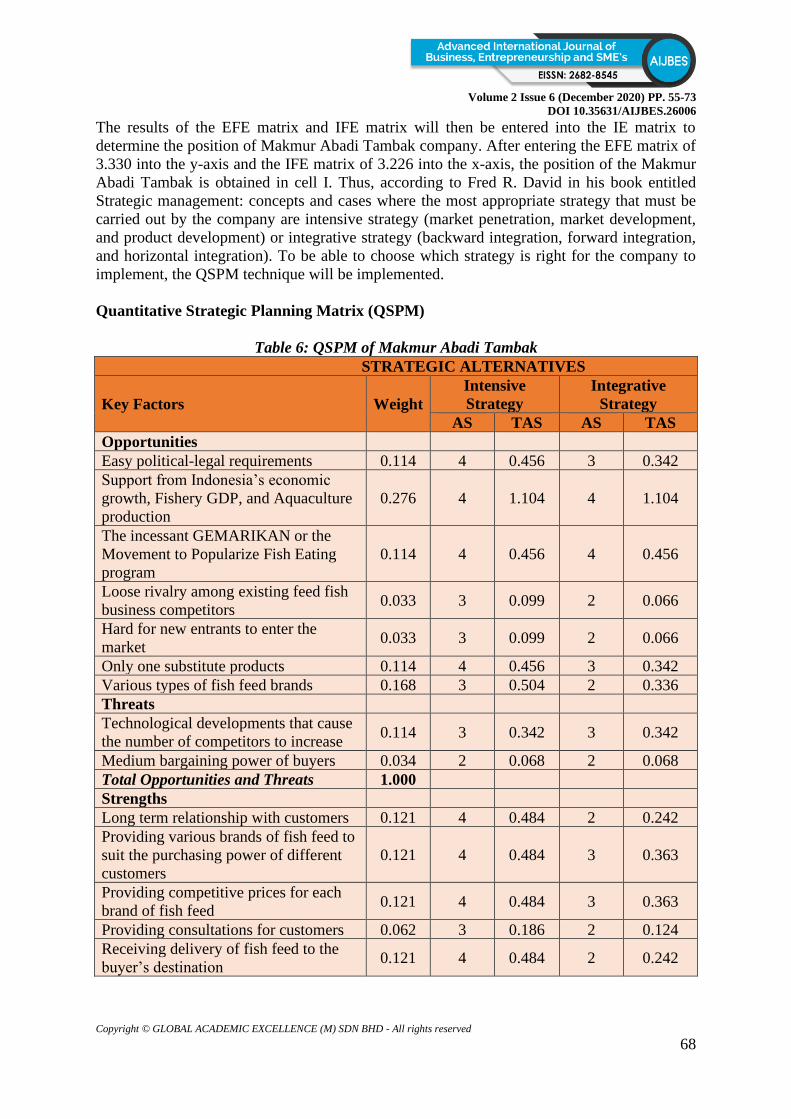
Quantitative Strategic Planning Matrix (QSPM)
Table 6: QSPM of Makmur Abadi Tambak
STRATEGIC ALTERNATIVES
Key Factors Weight
Intensive
Strategy
Integrative
Strategy
AS TAS AS TAS
Opportunities
Easy political-legal requirements 0.114 4 0.456 3 0.342
Support from Indonesia’s economic
growth, Fishery GDP, and Aquaculture
production
0.276 4 1.104 4 1.104
The incessant GEMARIKAN or the
Movement to Popularize Fish Eating
program
0.114 4 0.456 4 0.456
Loose rivalry among existing feed fish
business competitors 0.033 3 0.099 2 0.066
Hard for new entrants to enter the
market 0.033 3 0.099 2 0.066
Only one substitute products 0.114 4 0.456 3 0.342
Various types of fish feed brands 0.168 3 0.504 2 0.336
Threats
Technological developments that cause
the number of competitors to increase 0.114 3 0.342 3 0.342
Medium bargaining power of buyers 0.034 2 0.068 2 0.068
Total Opportunities and Threats 1.000
Strengths
Long term relationship with customers 0.121 4 0.484 2 0.242
Providing various brands of fish feed to
suit the purchasing power of different
customers
0.121 4 0.484 3 0.363
Providing competitive prices for each
brand of fish feed 0.121 4 0.484 3 0.363
Providing consultations for customers 0.062 3 0.186 2 0.124
Receiving delivery of fish feed to the
buyer’s destination 0.121 4 0.484 2 0.242

Volume 2 Issue 6 (December 2020) PP. 55-73
DOI 10.35631/AIJBES.26006
Copyright © GLOBAL ACADEMIC EXCELLENCE (M) SDN BHD - All rights reserved
69
Top management level comes from
families who have a good education
background
0.018 3 0.054 2 0.036
Workers who are loyal and have very
strong stamina 0.011 2 0.022 2 0.022
Family financial backups 0.062 4 0.248 4 0.248
Good connections to various kinds of
fish feed factories 0.071 3 0.213 4 0.284
The cost structure is managed
efficiently and effectively 0.082 4 0.328 4 0.328
Weaknesses
Has fewer types of customers 0.018 2 0.036 3 0.054
Using mouth power as the main tool for
marketing fish feed products 0.071 2 0.142 3 0.213
Doesn’t have a marketing division 0.121 2 0.242 3 0.363
Total Strengths and Weaknesses 1.000
Total 6.991 6.004
Source: Author, 2020
Conceptually, QSPM is a tool that aims to determine the relative attractiveness of various
strategies based on the extent to which the main external and internal critical success factors
are utilized. The relative attractiveness of each strategy in a set of alternatives is determined by
evaluating the overall influence of each external and internal critical success factor. From the
table above, the results show that the intensive strategy is the right strategy that must be
implemented by the company compared to the integrative strategy. This is because the
intensive strategy has a high total of 6.991 compared to the integrative strategy which has a
total of 6.004.
This intensive strategy can be carried out through market penetration, market development or
product development. From the three strategies offered by this intensive strategy, the market
development strategy is the most appropriate strategy for the company to implement. This
happens considering that the company has sold many brands of fish feed and besides that the
company has also provided competitive prices for each brand of fish feed, so it would be wise
if the company could expand its market share by opening branches in other area that have high
demand for fish feed while continuing to sell many existing brands of fish feed and starting to
sell these existing brands of fish feed to new markets through an online sales system.

Volume 2 Issue 6 (December 2020) PP. 55-73
DOI 10.35631/AIJBES.26006
Copyright © GLOBAL ACADEMIC EXCELLENCE (M) SDN BHD - All rights reserved
70
Proposed a New Business Model Canvas (BMC)
Figure 5: Proposed a New Business Model Canvas for Makmur Abadi Tambak
Source: Author, 2020
The figure above is a new business model canvas proposed to the company in overcoming the
problems faced by the company regarding the drastic decline in sales revenue in 2011 and after
2011 where the company experienced fluctuating sales revenue. This new business model
canvas is needed as a guideline for the company to implement new strategies through market

Volume 2 Issue 6 (December 2020) PP. 55-73
DOI 10.35631/AIJBES.26006
Copyright © GLOBAL ACADEMIC EXCELLENCE (M) SDN BHD - All rights reserved
71
development consisting of a new store opening and online sales (e-commerce platforms,
Instagram, and Facebook).
From the new business model canvas, there are changes to the eight elements of the business
model canvas, with the exception of the customer segments element where the company has
customers who still come from small fish pond farmers, medium fish pond farmers, and small
fish pond shops located in Indramayu, Cirebon, Majalengka, and Pamanukan areas. The eight
elements of the business model canvas that change come from key partners, key activities,
value propositions, customer relationships, key resources, channels, cost structures, and
revenue streams where the details of the changes are as shown in the figure above.
Sales Revenue Growth Expectations
Figure 6: Comparison between Sales Revenue with Old Strategy and Expected Sales
Revenue with New Strategy (Sales Revenue of 2019)
Source: Author, 2020
The figure above explains the comparison of sales revenue received by the company when the
company uses the old business strategy and when the company uses a new business strategy
by implementing a market development strategy through opening a new fish feed store located
in the Sindang area and selling fish feed online through e-commerce platforms and social media
consisting of Instagram and Facebook. This sales revenue comparison data was taken using the
company’s sales revenue data for the last 1 year, namely sales revenue data for 2019. From the
figure above, it can be known that the company’s sales revenue increased when the company
implemented a market development strategy as the new strategy where in the first month the
company’s sales revenue increased by 11.44% from IDR 750,500,000 when using the old
IDR750,500,000
IDR701,980,000
IDR838,300,000
IDR911,380,000
IDR1,211,320,000
IDR814,360,000 IDR828,980,000
IDR762,580,000
IDR735,000,000
IDR638,860,000
IDR756,660,000
IDR963,660,000
IDR836,363,000
IDR791,329,038
IDR931,276,609
IDR1,008,131,459
IDR1,311,999,568
IDR919,127,159 IDR938,000,705
IDR876,026,946 IDR853,052,892
IDR761,705,839
IDR884,493,381
IDR1,096,683,416
IDR-
IDR200,000,000
IDR400,000,000
IDR600,000,000
IDR800,000,000
IDR1,000,000,000
IDR1,200,000,000
IDR1,400,000,000
January February March April May June July August September October November December
Revenue Sales with Old Strategy Expected Revenue Sales with New Strategy

Volume 2 Issue 6 (December 2020) PP. 55-73
DOI 10.35631/AIJBES.26006
Copyright © GLOBAL ACADEMIC EXCELLENCE (M) SDN BHD - All rights reserved
72
business strategy becomes IDR 836,363,000 when the company uses a new business strategy,
this also occurs in the second month where the company experienced an increase in revenue of
12.73% when using the new business strategy, and this increase in sales revenue also occurred
in the following months until December when the company implemented a new business
strategy compared to the old business strategy. Therefore, it can be said that the new strategy
is worthed to be implemented by the company because it can increase the company’s sales
revenue.
Conclusion and Discussion
The research objective of this research is to find the right business strategy for Makmur Abadi
Tambak to be able to increase sales revenue because in 2011 the company has experienced a
sharp decline in sales revenue as a result of leaving one of the company’s customers from a
large fish pond farmer due to the changes in the payment system from debt to cash and after
2011 the company experienced fluctuating sales revenue.
After analyzing using various frameworks and techniques, the authors recommend market
development as the right business strategy that must be implemented by the company to
increase its sales revenue. This market development takes the form of opening a new fish feed
store located in the Sindang area and selling fish feed online through e-commerce platforms
and social media consisting of Instagram and Facebook.
A new business model canvas is proposed as a guide for the company to implement new
business strategies. In implementing this business strategy, there are several things that must
be prepared by the company such as the formation of a marketing team both for radio as a way
of introducing the opening of a new fish feed store located in the Sindang area and social media
as a way of introducing fish feed for online sales, preparing the admin team to serving online
sales for both e-commerce platforms and social media platforms, collaborating with
e-commerce platforms and social media applications such as Instagram and Facebook to be
able to sell fish feed online, and collaborating with online transportation service providers to
send fish feed purchases online to the buyer’s destination.
References
A. Pratiwi, W. Sutopo, R. Zakaria, and A. M. Rasli. (2017). Formulating strategy through
QSPM based on SWOT framework: a case study spin-off company in Malaysia.
Advanced Science Letters, Vol.23, No.9, pp.8646-865.
asosiasi-gpmt.blogspot.com., (2020). KKP Dorong Pabrik Pakan Ikan Segera Daftarkan
Produknya. Retrieved from asosiasi-gpmt.blogspot.com: https://asosiasi-
gpmt.blogspot.com [Accessed on 25 December]
C. J. Capps and M. D. Glissmeyer. (2012). Extending the competitive profile matrix using
internal factor evaluation and external factor evaluation matrix concepts. Journal of
Applied Business Research, Vol.28, No.5, pp.1059-1062.
corporatefinanceistitute., (2015). Ansoff Matrix. Retrieved from corporatefinanceinstitute.com:
https://corporatefinanceinstitute.com/resources/knowledge/strategy/ansoff-matrix/
[Accessed on 25 December 2020]
Cray, D. and Mallory, G.R. (1998), Making sense of managing culture. International Thomson
Publishing Press.
David, F. R. (2011). Strategic Management: Concepts and Cases, Thirteenth Edition. New
Jersey: Prentice Hall.

Volume 2 Issue 6 (December 2020) PP. 55-73
DOI 10.35631/AIJBES.26006
Copyright © GLOBAL ACADEMIC EXCELLENCE (M) SDN BHD - All rights reserved
73
H.-H. Chang and W.-C. Huang. (2006). Application of a quantification SWOT analytical
method. Mathematical and Computer Modelling, Vol. 43, No.1-2, pp.158-169.
H. Chladkova and S. Formankova. (2016). Strategy for SMEs in the area of primary
agricultural production. Agricultural Economics, Vol. 62, No.9, pp.395-406.
Hussey, D. E. (2007). Strategic Management: From Theory to Implementation. Butterworth-
Heinemann.
kkp.go.id., (2018). KKP Yakin Produksi Pakan Ikan Mandiri Dapat Ditingkatkan. Retrieved
from kkp.go.id: https://kkp.go.id/djpb/artikel/7314-kkp-yakin-produksi-pakan-
mandiri-dapat-ditingkatkan [Accessed on 25 December]
M. Arabi. (2006). Manual of Strategic Planning. Cultural Research Office. Tehran, Iran.
McGaghie, W. C., Bordage, G., & Shea, J. A. (2001). Problem statement, conceptual
framework, and research question. Academic Medicine, Vol.76, No.9, pp.923-924.
M. G. Allen, (1977). Diagramming GE’s planning for what’s watt. Planning Review, Vol. 5,
No.5, pp.3-9.
M. Katsioloudes and A. K. Abouhanian, (2016). The Strategic Planning Process:
Understanding Strategy in Global Markets. Taylor & Francis.
M. M. E. Tehrani. (2017). Analyzing strategic factors associated with issuance of
environmental liability insurance policy in developing countries using SWOT and
QSPM. International Journal of Environmental Science and Development, Vol.8, No.5,
pp.359-365.
Osterwalder, A., & Pigneur, Y. (2010). Business model generation: a handbook for visionaries,
game changers, and challengers. John Wiley & Sons.
P. Sadler. (2003). Strategic Management. Kogan Page Publishers.
Rothaermel, F. T. (2017). Strategic management. McGraw-Hill Education.
Sugiyono. (2018). Metode Penelitian Kuantitatif, Kualitatif, dan R&D. Bandung: Alfabeta.
Team FME. (2013). Ansoff Matrix: Strategy Skills. (E-book)
Thomas L. Wheelen, & Hunger, J. D. (2012). Strategic management and business policy:
toward global sustainability. Pearson/Prentice Hall.
Ward, J., & Peppard, J. (2002). Strategic Planning for Information Systems, Third Edition.
John Wiley & Son’s Ltd.