business rating reportguarantee the accuracy, completeness, or timeliness of the information...
TRANSCRIPT
THIS REPORT MAY NOT BE REPRODUCED IN WHOLE OR IN PART IN ANY FORM OF MANNER WHATSOEVER. This report, furnished pursuant to contact for the exclusive use of the subscriber as one factor to consider in connection with credit, insurance,
marketing or other business decisions, contains information compiled from sources which Dun & Bradstreet does not control and whose information, unless otherwise indicated in the report, has not be verified. Dun & Bradstreet in no way assumes any part of the user’s business risk, does not guarantee the accuracy, completeness, or timeliness of the information provided, and shall not be liable for any loss or injury whatever resulting
from contingencies beyond its control or from negligence.
BUSINESS RATING REPORT
Quality Metals FZE
D-U-N-S: 86-434-6031
Report Validity 30 June 2015
Pages 37
Date 26 January 2015
Dun & Bradstreet South Asia Middle East Ltd.
PO Box 72478, National Bank of Fujairah Building,
Level 7, Khalid Bin Walid Road (Bank Street),
Bur Dubai, Dubai,
United Arab Emirates
Tel: +971-4-7027300
Fax: +971-4-7027373
www.dnbsame.com

Page 2 of 37
Business Rating Report Quality Metals FZE
DISCLAIMER:
This material is confidential and proprietary to Dun & Bradstreet and Quality Metals FZE (hereinafter
referred to as ‘Entity’ or ‘Subject’) and may not be copied or otherwise reproduced, repackaged,
further transmitted, transferred, disseminated, redistributed or resold, or stored for subsequent use
for any such purpose, in whole or in part, in any form or any manner or by any means whatsoever,
by any person without express authorization of Dun & Bradstreet South Asia Middle East Limited
(hereinafter referred to as ‘D&B’) or the General Counsel of Dun & Bradstreet.
All information contained herein is obtained by D&B from sources believed by it to be accurate and
reliable. Although reasonable care has been taken to ensure that the information herein is true,
such information is provided ‘as is’ without any warranty of any kind and D&B, in particular, makes
no representation or warranty, express or implied, as to the accuracy, timeliness or completeness of
any such information. All information contained herein must be construed solely as statements of
opinion and D&B shall not be liable for any loss incurred by users from any use of this report or its
contents.
D&B's information and opinion should not be the only criterion when making business decisions on
subject of report. Data in this report should be considered as an additional factor together with
others in order to reach a decision.
In the course of its work/survey, D&B may have received information from the “Subject Entity’’
being rated or graded, besides the fact that the report may also contain data/information available
in the Public Domain or that made available through Secondary Sources.
Date: 26 January 2015

Page 3 of 37
Business Rating Report Quality Metals FZE
Scope of the Report
History and legal background of the “Subject”
Understanding Current Operations
Management background
Bankers Information
Financial Statement & Analysis
D&B Rating
Information Sources
Information given in this report is compiled using the following sources:
Annual reports
Corporate communiqués
Information from website
Management Discussion
Media Articles
Methodology
Financial Information from the audited annual reports of the Entity was studied and analyzed.
Required clarifications were sought from the concerned Entity officials, wherever necessary. Other
value added information was obtained from the relevant publicly available sources.
Inputs about the “Entity” were provided by Viswanth Satheeshan Senior Accountant, of the Entity.

Page 4 of 37
Business Rating Report Quality Metals FZE
TABLE OF CONTENTS
Entity Details ............................................................................................................................... 5
D&B Risk Assessment ................................................................................................................... 5
Executive Summary ...................................................................................................................... 7
Operations Synopsis..................................................................................................................... 8
Financial Statements .................................................................................................................... 9
COMPARATIVE FINANCIALS ................................................................................................................ 9
STATEMENT OF COMPREHENSIVE INCOME ..................................................................................... 10
STATEMENT OF FINANCIAL POSITION .............................................................................................. 11
STATEMENT OF CASH FLOWS ........................................................................................................... 13
KEY RATIOS ........................................................................................................................................ 14
Financial Analysis ....................................................................................................................... 15
PROFITABILITY ANALYSIS .................................................................................................................. 15
LIQUIDITY ANALYSIS .......................................................................................................................... 19
EFFICIENCY ANALYSIS ........................................................................................................................ 21
SOLVENCY ANALYSIS ......................................................................................................................... 23
DU PONT ........................................................................................................................................... 25
Bankers ..................................................................................................................................... 26
Director and Executive Details .................................................................................................... 28
Purchase and Sales Details ......................................................................................................... 29
EMPLOYEE STRENGTH ....................................................................................................................... 33
LOCATION.......................................................................................................................................... 33
AMENITIES/ FACILITIES ..................................................................................................................... 33
INSURANCE ....................................................................................................................................... 33
Group Entities ............................................................................................................................ 34
RELATED COMPANIES ....................................................................................................................... 34
The D&B Rating.......................................................................................................................... 35
Financial Ratios Glossary ............................................................................................................ 36
Confidentiality ........................................................................................................................... 37

Page 5 of 37
Business Rating Report Quality Metals FZE
Quality Metals FZE D&B D-U-N-S: 86-434-6031
Entity Details
TRADE STYLE : Quality Metals ADDRESS : Office No 405, 4th Floor, Atrium Building, P.O Box 42904, Dubai, UAE CHIEF EXECUTIVE : Pherwani Nitin Gulab & Pherwani Sanjeev Gulab TELEPHONE : (971) (4) (3861012) (971) (50) (3769722) FAX : (971) (4) (3861013) WEBPAGE : www.qualitymetalsfze.com EMAIL : [email protected] EMPLOYEES (Total) : 10 SALES TERRITORY : Local & International SALES : AED 190,731,397 for the year ending December 31st, 2013 NET WORTH (Tangible) : AED 33,300,997 as on December 31st, 2013 D&B Risk Assessment
2A Based on Tangible Networth
3 Fair
1 2 3 4 -
A Financial Strength of USD 2.5 - 12 million ( Based on Tangible Networth) and a Risk Indicator which is Fair.
2A3
Financial Strength
Risk Indicator
Risk Indicator
The Dun & Bradstreet rating of 2A3 indicates:
D&B's Rating consists of 2 parts, the Financial Strength and the Composite Appraisal/Condition. Financial
Strength is an indication of the Tangible Net Worth (that is, the shareholder's funds less any intangible assets).
The Composite Appraisal/Condition is linked to the level of risk and is an overall evaluation of credit
worthiness. It takes into account the financial condition and several factors such as trade reference history,
legal structure, management experience and any adverse listings.

Page 6 of 37
Business Rating Report Quality Metals FZE
RATING HISTORY
FINANCIAL YEAR D&B RATING
FY 2012 2A3
REGISTRATION DETAILS
TRADE LICENSE NO : 2195 LEGAL STRUCTURE : Free Zone Entity REGISTERED : 20th September 2005 START DATE : 20th September 2005 REGISTRATION BODY : Ajman Free Zone Authority REGISTERED OFFICE : SM-Office – B1-412 H Ajman Free Zone Ajman, UAE SIC : 5093-0000; 5093-0201
LOB Trading of heavy melting steel (HMS) scrap,
secondary / used Metals, plates and coils
CAPITAL DETAILS
AUTHORIZED CAPITAL : AED 634,845 as on December 31st, 2013
ISSUED CAPITAL : AED 634,845 as on December 31st, 2013
PAID-UP CAPITAL : AED 634,845 as on December 31st, 2013
SHAREHOLDING PATTERN
SR. No Name of the Shareholder Shareholding Pattern (in %)
1 Pherwani Nitin Gulab 100
Total 100.00
Current Investigation
On 9th September 2014, Viswanth Satheeshan (Senior Accountant) provided the relevant
information.

Page 7 of 37
Business Rating Report Quality Metals FZE
Executive Summary
Quality Metals FZE was established in the year 2005 as a Free Zone Establishment under
Ajman Free Zone Authority.
The Entity is involved in the business of importing and exporting of HMS (heavy melting
steel) scrap, secondary / used Metals, plates and coils.
The entity sources majority of its products locally as well as imports from Europe, USA, GCC
and Africa. Majority of the sales are routed to India followed by Pakistan and UAE.
The Entity is entirely managed under the leadership of Mr. Pherwani Nitin Gulab and has
been able to create a strong customer base in India.
The Entity has also built strong business relationship with its suppliers which are based in
UAE, Europe, USA, and Africa.
Quality Metals has long relations with all the major shipping companies, which helps it to
handle & deliver materials with proper documentation in stipulated time.
Future Plans
The company is looking forward for business in non–ferrous, aluminum, copper & paper
scrap. They are also planning to operate yards in Dubai & USA and the same are under
negotiation.
The company plans to vertically integrate and put up an induction furnace in Oman.
The company also proposes to diversify into export of commodities such as rice from India
to Africa.

Page 8 of 37
Business Rating Report Quality Metals FZE
Operations Synopsis
Quality Metals FZE is engaged in the business of importing, exporting, and trading of scrap products.
It is mainly involved in the trading of HMS (heavy melting steel) scrap, secondary / used Metals,
plates and coils. The Entity has a strong network and presence in markets like UAE, India and
Pakistan thereby ensuring the right sourcing and selling of products at the most competitive price.
SIC CODES
5093-0000
Wholesale trading of Scrap and Waste Material
5093-0201
Wholesales ferrous metal scrap & waste
Page 9 of 37
Business Rating Report Quality Metals FZE
Financial Statements
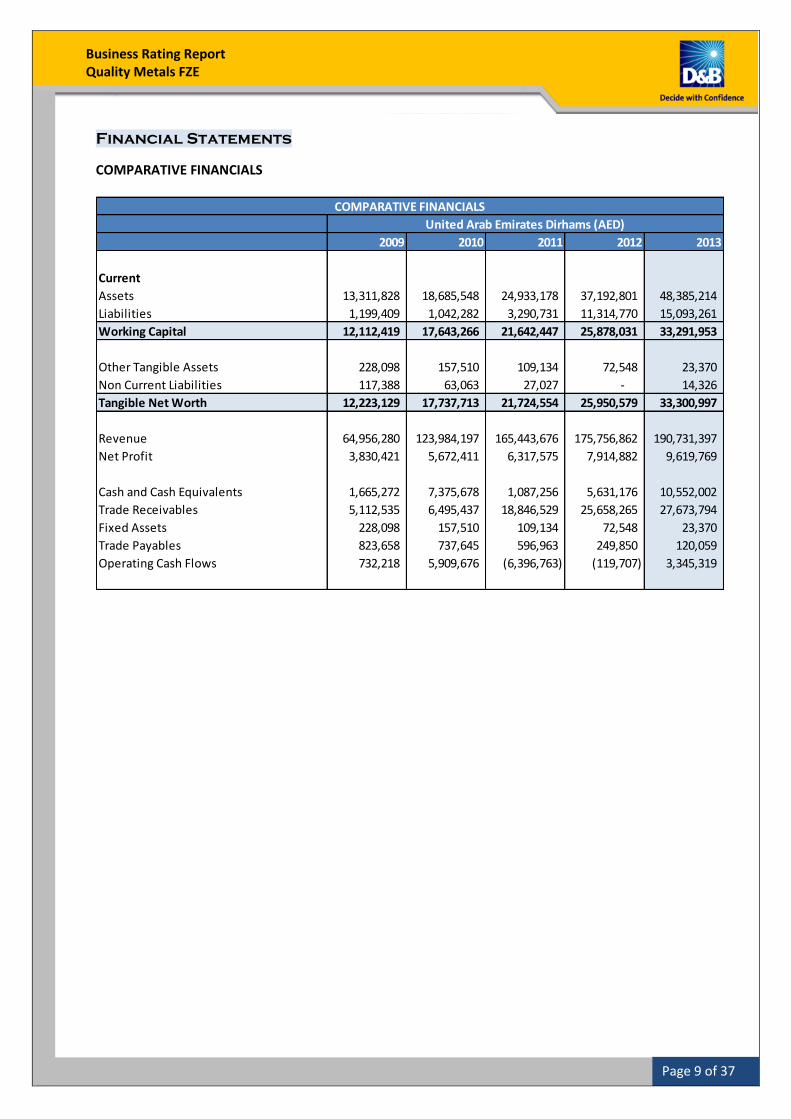
COMPARATIVE FINANCIALS
2009 2010 2011 2012 2013
Current
Assets 13,311,828 18,685,548 24,933,178 37,192,801 48,385,214
Liabilities 1,199,409 1,042,282 3,290,731 11,314,770 15,093,261
Working Capital 12,112,419 17,643,266 21,642,447 25,878,031 33,291,953
Other Tangible Assets 228,098 157,510 109,134 72,548 23,370
Non Current Liabilities 117,388 63,063 27,027 - 14,326
Tangible Net Worth 12,223,129 17,737,713 21,724,554 25,950,579 33,300,997
Revenue 64,956,280 123,984,197 165,443,676 175,756,862 190,731,397
Net Profit 3,830,421 5,672,411 6,317,575 7,914,882 9,619,769
Cash and Cash Equivalents 1,665,272 7,375,678 1,087,256 5,631,176 10,552,002
Trade Receivables 5,112,535 6,495,437 18,846,529 25,658,265 27,673,794
Fixed Assets 228,098 157,510 109,134 72,548 23,370
Trade Payables 823,658 737,645 596,963 249,850 120,059
Operating Cash Flows 732,218 5,909,676 (6,396,763) (119,707) 3,345,319
COMPARATIVE FINANCIALS
United Arab Emirates Dirhams (AED)

Page 10 of 37
Business Rating Report Quality Metals FZE
STATEMENT OF COMPREHENSIVE INCOME
STATEMENT OF COMPREHENSIVE 31-Dec-09 31-Dec-10 31-Dec-11 31-Dec-12 31-Dec-13
No. of Months 12 12 12 12 12
Revenues 64,956,280 123,984,197 165,443,676 175,756,862 190,731,397
Total Operating Income 64,956,280 123,984,197 165,443,676 175,756,862 190,731,397
Cost of sales 59,535,329 116,055,490 156,511,285 165,353,625 178,385,444
Less: Total Direct Expenditure 59,535,329 116,055,490 156,511,285 165,353,625 178,385,444
Gross Profit (Loss) 5,420,951 7,928,707 8,932,391 10,403,237 12,345,953
Communication cost 57,265 88,215 81,356 72,568 81,123
Rent & accommodation 11,908 11,908 18,133 112,536 112,536
License, professional & legal charges 41,253 98,959 75,682 65,015 64,198
Repairs and maintenance 8,240 20,380 17,235 12,555 13,427
Commission 985,865 1,297,086 1,465,823 1,262,536 1,428,130
Printing and stationary 48,552 88,264 77,685 76,258 67,321
General expenses 63,498 91,202 87,158 65,250 80,134
Salaries and benefits 25,568 60,981 66,533 231,235 259,926
Travelling and vehicle expenses 14,847 85,655 74,568 75,625 81,109
Less: Total Operating Expenses 1,256,996 1,842,650 1,964,173 1,973,578 2,187,904
Profit Before Interest & Depreciation 4,163,955 6,086,057 6,968,218 8,429,659 10,158,049
Less: Depreciation 70,340 48,768 48,376 44,148 49,178
Operating Profit After Depreciation 4,093,615 6,037,289 6,919,842 8,385,511 10,108,871
Other income 65,366 131,743 317,074 405,236 649,014
Profit Before Interest & Tax 4,158,981 6,169,032 7,236,916 8,790,747 10,757,885
Less : Interest on loan 328,560 496,621 919,341 875,865 1,138,116
Profit Before Tax 3,830,421 5,672,411 6,317,575 7,914,882 9,619,769
Profit After Tax 3,830,421 5,672,411 6,317,575 7,914,882 9,619,769
Profit After Extraordinary items 3,830,421 5,672,411 6,317,575 7,914,882 9,619,769
Total Comprehensive Income 3,830,421 5,672,411 6,317,575 7,914,882 9,619,769
United Arab Emirates Dirhams (AED)

Page 11 of 37
Business Rating Report Quality Metals FZE
STATEMENT OF FINANCIAL POSITION
ASSETS AS ON 31-Dec-09 31-Dec-10 31-Dec-11 31-Dec-12 31-Dec-13
Fixed Assets
Furniture and fittings 392 - - - -
Motor vehicles 215,733 151,277 108,641 66,005 23,369
Office equipments 11,973 6,233 493 6,543 1
Total Fixed Assets 228,098 157,510 109,134 72,548 23,370
TOTAL NON CURRENT ASSETS 228,098 157,510 109,134 72,548 23,370
Current Assets
Cash on hand 758,494 625,952 865,236 985,365 999,741
Cash at bank 906,778 6,749,726 222,020 4,645,811 9,552,261
Due from related parties 3,968,268 2,485,641 2,658,352 2,856,826 4,645,390
Deposit 12,052 12,052 727,052 651,520 651,520
Trade receivables 5,112,535 6,495,437 18,846,529 25,658,265 27,673,794
Prepayments 96,385 52,524 21,348 75,826 8,123
Other receivables 58,980 66,823 50,756 65,620 72,567
Advance to suppliers 2,398,336 2,197,393 1,541,885 2,253,568 4,781,818
Total Current Assets 13,311,828 18,685,548 24,933,178 37,192,801 48,385,214
TOTAL ASSETS 13,539,926 18,843,058 25,042,312 37,265,349 48,408,584
STATEMENT OF FINANCIAL POSITION
United Arab Emirates Dirhams (AED)
Page 12 of 37
Business Rating Report Quality Metals FZE
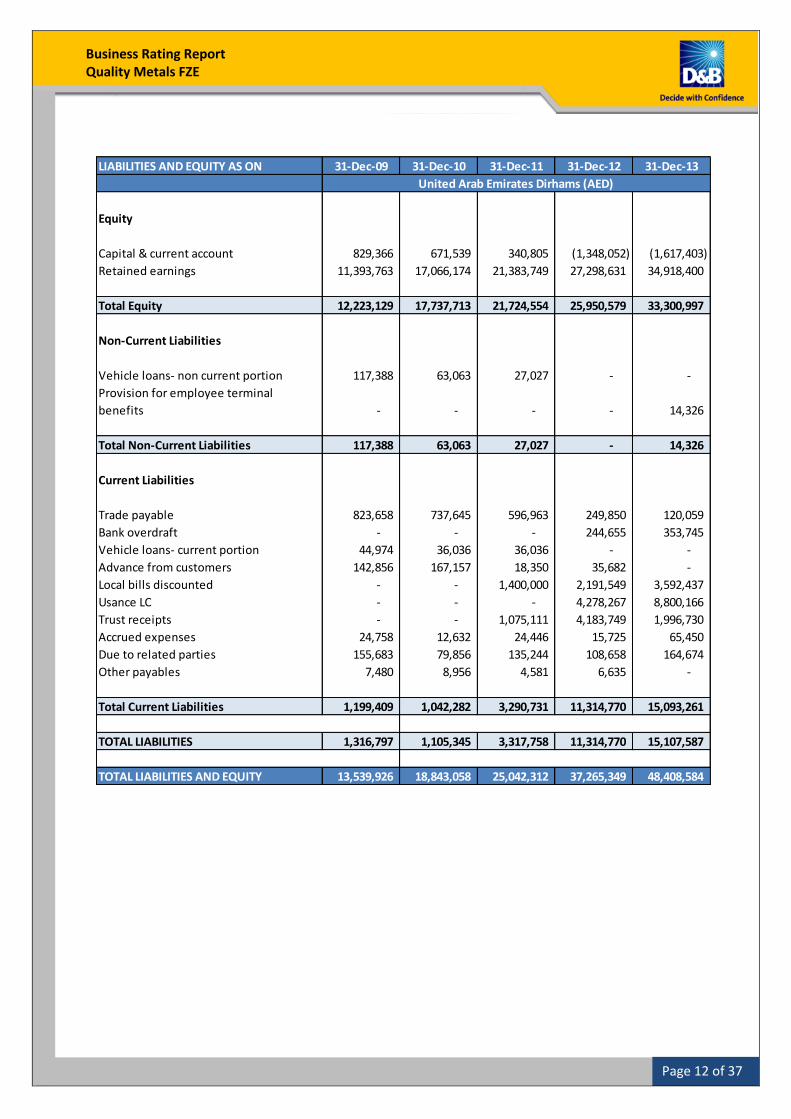
LIABILITIES AND EQUITY AS ON 31-Dec-09 31-Dec-10 31-Dec-11 31-Dec-12 31-Dec-13
Equity
Capital & current account 829,366 671,539 340,805 (1,348,052) (1,617,403)
Retained earnings 11,393,763 17,066,174 21,383,749 27,298,631 34,918,400
Total Equity 12,223,129 17,737,713 21,724,554 25,950,579 33,300,997
Non-Current Liabilities
Vehicle loans- non current portion 117,388 63,063 27,027 - -
Provision for employee terminal
benefits - - - - 14,326
Total Non-Current Liabilities 117,388 63,063 27,027 - 14,326
Current Liabilities
Trade payable 823,658 737,645 596,963 249,850 120,059
Bank overdraft - - - 244,655 353,745
Vehicle loans- current portion 44,974 36,036 36,036 - -
Advance from customers 142,856 167,157 18,350 35,682 -
Local bills discounted - - 1,400,000 2,191,549 3,592,437
Usance LC - - - 4,278,267 8,800,166
Trust receipts - - 1,075,111 4,183,749 1,996,730
Accrued expenses 24,758 12,632 24,446 15,725 65,450
Due to related parties 155,683 79,856 135,244 108,658 164,674
Other payables 7,480 8,956 4,581 6,635 -
Total Current Liabilities 1,199,409 1,042,282 3,290,731 11,314,770 15,093,261
TOTAL LIABILITIES 1,316,797 1,105,345 3,317,758 11,314,770 15,107,587
TOTAL LIABILITIES AND EQUITY 13,539,926 18,843,058 25,042,312 37,265,349 48,408,584
United Arab Emirates Dirhams (AED)

Page 13 of 37
Business Rating Report Quality Metals FZE
STATEMENT OF CASH FLOWS
STATEMENT OF CASH FLOWS 31-Dec-09 31-Dec-10 31-Dec-11 31-Dec-12 31-Dec-13
CASH FLOW FROM OPERATIONS
Net Profit for the Year 3,830,421 5,672,411 6,317,575 7,914,882 9,619,769
Adjustments for:
Depreciation 70,340 48,768 48,376 44,148 49,178
Operating Profit Before Working Capital 3,900,761 5,721,179 6,365,951 7,959,030 9,668,947
Adjustments for:
(Increase)/decrease in trade and other
receivables (1,179,543) (1,390,745) (12,335,025) (7,517,229) (4,483,023)
(Increase)/decrease in due from related
parties (902,471) 1,482,627 (172,711) (198,474) (1,788,564)
Increase/(decrease) in trade and other
payables 193,073 (60,236) (293,864) (336,448) (122,383)
Increase/(decrease) in accruals 5,617 (12,126) 11,814 - -
Increase in staff gratuity provision - - - - 14,326
Increase/(decrease) in Due to related
parties (48,016) (75,827) 55,388 (26,586) 56,016
(Increase)/decrease in other current
assets (1,237,203) 244,804 (28,316) - -
Cash Generated from Operations 732,218 5,909,676 (6,396,763) (119,707) 3,345,319
Net Cash From Operating Activities (A) 732,218 5,909,676 (6,396,763) (119,707) 3,345,319
CASH FLOW FROM INVESTING ACTIVITIES
Net Changes in Fixed Assets - 21,820 - (7,562) -
Net Cash Used in Investing Activities (B) - 21,820 - (7,562) -
CASH FLOW FROM FINANCING
ACTIVITIES
Increase/(decrease) in due to banks - (8,938) 2,475,111 8,360,046 3,844,858
Increase/(decrease) in non current (44,974) (54,325) (36,036) - -
Net changes in current account (1,530,783) (157,827) (2,330,734) (3,688,857) (2,269,351)
Net Cash From Financing Activities(C) (1,575,757) (221,090) 108,341 4,671,189 1,575,507
Net Increase in Cash & Cash Equivalents
(A+B+C+D) (843,539) 5,710,406 (6,288,422) 4,543,920 4,920,826
Cash & Cash Equivalents (Opening
Balance) 2,508,811 1,665,272 7,375,678 1,087,256 5,631,176
Cash & Cash Equivalents (Closing Balance) 1,665,272 7,375,678 1,087,256 5,631,176 10,552,002
United Arab Emirates Dirhams (AED)

Page 14 of 37
Business Rating Report Quality Metals FZE
KEY RATIOS
KEY RATIOS 2009 2010 2011 2012 2013
GROWTH RATIOS
Revenue Growth (%) 90.87 33.44 6.23 8.52
Net Profit Growth (%) 48.09 11.37 25.28 21.54
PROFITABILITY RATIOS
Gross Profit Margin (%) 8.35 6.39 5.40 5.92 6.47
Operating Profit Margin (%) 6.41 4.91 4.21 4.80 5.33
Net profit Margin (%) 5.90 4.58 3.82 4.50 5.04
Return on Equity (%) 31.34 31.98 29.08 30.50 28.89
Return on Capital Employed (%) 33.16 34.43 29.66 23.79 22.32
Return On Fixed Assets ( %) 1,679.29 3,601.30 5,788.82 10,909.86 41,162.90
Return on Total Assets (%) 28.29 30.10 25.23 21.24 19.87
LIQUIDITY RATIOS
Quick Ratio (Times) 11.02 17.88 7.57 3.28 3.21
Current Ratio (Times) 11.10 17.93 7.58 3.29 3.21
SOLVENCY RATIOS
Long Term Debt Equity Ratio (Times) 0.01 0.004 0.001 - 0.000
Total Debt to Equity Ratio (Times) 0.11 0.06 0.15 0.44 0.45
Net Debt to Equity (Times) (0.03) (0.35) 0.10 0.22 0.14
EFFICIENCY RATIOS
Interest Coverage Ratio (Times) 12.66 12.42 7.87 10.04 9.45
Collection Period (Days) 29 19 42 53 53
Payment Period (Days) 5 2 1 1 0
Operating Cash flow margin (%) 1.13 4.77 (3.87) (0.07) 1.75

Page 15 of 37
Business Rating Report Quality Metals FZE
Increasing trend in revenue with an average growth rate of 35%
Financial Analysis
PROFITABILITY ANALYSIS
Exhibit 1
The Entity generates revenue through trading of HMS (heavy
melting steel) scrap, scrap, secondary / used Metals, plates and
coils.
As observed in Exhibit 1, the revenue has increased constantly
with CAGR (Compounded annual growth rate) of 28% over the
period under review. The revenue has grown at a declining rate. The high growth in FY 2010 was
attributable to access to inventories acquired at a comparatively lower cost and sold at higher prices
to Indian market due to price movement and further due to stronger Indian Rupee. In FY 2011, the
Company recorded a growth of 33% due to stabilization in the industry in terms of volume and price.
Despite growth in traded volume in FY 2012, the revenue growth slowed down to 6% due to steep
decline in global prices of HMS 1 & 2 by approximately 30%. However, the Entity maintained and
improved its profitability in FY 2012 due to strong access to committed supply sources. In FY 2013,
the entity registered a growth of 9%. The management has attributed the growth in FY 2013 to
increased sales volume with existing clients and acquisition of new clients. Competitive pricing
during FY 2012 and FY 2013 has also contributed to positive growth.
Similar to revenue trend, the gross profit has also exhibited an increasing trend over the period
under review. It has increased by 16% in FY 2012 comparatively higher than 13% increase in FY 2011.
Page 16 of 37
Business Rating Report Quality Metals FZE
This was mainly due to more than proportionate increase in revenue as compared to increase in
direct costs.
Likewise the above trends, the net profit has also shown an increasing trend during the same period.
The net profit has constantly increased with a CAGR of 26%, due to more than proportionate
increase in revenue coupled with the increases in other income of the Entity.

Page 17 of 37
Business Rating Report Quality Metals FZE
Improving trend in profit margins from FY 2011 onwards
Exhibit 2
Unlike the trend observed in revenue, the profit margins have shown a
mixed trend over the period under review. Despite increase in
revenue, the gross profit margin has decreased from 8.35% in FY 2009
to 6.39% in FY 2010 and further to 5.40% in FY 2011. This was mainly
due to increase in direct costs as a percentage of revenue. However,
due to slight control over direct costs in FY 2012 and FY 2013, the
gross profit margin went up to 5.92% in FY 2012 and 6.47% in FY 2013. The decline in direct costs is
led by decline in scrap prices. As
per the management, despite
decline in prices, the Company
maintained and improved its
gross margins due to secure customer base in India with consistent requirement.
Corresponding to a gross profit margin trend, operating profit margin has also exhibited mixed
trend over the period under review. It decreased from 6.41% in FY 2009 to 4.91% in FY 2010 and
marginally by 0.7% in FY 2011, mainly on account of increase in rent & accommodation by 52% as
compared to increase in operating income. However in FY 2012, it increased slightly to 4.80% due
to control on direct and indirect costs as a percentage of revenue. The ability to generate profit
from core operations improved further as the operating margin went up to 5.33% in FY 2013.
Net profit margin has followed a similar trend. Despite decrease in indirect costs as a percentage of
revenue, the net profit margin decreased from 5.90% in FY 2009 to 4.58% in FY 2010 and further to
3.82% in FY 2011. This was mainly due to increase in direct expenditures. The decline in margins was
2009 2010 2011 2012 2013
Direct Costs 91.65 93.61 94.60 94.08 93.53
Direct Costs as a percentage of Revenue

Page 18 of 37
Business Rating Report Quality Metals FZE
due to fall in market prices by more than 30%. However, in FY 2012, the net profit margin increased
by 0.68%, due decrease in direct and indirect costs coupled with increase in other income which
comprises of commissions earned
and interest on advances. The net
margin further improved to 5.04%
due to control over direct costs
and increase in other income.
Contrast to the above trends, return on capital employed has also exhibited a decreasing trend since
FY 2010. The declining trend is mainly on account of increase in short-term bank facilities followed
by strengthening equity position, which in turn led to an increase in capital employed.
2009 2010 2011 2012 2013
Indirect Costs 2.55 1.93 1.77 1.65 1.77
Indirect Costs as a percentage of Revenue

Page 19 of 37
Business Rating Report Quality Metals FZE
Increasing trend in working capital during the period indicating above average liquidity position
LIQUIDITY ANALYSIS
Exhibit 3
The working capital of the Entity has remained positive through-out the
period and has exhibited an improving trend during the period under
review.
Unlike the trend observed in working capital, the current ratio and
quick ratio both have exhibited a decreasing trend since FY 2010.
Despite the declining trend, the current and quick ratios have remained
healthy. The decline was mainly led by increase in short-term bank
facilities.
AED 2009 2010 2011 2012 2013
Current Assets 13,311,828 18,685,548 24,933,178 37,192,801 48,385,214
Current Liabilities 1,199,409 1,042,282 3,290,731 11,314,770 15,093,261
Growth (%)
Current Assets 40% 33% 49% 23%
Current Liabilities -13% 216% 244% 25%
The quick ratio has followed a similar trend like that of current ratio. The difference between current
and quick ratio is negligible as the Entity does not maintain inventory.

Page 20 of 37
Business Rating Report Quality Metals FZE
Current Assets Break-up
2009 2010 2011 2012 2013
Cash on hand 5.70 3.35 3.47 2.65 2.07
Cash at bank 6.81 36.12 0.89 12.49 19.74
Due from related parties 29.81 13.30 10.66 7.68 9.60
Deposit 0.09 0.06 2.92 1.75 1.35
Trade receivables 38.41 34.76 75.59 68.99 57.19
Prepayments 0.72 0.28 0.09 0.20 0.02
Other receivables 0.44 0.36 0.20 0.18 0.15
Advance to suppliers 18.02 11.76 6.18 6.06 9.88
Total Current Assets 100 100 100 100 100
Current Assets Break-up
In %
Trade receivables (57.19 percent), followed by Cash at bank (19.74 percent) and Advance to
suppliers (9.88 percent) formed a major portion of the Total Current Assets in FY 2013. Together
they accounted for 86.82 percent of Total Current Assets.
Current Liabilities Break-up
2009 2010 2011 2012 2013Trade payable 68.67 70.77 18.14 2.21 0.80
Bank overdraft 0.00 0.00 0.00 2.16 2.34
Vehicle loans- current portion 3.75 3.46 1.10 0.00 0.00
Advance from customers 11.91 16.04 0.56 0.32 0.00
Local bills discounted 0.00 0.00 42.54 19.37 23.80
Usance LC 0.00 0.00 0.00 37.81 58.31
Trust receipts 0.00 0.00 32.67 36.98 13.23
Accrued expenses 2.06 1.21 0.74 0.14 0.43
Due to related parties 12.98 7.66 4.11 0.96 1.09
Other payables 0.62 0.86 0.14 0.06 0.00
Total Current Liabilities 100 100 100 100 100
Current Liabilities Break-up
In %
Usance LC (58.31 percent) and Local bills discounted (23.80 percent) account for a significant portion
of the Total Current Liabilities during FY 2013. Together they accounted for 82.11 percent of the
Total Current Liabilities

Page 21 of 37
Business Rating Report Quality Metals FZE
Increase in CCC since FY 2010
EFFICIENCY ANALYSIS Exhibit 4
The Company had to relax its credit terms with its customers due
to adverse market conditions. However, long-standing business
relationship with its customers has not adversely affected the
strength of its receivables.
Payment period has remained significantly low and the gap between collection and payment period
has broadened from FY 2010 onwards. As per the management, making cash payments to suppliers
has helped the Company consistently improve its gross margins.
Inventory days have remained minimal during the period due to the conscious decision of not
holding inventory due to erratic price movements. Also, not holding its own stock helps the
Company in choosing from a variety of suppliers. As per the management, holding minimal inventory
does marginally impact the profit margins. It however minimizes the risk of inventory carrying costs
and unsold stocks at times of market collapse.
The Cash Conversion Cycle (CCC) has exhibited an increasing trend since FY 2011 mainly due to
increase in collection period. It decreased from 24 days in FY 2009 to 17 days in FY 2010. However, it
increased substantially by 23 days in FY 2011 and 13 days in FY 2012.

Page 22 of 37
Business Rating Report Quality Metals FZE
OPERATING CASH FLOW MARGIN
Exhibit 5
Operating cash flow margin has exhibited a mixed trend till over the period under review. It
increased from 1.13% in FY 2009 to 4.8% in FY 2009. However, it declined and became negative to
3.87% in FY 2011, indicating decreased efficiency to convert sales to cash.
It improved but remained to negative 0.07% in FY 2012. The operating cash flow margin declined
mainly on account of sharp increase in trade receivables. The ability to convert per unit of sales into
cash improved in FY 2013 as the operating cash flow margin went up to 1.75% in FY 2013.
Page 23 of 37
Business Rating Report Quality Metals FZE
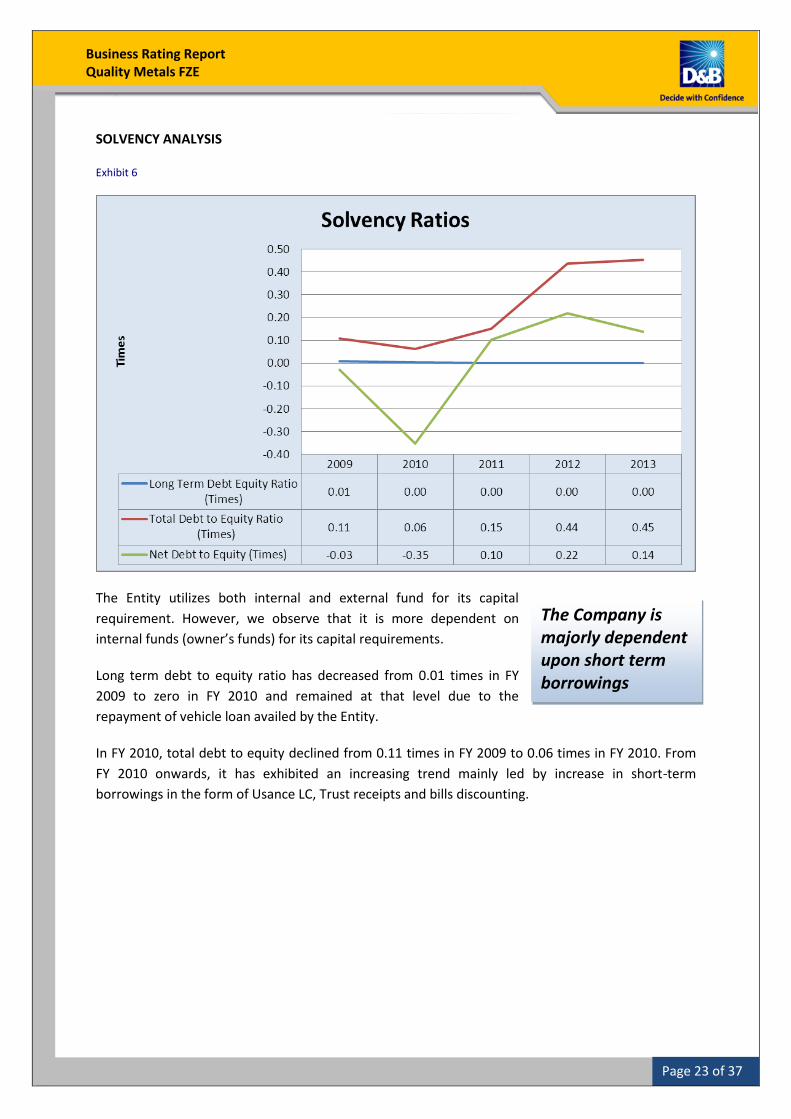
The Company is majorly dependent upon short term borrowings
SOLVENCY ANALYSIS Exhibit 6
The Entity utilizes both internal and external fund for its capital
requirement. However, we observe that it is more dependent on
internal funds (owner’s funds) for its capital requirements.
Long term debt to equity ratio has decreased from 0.01 times in FY
2009 to zero in FY 2010 and remained at that level due to the
repayment of vehicle loan availed by the Entity.
In FY 2010, total debt to equity declined from 0.11 times in FY 2009 to 0.06 times in FY 2010. From
FY 2010 onwards, it has exhibited an increasing trend mainly led by increase in short-term
borrowings in the form of Usance LC, Trust receipts and bills discounting.

Page 24 of 37
Business Rating Report Quality Metals FZE
INTEREST COVERAGE RATIO Exhibit 7
Interest coverage ratio has shown a decreasing trend till FY 2011. It marginally decreased from 12.66
in FY 2009 to 12.42 in FY 2010 and further to 7.87 in FY 2011, due to increase in profit before
interest and tax. However, in FY 2012 it increased to 10.04, due to decrease in interest expense.
Despite improvement in profitability, interest coverage ratio declined marginally to 9.45 in FY 2013
due to more than proportionate increase in interest expense.

Page 25 of 37
Business Rating Report Quality Metals FZE
DU PONT
Page 26 of 37
Business Rating Report Quality Metals FZE
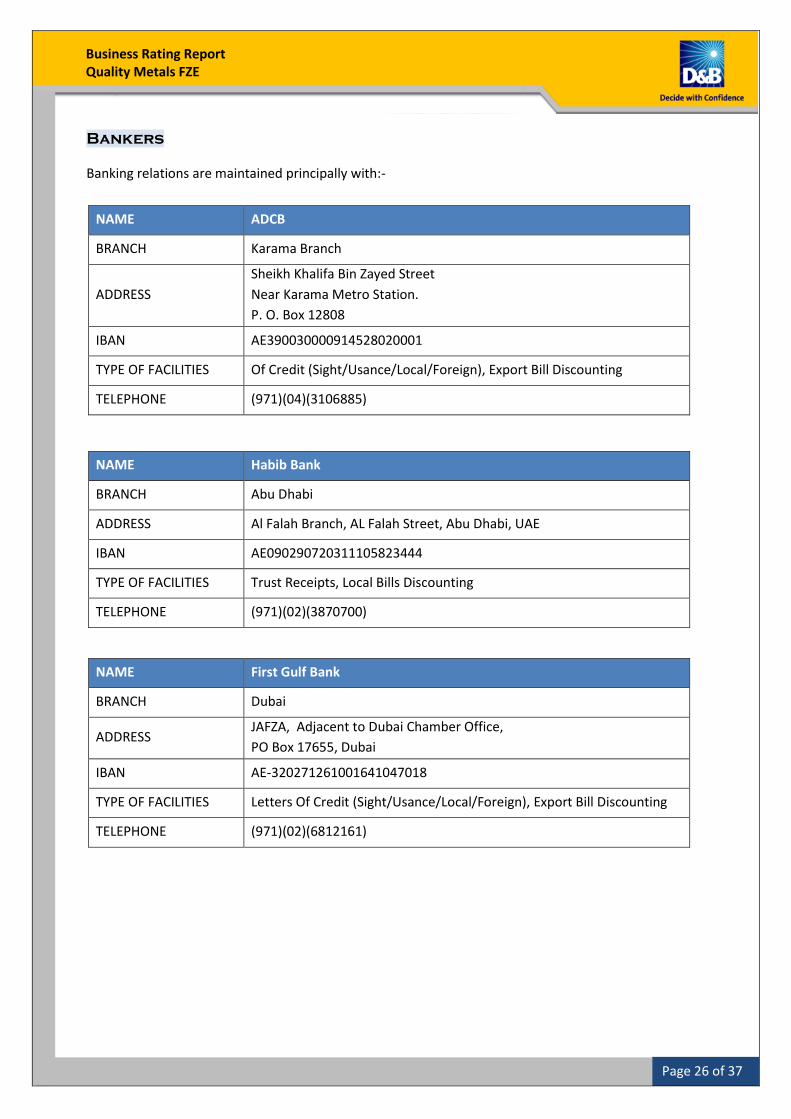
Bankers
Banking relations are maintained principally with:-
NAME ADCB
BRANCH Karama Branch
ADDRESS
Sheikh Khalifa Bin Zayed Street
Near Karama Metro Station.
P. O. Box 12808
IBAN AE390030000914528020001
TYPE OF FACILITIES Of Credit (Sight/Usance/Local/Foreign), Export Bill Discounting
TELEPHONE (971)(04)(3106885)
NAME Habib Bank
BRANCH Abu Dhabi
ADDRESS Al Falah Branch, AL Falah Street, Abu Dhabi, UAE
IBAN AE090290720311105823444
TYPE OF FACILITIES Trust Receipts, Local Bills Discounting
TELEPHONE (971)(02)(3870700)
NAME First Gulf Bank
BRANCH Dubai
ADDRESS JAFZA, Adjacent to Dubai Chamber Office,
PO Box 17655, Dubai
IBAN AE-320271261001641047018
TYPE OF FACILITIES Letters Of Credit (Sight/Usance/Local/Foreign), Export Bill Discounting
TELEPHONE (971)(02)(6812161)

Page 27 of 37
Business Rating Report Quality Metals FZE
NAME Commercial Bank International
BRANCH Dubai
ADDRESS Bur Dubai Branch
IBAN AE13 0220 0001 0007 0105 602
TYPE OF FACILITIES Of Credit (Sight/Usance/Local/Foreign),Export Bill Discounting, Trust
Receipt
TELEPHONE (971)(04)(2608181)
Note: No independent confirmation was received regarding subject’s relationship with the bank(s).

Page 28 of 37
Business Rating Report Quality Metals FZE
Director and Executive Details
Name Pherwani Nitin Gulab
Passport No Z1835607
Nationality Indian
Year of Birth 1970
Current Title CEO
Qualification Diploma in Computer Engineering
Active in Daily Operation Yes
Email [email protected]
KEY EMPLOYEES
Name Designation Educational
Qualification Joined the Entity
Sanjeev Pherwani Director Bachelor Of Commerce 2005

Page 29 of 37
Business Rating Report Quality Metals FZE
Purchase and Sales Details
PURCHASES LOCAL : 75%
INTERNATIONAL : 25%
PURCHASE FROM UAE : 75%
Africa and Poland : 25%
PURCHASING TERMS
LOCAL PURCHASE TERMS Cash : 65%
Letter of Credit : 25%
PDC/Trust Receipts/Tele Transfer : 10%
IMPORT PURCHASE TERMS
Outward tele transfer : 75%
Trust Receipts/Letter of credit/Cheques : 25%

Page 30 of 37
Business Rating Report Quality Metals FZE
SALES
LOCAL : 20%
INTERNATIONAL : 80%
SALES TO UAE : 20%
India : 70%
Pakistan : 10%
SELLING TERMS
LOCAL SELLING TERMS
Cheques : 40%
Letter of Credit (L/C) : 40%
PDC, Trust receipts and Tele transfer : 20%
EXPORT SELLING TERMS
Cash : 5%
Letter of Credit : 80%
CAD : 15%

Page 31 of 37
Business Rating Report Quality Metals FZE
Major Customers and Suppliers
CUSTOMERS DETAILS The subject maintains 25-50 customers. MAJOR CUSTOMERS
Sr. No.
Name of the Customer Country % share in Total Sales
1 Mahalaxmi Tmt Pvt Ltd India 25%
2 Rl Steels India 15%
3 Mukesh Udyog Ltd India 5%
4 Mukesh Steels India 5%
5 Shree Vaishnav Wire & Rods India 5%
6 Balbir Alloys Pvt Ltd India 5%
7 Sangham Business Credit Limited India 5%
8 Nidhi Mercantile Pvt Ltd India 5%
9 Surya Ferrous India 5%
10 Amreli Steels Pakistan 5%
11 Wave Industries India 5%

Page 32 of 37
Business Rating Report Quality Metals FZE
SUPPLIER DETAILS
The subject maintains 25-50 suppliers.
MAJOR SUPPLIERS
Sr. No. Name of the Supplier Country % share in Total Purchases
1 Gantoot Scrap Co Llc UAE 25%
2 Global One Metals UAE 10%
3 Al Burj Metals Trading Senegal 10%
4 Karachi Metals Trading UAE 10%
5 Qline Electronics Llc UAE 10%
6 Al Fajer Metals UAE 10%
7 Ads International South Africa 10%
8 Al Arshad UAE 5%
9 Vivan Impex Ltd Poland 5%
10 Lahore Metals UAE 5%

Page 33 of 37
Business Rating Report Quality Metals FZE
Other Operational Details
EMPLOYEE STRENGTH
EMPLOYEE(s) - CURRENT EMPLOYEE(s) - PREVIOUS
Total Employees : 10 Total Employees : 9
LOCATION
Particulars Location Operated As Rented/ Owned/
Leased Area (Sq. ft.)
Registered
Office Bur Dubai Office Rented 1064.15
MAILING ADDRESS
Office No 405 Atrium Center, Bank Street, Bur Dubai, Dubai P.O. Box 42904 Dubai UAE
AMENITIES/ FACILITIES
Cars : 6 Computes : 8 Offices : 1
AUDITOR DETAILS
SM Joshi
Chartered Accountants
P.O. Box 21708
Dubai
United Arab Emirates
INSURANCE
Zurich Insurance, Dubai Metlife Alico
Page 34 of 37
Business Rating Report Quality Metals FZE
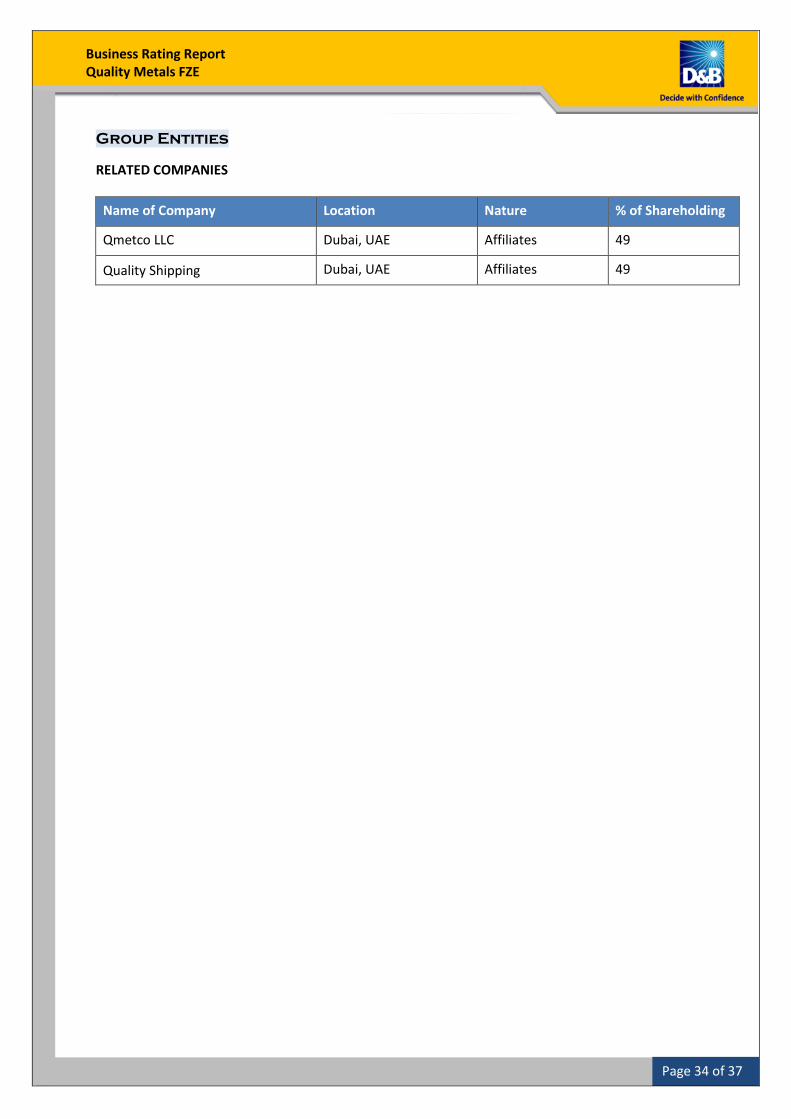
Group Entities
RELATED COMPANIES
Name of Company Location Nature % of Shareholding
Qmetco LLC Dubai, UAE Affiliates 49
Quality Shipping Dubai, UAE Affiliates 49

Page 35 of 37
Business Rating Report Quality Metals FZE
The D&B Rating
D&B Rating - The D&B rating consists of two parts, the Financial Strength Indicator and the Risk Indicator. For example: in the case of a 2A4 rating, 2A means the financial strength of the business and the 4 is the risk indicator. The Risk Indicator is used in conjunction with the Financial Strength Indicator. The Risk Indicator reflects D&B's opinion of the risk associated with trading with a specific business, notably the likelihood of business continuance or failure over the next 12 months. Created from expert rules systems, the Risk Indicator is refreshed whenever data is loaded onto our databases. The Financial Strength Indicator is based on either the Net Worth or Issued Capital. The table below contains the possible values.
Net worth / Issued Capital (in USD)
Rating based on Net worth (in USD)
Rating based on Issued capital (in USD)
0 – 15,000 H HH
15,000 – 35,000 G GG
35,000 – 60,000 F FF
60,000 – 120,000 E EE
120,000 - 175,000 D DD
175,000 – 345,000 C CC
345,000 – 600,000 B BB
600,000 – 1.2 million A AA
1.2 million – 2.5 million 1A 1AA
2.5 million – 12 million 2A 2AA
12 million – 25 million 3A 3AA
25 million – 60 million 4A 4AA
60 million and above 5A 5AA
Risk Indicator Condition Guide to Interpretation
1 Excellent Proceed with transaction – offer terms required
2 Good Proceed with transaction
3 Fair Proceed with transaction but monitor
4 Poor Take suitable assurances before extending credit
-
Insufficient information to assign a risk indicator
No public information or D&B proprietary information available to indicate trading activity

Page 36 of 37
Business Rating Report Quality Metals FZE
Financial Ratios Glossary
Key Business Ratios are used to identify irregularities in the status and future potential of a company.
Name Formula Explanation
Gross Profit Margin (%) Gross Profit/Revenue Gross profit margin measures how much of every dollar of revenue is left over after paying cost of goods sold (COGS).
Operating Profit Margin (%)
EBITDA/Revenue The ratio measures the overall operating efficiency. It incorporates all the operating expenses incurred due to the business activity.
Net profit Margin (%) Net profit before extraordinary items/Revenue
The ratio states the amount of net income after all expenses are settled generated by the company in relative to a dollar of sale.
Return on Equity (%) Net profit before extraordinary items/Total equity
The ratio measures the return generated on per dollar invested by the equity holders
Return on Capital Employed (%)
EBIT/Capital Employed The ratio indicates the profitability and efficiency of a company's capital investments.
Return On Fixed Assets (%)
Net profit before extraordinary items/Fixed Assets
The ratio indicates the return generated per dollar of fixed assets
Return on Total Assets (%)
Net profit before extraordinary items/Total Assets
The ratio indicates the return generated per dollar of total assets
Current Ratio (Times) Current Assets/Current Liabilities The ratio measures the ability to settle short-term obligations if they fall due.
Quick Ratio (Times) (Current Assets-Inventory-Prepayments)/Current Liabilities
The ratio measures the ability to settle short term obligations if they fall due with their most liquid assets
Long Term Debt Equity Ratio (Times)
Total Non-Current Liabilities/Equity The ratio measures the extent the net worth of the entity can offset the long term obligations
Total Debt to Equity Ratio (Times)
Total Liabilities/Equity The ratio measures the extent the net worth of the entity can offset the long and short term obligations
Net Debt to Equity (Times) or Net Gearing
(Total Liabilities- Cash & Cash Equivalents)/Equity
The ratio measures the financial leverage of the entity and indicates the proportion of equity and debt used to finance its assets
Interest Coverage Ratio (Times)
EBIT/Interest The ratio measures the entity's ability to cover its interest obligations
Collection Period (Days) (Receivables/Revenue)*365 The ratio measures the number of days it takes to recover sales proceeds
Payment Period (Days) (Payables/Cost of Sales)*365 The ratio measures the number of days it takes to make payments for the purchases
Inventory Days (Inventory/Cost of Sales)*365 The ratio measures the number of days the inventory is stored before it is sold
Operating Cash flow margin
Net Cash from operations/Sales The ratio indicates how efficiently the company converts its sales to cash.

Page 37 of 37
Business Rating Report Quality Metals FZE
Confidentiality
CURRENCY: All amounts in this report are in local currency unless otherwise stated.
This report is forwarded to the Subscriber in strict confidence for the use by the Subscriber as one factor to consider in connection with credit and other business decisions. This report contains information compiled from information which Dun & Bradstreet does not control and which has not been verified unless otherwise indicated in this report. Dun & Bradstreet therefore cannot accept responsibility for the accuracy, completeness or timeliness of the report. Dun & Bradstreet disclaims all liability for any loss or damage arising out of or in any way related to the contents of this report. This material is confidential and proprietary to Dun & Bradstreet and/or third parties and may not be reproduced, published or disclosed to others without the express authorization of Dun & Bradstreet or the General Counsel of Dun & Bradstreet.
COPYRIGHT 2014 DUN & BRADSTREET. THIS REPORT MAY NOT BE REPRODUCED IN WHOLE OR IN PART IN ANY FORM OR MANNER WHATSOEVER.
-- End of Report –