business intelligence for supra - cincom systems complete business intelligence solution business...
TRANSCRIPT

Cincom In-depth Analysis and Review
Business Intelligence for SUPRA®
A Technical Overview
WHITE PAPER
SIMPLIF ICATION THROUGH INNOVATION ®

Table of Contents
Complete Business Intelligence Solution . . . . . . . . . . . . . 1
Major Advantages . . . . . . . . . . . . . . . . . . . . . . . . . . . . . . 1
Data Access for SUPRA . . . . . . . . . . . . . . . . . . . . . . . . . . . 2
Application Program Interfaces . . . . . . . . . . . . . . . . . . . 3
Reports . . . . . . . . . . . . . . . . . . . . . . . . . . . . . . . . . . . . . . . 3
Data Warehouse for SUPRA . . . . . . . . . . . . . . . . . . . . . . . . 4
ETL . . . . . . . . . . . . . . . . . . . . . . . . . . . . . . . . . . . . . . . . . . 4
Extract Options . . . . . . . . . . . . . . . . . . . . . . . . . . . . . . . . 5
ETL Steps . . . . . . . . . . . . . . . . . . . . . . . . . . . . . . . . . . . . . 6
ETL Jobs . . . . . . . . . . . . . . . . . . . . . . . . . . . . . . . . . . . . . . 6
Warehouse Database . . . . . . . . . . . . . . . . . . . . . . . . . . . 6
Client Applications and Reports . . . . . . . . . . . . . . . . . . 6
Analytics for SUPRA . . . . . . . . . . . . . . . . . . . . . . . . . . . . . . 7
Dimensional Data . . . . . . . . . . . . . . . . . . . . . . . . . . . . . . 7
Developing Multi-dimensional Applications . . . . . . . . 9
Application Programming Interfaces . . . . . . . . . . . . . . . 9
Visual OLAP Components . . . . . . . . . . . . . . . . . . . . . . 10
Multi-dimensional Reports . . . . . . . . . . . . . . . . . . . . . . 11
Microsoft Excel Support . . . . . . . . . . . . . . . . . . . . . . . . 11
Glossary . . . . . . . . . . . . . . . . . . . . . . . . . . . . . . . . . . . . . . . 12
Cincom In-depth Analysis and Review
Business Intelligence for SUPRA®
A Technical Overview
WHITE PAPER

1
Complete Business IntelligenceSolution
Business Intelligence for SUPRA helps you to derivemaximum value from your corporate data with highproductivity and low risk. It provides an end-to-endsolution for direct access to SUPRA data, warehousing ofSUPRA data and multi-dimensional analysis of SUPRAdata. It allows you to quickly transform volumes of datafrom your transactional systems into decision-support andanalytic information.
Business Intelligence for SUPRA is implemented in layersproviding you with the flexibility to solve a number ofbusiness intelligence problems. You can directly accessyour host database using SQL-based tools andapplications. You can reorganize your transactional datainto a data warehouse to integrate with other data andprovide historical information. You can also use multi-dimensional analysis to reveal product performance, profittrends or productivity comparisons. This is shown in thefollowing image.
Major AdvantagesBusiness Intelligence for SUPRA provides you with thefollowing advantages.
Optimized for SUPRA PDMAccessing SUPRA PDM data for decision support can becomplex as SUPRA implements specialized structures fornavigation and performance optimization. Also, decision-support applications and tools are typically implementedon Windows, UNIX or Linux, and the data types used bythe host PDM must be properly converted. BusinessIntelligence for SUPRA understands the SUPRA PDM datastructures and how to optimize the extraction of host data.It understands the platform-specific data types and how toconvert them to forms that are suitable for analysis.
Cost-EffectiveBusiness Intelligence for SUPRA is a cost-effective analyticssolution for SUPRA PDM. In comparison, third-partybusiness intelligence products can be very expensive.They do not provide a solution that integrates withSUPRA, so you also have the added cost of developingcustom data access or data extraction procedures.
Low RiskBusiness Intelligence for SUPRA gives you the flexibility totry solutions and demonstrate the benefits without a largesoftware investment. For example, a “data-mart” solutioncould be implemented where the analysis focuses on asingle subject area such as customers, inventory orshopping baskets. The layered implementation isintegrated using standard query languages, standardprogramming interfaces and standard protocols. Thisallows you to integrate with your existing tool sets anddecision support software.
SUPRA
Analytics forSUPRA
Multi-dimensionalAnalysis
Data Warehouse forSUPRA
Data Access forSUPRA
Business Intelligence forSUPRA
Historical &cleanseddata
Direct SQLAccess

2
Data Access for SUPRA
Data Access for SUPRA gives you direct access to yourSUPRA operational data through the SQL language. Directdata access provides you with the following advantages:
• You can access current information without the need tomigrate data.
• Changes are not required to operational data or existingapplications.
• Transactional access is available if needed.
• Third-party tools can access SUPRA data using standardSQL and SQL-based interfaces.
Data Access for SUPRA provides a wide range of optionsfor data access. Support for JDBC is provided enablingsupport for J2EE applications and tools. ODBC andOLEDB drivers are provided enabling support for .Netapplications and tools. A reporting framework is providedto allow you to design and deploy reports without theneed to program. This is shown in the following image.
Data Access for SUPRA provides SQL support for SUPRAPDM. This allows you to directly access SUPRA PDM usingstandard relational APIs and access SUPRA data usingrelational tools. In Data Access for SUPRA, the metadatafor the fields in a PDM file are mapped into an entitycalled a foreign table. Support is provided so that thisforeign table can be treated as a standard SQL table byrelational applications and tools. Data Access for SUPRAoptimizes the access and navigation of PDM files basedon the information retrieved from the PDM directory(linkpaths, indices and control keys).
Data Access for SUPRA allows applications to accessSUPRA PDM files as standard SQL tables. To enable this,you define SUPRA PDM files as foreign tables. An exampleis shown in the following figure.
Foreign table definitions are somewhat like SQL viewdefinitions. You define the fields to access in a PDM file,similar to the way you would define the columns to accessin a table using an SQL view.
In this example, you have an employee primary file calledEMPL, a department primary file called DEPT and arelated file called EMDE that relates multiple employeesto a department. To access these, you would define aforeign table for each PDM file to Data Access for SUPRA.In the foreign table definitions, you relate column nameswith field names like the following.
SUPRA
Data Access Server
Jasper Reports J2EE Applications .Net Applications
JDBC
Data Access for SUPRA
ODBC OLEDB
DepartmentForeignTable
Data Access for SUPRA
Empl-DeptForeignTable
EmployeeForeignTable
DEPT
SUPRA PDM
EMDE
EMPL

3
Employee EMPL
EMPLROOT
employee-name………………. EMPLNAME
employee-numb………………. EMPLNUMB
Empl-Dept EMDE
emde-empl-numb…………….. EMDEEMPL
emde-dept-numb……………... EMDEDEPT
DEPTLKEM
Department DEPT
DEPTROOT
department-name………..…… DEPTNAME
department-numb…………..… DEPTNUMB
DEPTLKEM
You could then access these using SQL as in the following example:
SELECT employee-name, employee-numb FROM Employee
Application Program InterfacesData Access for SUPRA provides JDBC (Java DatabaseConnectivity) to enable support for J2EE applications andtools. ODBC (Open Database Connectivity) and OLEDB(Object Linking and Embedding Database) are providedenabling support for .Net applications and tools.
JDBC is a standard Java interface for connecting torelational databases from J2EE applications. The suppliedJDBC driver complies with the SQL92 Entry Levelstandard.
ODBC is a standard interface for connecting to relationaldatabases from .Net applications. OLEDB is a set ofComponent Object Model (COM) interfaces providingapplications with uniform access to data stored in diverseinformation sources. Like ODBC, OLEDB can be used forconnecting to relational databases from .Net applications.The ODBC driver and OLEDB Provider supplied with DataAccess for SUPRA comply with the SQL92 Entry Levelstandard.
ReportsTo design and produce reports from query results, DataAccess for SUPRA supplies JasperReports (a reportingframework) to help you design and deploy reports withoutprogramming. Reports can be delivered in a variety offormats such as PDF, HTML, XLS, CSV and XML files.JasperReports formats data retrieved from a relationaldatabase through JDBC according to the report designdefined in an XML file. The report design format providesa number of options such as:
• Using input parameters to drive report output. Forexample, input parameters can be used to change thecolumns used in an MDX query.
• Defining the layout of the report using sections andframes.
• Defining how data is grouped.
• Presenting data in charts such as bar charts, pie chartsand line graphs.
To create a report, you can develop the report design XMLfile or you can use iReport to visually develop the report.Using iReport, you can easily define data sources to usefor relational data, how to format extracted fields, how tostructure the report and how to present data in charts.
As an example, in an inventory database, information maybe kept for part costs, and various parts might be used bydifferent projects. A report could be developed toorganize part cost by project to evaluate project cost. Thereport could show:
• The parts used by each project
• For each part, the planned cost and current cost
Using iReport, you can design a JasperReport thatprovides the summary of each part cost for a given projecton a separate page. You could produce this in a PDFformat as in the following example.

4
Data Warehouse for SUPRA
Data Warehouse for SUPRA provides a data warehousingsolution optimized to SUPRA PDM. Building a datawarehouse allows you to structure the data toward yourbusiness intelligence objectives. This provides a number ofadvantages over direct access to data.
• Data structures optimized for operational systems canbe complex. A data warehouse allows you to restructuredata into a schema that is easier for analysts tounderstand.
• Data can be combined from several sources into aunified relational schema.
• Data can be cleansed to meet the needs of analysis orchanging standards.
• The warehouse data can be built incrementally toprovide a historical basis for analysis.
• There may be less resource usage on operationalsystems as data is migrated to the data warehouse.
Data Warehouse for SUPRA provides the Extract-Transform-Load components to help you develop andautomate the construction and updating of yourwarehouse data. Data can be directly extracted using DataAccess for SUPRA or it can be extracted using SUPRAutilities. Data Warehouse for SUPRA supplies a relationaldatabase with support for developing J2EE and .Netapplications. A reporting framework is also provided toallow you to design and deploy reports without the needto program. This is shown in the following image.
ETLThe Extract Transform Load (ETL) process provides thedata basis for building your warehouse solution. Theprocess extracts data from operational host systems andconforms data from disparate sources into a shape that issuitable for analysis.
Data Warehouse for SUPRA provides an ETL tool to helpyou develop and automate the construction and updatingof your warehouse data. Facilities are provided to:
• Reshape your host data into the physical schema youdesign for the warehouse database.
• Conform heterogeneous data from multiple sources.
• Cleanse data to enforce your business rules.
• Handle large-volume initial loads and incrementalupdates.
The ETL tool supports your design of the warehousephysical schema by providing the transformation stepscommonly needed to reshape host data. In a datawarehouse, the physical schema is optimized to provideefficient analysis. That is, the data is structured to allowfast analytic queries where the emphasis is on groupingand aggregating data.
The host data used in your data warehouse solution maycome from multiple, disparate data sources, which maynot conform to the same business rules. And theextraction techniques may vary from one data source toanother. Your data warehouse may be required to providea cohesive data model that unifies the disparate datasources in your enterprise. Data warehouse designs referto such an integrated model as having “conformed”dimensions and “conformed” measures. The ETL toolsupports the integration of data by the following:
• Processes are provided to extract data directly fromrelational sources or from text files. For text files, avariety of format options are available.
• Data conforming processes are available to support yourbusiness rules. For example, look-up tables can be usedto substitute values to conform to a standard.
• Data joining processes are provided to help match andjoin together different data sources.
Host data may not have the accuracy needed for analysis.That is, some data sources may be incorrect, ambiguousor inconsistent. The design of your data warehouse mayrequire the ETL process to cleanse the data by removingor correcting data that does not meet certain rules. TheETL tool provides processes that allow you to checkvarious attributes of your data and filter out data orconform the data to a standard.
SUPRA
ETL
J2EE and.NetApps
Data Warehouse for SUPRA
Jasper Reports
HostData
DataAccess for
SUPRA
DataWarehouse

5
As the volume of data rises, the scalability of your ETL toolmust meet your performance objectives. The DataWarehouse for SUPRA ETL tool provides an architecturethat scales with increasing volumes. This applies not onlyto the initial loading of your data warehouse but also tothe ongoing incremental updates.
Extract OptionsA variety of options are available to extract host data forthe warehouse.
The Data Warehouse for the SUPRA ETL componentintegrates with Data Access for SUPRA to allow you todirectly extract data, as shown in the following figure.
Data Access for SUPRA allows the ETL tool to accessSUPRA PDM files as standard SQL tables. The ability touse the SQL language when extracting data from a hostsystem can be a powerful advantage in the developmentof a data warehouse. During the extraction, data can bejoined together using the navigation strategies of SUPRA.Also, platform-specific data types are converted to ASCIItext, which is suitable for loading a data warehouse. Also,data can be further converted and “re-shaped” using SQLin the extraction process. This can greatly simplify andspeed up the ETL process.
Data Warehouse for SUPRA also provides a mainframeextract utility to unload SUPRA PDM data into flat files.This can be useful for very large extracts where directaccess to SUPRA PDM across the network may not bepractical. This is shown in the following figure:
This provides some of the same advantages of extractingdata with Data Access for SUPRA, including the conversionof platform-specific data types to ASCII text and a limitedjoin capability. However, the full power of the SQLlanguage is not available for complex joins and dataconversions.
The ETL component also allows you to extract from otherhost sources and integrate the data with your SUPRA data.You can:
• directly extract data from databases supporting JDBC,
• extract data from flat files allowing you to use data fromany source that can unload data to comma-separatedvalue files (CSV), and
• extract data from Excel spreadsheets and XML files.
SUPRA
Direct SUPRA Extract
ETL Tool
DataWarehouse
DataAccess
forSUPRA
SUPRA
Extracting Data with SUPRA Utilities
ETL Tool(Transformand load)
DataWarehouse
SUPRAUtilities(Extract)
Text files
Mainframe

6
ETL StepsA graphical tool is provided to help you construct and testtransformation graphs. These graphs consist of connectedsteps categorized as “input,” “transformation” or“output” steps.
For example, the following graph is used to show theloading of a client dimension table from two data sources.
In the example, the client dimension consists of ahierarchy of client and sales region information. The ETLprocess needs to join these two sources together andcorrect some problems in the process.
1.Client information is read from a client database table,and sales region information is read from a text file.
2.The client information is changed to conform to adifferent naming standard used for sales regions basedon a corrections look-up file.
3.Sales region information is checked for the existence ofa sales representative. Any error rows are sent to anerror file.
4.The client information and sales region information isjoined together based on the sales region name.
5.The joined information is written to the client dimensiontable in the warehouse database.
Input steps are available to read text files, database tables,XML files or Excel files. A number of transformation stepsare available for joining, filtering, grouping, merging,sorting, etc. Transformation steps are also available to helpwith common data warehouse needs such as surrogatekeys and slowly changing dimensions.
ETL JobsA graphical tool is also available to help you construct andtest ETL jobs. An ETL job is a set of connected job stepsused to run scripts and transformation graphs, test forconditions and send e-mail alerts.
For example, the following ETL job might be used to runthe previously described transformation graph for loadingthe client dimension.
The sales region file is transferred from another systemusing FTP before running the transformation to load theclient dimension. Also, a test is made to see if thetransformation produced an error file. If an error file wasproduced, or if any of the previous steps fail, an e-mailalert is sent.
Job steps are provided to execute SQL statements andrun scripts, transformation graphs, FTP files, etc. You canalso test for various conditions.
Warehouse DatabaseData Warehouse for SUPRA embeds PostgreSQL as thewarehouse database. PostgreSQL is an open sourcedatabase with a strong reputation for reliability, dataintegrity and performance. PostgreSQL’s ease ofadministration and deployment make it an ideal choice foran embedded database server. However, Data Warehousefor SUPRA does not require PostgreSQL and allows youthe flexibility of using other relational databases.
Client Applications and ReportsAs with Data Access for SUPRA, you can use theJasperReports framework to produce reports from yourwarehouse data without programming. You can also useJDBC to enable support for J2EE applications and tools,and ODBC and OLEDB to enable support for .Netapplications and tools.

7
Analytics for SUPRA
Analytics for SUPRA enables multi-dimensional analysis ofinformation from your operational SUPRA databases. Thisinformation is expressed in business measures that canreveal product performance, profit trends or productivitycomparisons. Multi-dimensional analysis not only allowsyou to quickly reveal business performance and trends, italso allows you to explore new analysis areas. Ad hocanalysis can let you reveal trends and performancemeasures that would remain hidden if traditional queryingand reporting were used.
Analytics for SUPRA builds on advantages provided byData Warehouse for SUPRA and Data Access for SUPRA.An analytic server is provided allowing you to organizedata using the measures and dimensions that areimportant to business intelligence objectives.
Components are provided to allow the easy developmentof analytic applications. A reporting framework is providedto allow you to design and produce reports using analyticdata. Also, tools are provided to help you develop analyticqueries and to perform ad hoc analysis of data. This isshown in the following image.
Dimensional DataIn multi-dimensional analysis, the data items to beexamined are referred to as measures. The measures aredescribed or categorized by dimensions. These are usuallyorganized into a particular domain of inquiry as a “salesperformance” or “client purchases.” The basic unit oforganizing and storing the dimensions and the measuresthey contain is an OLAP cube.
As an example, you might be interested in an inventoryanalysis – measuring inventory quantity by location. Thiscan be pictured as a two-dimensional cube as shown inthe following:
The cells of the cube contain the Quantity measure whilethe rows and columns represent the part and locationdimensions.
You could continue to define dimensions for the cube. Forexample, you may want to measure inventory levels overtime and define a time dimension. This can be pictured asa three-dimensional cube:
SUPRA
AnalysisServer
Data Warehouse forSUPRA
Data Access forSUPRA
Analytics for SUPRA
Analytic Reports Analytic Applications Analytic Tools
Rudder
Wing flap
Engine mount
Prop
Wing support
Chicago, Bldg 1
20
0
24
1
0
New York, Bldg 3
0
300
0
8
222
Phoenix, Bldg 2
4
0
50
5
0
Time
Rudder
Wing flap
Engine mount
Prop
Wing support
Chicago, Bldg 1
20
0
24
1
0
New York, Bldg 3
0
300
0
8
222
Phoenix, Bldg 2
4
0
50
5
0

8
You define a cube to the analytic server by using a cubeschema definition. This schema defines the measures anddimensions and how they are stored in the warehousedatabase. To create and maintain these definitions, aCube Schema Builder tool is provided. For example, theCube Schema Builder might display the definition of theabove “inventory” cube as the following:
The Inventory cube schema contains the Quantity measureand the dimensions: Time, Part and Location. Thedefinition of the Quantity measure is shown. The Quantitymeasure is aggregated over dimensions as a sum. Themeasure is stored in a fact table in the column“qty_on_hand.” Also, formatting options are available toformat the measure in analytic query results.
The analytic server uses the cube schema definition toprovide an organization for storing data in a memorycache. This is shown in the following diagram:
The cube schema definitions allow the analytic server tomap dimensions and measures in the cube to tables andcolumns in the warehouse database. The cube schemadefinitions also provide a cache organization for holdingcomputed aggregations in memory so subsequent queriescan access values without going to the warehousedatabase.
In an analytic solution, the performance of grouping andaggregating data is critical to success. For very largevolumes of data, the aggregates should be pre-computedwhen the warehouse database is loaded. Special“aggregate tables” can be constructed so that aggregatesare stored and do not need to be computed by theanalytic server. For aggregates that must be computed bythe analytic server, the cache is used to hold results.
The analytic server has a number of features fordeveloping your logical data model:
• Multiple hierarchies can be defined for dimensions. Forexample, the Time dimension could be defined as acalendar hierarchy: year, month and week. It can also bedefined as a fiscal calendar: fiscal year or fiscal quarter.
• Cubes can be mapped to warehouse databases with a“star” schema or a “snowflake” schema.
• Measures can be created with user-defined formulas.
• Aggregate tables in the warehouse database schemacan be used to improve performance.
• Security can be defined for users to control access toanalytic data.
WHDatabase
Warehouse
Cubeschema
ApplicationServer
cache AnalyticServer

9
Developing Multi-dimensional Applications Multi-dimensional applications allow analysis of multi-dimensional data where information is presented in a formthat can immediately be understood by users. This isusually in a tabular or graphical form where more detailedinformation can be obtained by drill-down or breakdownlists. Applications are typically time-oriented to reveal pasttrends and patterns. These applications are often referredto as Online Analytical Processing (OLAP) applications.
OLAP applications use the Multi-dimensional Expressionlanguage (MDX) to manipulate multi-dimensional data.MDX is oriented to analysis queries as it allows multipledimensions, hierarchies of dimensions and aggregation ofmeasures. Using this language, queries can be requestedfrom an analytic server to provide measures that areorganized and summarized by dimensions.
You can develop analytic web applications usingapplication programming interfaces to communicate MDXrequests to the analytic server. You can also use GUIcomponents that accept MDX queries and render visualcomponents such as charts and pivot tables.
For producing reports from MDX query results, you canuse reporting frameworks to design and produce OLAPreports.
You can also use multi-dimensional query tools to exploredimensions and measures and to design and test MDXqueries.
Application Programming InterfacesAnalytics for SUPRA provides several applicationprogramming interfaces to communicate requests to theanalytic server.
Applications can communicate MDX requests to ananalytic server using XML for Analysis. XML for Analysis(XMLA) is a standard that allows clients to talk to analyticservers using Web Services. This allows opens access froma variety of platforms and languages to multi-dimensionaldata servers. Client requestor components are alsosupplied so that client applications can use XMLA withouta detailed understanding of the Web Service protocol andtechnologies. This is shown in the following diagram:
Java programs can also use the Java for OLAP (JOLAP)programming interface. JOLAP is a J2EE objected-oriented interface to analytic servers. Data Warehouse forSUPRA provides an implementation of the interfaces. Forexample, you might use JOLAP to implement an OLAPservlet application as shown in the following diagram.
MDXAnalyticQueries
ApplicationServer
AnalyticServer
Analytic Reports
Analytic WebApplications
Analytic Tools
Multi-dimensional Applications and Tools
http
ApplicationServer
JOLAPWebBrowser Servlet
AppAnalyticServer
soap
ApplicationServer
AnalyticServer
User-written
OLAPApplication
XMLARequestor XMLA
Responder
10
Visual OLAP ComponentsComponents are also provided to visually present analyticquery results in the development of Java Server Pagesapplications. These include a:
• Navigator component to explore the dimensions andmeasures defined in a cube.
• Pivot table component to display analytic query resultsin a tabular form. The component allows slicing, dicing,drilling down and rolling up.
• Chart component to display analytic query results in avariety of formats. These include bar charts, line graphs,pie charts, etc.
A Java Server Pages Tag library is provided to help youeasily construct server pages to render visual componentsand to change options for components.
As an example, your data warehouse may provide aninventory analysis cube. The cube could providemeasurements for inventory quantities and inventory costs.The dimensions that are important for the analysis couldinclude part names, part locations and year time periods.To understand the use of part storage space at differentlocations, you could design a query that shows:
• Part quantity measurement where the aggregation is themaximum
• Part quantity broken down by the location dimension
• Part quantity that is further broken down by time periods
You could use the visual components to construct a JavaServer Page to request your query and present a bar chartand pivot table as in the following image.
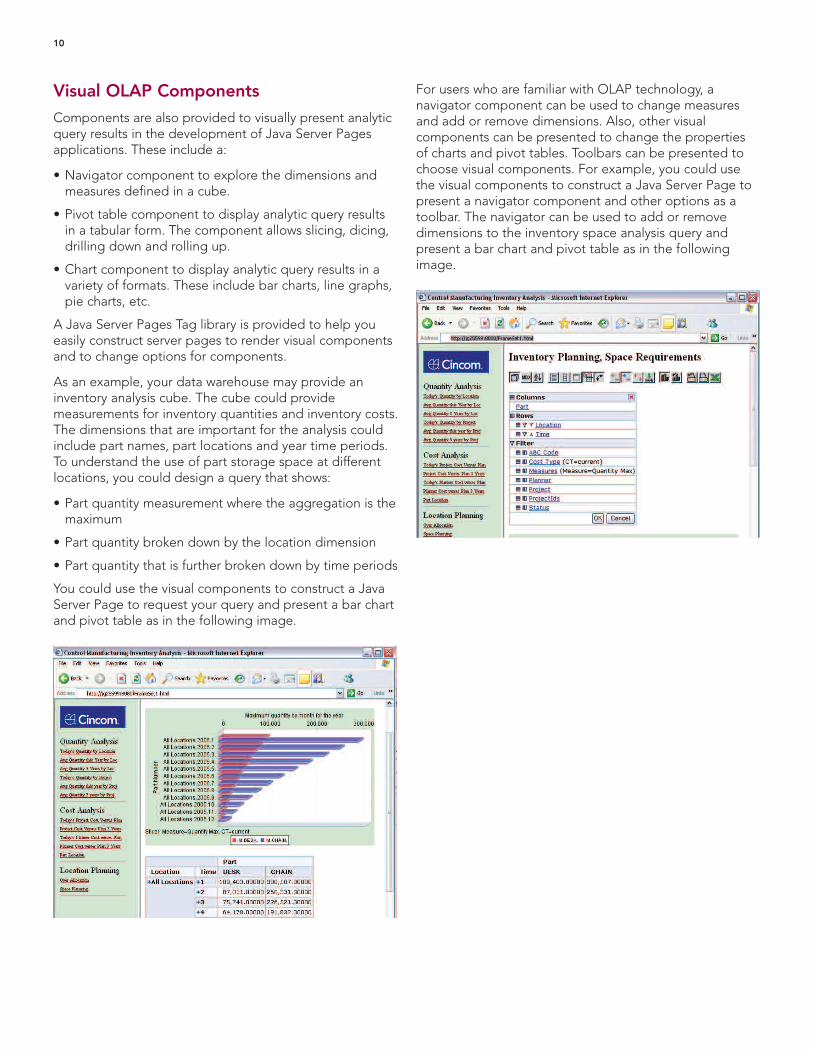
For users who are familiar with OLAP technology, anavigator component can be used to change measuresand add or remove dimensions. Also, other visualcomponents can be presented to change the propertiesof charts and pivot tables. Toolbars can be presented tochoose visual components. For example, you could usethe visual components to construct a Java Server Page topresent a navigator component and other options as atoolbar. The navigator can be used to add or removedimensions to the inventory space analysis query andpresent a bar chart and pivot table as in the followingimage.

11
Multi-dimensional ReportsTo design and produce reports from MDX query results,you can use JasperReports. This allows you to use thedimensions and measures from analytic queries toproduce reports in a variety of formats. You can also useiReport to help you visually design JasperReports. UsingiReport, you can easily define data sources to use foranalytic data, how to format extracted fields, how tostructure the report and how to present data in charts.
Microsoft Excel SupportMicrosoft Excel is an established tool for business analysisand reporting. You can use Microsoft Excel with Analyticsfor SUPRA through third-party integration software. Excelallows you to dynamically create Excel Pivot Tables andcharts using drag-and-drop operations. This allows you toexplore and perform ad hoc analysis without knowledge ofmulti-dimensional query languages. Drill-down andsummary operations are provided to further explore andunderstand trends.
For example, in an inventory analysis, you might beinterested in comparing the current and planned partcosts for a project. You would also like to see the costcomparisons over time. With Excel, you can design aclustered column chart dragging measures anddimensions from a field list to the chart. The chart showssummary costs for past years and monthly costs for thecurrent year.

12
Glossary
Aggregate See Dimension Hierarchy.
CubeA cube is an array of data cells arranged by dimensions.The data cells contain the measures or summary of themeasures. For example, a spreadsheet is a two-dimensional array with the data cells arranged by rows andcolumns where the rows and columns representdimensions.
DimensionA dimension is a structural attribute of a cube that is a listof members, all of which are of a similar type in the user'sperception of the data. For example, all months, quarters,years, etc., make up a time dimension; likewise all cities,regions, countries, etc., make up a geography dimension.A dimension acts as an index for identifying values withina multi-dimensional array. If one member of the dimensionis selected, then the remaining dimensions in which arange of members (or all members) are selected defines asub-cube. If all but two dimensions have a single memberselected, the remaining two dimensions define aspreadsheet (or a "slice" or a "page"). If all dimensionshave a single member selected, then a single cell isdefined. Dimensions offer a very concise, intuitive way oforganizing and selecting data for retrieval, exploration andanalysis.
Dimension HierarchyDimensions can be organized with parent-childrelationships. The parent represents an aggregation of itschildren. For example, a time dimension might beorganized in a hierarchy of year and month. The data foryear might be an aggregation of its children (months). Thisaggregation is typically a sum but can be more complexsuch as an average. The aggregation is sometimesreferred to as a “roll-up” of data from children.
Drill Down/UpDrilling down or up is a specific analytical techniquewhereby the user navigates among levels of data rangingfrom the most summarized (up) to the most detailed(down). The drilling paths may be defined by thehierarchies within dimensions or other relationships thatmay be dynamic within or between dimensions.
For example, when viewing sales data for North America,a drill-down operation in the Region dimension wouldthen display Canada, the eastern United States and thewestern United States. A further drill-down on Canadamight display Toronto, Vancouver, Montreal, etc.
Fact See Measure.
Measure Measures, also referred to as facts, are data to beanalyzed or examined. Measures are numeric and areusually additive.
Multi-dimensional Array See Cube.
ODBCODBC, short for Open Database Connectivity, is adatabase access method for SQL databases.
OLAPOnline Analytical Processing designates a category ofapplications and technologies that allow the managementof multi-dimensional data, with the goal of analysis. This isoften used in sales and marketing analysis to study thevolume of sales by products, location, time, etc. It is alsoused in decision support to forecast changes in income,expense and profit and in quality of service analysis.
OLEDBOLEDB (Object Linking and Embedding Database) is anAPI designed by Microsoft for accessing different types ofdata stores in a uniform manner. It is a set of interfacesimplemented using the Component Object Model (COM);it is otherwise unrelated to OLE. It was designed as ahigher-level replacement for, and successor to, ODBC,extending its feature set to support a wider variety of non-relational databases, such as object databases andspreadsheets that do not necessarily implement SQL.
OLTPOLTP (online transaction processing) is a classification ofprograms that manage transactions. Data entry and dataretrieval applications are examples.

13
Pivot TableA pivot table is a tool that allows you to visualize andexplore the results of an analytic query. The results arepresented as a spreadsheet of measures organized byrows and columns that represent dimensions. Pivot tablesallow slicing and dicing, rotating and roll-up operations.
Roll Up See Dimension Hierarchy.
RotateTo change the dimensional orientation of a report or pagedisplay. For example, rotating may consist of swapping therows and columns, moving one of the row dimensions intothe column dimension, or swapping an off-spreadsheetdimension with one of the dimensions in the page display(either to become one of the new rows or columns), etc. Aspecific example of the first case would be taking a reportthat has Time across (the columns) and Products down(the rows) and rotating it into a report that has Productacross and Time down.
An example of the second case would be to change areport that has Measures and Products down and Timeacross into a report with Measures down and Time overProducts across. An example of the third case would betaking a report that has Time across and Product downand changing it into a report that has Time across andGeography down.
Slice and DiceThe user-initiated process of navigating by calling for pagedisplays interactively, through the specification of slices viarotations and drill down/up.
Slowly Changing DimensionsSlowly changing dimensions are dimensions that changeover time. A variety of techniques can be used to updatedimensions in a warehouse database and to recordversioning information for changes.
Snowflake SchemaA snowflake schema is a variation of a star schema wherethe information for a dimension is normalized into multipletables. This is usually used for very large dimensions.
Star SchemaA star schema is an organization of tables in a relationaldatabase optimized for OLAP. In the center is a fact table,whose columns contain the multi-dimensional measures.The branches of the star consist of dimension tables whereeach table contains the hierarchy information for adimension. The dimension tables are linked to the facttable through foreign key relationships.
Surrogate KeysSurrogate keys are primary keys that are substituted forthe natural key of a table. A surrogate key is usually aninteger and can help in the performance and updating ofa warehouse database.

Cincom, the Quadrant Logo, SUPRA, and Simplification Through Innovation areregistered trademarks of Cincom Systems, Inc. All other trademarks belong totheir respective companies.
© 2007 Cincom Systems, Inc.FORM DB060822-9 3/07Printed in U.S.A.All Rights Reserved
World Headquarters • Cincinnati, OH USA • US 1-800-2CINCOM Fax 1-513-612-2000 • International 1-513-612-2769E-mail [email protected] • http://www.cincom.com