business continuity program benchmark report · 2010-03-19 · customized & prepared...
TRANSCRIPT

Customized & Prepared
Exclusively for
ABC Company
February 22, 2010
Best in Class Business Continuity Program Benchmark Report
Benchmarking. Plan Ahead. Be Ahead.

Copyright ©2009 BC Management, Inc. All rights reserved. SAMPLE Best in Class Report
Page 2
Table of Contents
Introduction
Reporting History 4
Study Methodology 4
Assessment of Data & Reporting 5
Participant Data & Respondent Characteristics ~ Includes requested filters per client’s request for this benchmarking report. 5 – 8
Business Continuity Program Management Awareness Study Points
Program Maturity
Do IT/ Disaster Recovery and Business Continuity strategies support the needs of the organization?
9– 10
Does the program foster relationships with other organizations and/ or external agencies? 10
How well integrated are other organizational disciplines within the business continuity management program? Our business intelligence dashboard interface offers further assessment.
11
What is the average budget for program expenses and average full-time and part-time employees by maturity rating of program?
11
What is the current state of the continuity program by level of maturity? 12
Budgeting
How are continuity program expenses budgeted? 13
What are the items included in the budget, percent of total budget and monetary budget amount per item?
13
Personnel
How many dedicated full-time and part-time employees for programs with multiple disciplines?
14
How many dedicated full-time and part-time employees for programs with one discipline? 15 Organizational Reporting Structure
What department does the program report to? Is the program best situated for maximum visibility? Our business intelligence dashboard interface offers further assessment.
16
Program Sponsorship
By job title, who is totally engaged and sponsoring the program? 17
If a chief officer or above is sponsoring the program, please rate how engaged this individual is in the program planning and management process? Our business intelligence dashboard interface offers further assessment.
17
What is the level of separation from the executive committee for the individual who is sponsoring the program? Is a different level under consideration? Our business intelligence dashboard interface offers further assessment.
18
Program Assessment and Exercising Plans
How often is a Business Impact Assessment (BIA) for critical and non-critical organizational processes conducted?
19
How often are the plans exercised for mission critical IT assets, mission critical business functions, less critical IT assets, and less critical business functions?
20
What scenarios are implemented to exercise the plans? 21
How often do internal and external auditors review the program? 21
Recovery Time Ala Carte Option to Add
When a critical system fails, what is the contingency program’s point of failure to a point of availability/ up time for the service?
22
When a critical system fails, what is the contingency program’s point of failure to a point of recoverability?
22
Technology Recovery Solutions – Internal or External Ala Carte Option to Add
Does the organization currently contract with a third-party hot site/ alternate site technology provider? If yes, which provider(s)?
23

Copyright ©2009 BC Management, Inc. All rights reserved. SAMPLE Best in Class Report
Page 3
Table of Contents Continued
Consulting Initiatives Ala Carte Option to Add
Engaging in consulting work in 2009? What consulting initiatives are being planned in 2009?
24
Vendor Utilization Ala Carte Option to Add
Currently utilizing a software planning tool? If yes, which software provider/ tool? 26
Currently utilizing a notification tool? If yes, which notification provider/ tool? 27
Currently utilizing a mobile recovery solution? If yes, which mobile recovery provider? 28
Reasons for Planning, Regulatory Requirements & Organizational Certification Ala Carte Option to Add
What are the primary reasons for developing and maintaining a program? 29
What regulatory requirement and or standard do organizations model the program after? 30-31
Has your organization achieved a certification in a standard? 31
If no, is the organization considering achieving an organizational certification? If yes, which organizational certifications have been achieved?
32
Thank you to our board, sponsors and those organizations who distributed the report. 33
About BC Management, Inc. & Where to Download Complimentary Business Continuity Management Compensation Reports. 33
Benchmarking. Plan Ahead. Be Ahead.
- This is a SAMPLE BEST in CLASS Report -
Our Best in Class report focuses on the current state of the
program, budgeting, personnel, program visibility, assessment,
exercising and auditing of the program for the most mature
programs customized to your industry. This document serves as a
sample to demonstrate the depth of data that we have available.
Data findings are collected via BC Management’s 8th Annual BCM
Study (active from February to December 2009).
For more information, please contact a BC Management representative at [email protected].

Copyright ©2009 BC Management, Inc. All rights reserved. SAMPLE Best in Class Report
Page 4
Since 2001 BC Management, Inc. has been gathering data on business continuity management programs and compensations to
provide professionals with the information they need to elevate their programs. Each year our organization strives to improve upon
the study questions, distribution of the study, and the reporting of the data collected. Below is a timeline detailing BC
Management’s eight years of business continuity reporting expertise.
* The advisory board is composed of 20 international thought leaders coming from the United States of America, Canada, Latin America, the United Kingdom, Singapore, Australia, China, Japan, and India. Our board is comprised of professionals in not only business continuity, but also risk management, emergency management, high availability and environmental health and safety.
The on-line study was developed by the BC Management team in conjunction with the BC Management International Benchmarking
Advisory Board. WorldAPP Key Survey, an independent company from BC Management, maintains the study and assesses the data
collected. The study was launched in February of 2009 and the study remains open for the duration of 2009. Participants were
notified of the study primarily through e-newsletters and notifications from BC Management and from many other industry
organizations. A full list of participating organizations is included within this report. The study has been translated in 5 languages
and it accommodates professionals who are permanently employed on a full-time or part-time basis, self-employed as an
independent contractor or unemployed. Respondents receive a unique path of branching questions, which is dependent upon their
experience and employment status. The study is coded with extensive logic to ensure a correct question branching path and to
eliminate unintelligible data. It is comprised of two sections spanning over 100 questions. The first section focuses on the factors
that impact compensations within the business continuity and related professions. The second section focuses on business
continuity program management initiatives, which includes budgets, dedicated personnel, organizational reporting structure,
maturity of the program, exercises, auditing, vendor utilization, program activation during an event and much more. Respondents
to the study have the option to complete one or both sections. Only those respondents who manage a program within business
continuity or a related discipline qualify to complete the program management portion of the study. All participants are given the
option of keeping their identity confidential.
Reporting History
Study Methodology

Copyright ©2009 BC Management, Inc. All rights reserved. SAMPLE Best in Class Report
Page 5
BC Management is continuously reviewing and verifying the data points received in the study. Data points in question are confirmed
by contacting the respondent that completed that study. If the respondent did not include their contact information, then their
response to the study may be removed. With our eight years of expertise in collecting and assessing such data points, BC
Management has an exceptional understanding of what is considered questionable or unintelligible data. To date BC Management
has contacted over 200 professionals to confirm their study response.
WorldAPP Key Survey built a customized reporting tool for BC Management, which enables us to prepare customized benchmarking
reports based on a client’s request. The result is a report that provides a unique understanding on how your program compares to
competitors or other similar organizations. Before creating the customized report, we verify the filters selected by the client and
confirm the number of respondents that will be included in their customized report. The charts and tables are instantaneously
created once the client agrees to the framework of the report. The client receives a PDF document, which details the study data
(within their filter specifications) covering 15 business continuity program management awareness topics. Additionally, BC
Management offers a business intelligence dashboard format that may be used for further assessment. The business intelligence
dashboard allows the client to further assess the data points within their customized report in a dynamic, user friendly interface.
Study respondent contact/company information remains confidential and is never revealed. The charts and graphs will reflect what
respondents answered in the study. If an option within a question is not selected by any respondents, than that option will not
appear on the charts and tables that have been automatically created. Within the study there were several questions that allowed a
respondent to select multiple options within a question, which resulted in the total percent of respondent calculations to exceed
100%. A notation has been included for each of these questions. The total percent may also approximately equal 100% due to
rounding up the data points. Incomplete/partial study responses were included as appropriate within the report.
3,223 study participants from 73 countries as of December 16, 2009. Incomplete/ partial study responses were included as
appropriate within the report. Study was divided into 2 sections.
Business Continuity Compensation – 2,907 study participants completed the compensation section from 57 countries.
Business Continuity Program Management – 912 study participants completed the program management section from 39 countries. Incomplete study responses were included within this report along with the completed responses.
Complete responses were received from the following countries: Australia, Bahrain, Bermuda, Brazil, Canada, Cayman Islands, China, Costa-Rica, Egypt, Finland, France, Germany, Greece, India, Indonesia, Ireland, Israel, Italy, Japan, Jordan, Kenya, Kuwait, Luxembourg, Malaysia, Mauritius, Mexico, Netherlands, New Zealand, Nigeria, Pakistan, Philippines, Poland, Russia, Saudi Arabia, Singapore, Switzerland, United Arab Emirates, United Kingdom, and United State of America.
USA Respondent Characteristics = 1,788 Study Respondents
Company Revenues span from non-profit/ government to over $400 Billion USD.
Study respondents span over 45 industries.
Average Number of Company Locations (Corporate/ Operational) = 16-25 Company Locations span from 0-5 Locations to more than 10,000.
Average Number of Company Locations (Retail/ Customer Interfacing) = 26-50 Company Locations span from 0-5 Locations to more than 10,000.
Average Number of Employees = 5,000 – 10,000 Company Employees span from 0-5 to more than 400,000.
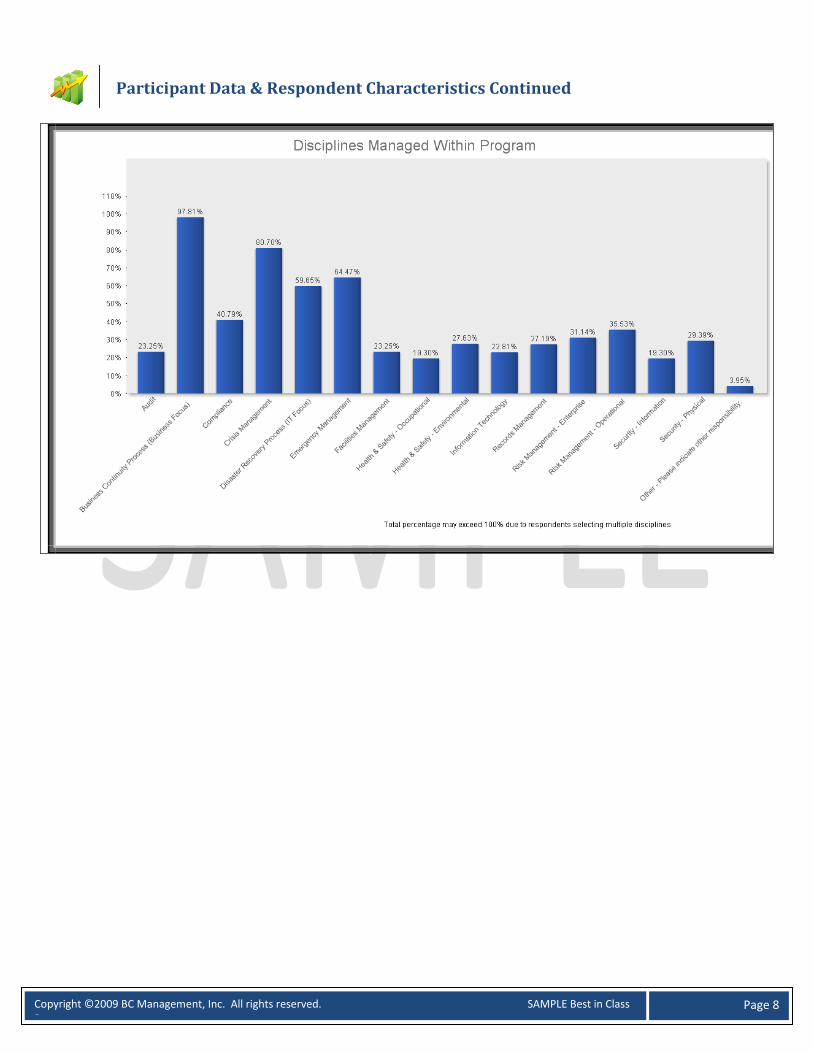
Majority of respondents (43%) managed 5+ disciplines within their program.
THIS IS A SAMPLE REPORT ONLY FOR THE PURPOSE OF HIGHLIGHTING THE DEPTH OF BC MANAGEMENT’S CUSTOMIZED BENCHMARKING
SERVICE OFFERING. THIS REPORT CONSISTS OF 48 RANDOMLY SELECTED STUDY RESPONSES.
Assessment of Data & Reporting
Participant Data & Respondent Characteristics

Copyright ©2009 BC Management, Inc. All rights reserved. SAMPLE Best in Class Report
Page 6
Participant Data & Respondent Characteristics Continued

Copyright ©2009 BC Management, Inc. All rights reserved. SAMPLE Best in Class Report
Page 7
Participant Data & Respondent Characteristics Continued
Copyright ©2009 BC Management, Inc. All rights reserved. SAMPLE Best in Class Report
Page 8
Participant Data & Respondent Characteristics Continued

Copyright ©2009 BC Management, Inc. All rights reserved. SAMPLE Best in Class Report
Page 9
Program Maturity
To your knowledge, do you feel your current IT/Disaster Recovery strategies adequately
support the needs of your organization?

Copyright ©2009 BC Management, Inc. All rights reserved. SAMPLE Best in Class Report
Page 10
To your knowledge, do you feel your current Business Continuity strategies ad equately
support the needs of your organization?
In your opinion, does your organization strive to maintain and foster relationships with
external agencies to ensure the recovery of your organization during a disaster? If your
organization is an external agency, do you strive to maintain and foster relationships with
other external agencies and outside organizations? Please rate on a scale of 1 to 5 with 1
meaning strong disagree and 5 meaning strongly agree.
Copyright ©2009 BC Management, Inc. All rights reserved. SAMPLE Best in Class Report
Page 11
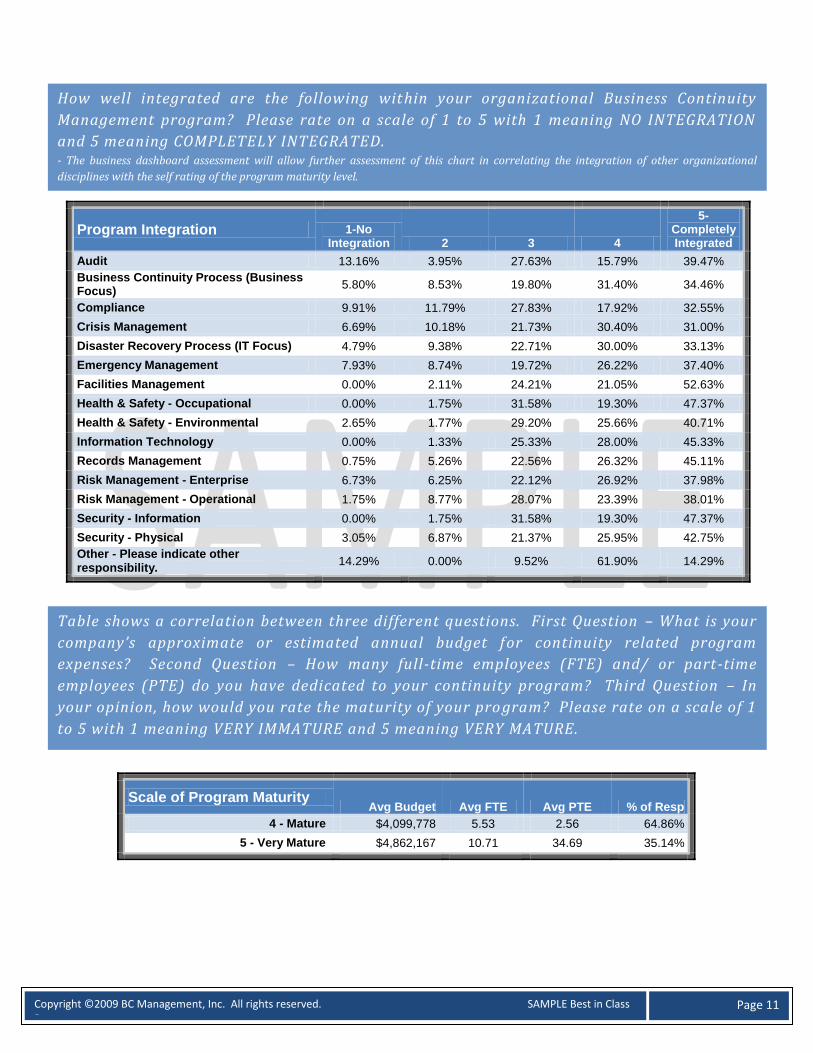
Program Integration 1-No Integration 2 3 4
5-Completely Integrated
Audit 13.16% 3.95% 27.63% 15.79% 39.47%
Business Continuity Process (Business Focus)
5.80% 8.53% 19.80% 31.40% 34.46%
Compliance 9.91% 11.79% 27.83% 17.92% 32.55%
Crisis Management 6.69% 10.18% 21.73% 30.40% 31.00%
Disaster Recovery Process (IT Focus) 4.79% 9.38% 22.71% 30.00% 33.13%
Emergency Management 7.93% 8.74% 19.72% 26.22% 37.40%
Facilities Management 0.00% 2.11% 24.21% 21.05% 52.63%
Health & Safety - Occupational 0.00% 1.75% 31.58% 19.30% 47.37%
Health & Safety - Environmental 2.65% 1.77% 29.20% 25.66% 40.71%
Information Technology 0.00% 1.33% 25.33% 28.00% 45.33%
Records Management 0.75% 5.26% 22.56% 26.32% 45.11%
Risk Management - Enterprise 6.73% 6.25% 22.12% 26.92% 37.98%
Risk Management - Operational 1.75% 8.77% 28.07% 23.39% 38.01%
Security - Information 0.00% 1.75% 31.58% 19.30% 47.37%
Security - Physical 3.05% 6.87% 21.37% 25.95% 42.75%
Other - Please indicate other responsibility.
14.29% 0.00% 9.52% 61.90% 14.29%
Scale of Program Maturity Avg Budget Avg FTE Avg PTE % of Resp
4 - Mature $4,099,778 5.53 2.56 64.86%
5 - Very Mature $4,862,167 10.71 34.69 35.14%
How well integrated are the following within your organizational Business Continuity
Management program? Please rate on a scale of 1 to 5 with 1 meaning NO INTEGRATION
and 5 meaning COMPLETELY INTEGRATED. - The business dashboard assessment will allow further assessment of this chart in correlating the integration of other organizational
disciplines with the self rating of the program maturity level.
Table shows a correlation between three different questions. First Question – What is your
company’s approximate or estimated annual budget f or continuity related program
expenses? Second Question – How many full-time employees (FTE) and/ or part-time
employees (PTE) do you have dedicated to your continuity program? Third Question – In
your opinion, how would you rate the maturity of your pro gram? Please rate on a scale of 1
to 5 with 1 meaning VERY IMMATURE and 5 meaning VERY MATURE.

Copyright ©2009 BC Management, Inc. All rights reserved. SAMPLE Best in Class Report
Page 12
Current State of the Business Continuity Management Program
% of Resp
State of Program by Program Maturity Rating
Very Immature Immature Average Mature
Very Mature
Currently obtaining or have management support and formulating the BCM program framework to include contingency strategies, resiliency needs, recovery objectives, operational and enterprise risk management and crisis management plans.
29.55% 0.00% 0.00% 0.00% 71.43% 28.57%
Currently conducting BIA or risk assessments. 57.14% 0.00% 0.00% 0.00% 68.97% 31.03%
Currently developing and implementing BC and/or IT DR plans that meet the needs of the organization.
32.29% 0.00% 0.00% 0.00% 86.67% 13.33%
Currently assessing an Emergency Operations Center.
7.44% 0.00% 0.00% 0.00% 66.67% 33.33%
Currently implementing an Emergency Operations Center.
8.81% 0.00% 0.00% 0.00% 100.00% 0.00%
A full functioning Emergency Operations Center is in place.
64.97% 0.00% 0.00% 0.00% 62.86% 37.14%
Policies and procedures are in place to interact and coordinate with external agencies in times of a disaster.
78.86% 0.00% 0.00% 0.00% 72.73% 27.27%
A Crisis Management process and plan is in place. 91.39% 0.00% 0.00% 0.00% 70.59% 29.41%
A Crisis Communications program is in place. 91.19% 0.00% 0.00% 0.00% 72.55% 27.45%
Considering conducting an enterprise risk assessment for the board and/ or senior management.
10.76% 0.00% 0.00% 0.00% 50.00% 50.00%
Currently conducting an enterprise risk assessment for the board and/ or senior management.
23.29% 0.00% 0.00% 0.00% 70.00% 30.00%
Incorporated a full enterprise risk management program with controls in place to avoid or mitigate potential risks.
58.51% 0.00% 0.00% 0.00% 70.97% 29.03%
Implemented a full functioning, corporate wide BCM program that meets the organization’s contingency, resiliency, risk management, emergency management and crisis management needs.
83.76% 0.00% 0.00% 0.00% 68.75% 31.25%
Implemented an awareness and training program to promote and educate the entire organization on the BCM program.
77.89% 0.00% 0.00% 0.00% 66.67% 33.33%
Maintain an assessment and audit schedule of the BCM program to ensure the program is up to date and complete.
89.24% 0.00% 0.00% 0.00% 73.08% 26.92%
Maintain an exercise schedule in order to identify new potential vulnerabilities or weaknesses in the current BCM program. Analyze findings to elevate the program.
96.67% 0.00% 0.00% 0.00% 71.93% 28.07%
Table shows a correlation between two different questions. First Question – In your
opinion, how would you rate the maturity of your program? Please rate on a scale of 1 to 5
with 1 meaning VERY IMMATURE and 5 meaning VERY MATURE. Second Question – Please
choose all that apply to describe your organization’s current continuity program status
under your direction and management. Please check all that apply .
- “% of Resp” column may exceed 100% due to multiple selections.

Copyright ©2009 BC Management, Inc. All rights reserved. SAMPLE Best in Class Report
Page 13
Budgeting of Program Expenses Avg Budget % of Resp
Program expenses are allocated independently from other functions within the organization.
$3,746,796 54.90%
Program expenses are allocated to other department(s). $6,193,056 35.29%
Program expenses do NOT have a defined budget. $1,577,200 9.80%
Total $4,410,490 100.00%
Budget Line Item % of Resp Include
Budget Item in Total Budget
% of Total Budget
Average Budget Amount
Full Time Internal Staff 63.51% 15.70% $1,945,215.56
Consultants/ Contractors (Business focus)
12.16% 2.39% $299,857.14
Consultants/ Contractors (IT focus) 10.81% 2.39% $237,857.14
Emergency Operations Center (EOC) 18.92% 4.10% $395,041.67
Hot-site/ Outsourced Alternate Site 29.73% 7.51% $1,071,156.36
Internal Recovery Site 35.14% 8.19% $958,821.25
Software 35.14% 8.19% $221,600.87
Notification/ Alerts 36.49% 7.85% $134,045.45
Mobile Recovery 5.41% 1.02% $318,053.33
DR Technology 31.08% 6.48% $1,259,528.95
Exercises 52.70% 12.97% $224,404.32
Training /Awareness 52.70% 11.95% $80,261.18
Travel 45.95% 11.26% $119,553.94
Other 1.35% 0.00% -
Average Total N/A 100.00% $4,410,490
*The average total budget in the table above may not equal the average total budget in the table at the top of the page because not
all respondents who answered the approximate annual budget for business continuity related program expenses indicated the
percent of total budget for individual budget line items.
Budgeting
Table shows a correlation between two different questions. First Question - Describe how
continuity program expenses are budgeted under your direction and management? Second
Question – What is your company’s approximate annual budget for contingency related
program expenses?
Table shows a correlation between three different questions. First Question – Please specify
what is accounted for in your annual budget. Please check box if the line item is currently
included in your program budget. Second Question – Please indicate the percent of the
overall program budget for each line item. Third Question – What is your company’s
approximate annual budget for contingency related program expenses? - “% of Resp Include Budget Item in Total Budget” column may exceed 100% due to multiple selections.

Copyright ©2009 BC Management, Inc. All rights reserved. SAMPLE Best in Class Report
Page 14
Disciplines – Current Personnel Multiple Disciplines Managed in Program Avg FTE Avg PTE % of Resp
Multi-Discipline 14 129 89.91%
Audit 2 30 7.89%
Business Continuity Process (Business Focus) 19 221 37.28%
Compliance 8 14 14.91%
Crisis Management 26 347 26.32%
Disaster Recovery Process (IT Focus) 30 274 22.81%
Emergency Management 41 515 15.35%
Facilities Management 2 30 6.58%
Health & Safety – Occupational 2 30 6.58%
Health & Safety - Environmental 2 30 6.58%
Information Technology 8 30 7.46%
Records Management 6 20 12.72%
Risk Management – Enterprise 8 17 11.84%
Risk Management – Operational 6 20 10.09%
Security – Information 2 30 6.58%
Security – Physical 2 30 6.58%
Average Total 15 129 N/A
Average Number of Disciplines Managed per Respondent: 4.4
Personnel
Table shows a correlation between two different questions. First Question – Please specify all the
disciplines that you personally manage. Select all that apply. Second Question - If you personally manage
more than one discipline within your program, please indicate how many full-time employees (FTE) and/
or part-time employees (PTE) you have dedicated to your continuity program? Please confirm that the
number below is the total FTE and PTE headcount for all locations under your direction and
management. (Auto-sum function built into study.) - “% of Resp” column may exceed 100% due to multiple selections.

Copyright ©2009 BC Management, Inc. All rights reserved. SAMPLE Best in Class Report
Page 15
Disciplines – Current Personnel One Discipline Managed in Program Avg FTE Avg PTE % of Resp
Audit - - 2.19%
Business Continuity Process (Business Focus) 2.00 - 24.12%
Compliance - - 6.14%
Crisis Management - - 16.67%
Disaster Recovery Process (IT Focus) 7.67 2.00 12.72%
Emergency Management - - 11.40%
Facilities Management - - 2.19%
Health & Safety - Environmental - - 3.07%
Information Technology - - 2.19%
Other - - 16.23%
Records Management - - 3.07%
Average Total 4.43 2.00 100.00%
This table has limited information because the majority of respondents personally manage more than one discipline within their continuity
program (3.95% of the respondents in this report manage one discipline within their continuity program.)
Table shows a correlation between two different questions. First Question – Please specify
all the disciplines that you personally manage. Select all that apply. Second Question - If
you personally manage one discipline within your program, please indicate how many full-
time employees (FTE) and/ or part-time employees (PTE) you have dedicated to your
continuity program?
Copyright ©2009 BC Management, Inc. All rights reserved. SAMPLE Best in Class Report
Page 16
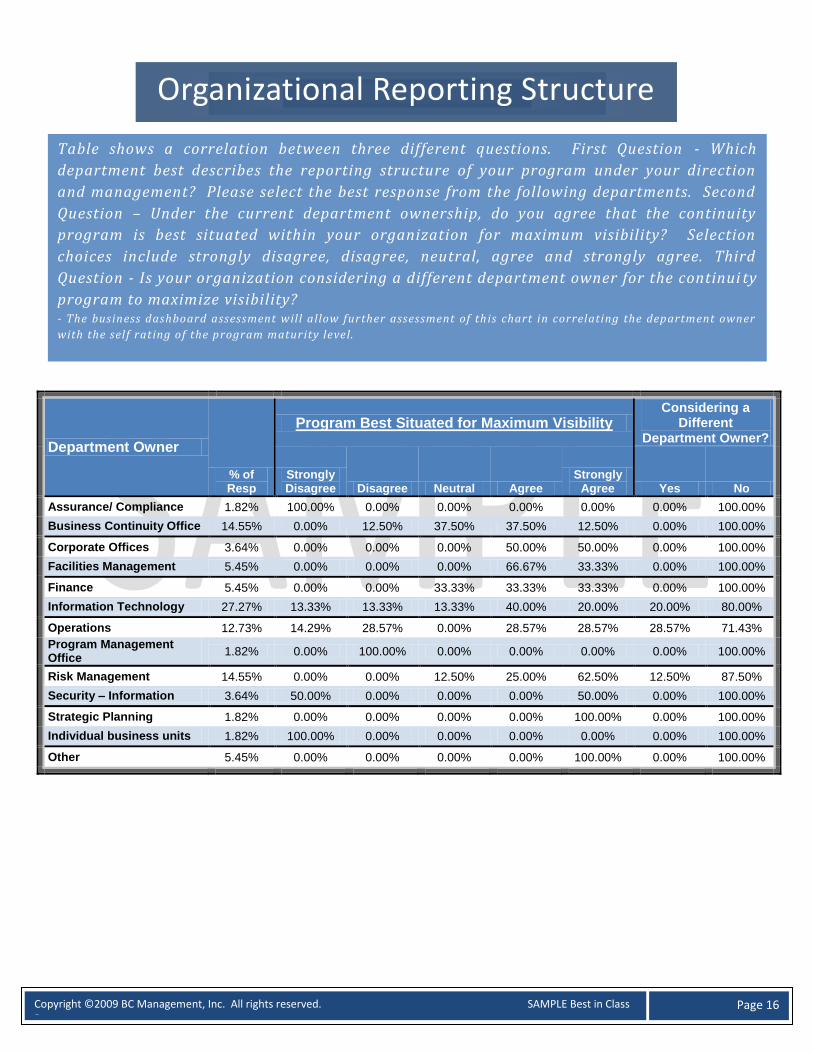
Department Owner
% of Resp
Program Best Situated for Maximum Visibility Considering a
Different Department Owner?
Strongly Disagree Disagree Neutral Agree
Strongly Agree Yes No
Assurance/ Compliance 1.82% 100.00% 0.00% 0.00% 0.00% 0.00% 0.00% 100.00%
Business Continuity Office 14.55% 0.00% 12.50% 37.50% 37.50% 12.50% 0.00% 100.00%
Corporate Offices 3.64% 0.00% 0.00% 0.00% 50.00% 50.00% 0.00% 100.00%
Facilities Management 5.45% 0.00% 0.00% 0.00% 66.67% 33.33% 0.00% 100.00%
Finance 5.45% 0.00% 0.00% 33.33% 33.33% 33.33% 0.00% 100.00%
Information Technology 27.27% 13.33% 13.33% 13.33% 40.00% 20.00% 20.00% 80.00%
Operations 12.73% 14.29% 28.57% 0.00% 28.57% 28.57% 28.57% 71.43%
Program Management Office
1.82% 0.00% 100.00% 0.00% 0.00% 0.00% 0.00% 100.00%
Risk Management 14.55% 0.00% 0.00% 12.50% 25.00% 62.50% 12.50% 87.50%
Security – Information 3.64% 50.00% 0.00% 0.00% 0.00% 50.00% 0.00% 100.00%
Strategic Planning 1.82% 0.00% 0.00% 0.00% 0.00% 100.00% 0.00% 100.00%
Individual business units 1.82% 100.00% 0.00% 0.00% 0.00% 0.00% 0.00% 100.00%
Other 5.45% 0.00% 0.00% 0.00% 0.00% 100.00% 0.00% 100.00%
Organizational Reporting Structure
Table shows a correlation between three different questions. First Question - Which
department best describes the reporting structure of your program under your direction
and management? Please select the best response from the following departments. Second
Question – Under the current department ownership, do you agree that the continuity
program is best situated within your organization for maximum visibility? Selection
choices include strongly disagree, disagree, neutral, agree and strongly agree. Third
Question - Is your organization considering a different department owner for the continui ty
program to maximize visibility? - The business dashboard assessment will allow further assessment of this chart in correlating the department owner
with the self rating of the program maturity level.

Copyright ©2009 BC Management, Inc. All rights reserved. SAMPLE Best in Class Report
Page 17
Sponsoring Job Title
How is Engaged is this Individual?
1 – Very Little Involvement 2 3 4
5 – Very Involved
Board/ General Council/ Executive Committee 0.00% 0.00% 50.00% 16.67% 33.33%
President 20.00% 20.00% 0.00% 20.00% 40.00%
CEO – Chief Executive Officer 0.00% 25.00% 25.00% 25.00% 25.00%
CIO/ CTO – Chief Information Officer/ Chief Technology Officer
9.09% 36.36% 18.18% 27.27% 9.09%
CSO/ CISO – Chief Security Officer/ Chief Information Security Officer
0.00% 0.00% 33.33% 33.33% 33.33%
CFO – Chief Financial Officer 0.00% 0.00% 0.00% 0.00% 100.00%
COO – Chief Operating Officer 25.00% 0.00% 25.00% 25.00% 25.00%
CAO – Chief Administrative Officer 0.00% 0.00% 100.00% 0.00% 0.00%
CRO – Chief Risk Officer 0.00% 0.00% 50.00% 0.00% 50.00%
CCO – Chief Continuity Officer 0.00% 0.00% 0.00% 0.00% 100.00%
Program Sponsorship
Please specify by job title who is totally engaged and sponsoring the continuity program
functions. Please select the best response.
If the program is being sponsored by a Chief Officer or above, is this person really engaged
in your opinion? Rate on a scale of 1 to 5 with 1 meaning Very Little Involvement and 5
meaning Very Involved.
- The business dashboard assessment will al low further assessment of this chart in correlating the job title of the
program sponsor with the self rating of the program maturity level.

Copyright ©2009 BC Management, Inc. All rights reserved. SAMPLE Best in Class Report
Page 18
Level of Separation from Executive Committee
% of Resp
Program Best Situated for Maximum Visibility
Considering a Different Level of
Sponsorship?
Strongly Disagree Disagree Neutral Agree
Strongly Agree Yes No
0 38.18% 0.00% 14.29% 9.52% 38.10% 38.10% 4.76% 95.24%
1 23.64% 7.69% 7.69% 7.69% 30.77% 46.15% 7.69% 92.31%
2 23.64% 0.00% 23.08% 7.69% 38.46% 30.77% 0.00% 100.00%
3 9.09% 20.00% 40.00% 0.00% 40.00% 0.00% 20.00% 80.00%
4 1.82% 0.00% 0.00% 0.00% 0.00% 100.00% 0.00% 100.00%
5 1.82% 0.00% 0.00% 0.00% 100.00% 0.00% 0.00% 100.00%
6+ 1.82% 100.00% 0.00% 0.00% 0.00% 0.00% 0.00% 100.00%
Table shows a correlation between three different questions. First Question – What is the
level of separation from the Executive Committee for this individual? Selection choices
include 0 to 6+. Second Question – Based on the current level of separation from the
Executive Committee, do you agree that the continuity program is best situated within your
organization for maximum visibility? Selection choices include strongly disagree, disagree,
neutral, agree and strongly agree. Third Question - Is your organization considering a
different level of sponsorship for the continuity program to maximize visibility?
- The business dashboard assessment will allow further assessment of this chart in correlating the level of separation
for the program sponsor from t he executive committee with the self rating of the program maturity level.

Copyright ©2009 BC Management, Inc. All rights reserved. SAMPLE Best in Class Report
Page 19
Program Assessment & Exercising Plans
How often does your company review and update the BIA for organizational processes
deemed critical and non-critical?
Copyright ©2009 BC Management, Inc. All rights reserved. SAMPLE Best in Class Report
Page 20
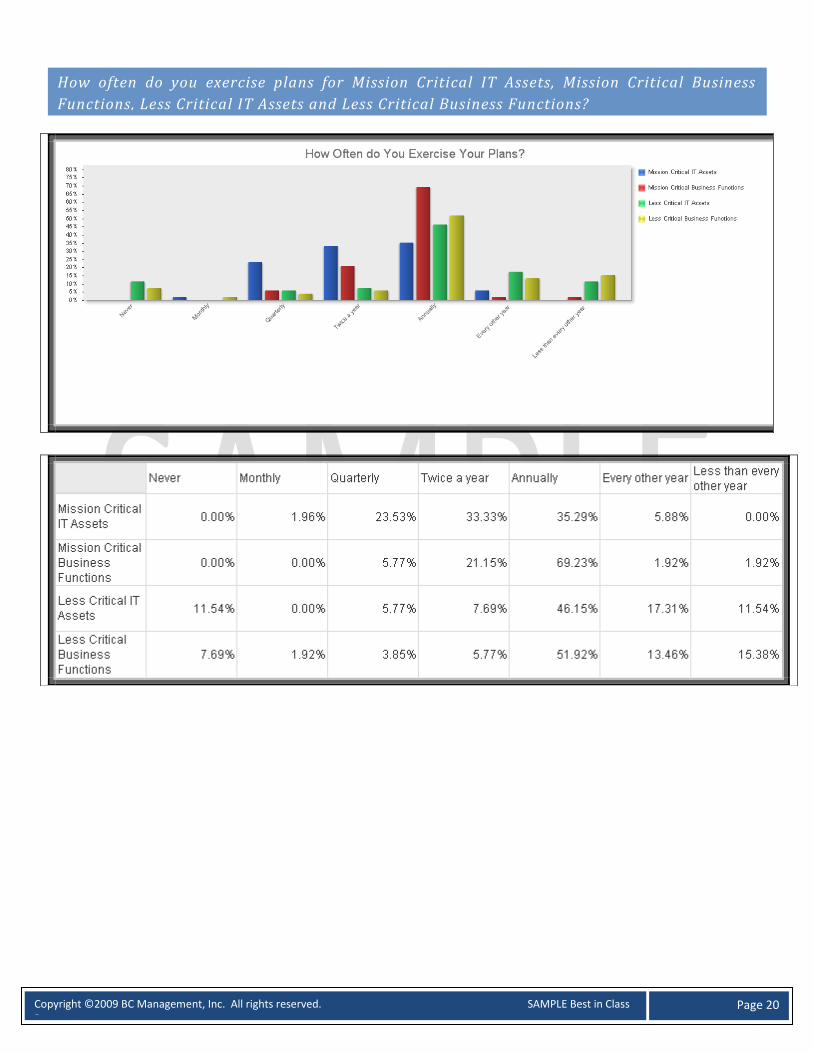
How often do you exercise plans for Mission Critical IT Assets, Mission Critical Business
Functions, Less Critical IT Assets and Less Critical Business Functions?

Copyright ©2009 BC Management, Inc. All rights reserved. SAMPLE Best in Class Report
Page 21
What type of scenarios have you implemented to exercise your plans? Select all that apply. - Total percent will exceed 100% due to multiple selections.
How often do your internal audit department and external auditor review your program?

Copyright ©2009 BC Management, Inc. All rights reserved. SAMPLE Best in Class Report
Page 22
ALA CARTE FIGURES TO ADD TO YOUR BEST IN CLASS REPORT AT $250
Recovery Time
When a critical system fails, what is your contingency program’s point of fa ilure to point of
availability/ up time for the service?
When a critical system fails, what is your contingency program’s point of failure to point of
recoverability? (How quickly should an application be restored to its original operational
level after it fails?)

Copyright ©2009 BC Management, Inc. All rights reserved. SAMPLE Best in Class Report
Page 23
ALA CARTE FIGURES TO ADD TO YOUR BEST IN CLASS REPORT AT $500
Figure below from “Top 10 Events by Financial Impact” tab – allow functionality to visually improve table.
Third Party Hot-Site/ Alternate Site Providers % of Resp
COL Ltd. 4.44%
Dell 6.67%
DRS 6.67%
EDS 6.67%
Hewlett-Packard 6.67%
IBM 55.56%
Rentsys 6.67%
SunGard 82.22%
Other 17.78%
Other Responses for Hot-Site/ Alternate Site Providers (as provided by respondents):
EOS, Chathum, IL; IBM; SunGard; VzB; Wanbishi; numerous other vendors;
Technology Recovery Solutions
Do you contract with a third-party hot site/ alternate site technology recovery vendor
under your direction and management?
If yes, who is your third party hot-site/ alternate site technology recovery vendor? Select
all that apply.
- Total percent may exceed 100% due to multiple selections.

Copyright ©2009 BC Management, Inc. All rights reserved. SAMPLE Best in Class Report
Page 24
ALA CARTE FIGURES TO ADD TO YOUR BEST IN CLASS REPORT AT $250
- Total percent may exceed 100% due to multiple selections.
Consulting Work in 2009 % of Respondents
Assessment
BIA 40.00% Facility Evaluation 10.00% Gap analysis 30.00% None/does not apply 10.00% Other 20.00% Risk Assessment 40.00% Technical 30.00%
Compliance/ Standard
BASEL II 10.00% BS25777 10.00% BS25999 Part 2 Business Continuity Management Systems 10.00% COBIT 20.00% DRI International Professional Practices 10.00% FFIEC 50.00% Good Practice Guidelines 2008 (BCI) 20.00% Gramm Leach Bliley Act (GLBA) 40.00% HIPAA 10.00% ISO 20000 IT Service Management 10.00% Local Banking Superintendency Requirement 10.00% NFPA 1600 20.00% None/does not apply 30.00% NYSE 446/NASD 3500 10.00% OSHA Compliance 10.00% Patriot Act 20.00% Sarbanes Oxley 20.00% SEC Regulations 20.00% Title IX 20.00%
BC Program (Business Processes)
Awareness 30.00% Crisis Mgt (Emergency Operations Center) 20.00% Development 10.00% Documentation 50.00% Emergency Management 10.00% Exercise 30.00% Implementation 10.00% None/does not apply 30.00% Pandemic Planning 30.00%
Consulting Initiatives
Will you be engaging in consulting work in 2009 for your program under your direction and
management?
What consulting initiatives are you planning in 2009 in regards to ASSESSMENT,
COMPLIANCE/ STANDARD, BC PROGRAM, DR PROGRAM AND GENERAL MANAGEMENT OF
PROGRAM? - Total percent may exceed 100% due to multiple selections.

Copyright ©2009 BC Management, Inc. All rights reserved. SAMPLE Best in Class Report
Page 25
DR Program (IT Processes)
Back-up/Resiliency 30.00% Development 10.00% Documentation 50.00% Exercise 20.00% High availability/ Operational Resilience 30.00% Implementation 10.00% None/does not apply 30.00%
General Continuity Consulting
BCM Policy 10.00% Customer Training 10.00% Electronic Risk 10.00% Executive Buy-in 10.00% Media/ Event Planning 10.00% None/does not apply 50.00% Operational Risk 20.00% Project Management 20.00% Recommendations 10.00% Software Implementation 20.00% Strategic Planning 20.00%
Other Consulting Initiatives for 2009 (as provided by respondents):
Assessment Work –
Business Process Flow Analysis
Pandemic Planning
Compliance/ Standard Work –
BC Program (Business Processes) Work –
DR Program (IT Processes) Work –
Other General Continuity Consulting Work –

Copyright ©2009 BC Management, Inc. All rights reserved. SAMPLE Best in Class Report
Page 26
ALA CARTE FIGURES TO ADD TO YOUR BEST IN CLASS REPORT AT $750
Software Providers % of Resp
21st Century Software
DR/VFI 8.62%
Archer Technologies
Archer SmartSuite Framework 3.45%
CPACS, LLC RecoveryPAC Full 1.72%
eBRP Solutions Inc. Toolkit Suite 1.72%
NC4 E-TEAM 3.45%
SunGard
BIA Professional 18.97%
EPlanner 1.72%
Incident Manager, powered by Web EOC
3.45%
LDRPS 56.90%
Paragon 1.72%
Precovery 1.72%
Virtual Corporation Sustainable Planner 6.90%
Non-BCP Focused Packages
(Word, Excel or Sharepoint) 34.48%
Other 27.59%
Other Responses for Software Providers (as provided by respondents):
; Crisis Commander; HSEEP; In house system; Internal Application; LDRPS; Lotus Notes; Starfish; company proprietary; proprietary
in house tool;
Vendor Utilization
Do you utilize software planning tools to assist with your Business Continuity Management
program initiatives under your direction and management?
If yes, which software tool(s) do you utilize? Select all that apply. - Total percent may exceed 100% due to multiple selections.

Copyright ©2009 BC Management, Inc. All rights reserved. SAMPLE Best in Class Report
Page 27
Automated Notification Providers % Of Resp
3N 3n InstaCom Enterprise 8.11%
DCC- Dialogic Communications Corp. The Communicator! NXT 10.81%
Dell Message One AlertFind 27.03%
MIR3 inEnterprise 2.70%
TelAlert Massaging Server 2.70%
Send Word Now SWN Alert Service 10.81%
SunGard NotiFind, powered by Varolli 24.32%
Varolii First Responder Communications 5.41%
Enterprise Business Continuity 5.41%
Other 13.51%
Other Responses for Notification Providers (as provided by respondents):
; At Hoc; CallCIA.com communications blast site; Missionmode; Proprietary; embedded solution in Crisis Commander;
Do you utilize automated emergency notification tools to assist with your Business
Continuity Management program initiatives under your direction and management?

Copyright ©2009 BC Management, Inc. All rights reserved. SAMPLE Best in Class Report
Page 28
Mobile Recovery Providers % of Resp
Agility 7.14%
RentSys 57.14%
SunGard 64.29%
Other Responses for Mobile Recovery Providers (as provided by respondents):
Do you utilize a mobile recovery solution to assist with your Business Continuity
Management program initiatives under your direction and management?
If yes, which mobile recovery provider(s) do you utilize? Select all that apply. - Total percent may exceed 100% due to multiple selections.

Copyright ©2009 BC Management, Inc. All rights reserved. SAMPLE Best in Class Report
Page 29
ALA CARTE FIGURE TO ADD TO YOUR BEST IN CLASS REPORT AT $250
Reasons for Developing and Maintaining a Program
1 - Low Priority 2 3 4
5 - High Priority
History of business interruption(s) 17.31% 23.08% 28.85% 9.62% 21.15%
Minimize future impact 0.00% 1.92% 7.69% 32.69% 57.69%
Protect stakeholders 0.00% 0.00% 7.55% 32.08% 60.38%
Comply with regulations or laws 0.00% 1.89% 13.21% 28.30% 56.60%
In response to audit results/recommendations 1.89% 18.87% 30.19% 32.08% 16.98%
Good business sense 1.89% 0.00% 7.55% 37.74% 52.83%
Right thing to do 3.77% 1.89% 16.98% 32.08% 45.28%
Customer requirement 1.89% 9.43% 24.53% 39.62% 24.53%
Contractual agreements/service-level agreements
5.66% 7.55% 30.19% 35.85% 20.75%
Insurance policy recommendation 13.46% 26.92% 38.46% 13.46% 7.69%
Organization wants to be globally competitive and must comply with international standards.
17.31% 13.46% 25.00% 21.15% 23.08%
Organization wants to be perceived to be compliant with good Corporate Governance.
3.77% 7.55% 22.64% 30.19% 35.85%
Organization wants to ensure safety of their employees.
3.77% 1.89% 9.43% 11.32% 73.58%
Organization wants to protect and increase its economic value.
1.89% 3.77% 13.21% 28.30% 52.83%
Protection of reputation and brand of organization.
1.89% 0.00% 9.43% 20.75% 67.92%
Reasons for Planning, Regulatory Requirements & Organizational Certification
Please rate the following primary reasons for developing & maintaining a program on a
scale from 1 to 5 with 1 meaning LOW PRIORITY and 5 meaning HIGH PRIORITY.

Copyright ©2009 BC Management, Inc. All rights reserved. SAMPLE Best in Class Report
Page 30
ALA CARTE FIGURE TO ADD TO YOUR BEST IN CLASS REPORT AT $250
Regulatory Requirement/ Standard 1 - Low priority 2 3 4
5 - High priority
Not Applicable
BS25999 Part 2 Business Continuity Management Systems
23.08% 10.26% 25.64% 5.13% 10.26% 25.64%
BS25777 23.53% 5.88% 14.71% 2.94% 8.82% 44.12%
BS 31100 (Risk Management) 29.41% 2.94% 5.88% 5.88% 5.88% 50.00%
BASEL II 17.14% 5.71% 20.00% 11.43% 8.57% 37.14%
BCI Good Practice Guidelines 23.53% 8.82% 5.88% 17.65% 17.65% 26.47%
COBIT 18.18% 15.15% 18.18% 0.00% 6.06% 42.42%
DRI International Professional Practices 10.53% 0.00% 18.42% 18.42% 36.84% 15.79%
FFIEC 7.14% 4.76% 2.38% 14.29% 50.00% 21.43%
Good Practice Guidelines 2008 (BCI) 27.27% 6.06% 12.12% 0.00% 15.15% 39.39%
Gramm Leach Bliley Act (GLBA) 15.00% 7.50% 10.00% 12.50% 30.00% 25.00%
HB 167:2006 – Security Risk Management (Australia Standard)
35.48% 3.23% 3.23% 0.00% 3.23% 54.84%
HB 203:2006 – Environmental Risk Management (Australia Standard)
35.48% 6.45% 3.23% 0.00% 0.00% 54.84%
HB 221:2004 (Australia Standard) 35.48% 6.45% 3.23% 0.00% 0.00% 54.84%
HB 292-2006 (Australia Standard) 36.67% 3.33% 3.33% 0.00% 0.00% 56.67%
HB 436:2004 – Risk Management (Australia Standard) 36.67% 6.67% 0.00% 0.00% 0.00% 56.67%
HIPAA 23.53% 8.82% 2.94% 2.94% 14.71% 47.06%
Hong Kong Monetary Authority 32.26% 9.68% 3.23% 3.23% 6.45% 45.16%
ISO 14001 Environmental Management 31.25% 6.25% 3.13% 0.00% 6.25% 53.13%
ISO 9000 Fundamentals and Vocabulary of Quality Systems
31.25% 9.38% 3.13% 0.00% 9.38% 46.88%
ISO 9001 Quality Management 28.13% 9.38% 6.25% 3.13% 12.50% 40.63%
ISO 27001 Information Security 24.24% 3.03% 6.06% 9.09% 18.18% 39.39%
ISO 20000 IT Service Management 29.03% 3.23% 6.45% 3.23% 9.68% 48.39%
Joint Commission (Hospitals) 34.48% 6.90% 0.00% 3.45% 0.00% 55.17%
Local Banking Superintendency Requirement 34.38% 3.13% 6.25% 3.13% 9.38% 43.75%
MS 1970 (Malaysia Standard) 32.26% 12.90% 0.00% 3.23% 0.00% 51.61%
What regulatory requirement and/ or standard do you mo del your Business Continuity
Management program after. Rate on a scale of 1 to 5 with 1 meaning LOW PRIORITY and 5
meaning HIGH PRIORITY. Please include Not Applicable (N/A) if the regulatory
requirement and/or standard do not apply to your organization.

Copyright ©2009 BC Management, Inc. All rights reserved. SAMPLE Best in Class Report
Page 31
NFPA 1600 13.51% 10.81% 10.81% 13.51% 18.92% 32.43%
NFPA 1600 (Canadian Version) 34.38% 6.25% 6.25% 0.00% 6.25% 46.88%
NYSE 446/NASD 3500 25.00% 3.13% 9.38% 3.13% 9.38% 50.00%
OSHA Compliance 17.14% 8.57% 14.29% 11.43% 14.29% 34.29%
Patriot Act 20.59% 8.82% 14.71% 2.94% 23.53% 29.41%
Prudential Standard APS 232 on BCM (Australia) 35.48% 6.45% 0.00% 0.00% 0.00% 58.06%
Prudential Standard GPS 222 on BCM (Australia) 35.48% 6.45% 0.00% 0.00% 0.00% 58.06%
Prudential Standard LPS 232 on BCM (Australia) 36.67% 3.33% 0.00% 0.00% 0.00% 60.00%
Sarbanes Oxley 11.90% 4.76% 7.14% 14.29% 33.33% 28.57%
SEC Regulations 15.38% 2.56% 10.26% 15.38% 28.21% 28.21%
SS540/TR19 (Singapore Standard) 35.48% 9.68% 3.23% 0.00% 3.23% 48.39%
Title IX 34.38% 6.25% 3.13% 0.00% 9.38% 46.88%
Other 14.29% 0.00% 0.00% 0.00% 4.76% 80.95%
ALA CARTE FIGURES TO ADD TO YOUR BEST IN CLASS REPORT AT $500
Has your organization achieved certification in a standard?
Copyright ©2009 BC Management, Inc. All rights reserved. SAMPLE Best in Class Report
Page 32
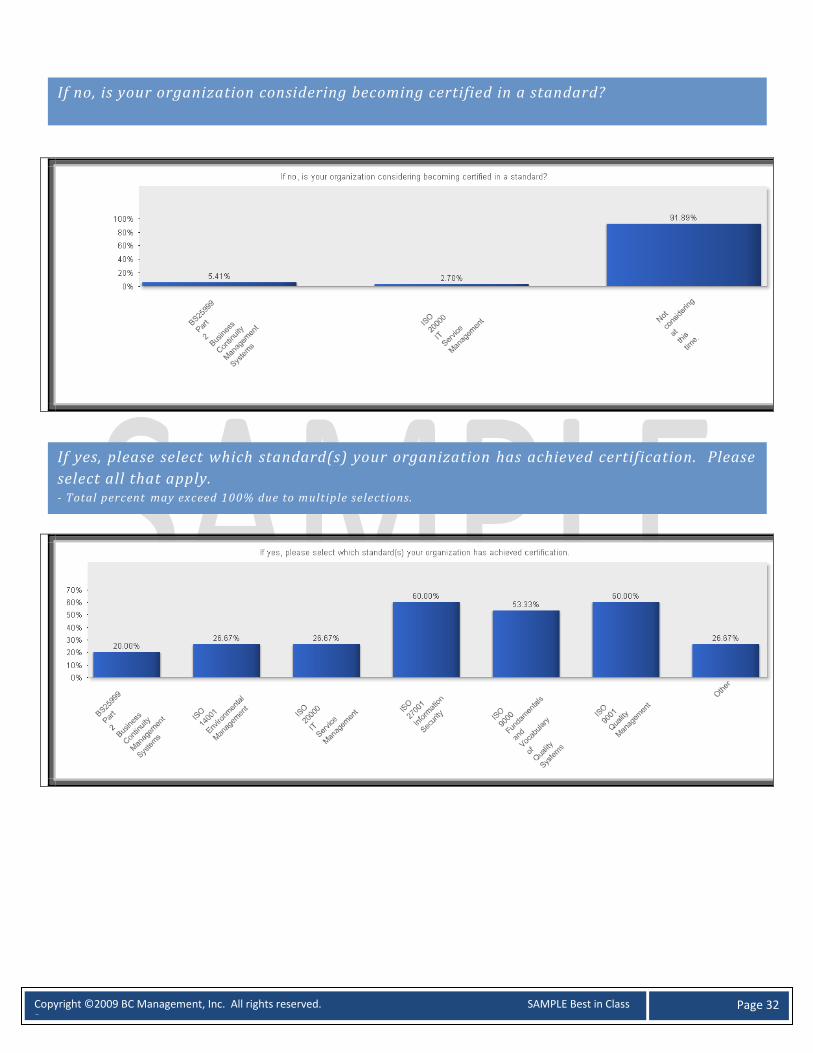
If no, is your organization considering becoming certified in a standard?
If yes, please select which standard(s) your organization has achieved certification. Please
select all that apply. - Total percent may exceed 100% due to multiple selections.

Copyright ©2009 BC Management, Inc. All rights reserved. SAMPLE Best in Class Report
Page 33
BC Management’s International Benchmarking Advisory Board was instrumental in reviewing the study and eliminating several
assumptions that are typically overlooked in other surveys. As a team they were also focused on the topics that are of the greatest
interest to continuity professionals today. The goal was to ensure a credible report that would add value to the business continuity
profession. BC Management also greatly appreciates the efforts of those organizations that assisted in this global effort. A full
listing is included in customized benchmarking reports. We would also like to extend a special recognition to the two sponsoring
organizations that assisted with translating our study. The study may not have been available in Chinese and Japanese if it wasn’t
for the assistance of our sponsors.
Sponsored the Chinese Translation
BC Management, Inc. was founded in 2000. We are an executive search and research firm solely dedicated to the business
continuity, disaster recovery, risk management, emergency management, crisis management and information security professions.
With decades of industry expertise, our staff has a unique understanding of the challenges professionals face with hiring,
benchmarking and analyzing best practices within these niche fields.
BC Management’s Complimentary Research
BC Management has been collecting data on the factors that impact compensations and business continuity programs since 2001.
To download our complimentary reports please visit www.bcmanagement.com.
We Value Your Comments
Thank you for participating in our annual study. Your contribution adds value to our comprehensive reporting and allows us the
opportunity to assess industry trends. Please share any comments or suggestions on how we can elevate our study or reporting at
About BC Management, Inc.
Sponsored the Japanese translation
Thank you to our Board, Sponsors and Distributing Organizations