business-aligned availability and performance management · · 2009-03-17front cover end-to-end...
TRANSCRIPT

Front cover
End-To-End Availability and Performance Management using IBM Tivoli Solutions
Budi DarmawanGrake ChenLaszlo Varkonyi
Plan a Tivoli performance and availability solution
Utilize the product selection and integration guide
Understand the value of the ITIL-based management approach
Redguides for Business Leaders

Executive overview
Availability and performance are important topics in today’s IT environment. In addition, they are the basic requirements for any IT system in order to support the business operations smoothly. To meet the business requirements for availability and performance, IT administration must have related management processes to follow to ensure the availability and performance of the business systems. Information Technology Infrastructure Library (ITIL®) is a good approach. ITIL provides the best practice for IT service management, and the most relevant ITIL processes for availability and performance are the Availability Management and Capacity Management processes.
Many aspects of infrastructure management can be described through a management maturity model. This model can be used to illustrate the evolution phases that lead from a resource management-focused approach to a service management-centric approach. We also introduce the IBM® service management concept, its content, and the alignment with ITIL recommendations.
After understanding the logical structure of the systems management solution set, we also show how to position that systems management solution set to build a comprehensive blueprint.
In this IBM Redguide™ publication, we also provide a more detailed discussion of the Tivoli® solutions. This discussion provides a structured approach to the broad set of Tivoli solutions in the availability and performance management area. You can find descriptions of key offerings at these areas and summaries of product functionalities, as well as links to further information and publications on IBM Web pages. This product information can help you determine the proper solution components when designing availability and performance management environments.
Finally, we describe several scenarios that can help you to understand the monitoring solution for performance and availability. The scenarios are designed with varying complexity to show you various options on the management solutions. The sample scenarios illustrate the opportunity to choose a certain set of Tivoli solutions. There might be other ways of delivering a solution with a different set of products. We provide these scenarios only as examples of choosing the solution.
© Copyright IBM Corp. 2009. All rights reserved. 1
ITIL overview
Information Technology Infrastructure Library (ITIL) is a collection of IT best practices that are designed to help organizations to have better service management. Originally created by the U.K. Office of Government Commerce, ITIL is the result of years of experience contributed by major IT organizations and companies, including IBM.
In today’s environment, businesses have an increasing dependency on IT. In addition, the IT environment is becoming more complex with an increasing rate of change and cost. IT managers need a way to better align IT services with business objectives, to make the long-term costs of IT services lower, and to improve the quality of IT services. ITIL is an option to help with these issues.
ITIL consists of a library of books that document industry-accepted best practices for IT services, infrastructure, and application management. ITIL is an excellent starting point from which to adopt and to adapt best practices for implementation in any IT environment.
ITIL’s models show the goals, general activities, inputs, and outputs of the various processes. It helps an organization to address the most common questions asked by IT managers worldwide, such as:
� How do I align IT services with business objectives? � How do I lower the long-term costs of IT services?� How do I improve the quality of IT services?
ITIL can help to align IT services with the current and future needs of the business and its customers, to improve the quality of the IT service delivered, and to reduce the long-term cost of service provision.
Availability management
Availability management is a process inside ITIL service delivery processes. The goal of availability management is to ensure a cost-effective operation for delivering a defined level of availability of IT services to meet the business requirements.
In today’s environment, businesses require IT to provide services for operation in a timely way. Any service interruption causes business loss and impacts customer satisfaction. Availability normally is the first priority consideration for IT services operation.
Availability management understands the IT service requirements of the business. It plans, measures, monitors, and strives continuously to improve the availability of the IT infrastructure to ensure that the agreed-upon requirements are consistently met.
There are several indications that are important in availability management. These are the key items that we need to consider and manage in availability management processes. They are:
� Availability
Ability to perform the expected functionality over a specified time
� Reliability
Ability to perform the expected functionality, over a certain period of time, under prescribed circumstances
2 End-To-End Availability and Performance Management using IBM Tivoli Solutions
� Maintainability
Ease of the maintenance of the IT service
� Serviceability
Inclusion of all relevant contract conditions of external suppliers to maintain the IT service
� Resiliency
Ability of an IT service to function correctly in spite of the incorrect operation of one or more subsystems
Supporting the availability management process effectively requires a range of monitoring and management tools to help in activities, such as measurement, monitoring, analyzing, and reporting. The tools that are required depend on the availability and automation requirements for daily availability management operations.
The tools chosen need to provide the following functions:
� Monitoring for the specified target of an IT resource or service� Alerting for errors or threshold violations � Providing a reporting facility for generating the required management reports� Reducing human errors and enhancing the quality of system management through the
use of centralized system management
For monitoring, consider multiple views to set the monitoring target. You can use these monitoring views:
� Individual IT component view� Application view� IT service view
You need multiple views, because you have a different measurement focus for each aspect of your business. From the IT services view, the concern is about service availability. From the application view, the concern is about application availability, and from the IT component view, the concern is about IT component availability. The three views have a layered relationship. That is, the IT service view is on the top, the application view is in the middle, and the IT component view is at the bottom. With the three monitoring views, you have better control for service management for availability.
The IT component view focuses on the resource monitoring for IT components. You want to know the status for each IT component and whether any error exists for the IT component.
The application view focuses on the composite application monitoring. You want to know the running status for middleware and applications. An application’s transaction might traverse multiple servers and work correctly depending on all of the underlining IT components that are running.
The service view focuses on the IT services. You want to know that the required IT services are available for business operation.
Capacity management
Capacity management is a process inside ITIL service delivery processes. The goal of capacity management is to ensure that the capacity of IT resources can be provided to match the demands of business for IT services in a timely and cost-effective way.
3

From this goal, the important tasks that you need to consider in capacity management include:
� Matching the capacity of the IT services and infrastructure to the current and future identified needs of the business and to have a scalable plan for IT infrastructure.
� Knowing the usage trend of IT capacity and to avoid incidents that are caused by a lack of capacity.
� Tuning the IT components to have an efficient operation and better utilization.
To facilitate capacity management and make it more effective and efficient, your organization needs automation tools to help in activities, such as modeling, monitoring, analyzing, reporting, and tuning in capacity management.
To support the capacity management process effectively, a range of monitoring and management tools is required. The requirements of tools depend on the capacity requirements and the level of automation that is required for daily capacity management operations. Normally, the tools in availability management also provide the required functions for capacity management.
The tools need to be able to:
� Collect performance data from IT components, composite applications, and services.
� Provide a central repository for the historical performance data. Then, the tools can produce the statistical performance information report.
� Provide trend analysis and simulation modeling for future requirement estimation.
Consider tools for capacity management can be from three perspectives: business capacity management, service capacity management, and resource capacity management. Because the focus and perspective of each of these views differ, the tools requirements differ:
� Business capacity management
Needs tools to support trend analysis, modeling, prototyping, and sizing to forecast future business requirements
� Service capacity management
Needs tools to support monitoring, analyzing, tuning, and reporting on service performance
� Resource capacity management
Needs tools to support monitoring, analyzing, and reporting on the utilization and performance of the IT components
Maturity levels in the infrastructure management
Today, commercial and government organizations are dependent on electronic information processing through computer networks, and especially through the Internet. Organizations run mission-critical applications at any time and place in the world. Business processes, activity, and infrastructure—and thus our global society—are dependent on this IT layer of organizations.
Organizations need to know what is happening with their business at all times. For example, they need to know whether mission-critical applications are available and working properly and how to detect and prevent a potential crisis in business processes, activity, or
4 End-To-End Availability and Performance Management using IBM Tivoli Solutions

infrastructure. If a crisis occurs, they need to understand immediately the business impact, the root cause, the problem, and how to correct the problem.
Organizations typically have an IT environment that includes resources from multiple vendors that are running on multiple platforms and are possibly spread across multiple locations. In this IT environment, understanding the status of a particular IT resource is only a small part of the big picture. To maximize the business value of IT investments, organizations must also understand how each resource affects the applications, business services, and business processes that it supports.
The ultimate goal in any IT environment is to keep the IT environment running efficiently and effectively and, when multiple problems occur, to prioritize the workload effectively.
To support this goal, organizations implement infrastructure management environments that monitor and manage their IT environment from multiple perspectives. The solution scope ranges from simple resource monitoring up to the advanced business-focused service management. Alternatively, in terms of the corresponding operation processes, they want to move further and further from an ad hoc, reactive mode of monitoring IT to a process-based, proactive model of managing IT as a business according to best practices.
Figure 1 shows how IT management can evolve from being a technology-focused environment to an on-demand, autonomic, and business-focused environment. In Figure 1, the horizontal axis represents the focus shift from technology to business, and the vertical axis shows the evolution toward an on demand environment.
Figure 1 Evolution of management focus
In the following sections, we discuss these three levels of maturity.
Resource management
Resource management is characterized by an ad hoc, reactive mode of resolving infrastructure problems. A centralized management tool does not exist. Instead, the IT organization relies on internal procedures, custom scripts, or siloed applications that are designed only to check problems with specific systems and resources. These tools usually do not reach any farther than just the technology component that is monitored.
Resource M anagem ent
Manage IT as technology
Siloed management data
Availability centric
Manual processes
Manual change control
System s & Inform ationM anagem ent
Manage IT as cost center
Performance centric
Centralized processes
Automated change control withindomains
IT Service M anagem ent
Manage IT as a business
Measuring in terms ofbusiness value
Integrated processes
Transition from reactive toproactive
Integrated management data(CMDB)
IT IT M anagem entM anagem ent FocusFocus
Bus
ines
s B
usin
ess
Envi
ronm
ent
Envi
ronm
ent
TechnologyTechnology focusfocus Business Business focusfocus
Trad
ition
alTr
aditi
onal
On
On
Dem
and
Dem
and
5
While this approach prevents some problems, systems administrators spend much of their time investigating performance problems and failures after they occur. System outages or access failures are typically reported by employees, field personnel, or customers. The process from problem discovery to problem resolution or that of handling change requests is often human-intensive and time-consuming.
Systems and information management
The systems and information management environment at the next level already relies on more automation and centralization.
With this level, the administrators can oversee the whole infrastructure using a unified view that shows, in a single user interface, all of the IT components or resources that are managed: servers, applications, operating systems, databases, clients, and so on. It also shows the relationships among resources, for example, which applications are running on which servers, which servers are connected in which portions of the network, and the ability of clients to connect to those resources. With a unified view, the IT administrators can navigate among related resources and perform basic health analysis on consolidated management data.
Centralizing the management information also means that advanced correlation can be done using events or monitoring data coming from different parts of the infrastructure. To make the most appropriate and timely actions, administrators can count on correlation features that help isolate the roots of problems.
Service management
IT organizations at the first two levels are only able to handle availability and performance from a technology point of view. Systems and information management only provides the capability to perform correlation at the technology domain level, no information is available about how certain technology elements (servers, networking devices, applications, and so on) contribute to the smooth running of business operations. From another perspective, no data is present that can tell which business function will fail in case of the failure of certain technology components in the infrastructure.
The next level, IT service management, is a key leap towards business-centric management. It adds the additional layer that can be used to build the link between technology and business functions.
At this level, the organization moves from viewing collections of resources and applications to understanding the business service that is delivered by these resources and applications. To help in prioritizing problems according to their business impact, administrators aggregate resources and applications (especially composite applications) into business service views that reflect the way that the IT environment supports the business. So, they are no longer limited to infrastructure or technology-level information. All of these resources and applications can be related to business relevant metrics and priorities through the business service views.
At this level, we need to introduce the following new terms:
� Business service management is the planning, monitoring, measurement, and maintenance of the level of service that is necessary for the business to operate optimally. The goal of business service management is to ensure that business processes are available when they are needed. Proper business service management is critical for relating IT performance to business performance.
6 End-To-End Availability and Performance Management using IBM Tivoli Solutions

� A business service is a meaningful activity that provides business value and is done for others. It is supported by one or more resources or applications and has a defined interface. A business process is a set of related activities that collectively produces value to an organization, its customers, or its stakeholders. An insurance claim process is an example of a business process. An online claim filing system is an example of a business service that is part of an insurance claim process.
� A business system is a set of IT resources that collectively supports one or more business services. The terms business service and business system are sometimes used interchangeably.
IT service management also means that IT is managed as an individual business unit that provides services to other units within or outside of the organization. These services are usually measured against service level agreements (SLAs).
To meet the service level requirements, organizations aiming for the level of IT service management need to have integrated processes that are able to consistently control IT operations end-to-end. These organizations need to integrate and automate IT processes across organizational silos, with the ultimate goal of creating a process-based, proactive model for managing IT according to best practices.
This is the level that ITIL best practices discuss. In terms of the ITIL recommendations, the key component within the management architecture is the configuration management database (CCMDB). It supports the collection of IT resources and the mapping of business services to IT equipment. IT operation processes, such as incident, problem, change, or configuration management, rely on the CCMDB and on the integrated management data (configuration and topology information) that is stored in the CCMDB.
In the next section, we provide an overview of the IBM service management blueprint, which breaks down the management infrastructure components into clearly defined layers. These layers can be aligned logically with the management environments at different maturity levels.
Managing services with IBM service management blueprint
This section provides a short overview of IT service management and how it relates to the IBM blueprint.
Business perception of services
IT service management is the management of IT systems with a primary focus on the business perception of IT contribution and value to the business. IT service management has the following primary objectives:
� To align IT services with the current and future needs of the business and its customers
� To improve the quality of IT services
� To reduce the long-term cost of providing IT services based on a service level agreement
The providers of IT services measure, manage, and report on the business impact of the IT environment.
IT service management is used to streamline business processes, optimize resources to manage costs, manage productivity efficiently, and increase revenue, which in turn, helps to ensure that the business meets its objectives. IT service management innovation can bring more efficiency and effectiveness to the management of IT.
7
In today’s environment, large IT organizations are challenged by:
� Greatly increasing complexity, such as composite applications and Web services that cross multiple systems
� Strong requirements for compliance with internal policies and governmental regulations
� Increasing demands for IT services
In this environment, IT organizations must move beyond having topical experts (such as for databases, UNIX® servers, mainframes, or storage) who use specialized tools within an organizational silo. IT organizations must greatly improve communication and responsiveness among IT specialists by implementing and enforcing consistent cross-organization IT management processes.
The IBM service management blueprint
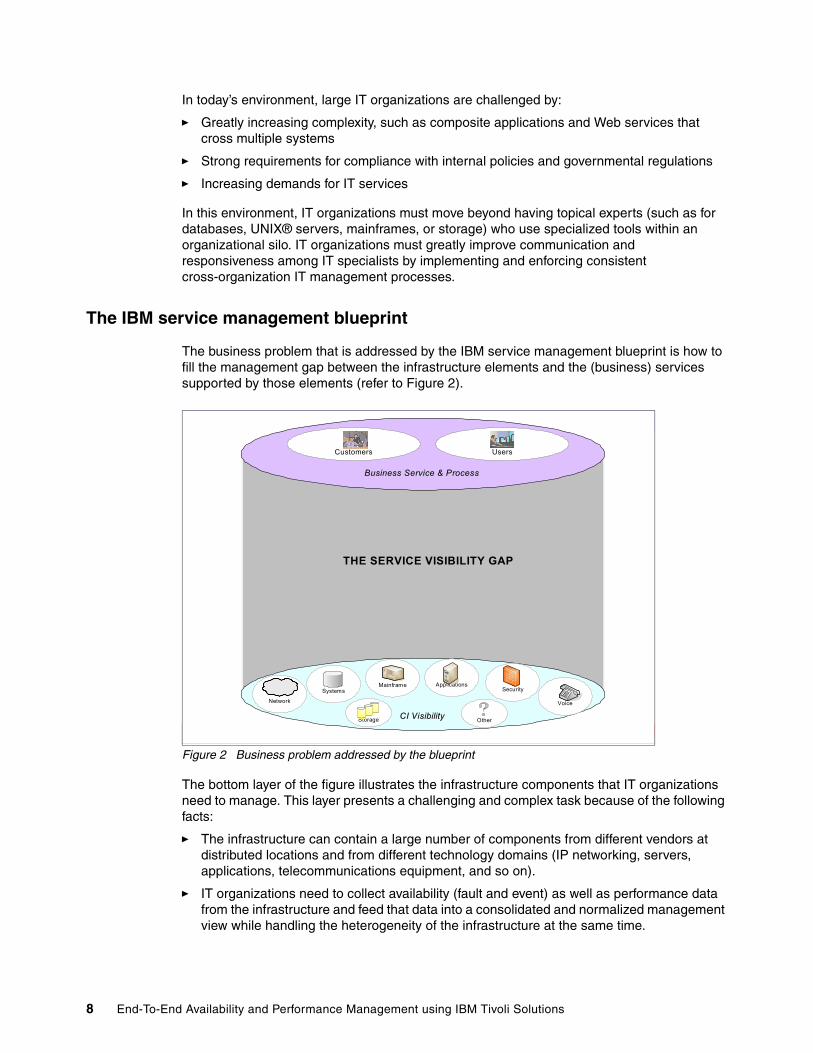
The business problem that is addressed by the IBM service management blueprint is how to fill the management gap between the infrastructure elements and the (business) services supported by those elements (refer to Figure 2).
Figure 2 Business problem addressed by the blueprint
The bottom layer of the figure illustrates the infrastructure components that IT organizations need to manage. This layer presents a challenging and complex task because of the following facts:
� The infrastructure can contain a large number of components from different vendors at distributed locations and from different technology domains (IP networking, servers, applications, telecommunications equipment, and so on).
� IT organizations need to collect availability (fault and event) as well as performance data from the infrastructure and feed that data into a consolidated and normalized management view while handling the heterogeneity of the infrastructure at the same time.
IBM Software Group | Tivoli software
1
THE SERVICE VISIBILITY GAPTHE SERVICE VISIBILITY GAP
Users
Business Service & ProcessBusiness Service & Process
Customers
Network
Systems SecurityApplications
Voice
Mainframe
OtherCI VisibilityCI VisibilityStorage
8 End-To-End Availability and Performance Management using IBM Tivoli Solutions

� Operators need to be able to get an integrated and unified interface showing the management overview information, but they also need to have drill-down tooling when it comes to a detailed analysis of measured data.
The objective is to deliver high quality customer, partner, and employee-facing services and processes to support revenue generation.
The topmost layer on Figure 2 shows the services and processes that are relevant to the business users of the infrastructure. These services and processes are supported by the underlying IT infrastructure. Each service typically consists of several networking and network security devices, servers, applications, databases, and other components, such as integration middleware, and depends on the availability and performance of that complex.
Now, you face the following issues:
� How to connect the two layers � How to map the IT infrastructure to the business services that the IT organization needs to
support at the end
The first challenge is to disconnect the complex infrastructure and the services and processes that you need to deliver, which is called a service visibility gap. In other words, you have no way to currently visualize those services and processes and to assure their availability, performance, and integrity as well as to manage the business performance for those services and processes.
What you need here is a way to bridge this visibility gap. To do so, you need to understand the many dependencies and the health of the individual configuration items that make up a service. Gaining this visibility requires key capabilities from end-to-end: discovery to detect the dependencies as they occur in real time and monitoring to understand the actual health of those infrastructure components. In ITIL terms, these capabilities are called configuration items (CIs).
Furthermore, you need to be able to take this information and to consolidate it into a service management platform that is capable of delivering service intelligence to your potential customers: lines of business, IT operations, and users within or outside of your organization. Achieving service intelligence requires the following key capabilities:
� A means of consolidating event or status information from throughout the many event sources to understand the real-time health of all CIs that can potentially impact service health.
� The ability to consolidate all relevant configuration or dependency information from the many sources into a single trusted data store.
� The ability to merge individual status information with the dependency information to perform automated analysis. This automated analysis allows the management of service quality across the various audiences and provides the targeted information that users need to manage services effectively.
Last but not least, to bridge the service visibility gap, improve operational efficiency, and guarantee service quality, you need to implement and automate the many service delivery, service support, and other operational processes that can impact service performance.
Figure 3 on page 10 illustrates these capabilities.
9

Figure 3 Bridging the service visibility gap
Now, we introduce the IBM service management blueprint. The IBM service management blueprint is based on a service-oriented architecture (SOA) and best practices, including ITIL. Figure 4 illustrates matching the blueprint with the problem that we just described.
Figure 4 IBM service management blueprint, responding to service visibility questions
With this solution, IT organizations can implement ITIL best practices, view their IT environment holistically and manage it as a business, and gain real business results. The blueprint helps IT organizations assess and automate key IT processes, understand
IBM Software Group | Tivoli software
2
Users
Business Service & ProcessBusiness Service & Process
Customers
NetworkSystems SecurityApplications
Voice
Mainframe
OtherCI VisibilityCI VisibilityStorage
Service IntelligenceService Intelligence
Service Model
CCMDBEvent/Status
MonitoringMonitoring DiscoveryDiscovery
AssuranceAssurance QualityQuality
AnalysisAnalysis AutomationAutomation
Process AutomationProcess Automation
Service Cont.Financial
ChangeConfiguration
Release
IncidentProblem
Asset
SLAAvailabilityCapacity
SecurityStorage
Workload
U sers
B us iness S e rv ic e & P rocessB us iness S e rv ic e & P rocess
C u s tom ers
N etw o rkS ys tem s S ec u rityA p p lic a t io ns
V oic e
M a in fr am e
O th e rC I V is ib ilityC I V is ib ilityS tora g e
S erv ice In te llig en ceS e rv ice In te llige n ce
S erv ice M od el
C C M D BE ven t/S tatus
M on itor in gM on itorin g D isc ov eryD isc ove ry
A ss uran ceA s suran c e Q ua lityQ ua lity
A n a ly sisA n a lys is A utom ationA utom a tion
P rocess A utom ationP ro ce ss A uto m ation
S erv ic e C o n t.F in an c ia l
C h an g eC onf ig u ra tion
R ele as e
In c id e n tP ro b lem
A s s e t
S L AA va ilab ilityC ap ac ity
S ec urityS tora g e
W ork lo ad
O p e ra tio n a l M a n a g e m en t
S e r v ic e M an ag em e n t P la tfo rm
P ro c es s M a n a g e m en t
B es t P ra c tic e s
TT h e h e P ro b lemP ro b lem TT h e h e S o lu tio nS o lu tio n
C u s to m e rC u s to m e r C h a lle n g e sC h a lle n g e s IB M S e rv ic e IB M S e rv ic e M a n a g e m e n tM a n a g e m e n t
10 End-To-End Availability and Performance Management using IBM Tivoli Solutions

availability issues, resolve incidents more quickly, implement changes with minimal disruption, satisfy service level agreements, and ensure security.
The IBM service management blueprint is divided into three layers:
� Operational management� Service management platform� Process management
A fourth layer that complements these three layers is the best practices layer.
Starting from the bottom, we now describe briefly what is positioned in each of the layers. Figure 5 illustrates an extended version of the blueprint.
Figure 5 IBM service management blueprint detailed
Operational management productsIBM IT operational management products help IT organizations deliver services efficiently and effectively. You can use this product set to implement the management environment at maturity levels 1 and 2 described in “Maturity levels in the infrastructure management” on page 4. These products cover the management of all of the different IT infrastructure components, such as:
� Networking devices, such as routers and switches or security devices (VPN gateways or firewalls)
� Servers and base operating system platforms, ranging from Intel® through UNIX to mainframe and from Windows® and Linux® to z/OS®
� Applications, including packaged applications as well as application servers with custom-developed applications
� Databases
� Storage area network (SAN) elements and storage devices
Open Process Automation
Library(OPAL)
IBM Global Technology
Services
Ecosystem of System
Integrators and Business Partners
IBM Tivoli Unified Process
(ITUP)
Best Practices
Visualization / Service Models / Federated Data Layer / CCMDB
Server, Network & Device
ManagementStorage
ManagementSecurity
ManagementBusiness
ApplicationManagement
Service Delivery
& SupportService
DeploymentInformation
ManagementBusinessResilience
IT CRM & Business
Management
Service Management Platform
Process Management Products
Operational Management Products
IBM Service Management
11

In terms of functionality, operational management products help you monitor essential system resources proactively, which can range from basic metrics to complex measurements. For example, you can monitor:
� Low-level system resources, such as CPU, memory, or disk utilization on a server
� Application-specific resources, such as outgoing mail queue length on a mail server or database table space allocation
� User response time using simulated transactions from a GUI or Java™ client in a complex environment
Based on what you measure, you can react to important system events and run automatic responses that you predefine for such cases. All the data that you collect from your infrastructure is displayed on a consolidated graphical interface with real-time and historic details about your systems. System administrators can then customize the portal view to display what is of most relevance for them. This method helps you optimize efficiency in your IT department.
IBM operational management products include, but are not limited to:
� Tivoli server, network, and device management products, such as:
– IBM Tivoli Enterprise Console®– IBM Tivoli Monitoring – IBM Tivoli OMEGAMON®– IBM Tivoli Network Manager
� Tivoli business application management products, such as:
– IBM Tivoli Composite Application Manager for SOA Platforms– IBM Tivoli Composite Application Manager for Transactions
� Tivoli storage management products, such as:
– IBM Tivoli Storage Manager for data backup, restore, and archiving– IBM Tivoli TotalStorage® Productivity Center family for storage area network and data
volume management
� Tivoli security management products, such as:
– IBM Tivoli Access Manager family for active runtime access control– IBM Tivoli Identity Manager for administrative access control and user provisioning– IBM Tivoli Compliance Insight Manager and IBM Tivoli Security Operations Manager
for security integrity and event management
� Tivoli business management products, such as:
– IBM Tivoli Business Service Manager– IBM Tivoli Service Level Advisor
Service management platformThe core of the service management platform layer is the Configuration Management Database (CCMDB). The CCMDB standardizes and consolidates information from IBM IT operational management products to help IT organizations align operations with the business context and manage change.
Each of the IBM IT process management products is integrated tightly with CCMDB and provides ITIL-aligned process flows that can help IT organizations integrate and automate their IT processes across organizational silos and manage IT as a business.
The complexity of IT environments makes it difficult for IT organizations to anticipate the impact of a system change. Clients tell IBM that as much as 85% of the system failure
12 End-To-End Availability and Performance Management using IBM Tivoli Solutions

incidents that users report are caused by IT changes. Frequently, these change-induced incidents are due to a lack of understanding in the IT organization about the effect that a particular change might have on other IT resources.
Effective change management can help IT organizations make informed decisions regarding change and prevent the IT organizations from making changes without considering all the dependencies. For change and configuration management processes, the CCMDB includes automated, customizable workflows that are based on ITIL best practices. In addition, it can interface with the operational management products that organizations use today.
A further important component in the middle layer of the blueprint is responsible for visualizing the dependencies between IT infrastructure components and the business services being supported by them.
Visualization can be done by composing service models. These service models consist of nodes represented by actual devices or application infrastructure elements (such as application servers or databases). These nodes are the elements that you can monitor using the products in the Operational Management Products group.
The nodes of the service models are dynamic in terms that they can receive live status information from the underlying monitoring infrastructure. For example, when a central router or switch fails, this event gets fed into the corresponding node of the service model as a status change.
While it is important to know the actual status of the underlying infrastructure nodes, the ultimate goal is to calculate the service status from the node data.
The service models, therefore, contain their embedded logic that describes what dependencies are present and how to propagate the different status changes toward the topmost level that is the business service as a logical entity itself.
When setting up the logical model of the service, you define the propagation rules. So, you can decide and define how your business service depends on the different parts of the infrastructure. For example, you can set up rules that will mark your service as not available if the core LAN switch in the server room fails, while only marking it as status yellow (having problems but still working) in case one of the clustered database server nodes crashes.
Organizations also need support to be able to define service levels and track the availability of services that are provided to their customer against those service levels. That support comes in the form of service level agreement (SLA) management that makes it easier for organizations to collect SLA data from their infrastructure and to produce reports about how the service availability requirements were met.
The products in the Service Management layer include:
� Tivoli Change and Configuration Management Database � Tivoli Service Request Manager� Tivoli Asset Manager
Process management productsOrganizations can use IBM Tivoli Process Management products to use consistent, predictable, and repeatable management processes. These products are predefined workflows that are based on years of experience derived from customer engagements.
Tivoli Process Management products are also highly configurable and dynamic: they integrate with both IBM and non-IBM products and can be customized to the unique environment of your organization.
13
The IBM IT process management products work in tight integration with Tivoli Change and Configuration Management Database (CCCMDB) and integrate and automate service management processes across organizational silos to increase operational efficiency and effectiveness. They are developed to provide process automation support according to ITIL recommendations.
Process management products include the following products that address aspects of ITIL availability, release, and storage management:
� IBM Tivoli Availability Process Manager � IBM Tivoli Release Process Manager � IBM Tivoli Storage Process Manager
IBM also delivers other ITIL-compliant process managers bundled with products, such as:
� Change and configuration management processes, which are shipped with Tivoli Change and Configuration Management Database
� Incident and problem management processes, supported by Tivoli Service Request Manager
Best practicesThe IBM IT service management solution is based on IBM and industry best practices. You can take advantage of the worldwide practical experience of IBM from proven consulting services to maximize your current investments and implement IT service management.
IBM has extensive experience helping clients to implement solutions by applying best practices from ITIL, enhanced Telecomm Operations Map (eTOM), Control Objectives for Information and related Technology (CoBIT), and Capacity Maturity Model Integrated (CMMI) in client environments.
IBM can help you automate at the best pace for your organization. You can choose to start with your most labor-intensive IT tasks, such as backup and recovery, provisioning, deployment, and configuration of resources. You can maximize your current investments by relying on the worldwide practical experience, technical skills, and proven consulting services gained from successful engagements that offered by IBM and our IBM Business Partner community.
IBM Tivoli Unified Process IBM Tivoli Unified Process is a free, read-only knowledgebase that provides detailed documentation of IT Service Management processes based on industry best practices. Tivoli Unified Process provides the ability to improve your organization’s efficiency and effectiveness. It enables you to understand processes, the relationships between processes, and the roles and tools involved in an efficient process implementation.
Each process is defined by:
� An overall introduction describing goals, mission, scope, and key performance indicators (KPIs)
� A workflow
� People (roles)
� Information (work products)
� Products (tools) that help implement aspects of the process
Tivoli Unified Process is available for download at:
http://www.ibm.com/software/tivoli/itservices/
14 End-To-End Availability and Performance Management using IBM Tivoli Solutions
IBM Tivoli Unified Process Composer IBM Tivoli Unified Process Composer provides detailed documentation of IT service management processes based on industry best practices, which can help users to improve the efficiency and effectiveness of their organization.
Tivoli Unified Process Composer is the product version of Tivoli Unified Process, the free process knowledgebase. Tivoli Unified Process Composer contains a content library that can be customized, extended, and then published with the tools that are included in the product.
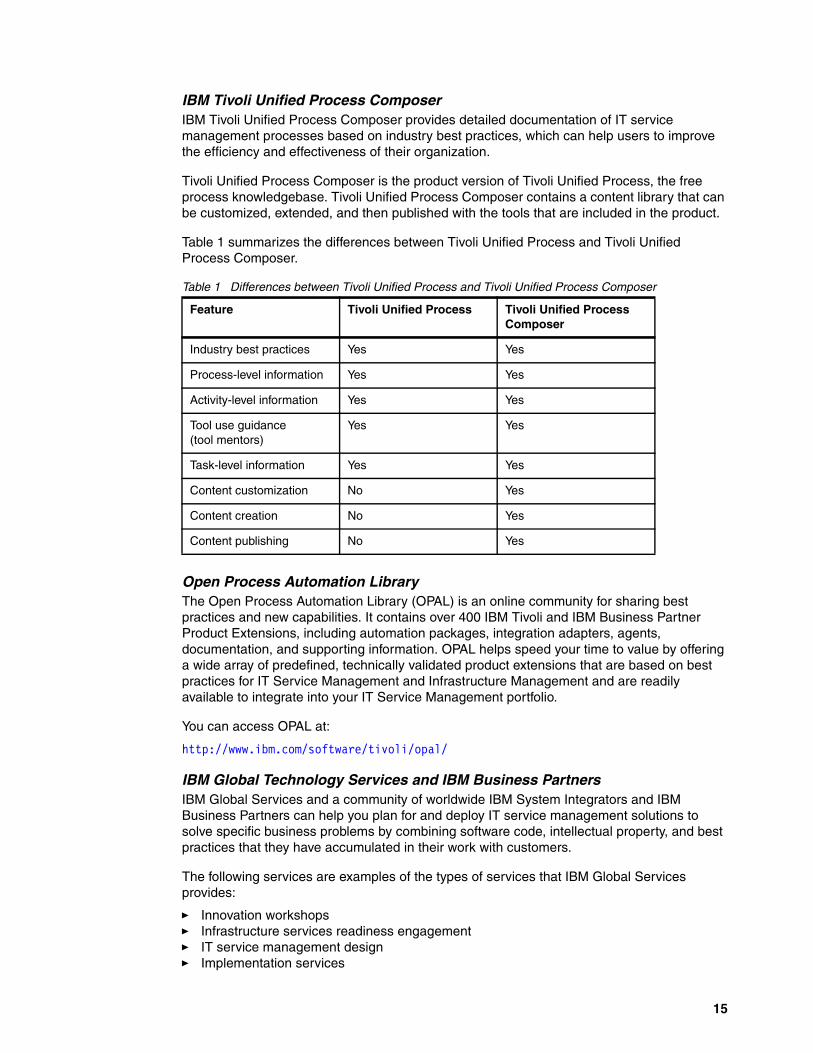
Table 1 summarizes the differences between Tivoli Unified Process and Tivoli Unified Process Composer.
Table 1 Differences between Tivoli Unified Process and Tivoli Unified Process Composer
Open Process Automation LibraryThe Open Process Automation Library (OPAL) is an online community for sharing best practices and new capabilities. It contains over 400 IBM Tivoli and IBM Business Partner Product Extensions, including automation packages, integration adapters, agents, documentation, and supporting information. OPAL helps speed your time to value by offering a wide array of predefined, technically validated product extensions that are based on best practices for IT Service Management and Infrastructure Management and are readily available to integrate into your IT Service Management portfolio.
You can access OPAL at:
http://www.ibm.com/software/tivoli/opal/
IBM Global Technology Services and IBM Business PartnersIBM Global Services and a community of worldwide IBM System Integrators and IBM Business Partners can help you plan for and deploy IT service management solutions to solve specific business problems by combining software code, intellectual property, and best practices that they have accumulated in their work with customers.
The following services are examples of the types of services that IBM Global Services provides:
� Innovation workshops� Infrastructure services readiness engagement� IT service management design� Implementation services
Feature Tivoli Unified Process Tivoli Unified Process Composer
Industry best practices Yes Yes
Process-level information Yes Yes
Activity-level information Yes Yes
Tool use guidance (tool mentors)
Yes Yes
Task-level information Yes Yes
Content customization No Yes
Content creation No Yes
Content publishing No Yes
15

IBM Tivoli availability and performance management portfolio
The service management blueprint from IBM covers different management domains from servers and network management through storage management to security management. It is not our goal in this guide to go into detail about security or storage management any further than is necessary from the availability and performance management perspective. We limit our scope of discussion to those solutions that are relevant from the availability and performance management perspective.
We do not want to provide exhaustive details of each and every product that we discuss. Rather, our intent is to give you the functional highlights of these products. After reading the summaries, you should be able to do a basic positioning of the products. In case you need more information and details, you can refer to the links or publications that we provide at the end of this guide.
The bottom layer of the IBM service management blueprint contains operational management products. In this chapter, we follow a more detailed structure as shown in Figure 6. This breakdown helps you to group the members of the Tivoli availability solution family logically.
Figure 6 Breakdown of operational management products
In the next sections, we follow the structure that is defined by Figure 6, starting from the bottom layer, to describe Tivoli solution components. In addition, we also discuss separately mainframe management and process management products.
Resource monitoring
In this section, we discuss the Tivoli product portfolio for resource monitoring. Resource monitoring focuses on monitoring servers, storage area network (SAN) monitoring, and network monitoring. The network monitoring includes testing Internet services. Figure 7 illustrates for the scope of resource monitoring.
O p e ra tio n a l M a n a g e m e n tP ro d u c ts
P ro c e s s M a n a g e rs
S e rv ic e M a n a g e m e n t P la tfo rm
P ro c e s s M a n a g e m e n t P ro d u c ts
Business s ervicem anagement
Resource m onitoring
Composite a pplicationm anagement
Event c orrelation and a utomation
16 End-To-End Availability and Performance Management using IBM Tivoli Solutions

Figure 7 The scope of resource monitoring
Servers monitoring targets the servers, and the focus is on availability and performance monitoring for system-level resources. For example, we might monitor system errors for software and hardware, CPU utilization, memory utilization, I/O performance, and so on. We discuss the following products for this topic:
� “IBM Tivoli Monitoring” on page 18� “IBM Tivoli Performance Analyzer” on page 19
SAN monitoring targets the SAN-attached storage systems and storage area network fabric, such as a SAN switch, and SAN connection. SAN monitoring is important for SAN management just as network monitoring is important for network management. The focus is on the health of the SAN fabric and on the availability and performance monitoring for storage systems. For example, we might monitor the status of the connection link within SAN, the I/O performance of storage systems, the status of data replication service, file systems and disk utilization, and so on. We discuss the following products for this topic in “IBM TotalStorage Productivity Center” on page 19.
The target of network monitoring is the network, and the focus is availability and performance monitoring for the local network, WAN connection, network devices, and Internet services. For example, we might monitor the status of network connection, network device errors, network traffic, the response time of Internet services, and so on. We discuss the following products for this topic in:
� “IBM Tivoli Network Manager” on page 19� “IBM Tivoli Netcool/Proviso” on page 20� “IBM Tivoli Netcool Performance Manager for Wireless” on page 20
It is important to note the distinction between fault management and trend management in a performance and availability solution. Fault management focuses on managing the infrastructure from an availability perspective. It, therefore, primarily collects events, status and failure information, or traps from the servers, networking, and other equipment.
In contrast, performance management is responsible for gathering counters and other periodic metrics (traffic volumes, usage, or error rates) that can characterize the behavior of the network from a performance point of view.
Internet Network Servers SANServices Monitoring Monitoring Monitoring
SAN switch
Internet
WAN
Storage server
Tape library
17

Figure 8 illustrates the difference between fault management and performance management and how the two areas can complement each other.
Figure 8 Two scenarios receiving the same traps but differing in importance
In both scenarios, traps are received to indicate threshold violations. In a fault management system, both these scenarios are reported in the same manner (two threshold violations over the same period of time, as depicted by the red Alarm indicators in Figure 8). However, the underlying situations are quite different. In Scenario I, the situation can be described as infrequent spikes, while Scenario II indicates a frequently near-threshold situation.
A performance management system can distinguish these two scenarios clearly and can also alert you to the second type of chronic situation. So, you can be more proactive and prevent issues, rather than just reacting to alarms after the fact. These capabilities exist in the IBM Tivoli Netcool/Proviso and IBM Tivoli Netcool Performance Manager for Wireless products.
IBM Tivoli MonitoringIBM Tivoli Monitoring is for system hardware and software resource monitoring and management. It provides a management framework to monitor and manage critical operation system resources across disparate platforms from a single console. The monitoring server platform includes AIX®, Solaris™, Hewlett-Packard UNIX (HP-UX), Windows, z/OS, Linux (Red Hat, SUSE® for Intel, System z®, and IBM System p®), and IBM i5/OS®.
Tivoli Monitoring is the basic architecture that can be extended for monitoring operating systems, databases, and applications in distributed environments:
� IBM Tivoli Monitoring for Virtual Servers� IBM Tivoli Monitoring for Databases� IBM Tivoli Monitoring for Applications� IBM Tivoli Monitoring for Cluster Managers� IBM Tivoli Monitoring for Messaging and Collaboration� IBM Tivoli Monitoring for Microsoft® .NET� IBM Tivoli OMEGAMON XE for Messaging
Alarm Alarm
Alarm Alarm
Scenario II.
Scenario I.
18 End-To-End Availability and Performance Management using IBM Tivoli Solutions

� IBM Tivoli Composite Application Manager for Web Resources� IBM Tivoli Composite Application Manager for SOA Platforms� IBM Tivoli Composite Application Manager for Transactions� IBM Tivoli Composite Application Manager for Response Time� IBM Tivoli Composite Application Manager for Internet Service Monitoring� IBM Tivoli Composite Application Manager for WebSphere®� IBM Tivoli Composite Application Manager for Java 2 Platform, Enterprise Edition
(J2EE™)
IBM Tivoli Performance AnalyzerIBM Tivoli Performance Analyzer is a software component that complements Tivoli Monitoring. It helps system administrators to identify problem trends, resolve existing incidents faster, and predict future problems to avoid them.
It plugs into IBM Tivoli Monitoring and Tivoli Enterprise Portal and has built-in domain knowledge of distributed systems, so users can immediately be more effective without having to turn to other specialists for capacity modeling tools. It takes advantage of long-term historical and real-time data in Tivoli Data Warehouse.
IBM TotalStorage Productivity CenterThis product has several components:
� IBM TotalStorage Productivity Center for Fabric is a component of the IBM TotalStorage Productivity Center. It is used to simplify the administration for the storage area network (SAN) fabric with performance and availability monitoring.
� IBM TotalStorage Productivity Center for Disk is a component of the IBM TotalStorage Productivity Center. It is used to consolidate and centralize administration of your SAN storage systems.
� IBM TotalStorage Productivity Center for Data is a component of the IBM TotalStorage Productivity Center. It is used to manage the capacity utilization of your file systems and databases.
� IBM TotalStorage Productivity Center for Replication is a component of the IBM TotalStorage Productivity Center offering. This component can help to configure and manage advanced copy services for multiple IBM enterprise storage servers and IBM DS4000® storage servers.
IBM Tivoli Network ManagerIBM Tivoli Network Manager is for network management. It can discover network topology and monitor networks for availability and performance. It provides root cause analysis whenever you have network events for errors:
� Tivoli Network Manager Entry Edition has an embedded event management (IBM Tivoli Netcool/OMNIbus technology), a Web console, and a database. It is suitable for networks that have fewer than 1000 devices.
� Tivoli Network Manager IP Edition (formerly Netcool/Precision IP) can choose the back-end database and can be integrated to OMNIbus and Webtop. It is also customizable and can configure the network topology model. It is suitable for large enterprises with over 1000 network devices.
� Tivoli Network Management Transmission Edition (formerly Netcool/Precision TN) is for service providers. It adds monitoring functions for layer 1 transmission networks.
19

IBM Tivoli Netcool/ProvisoIBM Tivoli Netcool/Proviso® provides a complete view of service quality and usage for both operations and customers, enabling them to proactively avoid, detect, and rapidly resolve problems. Informative help operations and engineering improve service quality and reduce operating costs. The consolidated, service-centric reports that Tivoli Netcool/Proviso provides of network resource, server, and application performance show the business and service impact of problems, while making it easy to drill down to individual resources and service paths for troubleshooting. On-demand detailed trend reports, second-by-second real-time monitoring, and proactive forecast reports provide the context needed to make informed decisions quickly.
IBM Tivoli Netcool Performance Manager for WirelessIBM Tivoli Netcool® Performance Manager for Wireless (formerly Vallent’s NetworkAssure) gives you a complete, real-time view of critical performance metrics to help you deliver better overall quality of service to your subscribers while you manage your network infrastructure proactively. It offers a comprehensive and flexible performance management feature set and a large library of readily available network interfaces for Telco environments.
Composite application management
In this section, we discuss the Tivoli product portfolio for application monitoring. Application monitoring provides a transactional view of the availability and performance of the applications infrastructure. The applications infrastructure can refer to middleware, applications, or composite applications.
A typical e-business distributed application has components spread throughout several clustered application servers that are interconnected using various mechanisms. These distributed interconnected applications are referred collectively as composite applications. A composite application requires transactions to traverse multiple host or server platforms to complete its function.
For a composite application environment management approach, the following five-step method works well. In addition by using suitable tools, you can make this overall method faster, more effective, and efficient:
� Sense: Know the problem as early as possible to reduce the impact time to services and users.
� Isolate: Determine the problem and the root cause in the composite application environment.
� Diagnose: Determine the cause of problem.
� Take action: Fix the problem.
� Evaluate: Monitor the correction results.
20 End-To-End Availability and Performance Management using IBM Tivoli Solutions

To have an effective and efficient way to monitor application infrastructure, you can have four aspects for application monitoring and management as shown in Figure 9.
Figure 9 Aspects for application management
In this section, we discuss the following aspects of monitoring:
� Monitor and adjust resources for applications by using resource monitoring, analysis, and management. We discuss this approach in “Resource monitoring” on page 16.
� Trace transactions and diagnose problems for applications that focus on detailed transaction tracing for application problems. We discuss this approach with the following products:
– “IBM Tivoli Composite Application Manager for WebSphere” on page 21– “IBM Tivoli Composite Application Manager for J2EE” on page 22– “IBM Tivoli Composite Application Manager for Web Resources” on page 22
� Mediate services and enforce policies for applications, typically for Web services monitoring and mediation. We discuss this approach in “IBM Tivoli Composite Application Manager for SOA” on page 22.
� Monitor response time and availability for monitoring and service-level attainment. We discuss this approach with the following products:
– “IBM Tivoli Composite Application Manager for Transaction Tracking” on page 22– “IBM Tivoli Composite Application Manager for Response Time” on page 22
IBM Tivoli Composite Application Manager for WebSphereIBM Tivoli Composite Application Manager for WebSphere (ITCAM for WebSphere) is used for monitoring and analyzing the health of WebSphere Application Server and transactions that are running in it. It can trace transaction execution up to detailed method-level information and connects transactions that spawn from one application server and invoke services from other application servers, including mainframe applications in IMS or CICS®.
Applications
Resource Monitoring
Services & Transactions
Monitor response time and
availability
Tracetransactions and diagnose
problems
Mediateservices and
enforce policies
Monitor and adjust resources
ITCAM for ISM
ITCAM for RTT
ITCAM for RT
ITCAM for SOA ITCAM for WebSphere
ITCAM for J2EE
ITCAM for Web Resources
Tivoli Monitoring
Omegamon XE for Messaging
21

IBM Tivoli Composite Application Manager for J2EEIBM Tivoli Composite Application Manager for J2EE (ITCAM for J2EE) is a solution for monitoring and analyzing applications on a non-WebSphere Application Server-based J2EE environment and the transactions that are invoked in it.
IBM Tivoli Composite Application Manager for Web ResourcesIBM Tivoli Composite Application Manager for Web Resources (ITCAM for Web Resources) is a solution to monitor and manage the health and availability of applications running on commonly available application servers and Web servers. The application server platforms include IBM WebSphere, WebLogic, SAP®, Oracle®, JBoss, Tomcat, J2SE™, and IBM WebSphere Application Server Community Edition. The Web servers supported are Microsoft IIS, SUN, and Apache Web servers.
IBM Tivoli Composite Application Manager for SOAIBM Tivoli Composite Application Manager for SOA (ITCAM for SOA) is a monitoring and management solution for SOA applications based on Web services and the Enterprise Service Bus. It monitors and controls message traffic between services in the service-oriented architecture (SOA) environment.
IBM Tivoli Composite Application Manager for Transaction TrackingIBM Tivoli Composite Application Manager for Transaction Tracking allows monitoring and analysis of application transaction response time. It provides statistics about the response times for application transactions. ITCAM for Transaction Tracking enables you to analyze and break down response time into individual components to quickly pinpoint a response time problem.
IBM Tivoli Composite Application Manager for Response TimeIBM Tivoli Composite Application Manager for Response Time V6.2 (ITCAM for Response Time) is an application monitoring tool that is designed to comprehensively monitor, alert, and report on the availability and response time of your business applications. It helps to monitor real response times of Web-based and Microsoft Windows applications.
Event correlation and automation
This section focuses on the event correlation layer within the operational management product breakdown that is shown in Figure 6 on page 16.
The products that are part of this layer are responsible for collecting and processing management information (for example, events or alarms) from all over the managed infrastructure. These products collect and consolidate information from a wide variety of infrastructure elements in real time and can include servers, mainframes, Windows or Linux systems, UNIX systems, packaged or custom applications, IP routers and switches, generic Simple Network Management Protocol (SNMP) devices, as well as network and system management applications and frameworks, among many others. By working in conjunction with different existing management systems and applications, event correlation and automation components can present consolidated information in a meaningful and intuitive format.
Using these products, you can take advantage of predefined automated actions to address problems before they cause disruptions in service. You can, thereby, support the continuity of business operations with architectures that are responsive and highly available.
22 End-To-End Availability and Performance Management using IBM Tivoli Solutions

In this section, we discuss the following products:
� “IBM Tivoli Netcool/OMNIbus”� “IBM Tivoli Netcool/Impact”� “IBM Tivoli Netcool/Webtop and IBM Tivoli Netcool/Portal” � “IBM Tivoli Netcool/Reporter”
IBM Tivoli Netcool/OMNIbusIBM Tivoli Netcool/OMNIbus provides high-capacity real-time event consolidation for different infrastructure domains. It delivers real-time, centralized monitoring of complex networks. It takes advantage of Netcool probes and Netcool monitors to interface with event sources, such as networking devices, element managers, servers, or applications. Tivoli Netcool/OMNIbus is optimized to handle large volumes of faults.
IBM Tivoli Netcool/ImpactIBM Tivoli Netcool/Impact correlates and prioritizes infrastructure management event responses automatically according to their business impact using its advanced policy engine. Rather than having to go to disparate sources, Impact users can see the relevant event management issues associated with various kinds of events in a single view.
IBM Tivoli Netcool/Webtop and IBM Tivoli Netcool/PortalIBM Tivoli Netcool/Webtop provides access to fault management and service assurance capabilities from Netcool using a Web browser interface. Users can access the real-time status of systems and services through a standard Web browser. Webtop provides the information through graphical maps, tables, and event lists. These graphical maps, tables, and event lists are delivered using HTML and Java. The Tivoli Netcool/Webtop application retrieves and displays real-time event data from the Netcool/ObjectServer.
IBM Tivoli Netcool/ReporterIBM Tivoli Netcool/Reporter complements the Tivoli Netcool/OMNIbus application by capturing, analyzing, and presenting event data generated over various time frames. Tivoli Netcool/Reporter supplements the real-time information provided by Tivoli Netcool/Webtop with historical and trend information by capturing, analyzing, and presenting data that is generated over time into meaningful reports.
Business service management
Business service management is the link between operational and business-focused IT infrastructure management. It contains solutions that visualize your business services and that let you measure service performance in terms of service level achievements.
We discuss the following products in this section:
� “IBM Tivoli Business Service Manager”� “IBM Tivoli Service Level Advisor” on page 24� “IBM Tivoli Netcool Service Quality Manager” on page 24
IBM Tivoli Business Service ManagerIBM Tivoli Business Service Manager (formerly Micromuse® Realtime Active Dashboard) helps business and operations staff understand the complex relationships between business services and the supporting technology components.
23

IBM Tivoli Service Level AdvisorIBM Tivoli Service Level Advisor (primarily targeted for non-Telco clients) is designed to provide predictive service-level management capabilities and to enable IT operations staff to proactively predict when service level agreement (SLA) violations are likely to occur and then take corrective actions to avoid an SLA breach.
IBM Tivoli Netcool Service Quality ManagerTivoli Netcool Service Quality Manager (formerly Vallent’s ServiceAssure™) helps you see your service through the customer’s experience. Whereas Tivoli Service Level Advisor is primarily positioned as an enterprise solution, Tivoli Netcool Service Quality Manager has a strong focus on Telco environments. It combines service quality management (SQM) and service level management (SLM) to manage and improve telecommunications service quality. SQM is responsible for analyzing the network and operations and for processing quality data and mapping it to delivered services.
Process management solutions
IT service management helps organizations improve service quality by using deterministic internal processes. It also helps organizations to address many regulatory compliance requirements.
There are two major challenges that organizations can face when trying to perform process automation:
� How do we actually implement our processes?
When organizations begin to work with their processes, they usually look at existing industry frameworks, such as ITIL, to get guidance. Although ITIL is good at describing what must be done, it does not provide detailed explanations about how to actually do it, which often results in uncertainty in terms of actual implementation questions.
� We have documented our processes and we are ready to implement those processes, but how do we link them with the actual management tooling already implemented?
From the perspective of ITIL-compliant IT operations, it is essential to implement and maintain a consistent and central federated database, the CCMDB (Change and Configuration Database). Service support and service delivery processes must take advantage of CCMDB, meaning that these processes need to work in tight integration with CCMDB and what is stored in it. This information includes the configuration properties of all of your equipment and devices, servers, and applications, as represented by the configuration items (CIs), as well as their relationships, which are also described by CCMDB.
IT operations processes, however, are not only bound to CCMDB. We advise that you set up the IT operations processes so that they can interface with operation management tooling that your IT staff can use day by day. The interface can help you automate many of those tasks that are described by the ITIL processes and otherwise need to be performed manually.
Overview of IBM Process ManagersAs a response to the questions described in “Process management solutions”, IBM has introduced a collection of IT process automation tools, called IBM Tivoli Process Managers.
Thus far, we have shown a portion of the operational management product portfolio from IBM, the bottom layer of the IBM service management blueprint. We described their functionalities as well as how these products can help you make your daily IT operations more effective. Now, we continue with the mid-layer and top-layer of the blueprint and
24 End-To-End Availability and Performance Management using IBM Tivoli Solutions

describe Process Managers. Figure 10 illustrates the general structure of IBM process managers.
Figure 10 General structure of IBM process managers
IBM Tivoli Process Managers are Web applications that provide automated process workflows that are customizable and are even reusable as saved templates. For example, you can implement simple flows for desktop changes and more complex flows for changes to critical applications or servers within your organization. Through the use of integration modules, you can utilize the operational management products (OMPs) to support and to automate tasks within the process managers. The integration modules provide two-way communication between the process and the OMP, which means that invoking the OMP from within a process step and receiving the return status from it can be automated.
In terms of product packaging, IBM Tivoli Process Managers are available either as standalone or packaged (bundled) offerings. Table 2 gives an overview of the mapping between the processes and the corresponding IBM products.
Table 2 Mapping between operational processes and IBM Tivoli solutions
Process IBM product name
Change management Tivoli Change and Configuration Management Database
Configuration management Tivoli Change and Configuration Management Database
Incident management Tivoli Service Request Manager
Problem management Tivoli Service Request Manager
Release management Tivoli Release Process Manager
Storage management Tivoli Storage Process Manager
Availability management Tivoli Availability Process Manager
Capacity management Tivoli Capacity Process Manager
ProcessProcessManagerManager
Monitoring & reporting
User interface
Tool integrationmodules
Executable process flows
Process-enabled analytics
Operational Management Products
Service Management Platform
Process Management Products
IBM Service Management
Best Practices
25

Sample scenarios
The sample scenarios discussed here are:
� “UNIX server monitoring”, which is a typical small to medium-sized enterprise with a back-end server that processes back office transactions. There is no major network connectivity, because most of the processing (and the users) is performed on a single site.
� “Web-based application monitoring” on page 28 explores the management of an e-business-based client. Its emphasis is on managing Web-based transactions and availability.
� “Network and SAN monitoring” on page 32 shows the network management on enterprises that exploit a Storage Area Network (SAN) solution. In this case, the networking status is instrumental for providing availability and performance for the storage solution. This scenario might be a content provider, an archival system, or a Web hosting company.
� “Complex retail environment” on page 34 explores a more complex enterprise, which might be more suited to a medium-to-large size enterprise. A diverse set of devices and networking infrastructure exists. The example demonstrates a multi-site operation for a retail business.
UNIX server monitoring
This scenario is a simple multiple UNIX server environment. We assume that it has a small number of UNIX servers. The UNIX server can be a specialized application server or a specialized server, such as a database server or an application server.
Figure 11 shows a sample architecture with a UNIX server environment running SAP applications with the database server. Both servers are running AIX 5L™ V5.3. To make it simple, we do not show the high availability backup servers in Figure 11. However, in an actual environment, these two servers are designed to back up each other, or there might be separate backup servers.
Figure 11 Scenario one for UNIX server environment
Tivoli Monitoring Server
TEMS
TEPS
TDW
Monitoring server
AIX 5.3
SAPapplication
SAP server
AIX 5.3
DB2 database
Database server
User OS monitor
OS monitor
SAP monitor
DB2 monitor
26 End-To-End Availability and Performance Management using IBM Tivoli Solutions

In this environment, the architecture is simple, and the key requirements for monitoring are resource monitoring and application monitoring for availability and performance.
The monitoring requirements for this scenario include:
� Server resources monitoring:
– System errors for both hardware and software. The information can come from various system error logs. When the error is a fatal error, the system administrator needs to receive a real-time alert notice.
– System resource utilization, such as CPU, memory, and file system disk space utilization. When any key resource utilization is above the predefined threshold value, the system administrator needs to receive a real-time alert notice.
– The weekly utilization trend reports for key system resources, such as CPU, memory, and file system disk space.
– Disk I/O performance.
– The weekly utilization trend reports for disk I/O performance.
– The running status of key processes.
– The running status and the takeover status of the backup servers if they are implementing a high availability backup solution for servers.
� Database monitoring:
– Database server running status– Database errors in database logs– Database various buffer pool utilization– Database table space utilization– Lock and deadlock information– Log space utilization
� SAP application monitoring:
– The running status of the mySAP™.com® application – The interconnectivity of the mySAP.com application– System log errors
To address those monitoring requirements, we need tools to help us monitor availability and performance efficiently. We choose the following Tivoli monitoring products:
� IBM Tivoli Monitoring� IBM Tivoli Monitoring for Databases� IBM Tivoli Monitoring for Applications
In Figure 11, we show that we have three kinds of monitoring agents in this environment and that we have a Tivoli monitoring server for centralized monitoring and management.
The agents monitor and collect the performance data and error events from their monitoring areas:
� The operating system monitor intercepts system error logs for hardware and software errors. It also collects the performance data of the key system resources. The information is then sent to Tivoli Monitoring Server for analysis and automation.
� The database monitor intercepts database system errors and collects the database performance data.
� The SAP monitor works with the SAP application to collect errors and performance data.
27

The Tivoli Monitoring server provides a centralized monitoring and management solution. Because the environment is simple, we install all the key components there, such as the Tivoli Enterprise Monitoring Server, Tivoli Enterprise Portal Server, and Tivoli Data Warehouse:
� Tivoli Enterprise Monitoring Server acts as a collection and control point for alerts received from the agents and collects the agents’ performance and availability data.
The Tivoli Enterprise Monitoring Server stores, initiates, and tracks all situations and policies, and it is the central repository for storing all active conditions and short-term data on every Tivoli Enterprise Management Agent.
� Tivoli Enterprise Portal Server is the portal server for user presentation. It serves all Tivoli Enterprise Portal users to bring all of the managing components’ views together in a single window so that you can see when any component is not working as expected. This central point of management allows you to proactively monitor and to help optimize the availability and performance of the entire IT infrastructure. You can collect and analyze specific information easily using the Tivoli Enterprise Portal.
� Tivoli Data Warehouse is the repository and central data store for all historical management data. Tivoli Data Warehouse is the basis for the Tivoli reporting solutions.
Together with the agents and the servers, we can have a monitoring solution for the first scenario of the UNIX servers environment. This solution has the following benefits:
� We can utilize real-time monitoring for system hardware and software errors and real-time alerting to system administrators so they can take action to fix errors, therefore, reducing problem identification time. Sometimes, the monitoring mechanism can help you to discover and fix minor errors before they become a real problem. This solution increases overall system availability.
� The monitoring solution can perform error correlation and help you to discover the root cause of problems, therefore, reducing the time to diagnose and isolate the problem.
� We can access system key resource utilization trend information. Then, we can plan the required system capacity in advance to meet the business growth requirements.
� We can increase system management productivity through the automated monitoring and the centralized monitoring and management solution.
Web-based application monitoring
The second scenario environment is a Web-based application environment, which is a popular application architecture today. It provides a Web server as the first tier, the J2EE application servers as the second tier, and the database servers as the third tier.
Figure 12 shows two HTTP servers that run in Linux servers in the front end, a WebSphere Application Server that runs in AIX servers, and the database servers run in AIX servers in the back-end system. It is a three-tier, Web-based application architecture. There are two layers of four switches in front of the HTTP servers. These switches serve as the server load balancing and high availability mechanism to dispatch HTTP requests from clients to the two HTTP servers. There are additional AIX servers running WebSphere MQ. The WebSphere MQ servers serve as a message hub for the application to exchange messages and data with other applications in this environment.
Every server in this environment has a high availability backup server in place. For HTTP and WebSphere application servers, these backup servers are an active-active operation. For the remainder of the servers, the backup servers are an active-standby operation.
28 End-To-End Availability and Performance Management using IBM Tivoli Solutions

Figure 12 Scenario two for Web-based application environment
In this environment, application transactions need to traverse multiple servers for processing. This environment is a standard composite application architecture. In addition to monitoring servers and middleware resources, the key monitoring requirements will also need to include composite application monitoring for availability and performance.
The monitoring requirements for this scenario include:
� Services resource monitoring:
– System errors for both hardware and software. The information can come from various system error logs. When the error is a fatal error, the system administrator needs to receive a real-time alert notice.
– System resource utilization, such as CPU, memory, and file system disk space utilization. When any key resource utilization is above the predefined threshold value, the system administrator needs to receive a real-time alert notice.
– The weekly utilization trend reports for key system resources, such as CPU, memory, and file system disk space.
– Disk I/O performance.
– The weekly utilization trend reports for disk I/O performance.
– The running status of key processes.
– The running status and takeover status of the backup servers if a high availability backup solution for the servers has been implemented.
� Database monitoring:
– The running status of the database server– Database errors in database logs– Database various buffer pool utilization– Database table space utilization– Lock and deadlock information– Log space utilization
AIX 5.3
WebSphere MQ
Message hub
AIX 5.3
WebSphere Application
Server
J2EE server
AIX 5.3
DB2 database
Database
Linux
IBM HTTP Server
Web server
AIX 5.3
WebSphere MQ
Message hub
AIX 5.3
WebSphere Application
Server
J2EE server
AIX 5.3
DB2 database
Database
Linux
IBM HTTP Server
Web server
HACMP
Clu
ster
Load
ba
lanc
ing
HA
DR
User
29

� MQ message hub monitoring:
– Visibility of all Queue Managers and their running status– Queue/channel operation performance and statistics– Errors in the system log
� Composite application monitoring:
– Transaction availability and response time monitoring– HTTP server and WebSphere Application Server monitoring– Transaction tracing for the application server
To address these monitoring requirements, we choose the following Tivoli Monitoring and Tivoli Composite Application Manager products:
� IBM Tivoli Monitoring� IBM Tivoli Monitoring for Database� IBM Omegamon XE for Messaging� IBM Tivoli Composite Application Manager for WebSphere� IBM Tivoli Composite Application Manager for Response Time
Figure 13 shows the management environment. The diagram illustrates the management agents for each of the products and the two management servers, Tivoli Monitoring Server and Tivoli Composite Application Manager for WebSphere Managing Server, for centralized monitoring and management.
Figure 13 Scenario two monitoring solution architecture
AIX 5.3
WebSphere MQ
Message hub
AIX 5.3
WebSphere Application
Server
J2EE server
AIX 5.3
DB2 database
Database
Linux
IBM HTTP Server
Web server
AIX 5.3
WebSphere MQ
Message hub
AIX 5.3
WebSphere Application
Server
J2EE server
AIX 5.3
DB2 database
Database
Linux
IBM HTTP Server
Web server
HACMP
Clu
ster
Load
ba
lanc
e
HA
DR
User
TEMSTEPSTDW
Monitoring server
ITCAM for WebSphere
Managing server
OS
OS OS
OS
OS OS
OS
OS
DC DB
DB
MQ MQ
WS
WS
DC
30 End-To-End Availability and Performance Management using IBM Tivoli Solutions

The agents help to monitor and collect the performance data and the error events from their monitoring territory:
� The Operating System monitor intercepts system hardware and software errors and collects key system resource performance data. The information is then sent to Tivoli Monitoring Server for analysis and automation.
� Database Monitor collects database performance data. The information is also sent to Tivoli Monitoring Server for analysis and automation.
� Tivoli Composite Application Manager for WebSphere data collector provides composite transaction tracing and monitoring for the WebSphere application server. The data collector uses probes in the application servers and collects the performance information. The monitoring data is then sent to the Tivoli Composite Application Manager for WebSphere managing server and the Tivoli Enterprise Monitoring Server for centralized monitoring and management.
� MQ monitoring agent collects queue manager, queue, and channel operation availability and performance information. The data then is sent to Tivoli Monitoring Server for analysis and automation.
� Tivoli Composite Application Manager for Response Time agents monitor user response time. It consolidates response time information using the End-user Response Time Dashboard. There are three kinds of response time collection agents:
– Client Response Time Agent analyzes a combination of Windows messages and TCP/IP network traffic to compute the user response time for transactions that are created by the monitored applications.
– Web Response Time Agent collects user response time for HTTP and HTTPS Web transactions.
– Robotic Response Time Agent collects response time and availability information from the supported robotic runtime environment. The robotic runtime environments currently supported are Rational® Performance Tester, Rational Robot, Command Line Interface (CLI), and Mercury LoadRunner.
The Tivoli Monitoring Server helps to centralize monitoring and management. The key components for the Tivoli Monitoring Server are Tivoli Enterprise Monitoring Server, Tivoli Enterprise Portal Server, and Tivoli Data Warehouse:
� Tivoli Enterprise Monitoring Server acts as a collection and control point for alerts received from agents, and it collects their performance and availability data.
The Tivoli Enterprise Monitoring Server stores, initiates, and tracks all situations and policies, and it is the central repository for storing all active conditions and short-term data on every Tivoli Enterprise Management Agent.
� Tivoli Enterprise Portal Server is the portal for the users’ presentation. Tivoli Enterprise Portal Server brings all of the managing components’ views together in a single window so that you can see when any component is not working as expected. This central point of management allows you to proactively monitor and help optimize the availability and performance of the entire IT infrastructure. You can easily collect and analyze specific information using the Tivoli Enterprise Portal.
� Tivoli Data Warehouse is the repository and central data store for all historical management data. Tivoli Data Warehouse is the basis for the Tivoli reporting solutions.
The Tivoli Composite Application Manager for WebSphere Managing Server helps to manage the WebSphere composite application. The server will receive monitoring data from data collector and have a real-time display on the console for system administrators for monitoring, analysis, and management. The real-time display can show the topology view of transactions, and it helps to isolate problems quickly. The visualization engine reads the database to
31

present data through the Web console, and snapshot information, such as lock analysis and in-flight transactions, is retrieved directly from the data collectors.
Although this topic is not listed in the requirements, this environment can benefit from having central event processing for analysis and automation for events from various components. Although this processing can be performed in Tivoli Enterprise Monitoring Server, because all agents utilize Tivoli Monitoring, it might be beneficial to introduce Tivoli Netcool/OMNIbus for the event processing, especially if additional network management is introduced in the system and application monitoring must relate to the network monitoring events.
Together with the agents and the servers, we can implement a monitoring solution for scenario two, the Web-based application environment, that has the following benefits:
� We can utilize tracing and management capabilities for composite applications in the WebSphere J2EE environment, which help with root cause analysis and help reduce the amount of time that it takes to solve problems.
� We can manage the service level by using the response time monitoring solution and take early actions before the problems impact users.
� We can utilize real-time monitoring for system hardware and software errors and real-time alerting to system administrators to take action to fix errors, therefore, reducing problem identification time. Sometimes, the monitoring mechanism can help to discover and fix minor errors before they become a real problem, which increases overall system availability.
� The monitoring solution can perform error correlation and help you to discover the root cause of problems, reducing the problem diagnosis and isolation time.
� We can obtain system key resource utilization trend information. Then, we can plan the required system capacity in advance to meet the business growth requirements.
� We can increase system management productivity through the automated monitoring and the centralized monitoring and management solution.
Network and SAN monitoring
The third scenario involves the network and storage area network (SAN) environment. In today’s IT infrastructure, networking is pervasive and getting more complex for all IT environments. SAN is getting more popular in new storage implementations due to its high performance and flexibility for storage management. The network and SAN are extremely important for business IT operations. And, of course, we need a monitoring solution for the network and SAN.
Figure 14 shows servers that connect to the network for networking connectivity and that connect to the SAN for storage system access. From the operational view, the network is the mechanism from which users can access the application, and SAN provides the data storage and access facility. The network and the SAN are key resources in an IT environment.
32 End-To-End Availability and Performance Management using IBM Tivoli Solutions

Figure 14 Scenario three network and SAN environment
The monitoring requirements for this scenario include:
� Network monitoring:
– Topology view for network nodes and connections– The operational health and performance status for LAN and WAN lines– Network node up and down events– Network traffic statistics and performance information
� SAN monitoring:
– Topology view for the SAN– The connection status and the performance for the SAN– Storage system running status– Storage system I/O performance– Storage system disk logical unit number (LUN) allocation and utilization– SAN zoning information– Error events in the SAN fabric
To address these requirements, we need tools to provide effective and efficient monitoring for availability and performance. We choose the following Tivoli Network Manager and TotalStorage Productivity Center products to help with the monitoring for the scenario three network and SAN environment:
� IBM Tivoli Network Manager IP Edition� IBM TotalStorage Productivity Center for Fabric� IBM TotalStorage Productivity Center for Disk� IBM TotalStorage Productivity Center for Data
As we show in Figure 14, there are two monitoring servers for the network and the SAN monitoring and management solution.
SAN switch
Internet
WAN
Storage server
Tape library
Network Manager Server
Topology
RCA
Asset
Monitors
Total Productivity CenterServer
Fabric
Disk
Data
33

The Network Manager Server helps to centralized monitoring and management for the network:
� The server collects layers 2 through 3 of network data and build and maintain the network topology information. At the same time, the server monitors the status of the whole network operation and collects events. With accurate network visibility, we can visualize and manage complex networks efficiently and effectively.
� The root cause analysis engine provides valuable advanced fault correlation and diagnostic capabilities. Real-time root cause analysis helps operations personnel identify the source of network faults and helps to resolve problems quickly.
� The software has asset control capabilities that help organizations optimize utilization to realize greater return from network resources. The asset control capabilities deliver highly accurate, real-time information about network connectivity, availability, performance, usage, and inventory.
The TotalStorage Productivity Center Server helps with centralized monitoring and management for the SAN:
� TotalStorage Productivity Center for Fabric monitors the availability and performance for the SAN fabric and includes:
– The automatic device discovery function enables you to see the data path from the servers to the SAN switches and storage systems.
– The real-time monitoring and alerts functions help administrators to discover problems so that they can resolve them.
� TotalStorage Productivity Center for Fabric for Disk monitors the availability and performance of the storage system.
� TotalStorage Productivity Center for Fabric for Data monitors the space usage for file systems and databases in the hosting servers.
Together with the servers, we have a monitoring solution for the scenario three network and SAN environment that provides the following benefits:
� A clear picture of the network topology and the network connection status so that any problem is easy to discover
� A clear picture of the SAN topology and the SAN connection status so that any problem is easy to discover
� A real-time monitoring and alert mechanism for the network and the SAN to discover the problem and fix it as soon as possible
� Comprehensive information about the operational performance for the network and SAN environment
� Disk utilization information and the usage trends for the storage system
Complex retail environment
In this section, we describe a complex scenario of a fictitious company, ITSO Enterprises. ITSO Enterprises wants to implement advanced infrastructure management. So, we discuss the management needs of the company and go through the basic component selection steps to illustrate how to design a comprehensive management infrastructure.
34 End-To-End Availability and Performance Management using IBM Tivoli Solutions

Scenario overviewITSO Enterprises is a retail company with nation-wide coverage that is headquartered in a large city. ITSO Enterprises’ IT environment is complex and distributed. Its environment includes:
� Networking infrastructure:
– ITSO Enterprises operates a geographically distributed network. It has about 200 remote offices around the country, each connected to the headquarter through WAN links.
– WAN lines are also utilized for in-company voice connections. Branches use VoIP links to reduce communication charges.
– The network is built using SNMP-manageable active devices.
� Servers and applications:
– The server park is heterogeneous. It is mostly AIX, but there are Solaris and Linux servers, too.
– The most important business application of ITSO Enterprises is the retail application. It is supported by a central server farm of high-end AIX servers as well as smaller application and database servers that are located at the remote sites. Site servers run AIX or Linux at a few locations.
– At headquarters, several central database servers consolidate sales and distribution data, and those servers run Oracle RDBMS.
– In terms of Enterprise Resource Planning (ERP), ITSO Enterprises relies on SAP applications that run on AIX servers and that use DB2® as the back-end database.
– Application integration is accomplished using IBM WebSphere Message Broker, which connects all major applications using a message-oriented approach of loose coupling. Message Broker runs on AIX.
– Base domain services, such as file and print, are provided by Microsoft Windows infrastructure, and the messaging infrastructure is Microsoft Exchange-based. All users use Windows desktop personal computers.
35

Figure 15 shows the simplified IT architectural overview of ITSO Enterprises.
Figure 15 Architecture overview of ITSO Enterprises
Infrastructure management requirementsITSO Enterprises intends to implement an end-to-end performance and availability monitoring environment for their server and application infrastructure. The company has just released an IT infrastructure management RFP (request for proposal) with the following high-level functional requirements:
� Server management:
– Monitoring key server resources, such as CPU, memory, and disk
– Monitoring the base platform (operating system) resources
– Consolidated management for a mixed environment of AIX, Solaris, Windows, and Linux servers
– Support for task automation and automated notifications to make IT operations more effective and efficient
� Application management:
– Resource specific monitoring of ITSO Enterprises’ key applications, which include:
• WebSphere Application Server• WebSphere Message Broker• SAP applications• DB2 and Oracle RDBMS• Microsoft Exchange Server
– A common management platform with base server management
Remote site y
Site server Remote site 1
ITSO headquarters – internal network
Site server
INTERNET
WAN links (direct leased lines)
Remote site n
Site serverRemote site x
Site server
Retail application server farm
SAP applications, DB2
Windows file&print servicesMicrosoft Exchange
Retail data warehouse, Oracle
Integration server
Windows based desktops
36 End-To-End Availability and Performance Management using IBM Tivoli Solutions

� IP network management:
– Network topology discovery and graphical visualization
– Networking device monitoring at the layer 2/3 level
– Both IP and VoIP network traffic monitoring with performance reporting and alerting
� Central event console:
– Consolidation of events from the server, application, and network monitoring, as well as from performance management
– High-capacity event processing: correlation, event reduction, and cross-domain root cause analysis
– Policy-driven sophisticated event processing capabilities and integration with the external inventory database to support event handling
– Web-based user interface
– Comprehensive historical reporting
� Service management:
– Service model-based service monitoring
– Integration of business metrics in addition of availability data to support comprehensive service monitoring
– Service level objectives (SLO) management and reporting for critical business services
� Help desk:
– Consolidated “single point of contact” help desk environment for the network, servers, and applications
– Trouble ticketing, incident management, and problem management
– Escalation management
� General requirements:
– Web browser-accessible graphical interfaces
– Scalable and robust management infrastructure
– Integrated components
Management infrastructure design for ITSO EnterprisesTo answer the broad range of requirements, we need a series of Tivoli components. We also need to show that these components are not isolated, but that they can be integrated to build a comprehensive solution that covers all of the necessary functionalities.
The management infrastructure that we design in response to the RFP is divided into three layers:
� Data collection layer
This layer, which is logically at the bottom of the management architecture, is responsible for performing the basic and advanced monitoring of the resources, such as the networking devices, servers, and applications. It collects base availability data by periodic polling of the devices or by receiving event-driven management data (in the form of management traps).
Solution components in the first layer also include the data collection tasks of performance management by reading equipment counters for network traffic and other transactions.
37

To a certain extent, the data collection components are already able to implement advanced functions, such as event correlation, but these functions are limited to the subdomain with which these tools work (for example, servers or network).
� Event correlation and the automation layer
The middle layer holds the cross-domain event correlation and automation capabilities. As opposed to similar but subdomain-limited functions that are present in the elements of the data collection layer, components in the middle layer can provide an enterprise-wide view to the ITSO Enterprises IT staff.
The middle layer also helps to transform equipment-specific information, such as availability events from a server or a networking device, into business-relevant service information.
� Visualization layer
This layer provides an integrated, Web-based graphical interface for most of the solution components, and it also provides the IT operations staff with Web-based event lists.
Product selection for the data collection layerThis section discusses the product selection for the data collection layer.
Server and application monitoringITSO Enterprises needs a solution that is able to monitor their heterogeneous servers with a unified management system. Servers running various operating systems can be monitored by deploying Tivoli Monitoring agents on them. These Tivoli Monitoring agents are small pieces of code that collect data and forward the data to the central management server.
Base monitoring cannot cover application metrics, such as table space allocation details (databases) or message queue length (WebSphere Message Broker). Specific knowledge and monitoring capabilities that are relevant from the application’s perspective can be added to the management system by additional Tivoli Monitoring modules. The mapping is:
� DB2 and Oracle RDBMS: Tivoli Monitoring for Databases� SAP: Tivoli Monitoring for Applications� Microsoft Exchange: Tivoli Monitoring for Messaging and Collaboration� WebSphere Message Broker: OMEGAMON for Messaging
Both base monitoring and application monitoring components report to the central Tivoli Monitoring Server (called Tivoli Enterprise Monitoring Server). If the network topology and bandwidth conditions or scalability issues require, we can also implement a distributed monitoring infrastructure by deploying additional (remote) servers.
Tivoli Monitoring data can be displayed using Tivoli Enterprise Portal using windows that are customizable by the operators and that can be accessed using Web browsers. With Tivoli Monitoring, we can prepare and perform automated tasks to handle incoming events collected by the monitoring agents. Also, Tivoli Monitoring can forward filtered events and messages to the central event management engine.
38 End-To-End Availability and Performance Management using IBM Tivoli Solutions

Figure 16 illustrates the Tivoli Monitoring part of the management architecture.
Figure 16 Data collection layer: Tivoli Monitoring
Figure 16 shows which Tivoli Monitoring components are used to manage the different servers and applications. For servers running specific applications that need to be monitored, both base monitoring and application-specific monitoring agents are deployed.
Network monitoring: Availability and performanceThe ITSO Enterprises network is IP-based and consists of numerous LAN and WAN devices. ITSO Enterprises has a requirement to be able to perform a discovery task that builds a graphical topology map and also a requirement to keep that topology map updated for both layer 2 and layer 3.
To meet these requirements, we can use Tivoli Network Manager IP Edition. It can discover and model the network topology and visualize that topology in a graphical display. It interfaces with the network elements and collects and consolidates events. It can visualize and report on devices, connectivity, and event status. It performs root cause analysis at the network level and forwards information to the central event processing engine.
According to the needs of ITSO Enterprises, it is not only the availability of the network that has to be monitored, but they want to know how their network behaves from a performance perspective, too. ITSO Enterprises is dependent on their VoIP solution when communicating internally between branch offices; therefore, they need a solution that can handle VoIP specifics.
For these purposes, we can use Tivoli Netcool/Proviso. It interacts seamlessly with the devices that are used by ITSO Enterprises and can provide a comprehensive performance management solution for ITSO Enterprises. It reads raw data from the devices using its dataload collectors, aggregates the data, and transforms the aggregated data into meaningful key performance indicators (KPIs). Tivoli Netcool/Proviso supports both native IP and VoIP traffic. The rich reporting features of Tivoli Netcool/Proviso can address the reporting needs of ITSO Enterprises.
ITSO Enterprises headquarters - internal network
Retail application server farm
SAP applications, DB2
Windows file& print servicesMicrosoft Exchange
Retail data warehouse, Oracle
Integration server
1
1 – ITM (Tivoli Monitoring) base
2 – ITM for Databases3 – ITM for Applications
4 – OMEGAMON for Messaging
5 – ITM for Messaging & Collaboration
1
11 1
3
2
2
1
415
1
Tivoli Monitoring
1
2
3
4
5
1
2
1
1
39

We can define alerting thresholds for key metrics and when those alerting thresholds for key metrics are defined, Tivoli Netcool/Proviso can send performance alerts to the central event console by utilizing native integration.
Both Tivoli Network Manager and Proviso have a browser-based graphical interface.
In Figure 17, we show two types of data connections that are illustrated by dashed and solid lines. Dashed lines represent the data flow between the SNMP-based devices and Tivoli Netcool/Proviso reading performance counters from the devices to collect data for performance management. The solid lines represent device polling and topology discovery by Tivoli Network Manager to be used for availability management.
Figure 17 Network management: Performance and availability
Figure 18 shows an overview of the data collection layer that we have discussed thus far. These components report to the central event console for automation and correlation. As we go further with our discussion of the management architecture, we will show you how the remaining layers are built.
Figure 18 Data collection layer of ITSO Enterprises management infrastructure
Netcool Proviso Network Manager IP Edition
Remote site y
Site server Remote site 1
Site server
INTERNET
W AN links (direct leased lines )
Rem ote site n
Site serverRemote site x
Site server
Tivoli MonitoringNetwork Manager IP Edition
Netcool/Proviso
NetworkLAN
WAN linksVoice network
IT infrastructureServers
ApplicationDatabases
Discovery & monitoring Monitoring
40 End-To-End Availability and Performance Management using IBM Tivoli Solutions
Product selection for the correlation and automation layerWe now select the products for the middle layer, which is the correlation and automation layer.
Central event consoleThe central event console needs to handle the information that is collected by the components in the underlying data collection layer. Because the ITSO Enterprises network contains a large number of networking devices, servers, and applications, we need to focus on the data and event volumes that need to be processed at this point.
For the role of the central event console, we can use Tivoli Netcool/OMNIbus, which is a robust, scalable, high performance event processing engine that can handle large volumes of events from all across the IT infrastructure of ITSO Enterprises. It has native interfaces, which are called probes, to the data collection components, such as network management (Tivoli Network Manager) or Tivoli Monitoring, and can be extended to integrate with other parts of the management infrastructure by utilizing its gateways. We can use this feature when designing integration with the help desk component later.
Tivoli Netcool/OMNIbus performs filtering and automated event processing by applying a sequence of rules to determine the impact of the faults. The impact is calculated in the context of all information that has been collected from all parts of the network (cross-domain analysis). Events are then displayed in customizable and filterable event lists for the operators.
For sophisticated policy-based event processing and event enrichment, we can use Tivoli Netcool/Impact. It is fully integrated with Tivoli Netcool/OMNIbus by using a bidirectional link to catch and process Omnibus events and feed back the results of the processing into the original event records in the form of additional or modified fields. This integration and additional information can help the ITSO Enterprises IT staff to better prioritize incoming events and to decide which events to address first to remedy business service problems.
During policy processing, Tivoli Netcool/Impact can interface with external data sources, applications, and databases to fetch data. We can take advantage of this capability to design an integration point between the central event console and ITSO Enterprises third-party inventory database, which is one of the RFP requirements.
In terms of reporting, Tivoli Netcool/OMNIbus can forward event data to a persistence database of a historical reporting tool. For this purpose, we can deploy Tivoli Netcool/Reporter. Using a standard gateway between Omnibus and Reporter, data can be transferred for reporting purposes. Tivoli Netcool/Reporter provides rich functionality to build, customize, and display reports using event data. All functions of Tivoli Netcool/Reporter can be accessed using Web browsers.
Service managementOn top of the standard element-related event management, ITSO Enterprises requested service modeling and service monitoring, as well as service level agreement (SLA) management.
To address these areas, we need two additional components: Tivoli Business Service Manager and Tivoli Service Level Advisor.
Tivoli Business Service Manager provides graphical tooling to compose business models from the monitored devices and applications. We can group and combine those objects into composite objects called services and calculate the overall availability of the services based on the individual availability data of the devices. Therefore, we have the tooling to manage the infrastructure from the business perspective. We can rely on what is monitored at the
41

infrastructure level but bring that information to a level higher: to the level of business services supported by that infrastructure.
To achieve this end, we need a mechanism to import status data into our service model. There is a smooth integration between event processing and service monitoring. At Tivoli Business Service Manager’s core, there is a technology that has the same roots as Tivoli Netcool/OMNIbus. Events and device status information that are handled by Omnibus can be forwarded to Business Service Manager to provide a live feed to the business model. We can even use data from outside of the traditional infrastructure management domain. Service models can also be fed by data coming from external sources, such as sales figures or any other relevant data from the business service perspective.
Tivoli Business Service Manager can give a clear picture of the real-time operational state of ITSO Enterprises, but it does not offer a corresponding historical view of this information. So, we still need to provide the historical service level management and reporting.
Tivoli Service Level Advisor fills this gap. It gives a clear picture of the historical performance of defined SLAs and so it complements Tivoli Business Service Manager. Together, these products show the complete view of an SLA.
Tivoli Service Level Advisor tracks service offerings and relate those service offerings to services that are being monitored. Service models are shared with Tivoli Business Service Manager, so we do not need to redefine our services. By collecting service availability data in a database, we can run detailed reports using a Web-based graphical interface that shows how services availability met our objectives.
Help deskIn a complex management environment, a help desk solution is essential in terms of implementing consistent support processes. Incident and problem handling are related processes according to ITIL and fit well with availability and performance management. In the ITSO Enterprises environment, the help desk function can be implemented using Tivoli Service Request Manager.
Service Request Manager is a full-featured service desk application that can help IT professionals to better perform their daily tasks, such as:
� Record incidents and service requests� Enforce a predefined life cycle through workflows� Use escalations to facilitate problem solving as necessary� Document the entire life cycle of incidents and service requests
Based on the recorded activities associated to incidents and requests, Tivoli Service Request Manager can provide managers of ITSO Enterprises with detailed reports about the IT support process performance. If there is a bottleneck in terms of personnel, or if there is a risk of severe service disruption, managers can quickly pinpoint those areas and take respective actions.
42 End-To-End Availability and Performance Management using IBM Tivoli Solutions

Figure 19 shows the components in the correlation and automation layer. You can also see how these components work together (indicated by the arrows showing the data between them). We provide a detailed description of the common data flows across these components in “Putting it all together”.
Figure 19 Correlation and automation layer of ITSO Enterprises management infrastructure
Product selection for the visualization layerThe core architecture is mostly based on Tivoli Netcool solutions (or on those products that came from that product family, such as Tivoli Network Manager or Business Service Manager). These components utilize a common visualization framework, called Tivoli Netcool GUI Foundation, and can be easily integrated into a consolidated Web portal that is implemented by Tivoli Netcool/Portal.
Therefore, for our architecture in this scenario, we choose Tivoli Netcool/Portal as the visualization layer. With customization that is supported by Tivoli Netcool/Portal, we can extend this visualization layer to include information from other Web-based components in the architecture, such as Service Request Manager or Service Level Advisor.
Tivoli Netcool/Portal can also serve as a single sign-on mechanism across applications that are integrated, enabling specific role-based privileges by user.
Putting it all togetherThese solution components can be integrated to form a comprehensive service management solution for ITSO Enterprises. The environment consists of the IBM Tivoli products shown in Table 3.
Table 3 Tivoli products in the ITSO Enterprises management architecture
Product Function within the architecture
Tivoli Monitoring modules and Tivoli OMEGAMON
Server and application monitoring
Tivoli Network Manager IP Edition Network monitoring and topology discovery
Tivoli Netcool/Proviso Network performance management and reporting
Netcool/OMNIbus
DesktopObject server
Service Level advisor
Business service manager
Netcool/Impact
Service Request Manager
Reporting Database
Netcool/Reporter
43

Figure 20 shows the overall architecture.
Figure 20 Monitoring and service management infrastructure designed for ITSO Enterprises
Tivoli Netcool/OMNIbus Central event console
Tivoli Netcool/Impact Advanced event processing
Tivoli Netcool/Reporter Historical availability reporting
Tivoli Netcool/Webtop Graphical interface to Omnibus
Tivoli Netcool/Portal Consolidated Web-based interface
Tivoli Business Service Manager Service modeling and monitoring
Tivoli Service Level Advisor SLA management and reporting
Tivoli Service Request Manager Centralized help desk and incident and problem management
Product Function within the architecture
Data collection layer
Visualization Layer
Netcool/OMNIbus
DesktopObject server
Service Level advisor
SLA management
Business service manager
Business service modellingNetcool/impact
Advanced correlation & integration
Service Request Manager
Trouble ticket & incident
Netcool/reporter
Historical reporting
Tivoli MonitoringNetwork Manager IP Edition
Netcool/Proviso
NetworkLAN
WAN linksVoice network
IT infrastructureServers
ApplicationDatabases
Discovery & monitoring Monitoring
Performancealert
Netcool/Webtop
Web-based event view
Netcool/GUI Foundation
Common application server
Netcool/Portal
Web integration tool
Correlation and automation layer
44 End-To-End Availability and Performance Management using IBM Tivoli Solutions

The flow of data processing within the infrastructure is:
� Element availability data is collected from the infrastructure (servers, applications, and the network), and it is preprocessed by Tivoli Monitoring and Tivoli Network Manager at these management levels.
� Performance data is gathered and processed by Tivoli Proviso. Performance reports can be viewed by using the Web-based reporting tools of Proviso.
� Filtered, preprocessed event information is forwarded to the central event management console that runs cross-domain analysis and automation. Event information can be derived from what is monitored by Tivoli Monitoring or Tivoli Network Manager, as well as from performance monitoring done by Tivoli Proviso. In the latter case, information is forwarded in the form of performance alerts. For data links with Tivoli Netcool/OMNIbus, we can use specific Netcool Probes that are available with the product.
� The central event engine, Tivoli Netcool/OMNIbus, performs deduplication, filtering, and correlation. Advanced policy processing and event enrichment are done by the integration of Tivoli Netcool/Impact, which interfaces with ITSO Enterprises third-party inventory management database:
– Filtered event lists are displayed to the operators on the graphical windows of Tivoli Netcool (using the Webtop component to show event lists).
– Availability data is forwarded to Tivoli Netcool/Reporter using a standard gateway. Historical reports can be displayed using data that is available in the Tivoli Netcool/Reporter database.
– In case there is a need to open trouble tickets, data is forwarded automatically to Tivoli Service Request Manager, which handles the life cycle of the tickets by following predefined workflows and escalations. When tickets are closed, this information gets synchronized back to the central event console to clear the originating event. There is a standard bidirectional gateway that supports this integration.
� Availability data is transferred from Omnibus to the service models of Tivoli Business Service Manager using a standard integration interface between the products. Tivoli Business Service Manager processes this information to calculate service status. It displays the color-coded real-time status of the business services and can generate events in case a key service is experiencing problems. Service-related events can be used in correlation activities in the central event console or can be forwarded to the trouble ticketing application to open tickets.
� Tivoli Service Level Advisor collects historical data on availability and calculates service level achievements based on defined service definitions. A standard integration interface exists between Tivoli Service Level Advisor and Business Service Manager to exchange SLA events.
With its trending algorithm, Tivoli Service Level Advisor can predict SLA breaches and generate events from those breaches to be processed in the central event console. Finally, SLA reports are displayed on the central event console graphical interface.
� A consolidated graphical view of the overall system is displayed using Tivoli Netcool/Portal.
Solution characteristicsAs you might have realized by now, the environment that we have described is clearly aimed at implementing a management system that corresponds to Level 3 - IT Service management. We propose a solution here that is able to perform simple resource management, as well as make a significant step toward a business-focused infrastructure management, that is, IT service management.
45

It is important to see how our building blocks can be positioned within the IBM blueprint. You can see that these products can be categorized as being mostly Operational management products, but as a comprehensive service management solution, the environment contains elements from the Service management platform and the Process management product layers, too. This integration of products from multiple layers is what you can expect in the majority of cases where you design complex solutions for large enterprises.
Solution benefitsThis management solution gives the following clear benefits to ITSO Enterprises:
� Unified end-to-end management of availability and performance for the entire environment, including various server platforms, applications, and networking components:
– Centralized and consolidated event management with advanced event processing policies
– Business service management focus allows:
• Operators to focus on the faults and problems that have the most critical effect on business continuity
• IT managers to quickly overview the actual status of the infrastructure from the business services perspective
� The help desk and problem management ensure repeatable IT service support processes.
� Integrated tooling shortens the deployment time and helps reduce implementation project risks.
� The solution can be further extended to include a CCMDB (by potentially replacing the existing inventory database of ITSO Enterprises) and related processes, such as change management or release management:
– Product integrations are available and can be taken advantage of:
• Between CCMDB (implemented by Tivoli Change and Configuration Management Database) and Tivoli Business Service Manager to support business service modeling and management by discovered dependency and topology data
• Between CCMDB and Tivoli Service Request Manager
� The solution can be further extended to include capacity management for servers. Tivoli Performance Analyzer can be used as an add-on for Tivoli Monitoring.
Summary
Designing performance and availability solutions for an enterprise requires an in-depth analysis and understanding of the enterprise’s business goals and measurements. A complete strategy must be defined to address the enterprise’s measurement and monitoring needs and to guide them to achieve their business goals. IBM Tivoli solutions contains a wide range of products for different purposes, such as resource monitoring, application monitoring, event automation, and business service management. These products can be integrated to build the strategic solution for an enterprise.
46 End-To-End Availability and Performance Management using IBM Tivoli Solutions

Other resources for more information
For further information, refer to the following resources:
� IBM Tivoli Composite Application Manager Family Installation, Configuration, and Basic Usage, SG24-7151
� Getting Started with IBM Tivoli Monitoring 6.1 on Distributed Environments, SG24-7143
� Migrating to Netcool/Precision for IP Networks --Best Practices for Migrating from IBM Tivoli NetView, SG24-7375
� Automation Using Tivoli NetView OS/390 V1R3 and System Automation OS/390 V1R3, SG24-5515
� An Introduction to Tivoli NetView for OS/390 V1R2, SG24-5224
� IBM Tivoli OMEGAMON XE V3.1.0 Deep Dive on z/OS, SG24-7155
� Implementing OMEGAMON XE for Messaging V6.0, SG24-7357
� Introducing IBM Tivoli Service Level Advisor, SG24-6611
� IBM Tivoli Business Service Manager V4.1, REDP-4288
� Event Management Best Practices, SG24-6094
� IBM Tivoli Application Dependency Discovery Manager Capabilities and Best Practices, SG24-7519
These Web sites are also relevant as further information sources:
� Tivoli Information Center:
http://publib.boulder.ibm.com/tividd/td/tdprodlist.html
� IBM service management and tools Web sites:
http://www.ibm.com/software/tivoli/governance/servicemanagement/welcome/process_reference.htmlhttp://www.ibm.com/software/tivoli/governance/servicemanagement/itup/tool.htmlhttp://www.ibm.com/software/tivoli/itservices/http://www.ibm.com/software/tivoli/opal/
� Tivoli product Web sites:
http://www.ibm.com/software/tivoli/products/netcool-Omnibus/http://www.ibm.com/software/tivoli/products/netcool-impact/http://www.ibm.com/software/tivoli/products/netcool-reporterhttp://www.ibm.com/software/tivoli/products/bus-srv-mgr/http://www.ibm.com/software/tivoli/products/ccmdb/http://www.ibm.com/software/tivoli/products/performance-analyzer/http://www.ibm.com/software/tivoli/products/netcool-webtop/http://www.ibm.com/software/tivoli/products/netcool-performance-mgr-wireless/http://www.ibm.com/software/tivoli/products/service-level-advisor/http://www.ibm.com/software/tivoli/products/netcool-service-quality-mgr/http://www.ibm.com/software/tivoli/products/netcool-portal/http://www.ibm.com/software/tivoli/products/netcool-proviso/http://www.ibm.com/software/tivoli/products/omegamon-xe-db2-peex-zos/http://www.ibm.com/software/tivoli/products/service-request-mgr/http://www.ibm.com/software/tivoli/products/storage-process-mgr/http://www.ibm.com/software/tivoli/products/release-process-mgr/http://www.ibm.com/software/tivoli/products/availability-process-mgr/http://www.ibm.com/software/tivoli/products/capacity-process-mgr/http://www.ibm.com/software/tivoli/products/monitor/
47

http://www.ibm.com/software/tivoli/products/monitor-systemp/http://www.ibm.com/software/tivoli/products/monitor-virtual-servers/http://www.ibm.com/systems/storage/software/center/fabric/http://www.ibm.com/systems/storage/software/center/disk/http://www.ibm.com/systems/storage/software/center/data/http://www.ibm.com/software/tivoli/products/totalstorage-replication/http://www.ibm.com/software/tivoli/products/network-mgr-entry-edition/http://www.ibm.com/software/tivoli/products/netcool-precision-ip/http://www.ibm.com/software/tivoli/products/netcool-precision-tn/http://www.ibm.com/software/tivoli/products/composite-application-mgr-ism/http://www.ibm.com/software/tivoli/products/monitor-db/http://www.ibm.com/software/tivoli/products/monitor-apps/http://www.ibm.com/software/tivoli/products/monitor-cluster/http://www.ibm.com/software/tivoli/products/monitor-messaging/http://www.ibm.com/software/tivoli/products/monitor-messaging-exchange/http://www.ibm.com/software/tivoli/products/monitor-net/http://www.ibm.com/software/tivoli/products/omegamon-xe-messaging-dist-sys/http://www.ibm.com/software/tivoli/products/composite-application-mgr-websphere/http://www.ibm.com/software/tivoli/products/composite-application-mgr-itcam-j2ee/http://www.ibm.com/software/tivoli/products/composite-application-mgr-web-resources/http://www.ibm.com/software/tivoli/products/composite-application-mgr-soa/http://www.ibm.com/software/tivoli/products/composite-application-mgr-rtt/http://www.ibm.com/software/tivoli/products/composite-application-mgr-response-time/http://www.ibm.com/software/tivoli/products/omegamon-xe-databases/http://www.ibm.com/software/tivoli/products/omegamon-xe-cics/http://www.ibm.com/servers/eserver/zseries/zos/zmc/http://www.ibm.com/software/tivoli/products/netview-zos/http://www.ibm.com/software/tivoli/products/omegamon-xe-db2-pemon-zos/http://www.ibm.com/software/tivoli/products/omegamon-xe-ims/http://www.ibm.com/software/tivoli/products/omegamon-xe-linux-zseries/http://www.ibm.com/software/tivoli/products/omegamon-xe-mainframe/http://www.ibm.com/software/tivoli/products/omegamon-xe-messaging-zos/http://www.ibm.com/software/tivoli/products/omegamon-xe-storage/http://www.ibm.com/software/tivoli/products/omegamon-xe-sysplex/http://www.ibm.com/software/tivoli/products/omegamon-xe-uss/http://www.ibm.com/software/tivoli/products/omegamon-xe-zos/http://www.ibm.com/software/tivoli/products/omegamon-xe-zvm-linux/
The team that wrote this guide
This Redguide was produced by a team of specialists from around the world working at the International Technical Support Organization (ITSO).
Budi Darmawan is a Project Leader at the ITSO, Austin Center. He writes extensively and teaches IBM classes worldwide on all areas of Tivoli and systems management. Before joining the ITSO eight years ago, Budi worked in IBM Indonesia as a solution architect and lead implementer. His current interests are Java programming, application management, and general systems management.
48 End-To-End Availability and Performance Management using IBM Tivoli Solutions
Grake Chen is an IBM Certified IT Architect in Global Technology Services, IBM Taiwan. He has 17 years working experience in IBM. His areas of expertise include system integration services, infrastructure planning, high availability, and disaster recovery solutions.
Laszlo Varkonyi holds a Masters degree in Electrical Engineering from the Technical University, Budapest, Hungary. He has 14 years of experience in the software industry. He is a Senior (IBM and Open Group Certified) Software IT Architect in Hungary. His areas of expertise include service-oriented architecture (SOA) design and consultancy, service management architecture design and consultancy, and identity and access management solutions. He joined IBM five years ago. Before joining IBM, he worked for an IBM Business Partner as a senior consultant of systems management, trouble ticketing, and network security solutions.
Thanks to the following people for their contributions to this project:
Greg Bowman, Stephen HochstetlerIBM Software Group, Tivoli Systems
49

50 End-To-End Availability and Performance Management using IBM Tivoli Solutions

Notices
This information was developed for products and services offered in the U.S.A.
IBM may not offer the products, services, or features discussed in this document in other countries. Consult your local IBM representative for information on the products and services currently available in your area. Any reference to an IBM product, program, or service is not intended to state or imply that only that IBM product, program, or service may be used. Any functionally equivalent product, program, or service that does not infringe any IBM intellectual property right may be used instead. However, it is the user's responsibility to evaluate and verify the operation of any non-IBM product, program, or service.
IBM may have patents or pending patent applications covering subject matter described in this document. The furnishing of this document does not give you any license to these patents. You can send license inquiries, in writing, to: IBM Director of Licensing, IBM Corporation, North Castle Drive, Armonk, NY 10504-1785 U.S.A.
The following paragraph does not apply to the United Kingdom or any other country where such provisions are inconsistent with local law: INTERNATIONAL BUSINESS MACHINES CORPORATION PROVIDES THIS PUBLICATION "AS IS" WITHOUT WARRANTY OF ANY KIND, EITHER EXPRESS OR IMPLIED, INCLUDING, BUT NOT LIMITED TO, THE IMPLIED WARRANTIES OF NON-INFRINGEMENT, MERCHANTABILITY OR FITNESS FOR A PARTICULAR PURPOSE. Some states do not allow disclaimer of express or implied warranties in certain transactions, therefore, this statement may not apply to you.
This information could include technical inaccuracies or typographical errors. Changes are periodically made to the information herein; these changes will be incorporated in new editions of the publication. IBM may make improvements and/or changes in the product(s) and/or the program(s) described in this publication at any time without notice.
Any references in this information to non-IBM Web sites are provided for convenience only and do not in any manner serve as an endorsement of those Web sites. The materials at those Web sites are not part of the materials for this IBM product and use of those Web sites is at your own risk.
IBM may use or distribute any of the information you supply in any way it believes appropriate without incurring any obligation to you.
Information concerning non-IBM products was obtained from the suppliers of those products, their published announcements or other publicly available sources. IBM has not tested those products and cannot confirm the accuracy of performance, compatibility or any other claims related to non-IBM products. Questions on the capabilities of non-IBM products should be addressed to the suppliers of those products.
This information contains examples of data and reports used in daily business operations. To illustrate them as completely as possible, the examples include the names of individuals, companies, brands, and products. All of these names are fictitious and any similarity to the names and addresses used by an actual business enterprise is entirely coincidental.
COPYRIGHT LICENSE:
This information contains sample application programs in source language, which illustrate programming techniques on various operating platforms. You may copy, modify, and distribute these sample programs in any form without payment to IBM, for the purposes of developing, using, marketing or distributing application programs conforming to the application programming interface for the operating platform for which the sample programs are written. These examples have not been thoroughly tested under all conditions. IBM, therefore, cannot guarantee or imply reliability, serviceability, or function of these programs.
© Copyright IBM Corp. 2009. All rights reserved. 51

Trademarks
IBM, the IBM logo, and ibm.com are trademarks or registered trademarks of International Business Machines Corporation in the United States, other countries, or both. These and other IBM trademarked terms are marked on their first occurrence in this information with the appropriate symbol (® or ™), indicating US registered or common law trademarks owned by IBM at the time this information was published. Such trademarks may also be registered or common law trademarks in other countries. A current list of IBM trademarks is available on the Web at http://www.ibm.com/legal/copytrade.shtml
The following terms are trademarks of the International Business Machines Corporation in the United States, other countries, or both:
AIX 5L™AIX®CICS®DB2®DS4000®i5/OS®IBM®Micromuse®
Netcool®NetView®OMEGAMON®OS/390®Proviso®Rational®Redbooks (logo) ®Redguide™
ServiceAssure™System p®System z®Tivoli Enterprise Console®Tivoli®TotalStorage®WebSphere®z/OS®
The following terms are trademarks of other companies:
ITIL is a registered trademark, and a registered community trademark of the Office of Government Commerce, and is registered in the U.S. Patent and Trademark Office.
SUSE, the Novell logo, and the N logo are registered trademarks of Novell, Inc. in the United States and other countries.
Oracle, JD Edwards, PeopleSoft, Siebel, and TopLink are registered trademarks of Oracle Corporation and/or its affiliates.
mySAP, mySAP.com, SAP, and SAP logos are trademarks or registered trademarks of SAP AG in Germany and in several other countries.
J2EE, J2SE, Java, Solaris, and all Java-based trademarks are trademarks of Sun Microsystems, Inc. in the United States, other countries, or both.
Microsoft, Windows, and the Windows logo are trademarks of Microsoft Corporation in the United States, other countries, or both.
Intel, Intel logo, Intel Inside logo, and Intel Centrino logo are trademarks or registered trademarks of Intel Corporation or its subsidiaries in the United States, other countries, or both.
UNIX is a registered trademark of The Open Group in the United States and other countries.
Linux is a trademark of Linus Torvalds in the United States, other countries, or both.
Other company, product, or service names may be trademarks or service marks of others.
52 End-To-End Availability and Performance Management using IBM Tivoli Solutions