burial history and thermal maturity of mesozoic rocks … · burial history and thermal maturity of...
TRANSCRIPT

Burial history and thermal maturity of Mesozoic rocksof the Dolomites, Northern Italy
Arne Grobe1 • Ralf Littke1 • Victoria Sachse1 • Detlev Leythaeuser1
Received: 6 August 2014 /Accepted: 8 May 2015
� Swiss Geological Society 2015
Abstract Thermal maturity analyses provide a valid basis
to reconstruct the burial and temperature history of sedi-
mentary rocks. In combination with computer based
modeling it is possible to quantify former overburden and
erosional thickness. This study was carried out to analyze
thermal maturity and elaborate the burial history of Permo-
Mesozoic sediments of the Western Dolomites, Northern
Italy. Based on their location in the non-metamorphosed
Southern Alps of the Alpine realm, the Dolomites are well
suited to study thermal maturation in a complex orogenic
setting. Determination of maturity was carried out by vit-
rinite reflectance and solid bitumen reflectance measure-
ments on a large number of samples as well as by Rock–
Eval pyrolysis. Vitrinite reflectance commonly ranges
between 0.5 % VRr for Triassic and 0.76 % VRr for Per-
mian sediments allowing an analysis of the lateral and
vertical maturation patterns. Several 1D basin models were
developed and calibrated by maturity measurements.
Results show that deepest burial probably occurred at the
end of Cretaceous times, followed by erosion of about
1800 ± 200 m. The estimated heat flows were moderate
with 75 mW/m2 for Jurassic rifting, 46 mW/m2 for times
of deepest burial and 41 mW/m2 for present day.
Keywords Alpine sedimentary units � Heat flow � Basinmodeling � Erosion � Vitrinite reflectance � Solid bitumen
reflectance
1 Introduction
In sedimentary basin research, knowledge of the burial
history is the key to reconstruct basin evolution.
With modern numerical modeling techniques it is pos-
sible to simulate and quantify the burial history of sedi-
mentary basins (e.g. Bruns et al. 2013). As a prerequisite
for numerical simulation, a good understanding of the
geology, including lithology, thickness and stratigraphy is
needed. Moreover, data representing the thermal history of
the basin is required to calibrate and verify the simulated
burial trends. Dispersed organic matter in sedimentary
basins reacts strongly and irreversibly to temperature
increase (Bostick and Foster 1975; Scheidt and Littke
1989). Thus, it is well suited for petrological and geo-
chemical analyses revealing parameters that represent the
maximum temperatures reached upon deep burial. A
common parameter to analyze thermal maturity is the
reflectance of dispersed organic matter, such as vitrinite or
solid bitumen particles (e.g. Noth et al. 2001; Schoenherr
et al. 2007; Littke et al. 2012).
Within the Alps the Dolomites are characterized by a
geological situation which favors this type of analysis of
thermal and burial history. Deposits of various stratigraphic
formations are still present in their original lateral conti-
nuity and intense folding, nappe thrusting and metamor-
phism, widespread in most alpine regions, did not occur in
the area of the Dolomites (Doglioni 1987; Bosellini et al.
2003). This geological situation is clearly present in the
western Dolomites, the study area of this work.
In the western Dolomites a Mesozoic sedimentary suc-
cession is underlain by thick layers of sedimentary rocks
and volcanics of Permian age. This volcanic sheet pre-
vented a stronger deformation of the area. The overlying
Mesozoic column is represented by 2500 to 3000 m of
Editorial handling: E. Gnos.
& Arne Grobe
1 Institute of Geology and Geochemistry of Petroleum and
Coal, RWTH Aachen University, Lochnerstrasse 4-20,
52056 Aachen, Germany
Swiss J Geosci
DOI 10.1007/s00015-015-0191-2

sedimentary rocks, mainly carbonates with interlayered
shales (Bosellini 1998; Brandner et al. 2011).
In areas affected by uplift events during geological history
the eroded thicknesses can be reconstructed on the basis of
burial history modeling. For some alpine areas such uplift
and erosional histories have been studied by analysis of
apatite fission tracks (Central Alps: Bernet et al. 2001;
Appenines: Dunkl et al. 2001;Venetian foreland: Zattin et al.
1990) or other maturity parameters, e.g. in Austria (e.g.
Sachsenhofer 1992; Rantitsch et al. 2005), Switzerland (e.g.
Suchy et al. 1997; Mahlmann and Giger 2012) and Slovenia
(Rainer et al. 2009). In the Dolomites only a few studies,
partly published in German, focused on reconstruction of
thermal maturity (Emmerich et al. 2005, 2008; Tscherny
2006; Tscherny et al. 2011;Blendinger et al. 2013). Tscherny
et al. (2011) performed numerical modeling for the area east
of the city of Corvara (Fig. 1) and estimated eroded thick-
nesses in the order of 1700–2400 m.
The objective of the present study is a reconstruction of
the burial and uplift history of Mesozoic sediments and the
evaluation of the eroded thicknesses of the Cretaceous
layers for the northwestern Dolomites and a comparison
with results from previous studies on other parts of the
Dolomites. Three representative sections were chosen to
evaluate the burial history by application of the PetroMod
1D software package (Schlumberger; Version 2012).
Thermal maturity was analyzed by vitrinite and solid
bitumen reflectance measurements to determine maximum
burial depth. These data are essential for calibration of the
modelled burial history. Additionally, elemental analysis
and Rock–Eval pyrolysis were carried out in order to
obtain information on petroleum generation and deposi-
tional conditions. This data set was interpreted in the
context of previous studies on the evolution of the western
Dolomites.
2 Geological setting and stratigraphy
The regional stratigraphy of the study area in the Dolomites
(Fig. 1) comprises Permian to Cretaceous, but mainly
Triassic rock units, underlain by a deformed Paleozoic
basement metamorphosed during the Variscan Orogeny
(Fig. 2, Bosellini et al. 2003). Initial rifting in the Early
Permian produced thick volcanic layers (Athesian Volcanic
Group or Bozen Porphyry Plateau) (Marocchi et al. 2008).
The sedimentary succession of the study area started in
the Permian with the Val Gardena Sandstone (Grodner
Fig. 1 Geological map of the Dolomites. The Dolomites are bordered
by the Periadriatic Lineament (PAL) in the north and the Suganer Line
in the south. Highlighted are the study areas of this and former
vitrinite reflectance studies [Map after Brandner (1980) and Bigi et al.
(1990), modified according to Tscherny (2006)]
A. Grobe et al.

Sandstein), representing red beds of a semi-arid paleo
setting, covered by shallow marine evaporites and car-
bonates (Bellerophon Formation) (Massari and Neri 1997;
Bosellini et al. 2003) towards the end of the Permian.
They are unconformably covered by shallow-water car-
bonates and interbedded terrigenous deposits of the Lower
Triassic Werfen Formation. After uplift and local depo-
sition of terrestrial clastic sediments (Perez Fm., locally
used unit, as Voltago Conglomerate and Richthofen
Conglomerate are not clearly distinguishable in the study
area) renewed transgression in the western part resulted in
lagoonal deposits comprised of terrigenous siliciclastics
and carbonates of the Morbiac Fm. Then first carbonate
platforms developed in shallow marine areas (Contrin
Fm.).
During the Late Anisian a fast subsidence pulse was
associated with platform drowning and contemporaneous
quick upward aggradation (Stefani et al. 2010). Thereby,
huge carbonate platforms (Sciliar/Schlern Fm.) were pro-
duced, with deep basin sediments deposited in between
(Buchenstein Fm.). Platform examples are the Marmolata
and Catenaccio (Rosengarten) complexes.
Fig. 2 Simplified stratigraphy
of the Dolomites in the Val
Gardena area. Listed ages and
stratigraphies are used in the
numerical model. Modified after
Tscherny et al. (2011).
Compiled from Bosellini
(1998), Keim et al. (2001) and
Bosellini et al. (2003). Ages
from Mundil et al. (2010) and
Ogg et al. (2014)
Burial history and thermal maturity of Mesozoic rocks…

During the tectono-magmatic event of Ladinian age,
some platforms were penetrated by dykes and large vol-
canic collapses occurred (Bosellini et al. 2003). Volcanic,
erosional debris with interlayered, calcareous detritus was
subsequently deposited in the basin facies (Wengen Fm.,
Fig. 2) (Keim 2008). The San Cassiano Formation (Keim
2008) represents a continuous sedimentation of calcareous
basin fill lacking any volcanic detritus. As basinal platform
the Cassian Dolomite developed on top of it, overlain by
shallow marine to continental depostits of the Raibl Group
(Stefani et al. 2010).
Subsequently, a massive carbonate platform (Dolomia
Principale) developed due to slow but continuous subsi-
dence (Hardie and Goldhammer 1986; Blendinger 2004;
Emmerich et al. 2005).
Towards the end of the Norian (Late Triassic), the dry,
arid climate changed to wet climate (Bosellini 1998; Berra
et al. 2010). A slow plateau subsidence, resulted in the
change from the deposition of the shallow marine Calcari
Grigi deposition to deeper-water sedimentation of slumps
and redeposited pelagic sediments of the Ammonitico
Rosso (Bertotti et al. 1993; Masetti et al. 2012). The
present day thicknesses of the Calcari Grigi and the
Ammonitico Rosso are varying in the study area: East of
the Val Badia Triassic deposits are followed without any
hiatus by Jurassic sediments. However, the Jurassic is
completely missing or preserved only as very thin and
partly eroded layer on the western site of the valley. In the
latter area the Cretaceous Puez-Marls follow uncon-
formably above the Triassic Dolomia Principale (Tsch-
erny 2006).
With the opening of the Ligurian-Piedmontese ocean in
the Middle to Upper Jurassic a new system of rifting
evolved (Bertotti et al. 1993) and the area of the Eastern
Dolomites became a passive continental margin (Carminati
et al. 2010). Nevertheless, the area was affected by ongoing
subsidence during the Upper Jurassic and Cretaceous
(Winterer and Bosellini 1981). At the end of the Jurassic
the depositional system changed to a more pelagic-clastic
one with calcarenites and mud turbidites (Carminati et al.
2010).
The stratigraphy of the Cretaceous is complex, but
almost all the Cretaceous is documented at different places
of the Dolomites. In the summit region of the Gardenaccia,
only the lower Cretaceous is preserved (Maiolica and Puez
Marls) above very thin Jurassic units (Stock 1994). How-
ever, in the Sella group Cretaceous sediments follow
conformably above the Ammonitico Rosso or above an
erosional surface within the Dolomia Principale. In the
northern Dolomites, in the Fanes-Sennes area, the Upper
Cretaceous units are very well known and the succession
spans from Maiolica (Tithonian to Barremian) to Scaglia
Rossa (Antruilles Fm, Turonian–Maastrichtian).
In the Val Gardena area the only Cretaceous sediments
preserved are the above mentioned of the Puez-Marls
(Bosellini 1998; Lukeneder and Aspmair 2006; Lukeneder
2010). All other Cretaceous sediments were eroded during
the Late Cretaceous and/or Tertiary (Fig. 2) due to the
uplift of the Alps (Doglioni 1984, 1992; Carminati and
Doglioni 2012). Apart from the Mont-Parei-Conglomerate,
Tertiary deposits are not preserved in the study area and the
Quaternary is represented only by thin sediment fillings of
Alpine valleys.
3 Samples and methods
Sample coverage of maturity measurements by selected
previous publications (Tscherny 2006; Emmerich et al.
2008; Blendinger et al. 2013) is shown in Fig. 1. In com-
bination with the previously assembled data set, an
improved database was achieved as a solid basis for
numerical basin modeling.
Based on fieldwork and literature information, the fol-
lowing stratigraphic layers were identified as potentially
vitrinite-bearing: Val Gardena Fm., Wengen Fm., Hei-
ligkreuz Fm., Moena Fm. (Bosellini 1998; Tscherny 2006),
Buchenstein Fm., Morbiac Fm. and the Upper Bellerophon
Fm. (Bosellini et al. 2003). Among those, the two first
listed formations were classified as ‘‘good’’ and the
remaining ones as ‘‘medium’’-quality using the quality
criteria of vitrinite reflectance measurements (Tscherny
2006). He classified samples as ‘‘good-quality’’ provided
they allowed the identification of more than 30 vitrinite
particles for reflectance measurements, whereas samples
with fewer vitrinite particles were termed ‘‘medium-qual-
ity’’. In each of these formations the interlayered, lami-
nated and marly layers are best suited. Locations close to
intrusions and volcanic dykes were avoided in order to
exclude local thermal overprinting of organic matter
maturity.
These considerations led to the selection of two areas for
fieldwork and sampling. The first area is the Gardena
Valley (ital. Val Gardena.) between St. Ullrich (Ortisei/
Urtijei) and Wolkenstein (Selva Gardena), approximately
25 km northeast of the city of Bozen. The second area of
interest is the Frotschbach area, approximately 3 km
southeast of the village of Seis (see ‘‘Appendix Table 4’’
for sample coordinates).
In the Gardena Valley, 43 samples were collected from
three sections. In all of them the stratigraphic units from
Bellerophon to Buchenstein are cropping out. Mainly the
Buchenstein Formation, and the Bulla Member of the
Upper Bellerophon Fm. were sampled.
Apart from these three sections the following additional
Buchenstein Fm. samples were collected: four from the
A. Grobe et al.

Seceda, one from the Wurzjoch and 12 from the eastern
continuation of the Gardena Valley, north of the city of
Colfosco.
In the Frotschbach area two sections were sampled; one
in the valley of the Frommerbach, where the complete
stratigraphic sequence from the Perez Fm. to the Wengen
Fm. is cropping out. Another section was sampled on the
slopes of the Frotschbach valley itself.
A total number of 153 samples was collected from
outcrop sections, whereby fresh and visibly unweathered
material was chosen. For characterization of elemental
composition 37 dark-colored samples were selected for
analysis of total organic and inorganic carbon (TOC, TIC).
From this group 23 were also analyzed for total sulfur
content (TS). For elemental analyses, 100 mg of each
pulverized sample was combusted using a liquiTOC II
analyzer to determine the total organic and inorganic car-
bon content. The instrument is using a temperature ramp
method, which enables a direct determination of TOC and
TIC without prior acidification of the samples (heating in
two steps: 300 �C/min to 550 �C and held for 600 s, than
raised to 1000 �C and held for 400 s). Under constant
oxygen supply the organic carbon (first step) and the
inorganic, carbonate carbon (second step) will generate
CO2, which is analyzed by a non-dispersed infrared
detector (NDIR: detection limit 10 ppm, rel. TOC error
0.6 %, TIC error 1.7 %).
Based on this data CaCO3 and CaMg(CO3)2 contents are
calculated for all samples as follows:
CaCO3 ¼ TIC � 8:333CaMgðCO3Þ2 ¼ TIC � 7:667
Sulfur (total sulfur, TS) was measured on a LECO S200.
After covering 100 mg of sample with Fluorhib and Fe-
cuttings, it is combusted under constant oxygen supply in a
high frequency induction furnace at 1000 �C. During this
procedure sulfur is oxidized to SO2. The generated gases
are flashed by the carrier gas oxygen through a water trap
to remove water vapor and then to a SO2-specific infrared
cell to measure the total sulfur content (detection limit
20 ppm, relative error\5 %).
Thermal maturity was characterized by vitrinite and
solid bitumen reflectance measurements. Samples selected
on the basis of their color and TOC content were prepared
for organic petrological analysis. Samples cut perpendic-
ular to bedding were impregnated with a mixture of
epoxy-resin (Scandiplex A) and a hardener (Scandiplex
B). During the exothermal hardening maximum tempera-
tures did not exceed 36 �C. Each block was polished on
one side with successively finer abrasives (320, 400,
600 mm; see Littke et al. 2012; Sachse et al. 2012 for
more details).
Reflectance measurements were performed on an inci-
dent light microscope Zeiss Axioplan with an oil immer-
sion lens of 50-times magnification under monochromatic
light with a wavelength of 546 nm. Oil with known
refractive index was used to avoid undesired diffusion
reflectance (Taylor et al. 1998). The microscope was cali-
brated with an yttrium–aluminum–garnet-standard (YAG)
with a constant reflectance of 0.889 %; this standard can be
used up to values of 1.3 % VRr. According to Senftle et al.
(1993) measurement of at least 30 vitrinite particles should
be made to obtain a representative mean value. Due to a
lack of vitrinites, this number was not reached for some of
the samples.
Vitrinite reflectance data can be used to characterize a
broad range of maturities, from early diagenesis (*0.2 %
VR) up to low grades of metamorphism (*[4.0 % VR) in
order to determine maximum burial depth (Sweeney and
Burnham 1990; Barker and Pawlewicz 1994). As a first
estimation, maximum temperatures of burial heating were
calculated based on the following formula by Barker and
Pawlewicz (1994):
Tpeak ¼ln VRrð Þ þ 1:68
0:0124
In many cases two maxima of vitrinite reflectance values
are observed. In such cases, the lower reflectance values
normally represent the autochthonous vitrinites since the
higher maximum usually represents resedimented, alloch-
thonous particles (Taylor et al. 1998). Solid bitumen
reflectance (BRr) can be measured if vitrinites are not
observed, e.g. in pre-Devonian rock or rocks containing
little terrestrial material. Measured values reflect thermal
maturity and can be converted into vitrinite reflectance by
the formula of Schoenherr et al. (2007):
VRr %ð Þ ¼ BRr þ 0:2443ð Þ1:0495
To obtain VRr vs. depth trends from field data without
expensive drilling campaigns pseudowells were created
according to the method of Noth et al. (2001). Therefore,
sediments of different formations were sampled at the
surface and measured for VRr and BRr. Results were
extrapolated into a VRr vs. pseudo-depth profile perpen-
dicular to bedding.
Based on their TOC values 9 samples were selected for
Rock–Eval analysis to characterize the quality of organic
matter. 100 mg of each pulverized sample was treated
according to Espitalie et al. (1985).
The temperature of the generated maximum S2 yield
(Tmax) was used as another maturity parameter. According
to Hunt (1995) ‘‘the hydrogen index (S2 normalized to
TOC) could be roughly correlated with the atomic H/C
ratio and the oxygen index with the atomic O/C ratio of the
Burial history and thermal maturity of Mesozoic rocks…
van Krevelen diagram’’. Thus, in a Hydrogen Index (HI)
versus Oxygen Index (OI) diagram kerogen quality can be
interpreted in a similar way as in the well-known van
Krevelen plot. Due to problems with a strong mineral-
matrix-effect in the case of low TOC values, only samples
with TOC contents in excess of 0.5 wt% were selected for
analyses (Saeed and Peters 1994).
To quantify maximum burial temperature and depth
integrated basin modeling was performed for the two study
areas with the PetroMod1D 2012.1 software package,
developed by the Schlumberger Technology Center
Aachen, Germany. The software uses a forward modeling,
event-stepping approach. In this way, the simulation starts
with the deposition of the oldest sediment layer and con-
tinues with decreasing geological age of the strata, event by
event, until the present-day geometry of the sediment-fill is
reached.
As a first step, a generalized present-day stratigraphic
column of the studied sections needs to be defined,
including lithologies, petrophysical data, depositional ages
and thicknesses of all units. This so called conceptional
model is based on a chronology of events, i.e. sedimenta-
tion, erosion, hiatus (non-deposition) and tectonic events
(e.g., salt movement/doming, volcanism, thrusting).
Thermal boundary conditions are needed to define the
overall thermal regime of the sedimentary basin over time.
The two main input parameters are the basal heat flow [HF
(mW/m2), lower thermal boundary] and the paleo water
depth [PWD (m), upper boundary]. The PWD is used to
calculate the sediment water interface temperature [SWIT
(�C)] (Hantschel and Kauerauf 2009). Furthermore, inter-
nal radiogenic heat production is calculated based on sed-
imentary lithologies depending on their average abundance
of uranium, thorium and potassium.
For each buried layer the software calculates vitrinite
reflectance according to the EASY %R0 method of Swee-
ney and Burnham (1990). This calculated VR value is
compared with the measured VR value and the model is
adjusted until a best fit of the VR vs. depth trend is
achieved.
4 Results and discussion
4.1 Elemental analysis
Results of the elemental analyses are listed in Table 1 and
plotted in Fig. 3. The samples show a wide range of TOC,
even within a single formation (Fig. 3a). TOC values range
from a shaly limestone with 2.3 % (13/696) to a red shale
with 0.01 % (13/639). Most samples vary between 0.3 and
1.8 % TOC and a weak correlation of TOC and lithology is
observed. Limestones with interbedded shales (shaly
limestone) range between 1.1 (13/653) and 2.3 % TOC (13/
696), whereas purer limestones are characterized by lower
TOC values between 0.3 (13/660) and 0.8 % (13/677).
Calculated carbonate contents vary between 6.3 (13/
699) and 115.7 % (13/745, based on calculation of calcite
content). Data exceeding 100 % are explained by a sig-
nificant contribution of dolomite rather than calcite
(Table 1).
Measurement of total sulfur content (TS) allows to
characterize the depositional environment (Fig. 3b, Berner
1984; Luckge et al. 1999, 2002). Values for total sulfur
contents vary between nearly 0 and 0.95 wt%.
Figure 3b shows that most samples plot below the nor-
mal marine trend (Berner 1984). Two samples (13/666,
13/684) show much higher TS/TOC ratios. This can be
explained by the influence of oxygen-free bottom waters
and/or the occurrence of late diagenetic pyrite (FeS2). The
occurrence of pyrite was documented for all samples by
microscopic examination. Low sulfur contents, e.g. within
the Wengen or Perez Fm., may indicate the influence of
weathering (Littke et al. 1991), which is not the case here,
as the pyrite is fresh.
4.2 Organic petrology
Vitrinites are organic particles derived from woody tissues
of higher land plants, mainly originating from lignin and
cellulose of plant cell walls (Taylor et al. 1998). During
burial and coalification chemical and physical changes take
place, which are temperature dependent and irreversible.
Especially, with increasing thermal maturation vitrinite
becomes more aromatized (Schenk et al. 1990) and as a
consequence its ability to reflect light increases. Therefore,
vitrinite reflectance can be used to determine the thermal
maturity of the organic matter in sedimentary rocks. In
most cases vitrinite reflectance increases exponentially
with a linear increase of temperature (amongst others: Ting
1973; Saxby et al. 1986). Due to the fact that coalification
is irreversible, the maximum temperature a rock has
experienced is archived in the reflectance of vitrinites in
sedimentary rocks.
For 46 samples reflectance was measured: 42 of them
contain vitrinites and four solid bitumen (‘‘Appendix
Table 4’’). In four samples neither vitrinites nor solid
bitumen has been detected (13/643, 13/688, 13/710 and
13/711). New obtained data (this study) were compared to
literature data from other parts of the Dolomites (Buggisch
1978; Schulz and Fuchs 1991; Bielefeld 1998; Tscherny
2006; Emmerich et al. 2008; Blendinger et al. 2013). Thus,
a total number of 75 samples with vitrinite reflectance
values is available (‘‘Appendix Table 4’’). They range from
immature (e.g. from 0.37 % VRr to 0.60 % VRr) to post-
mature (up to 1.75 % VRr, 13/681) stages (classification
A. Grobe et al.

according to Peters et al. 2005). Most data represent sam-
ples from within the oil window, below or at peak oil
generation (41 samples, 0.60–0.90 % VRr). Only six
samples are characterized as immature and 24 samples are
interpreted as late mature (0.90–1.35 VRr). The latter ones
are interpreted as overprinted by Ladinian volcanic intru-
sions and are marked (v) in the table of the Appendix. Also,
samples are marked (std) for which the variation of mea-
sured values, i.e. the standard deviation, is very high,
resulting in less reliable information as compared to the
remaining samples.
The whole area of the Gardena Valley/Val Gardena shows
mature vitrinites (0.61–0.75 % VRr) at all sampled locations
with a more or less normally increasing depth trend (VR vs.
depth trend established by a plot of measured VR versus the
stratigraphic position of each sample). The study area around
the Frotsch- and Frommerbach indicates the same trend with
mature to late mature samples (0.50–0.92 % VRr). Similar
results are observed in the Colfosco area with mature to late
mature range (0.73–0.96 % VRr).
The VR data of the Buchenstein Fm. indicate slightly
increasingvalues fromeast towest and also fromnorth to south.
Table 1 CaCO3 and
CaMg(CO3)2 calculated from
TIC
Sample no. Formation TOC (wt%) TIC (wt%) CaCO3 (%) CaMg(CO3)2 (%) TS (%)
13/666 Wengen 0.39 2.33 19.4 17.9 0.57
13/761 Wengen 1.21 1.43 11.9 11.0 –
13/762 Wengen 1.20 2.21 18.4 17.0 –
13/705 Buchenstein 0.19 6.70 55.8 51.4 0.13
13/699 Buchenstein 1.36 0.76 6.3 5.8 0.48
13/698 Buchenstein 1.74 1.40 11.7 10.7 0.85
13/696 Buchenstein 2.28 2.51 20.9 19.2 0.95
13/687 Buchenstein 0.18 2.77 23.1 21.2 0.04
13/680 Buchenstein 0.09 2.62 21.8 20.1 0.01
13/679 Buchenstein 0.30 2.49 20.7 19.1 0.03
13/678 Buchenstein 0.18 3.22 26.8 24.7 0.03
13/677 Buchenstein 0.75 5.35 44.6 41.0 0.05
13/664 Buchenstein 0.09 2.89 24.1 22.2 0.03
13/662 Buchenstein 0.12 6.15 51.2 47.1 0.03
13/660 Buchenstein 0.32 3.03 25.2 23.2 0.06
13/653 Buchenstein 1.12 3.23 26.9 24.8 0.03
13/651 Buchenstein 1.72 5.23 43.6 40.1 0.12
13/650 Buchenstein 0.15 11.42 95.2 87.6 0.01
13/751 Buchenstein 0.18 6.86 57.1 52.6 –
13/753 Buchenstein 0.10 8.76 73.0 67.2 –
13/754 Buchenstein 0.07 9.01 75.1 69.1 –
13/683 Contrin 0.09 13.55 112.9 103.9 \0.01
13/684 Morbiac 0.19 7.15 59.6 54.8 0.59
13/746 Morbiac 0.09 13.62 113.5 104.4 –
13/747 Morbiac 0.09 13.37 111.4 102.5 –
13/748 Morbiac 0.02 13.74 114.5 105.4 –
13/749 Morbiac 0.16 11.67 97.3 89.5 –
13/750 Morbiac 0.06 13.88 115.6 106.4 –
13/639 Perez 0.01 5.17 43.1 39.6 0.01
13/744 Bellerophon 0.86 13.51 112.6 103.6 –
13/745 Bellerophon 1.22 13.88 115.7 106.4 –
13/755 Bellerophon 0.03 13.01 108.4 99.8 –
13/756 Bellerophon 0.12 11.08 92.3 85.0 –
13/656 Bellerophon 1.74 5.91 49.2 45.3 0.1
13/655 Bellerophon 0.68 11.27 93.9 86.4 0.17
13/635 Bellerophon 1.40 10.37 86.4 79.5 0.08
13/634 Bellerophon 0.01 10.41 86.7 79.8 0.02
Burial history and thermal maturity of Mesozoic rocks…

Fig. 3 Plots of analysis data:
a TOC values of studied
formations, b TS vs. TOC.
Black line represents normal
marine conditions (after Berner
1984), and c TOC vs. CaCO3
contents
A. Grobe et al.

4.3 Rock–Eval pyrolysis
Based on their TOC values, 9 samples were selected for
Rock–Eval pyrolysis. Table 2 shows the results. According
to Hunt (1995), ‘‘The most important factor controlling the
generation of oil and gas is the hydrogen content of the
organic matter (OM)’’. Here, Hydrogen Index values vary
between 62 and 428 mg HC/g TOC. Oxygen Index values
range between 38 and 131 mg CO2/g TOC. To illustrate the
results HI and OI are plotted in the pseudo-van Krevelen
diagram in Fig. 4. Samples 13/651, 13/696, 13/698 and
13/699 of the Buchenstein Fm. can be characterized as
containing Type II kerogen. Their low PI values indicate
either that these source rocks have expelled petroleum, or
alternatively, they may result from weathering (Littke et al.
1991). The high S2 peaks show that burial temperature never
reached the peak oil generating stage (Rullkotter et al. 1988).
All other samples can be characterized as bearing Type
III kerogen, indicating a terrigenous origin of the organic
matter. It should be noted that due to the analyses of whole
rock samples, instead of pure kerogen samples, the OI
values might be overestimated and the HI underestimated
(Peters 1986).
Tmax values range from 425 to 451 �C and basically
agree with maturity information based on vitrinite reflec-
tance data. Nevertheless, minor discrepancies are observed,
e.g. samples 13/696 and 13/699 show low Tmax values,
although vitrinite reflectance values are at 0.7 %.
4.4 Thermal history modeling
The stratigraphy used as input for the simulation is shown
in Table 3. It was compiled from Bosellini (1998), Bosel-
lini et al. (2003) and Keim et al. (2001). The model
includes 21 layers ranging in age from the Bozen Quartz
Porphyry of the Athesian Volcanic Group to Quaternary
sediments. Thicknesses were modified after Tscherny
(2006) and the absolute ages are from Ogg et al. (2014)
supplemented by data of Mundil et al. (1996, 2010). The
relevant lithologies (Table 3) have been built with the
PetroMod Lithology Editor and are based on field obser-
vations as well as descriptions of Bosellini (1998). For
Table 2 Rock–Eval pyrolysis and TOC data
Sample
no.
Formation TOC
(wt%)
S1
(mg/g rock)
S2
(mg/g rock)
S3
(mg/g rock)
Tmax
(�C)HI
(mg HC/gTOC)
OI
(mg CO2/gTOC)
PI (–) Notes
13/635 Bellerophon 1.40 0.13 0.92 1.41 446 66 101 0.12 S2 peak wide
13/651 Buchenstein 1.72 0.52 5.25 0.73 442 305 43 0.09
13/653 Buchenstein 1.12 0.23 1.23 0.97 442 110 87 0.16
13/655 Bellerophon 0.68 0.27 0.77 0.89 451 114 131 0.26
13/656 Bellerophon 1.74 0.15 1.07 2.18 451 62 126 0.12 S2 peak wide
13/677 Buchenstein 0.75 0.13 1.01 0.88 444 134 117 0.12
13/696 Buchenstein 2.30 0.35 8.06 1.10 425 350 48 0.04
13/698 Buchenstein 1.74 0.30 7.46 0.66 430 428 38 0.04
13/699 Buchenstein 1.36 0.24 4.25 0.84 428 312 62 0.05
Fig. 4 HI vs. OI plot of the Rock–Eval VI data (Buchenstein Fm.
blue x, Bellerophon red x). The lines represent medians of the
kerogens types I–III and are based on Espitalie et al. (1985)
Burial history and thermal maturity of Mesozoic rocks…

Table
3Stratigraphyusedas
fixed
inputforthesimulation
Form
ation
Present
thickness(m
)
Eroded
thickness(m
)
Startofdeposition
(Ma)
Endofdeposition
(Ma)
Startoferosion
(Ma)
Endoferosion
(Ma)
Lithology
Quaternary
10
0.20
0.00
Marl?
Shale?
Silt?
SS
Monte-Parei_Fm.
050
35.00
33.00
33.00
20.00
Sandstone?
Conglomerate
Belluno-Flysch
065.00
49.00
Sandstone_silty
Cretaceous_Hiatus
0?
120.00
65.00
43.00
40.20
Sandstone?
Silt
Antruilles_Fm.
050
110.00
120.00
40.20
40.00
Sandstone(silty_organic)
Puez_Marls
0150
145.00
110.00
40.00
39.00
Marl
Ammonitico_Rosso
020
165.00
155.00
155.00
154.00
Lim
estone_shaly
Calcari_Grigi_Group
0500
201.00
165.00
154.00
151.00
Lim
estone_shaly
Dolomia_Principale
0500
222.00
201.00
151.00
148.00
Dolomite(typical)
RaiblerGroup
050
225.00
222.00
148.00
147.50
Marl
S_Cassiano/Cassian
Dolomite
0300
228.00
225.00
142.00
145.00
Marl
Wengen_Fm._incl_volcanics
400
238.00
228.00
Sandstone_shaly
Buchenstein/Schlern/
Sciliar_Fm.
60
241.20
238.00
Lim
estone_shaly
Contrin/M
oena_Fm.
140
241.90
241.20
Dolomite?
SS?
Silt
Morbiac_Fm.
20
242.50
241.90
Marl?
Shale?
Silt?
SS
Perez_Fm.
30
242.80
242.50
Sandstone?
Conglomerate
Werfen_Fm.
180
220
252.00
244.00
244.00
242.80
Marl?
Shale?
Silt?
SS
Bellerophon_Fm.
200
255.00
252.00
Lim
estone?
Evap
?Gypsum
?Shale
Val-G
ardena-Sandstone_Fm.
200
267.00
255.00
Sandstone(silty_org)
AthesianVolcanic
Group
1000
350.00
290.00
Rhyolite_(tuff_frag)
Additionally,thepresentday
andtheeroded
thicknessesofeach
form
ationarelisted,as
wellas
depositionanderosionages
andlithologies.AnestimationofthethicknessoftheCretaceous
erosionwillbepartofthiswork;hence,itis
marked
withaquestionmark(?)
A. Grobe et al.

periods of uplift fixed thickness values for eroded strata are
used with the exception of the Cretaceous/Tertiary erosion.
The thickness of sediments eroded during Cretaceous/Early
Tertiary was derived from modeling results. Short-term
erosion events occurred during the Early Triassic and the
Miocene. It should be noted that the timing of erosion of
Triassic to Cretaceous formations is largely unknown and
arbitrary values are shown in Table 3. Our model reveals
the total eroded thickness only as it is based on one single
erosional event.
For the conceptional model six different phases were
initially defined: (1) Sedimentation from 267 to 244 Ma
(Val Gardena SS to Werfen Fm.), (2) erosion of parts of the
Werfen Fm. 244–242.8 Ma, (3) sedimentation from 242.8
to 155 Ma (Perez Fm. to Rosso Ammonitico Fm.), (4)
erosion from 155 to 145 Ma (S. Cassiano Fm. to Ammo-
nitico Rosso. completely eroded), (5) sedimentation of
Puez Marls, Antruilles Fm. and Upper Cretaceous
(145–65 Ma), and (6) uplift, Alpine Orogenesis and ero-
sion from 65 Ma until present with contemporaneous
sedimentation of thin Cenozoic sediments in parts of the
area.
With respect to the thermal evolution of the basin a
general heat flow of 65 mW/m2 was chosen as the base of
the model, representing an average global heat flow value.
Moreover, the following four thermal periods were defined
(Fig. 5): (1) Rifting of the continental crust with Ladinian
tectono-magmatic event in the early Middle Triassic (max
heat flow: 65 mW/m2), (2) opening of the Ligurian-
Piemontese ocean and generation of oceanic crust in
Middle and Upper Jurassic (max heat flow: 75 mW/m2),
(3) consolidation phase with crustal thickening starting in
Upper Jurassic (cooling), (4) since Eocene, crustal thick-
ening due to Meso- and Neoalpine orogenesis.
Based on this scenario the heat flow (HF) vs. time trend
shown in Fig. 5 was generated. Fission track data inter-
pretation of Tscherny (2006) was used to link time and
temperature data (max. temperatures 100–110 �C in the
Cretaceous, rapid cooling in the Eocene). Values for the
period of Ladinian volcanism are relatively low since all
samples were taken in areas without volcanic influence.
The paleo water depth curve (PWD) shows an assumed
fluvial to shallow marine evolution from the beginning of
the Middle Triassic to the Cretaceous. Sediment water
interface temperature was influenced by palaeolatitude as
well as water depth during deposition. Deeper water with
cooler temperatures characterizes sedimentation of the
Buchenstein and Wengen Formation. The minimum tem-
perature in the Middle Triassic is due to the rapid drowning
of the carbonate platforms from tropical surface tempera-
tures to cold deep sea water (Bosellini et al. 2003). The
thermal evolution of the basin fill is strongly controlled by
rock properties such as thermal conductivity, heat capacity
and radiogenic heat production. VR depth trends for all 1D-
pseudowells were generated to study temperature history.
Since the simulations of all pseudo-wells show similar
trends, only the Gardena Valley model is described and
discussed here in detail. Results of the sensitivity analyses
Fig. 5 Paleo water depth
(PWD), sediment water
interface temperature (SWIT)
and heat flow (HF) over time. In
the heatflow curve, the rifting of
the continental crust (1) and the
opening of the Ligurian-
Piemontese Ocean (2) are
highlighted
Burial history and thermal maturity of Mesozoic rocks…
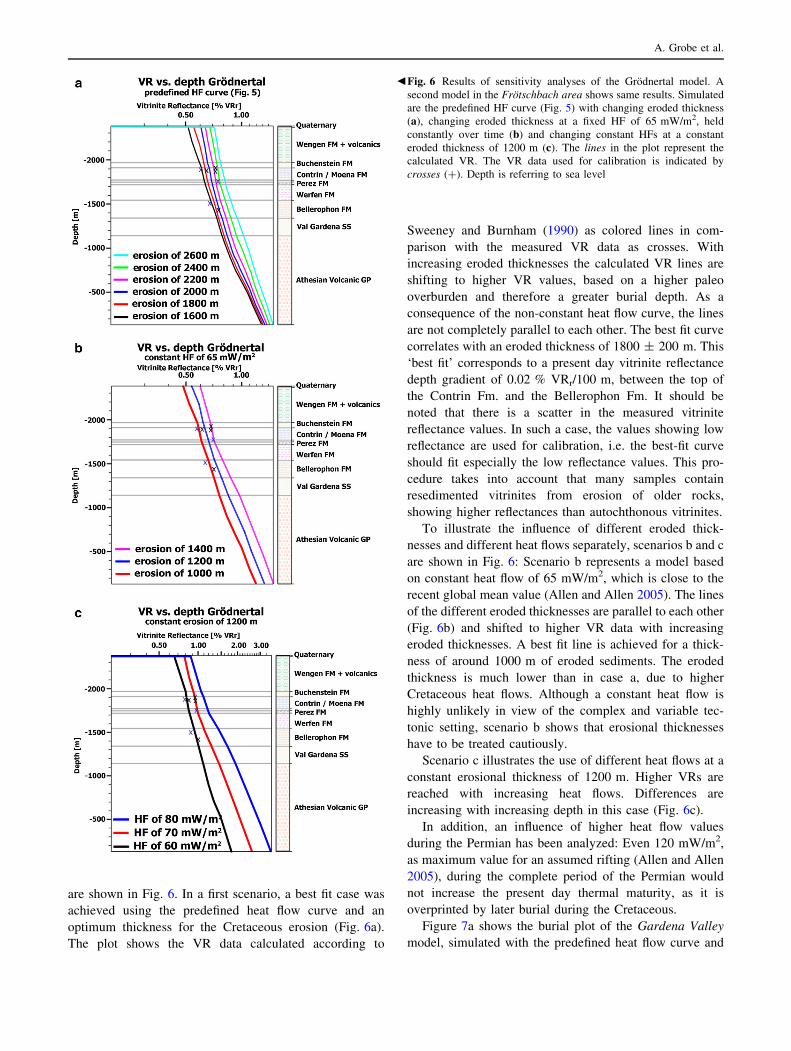
are shown in Fig. 6. In a first scenario, a best fit case was
achieved using the predefined heat flow curve and an
optimum thickness for the Cretaceous erosion (Fig. 6a).
The plot shows the VR data calculated according to
Sweeney and Burnham (1990) as colored lines in com-
parison with the measured VR data as crosses. With
increasing eroded thicknesses the calculated VR lines are
shifting to higher VR values, based on a higher paleo
overburden and therefore a greater burial depth. As a
consequence of the non-constant heat flow curve, the lines
are not completely parallel to each other. The best fit curve
correlates with an eroded thickness of 1800 ± 200 m. This
‘best fit’ corresponds to a present day vitrinite reflectance
depth gradient of 0.02 % VRr/100 m, between the top of
the Contrin Fm. and the Bellerophon Fm. It should be
noted that there is a scatter in the measured vitrinite
reflectance values. In such a case, the values showing low
reflectance are used for calibration, i.e. the best-fit curve
should fit especially the low reflectance values. This pro-
cedure takes into account that many samples contain
resedimented vitrinites from erosion of older rocks,
showing higher reflectances than autochthonous vitrinites.
To illustrate the influence of different eroded thick-
nesses and different heat flows separately, scenarios b and c
are shown in Fig. 6: Scenario b represents a model based
on constant heat flow of 65 mW/m2, which is close to the
recent global mean value (Allen and Allen 2005). The lines
of the different eroded thicknesses are parallel to each other
(Fig. 6b) and shifted to higher VR data with increasing
eroded thicknesses. A best fit line is achieved for a thick-
ness of around 1000 m of eroded sediments. The eroded
thickness is much lower than in case a, due to higher
Cretaceous heat flows. Although a constant heat flow is
highly unlikely in view of the complex and variable tec-
tonic setting, scenario b shows that erosional thicknesses
have to be treated cautiously.
Scenario c illustrates the use of different heat flows at a
constant erosional thickness of 1200 m. Higher VRs are
reached with increasing heat flows. Differences are
increasing with increasing depth in this case (Fig. 6c).
In addition, an influence of higher heat flow values
during the Permian has been analyzed: Even 120 mW/m2,
as maximum value for an assumed rifting (Allen and Allen
2005), during the complete period of the Permian would
not increase the present day thermal maturity, as it is
overprinted by later burial during the Cretaceous.
Figure 7a shows the burial plot of the Gardena Valley
model, simulated with the predefined heat flow curve and
bFig. 6 Results of sensitivity analyses of the Grodnertal model. A
second model in the Frotschbach area shows same results. Simulated
are the predefined HF curve (Fig. 5) with changing eroded thickness
(a), changing eroded thickness at a fixed HF of 65 mW/m2, held
constantly over time (b) and changing constant HFs at a constant
eroded thickness of 1200 m (c). The lines in the plot represent the
calculated VR. The VR data used for calibration is indicated by
crosses (?). Depth is referring to sea level
A. Grobe et al.

an eroded thickness of 1800 m for the Cretaceous sedi-
ments. The thermal history of the sediments is displayed in
this diagram as overlay. Conspicious events shown are the
rapid drowning of the basin in the Middle Triassic with a
subsequent basin shallowing at constant sedimentation (1)
and two phases of major basin inversion (2, 3) aside from
the Neogene inversion and uplift. Temperatures reach
158 �C at around 160 Ma before present, with the initiated
opening of the Ligurian-Piedmontese ocean, leading to VR
values of 1.28 % (2). In addition, the layers were thermally
overprinted again 65 Ma before present at the point of
deepest burial (160 �C, 1.32 % VRr) triggered by the
sedimentation of the Cretaceous layers.
The vitrinite reflectance vs. time trend (Fig. 7b) shows
a clear correlation with the burial trend (Fig. 7a). As
temperatures are increasing during times of burial, vit-
rinte reflectance increases. Due to the fact that the
coalification process of vitrinites is irreversable their
reflectance is not changing during times of uplift and a
second phase of coalification will only be initiated by a
second phase of burial provided that previous tempera-
tures are reached or exceeded.
Previous simulations did not include internal radiogenic
heat production within sedimentary rocks (e.g. Tscherny
2006). This aspect needs to be kept in mind for a com-
parison with the new data set of this study. For the Gar-
dena Valley model one simulation was also performed
without considering the influence of internal heat pro-
duction. VR vs. depth trend is shifted to lower VR values,
if the internal heat production is neglected. Thus,
assumption of more overburden is needed to fit the cal-
culated data with the calibration points of the field data.
As a result, the Cretaceous erosion in the Gardena Valley
model increases by additional 250–300 m or around 12 %
of the total eroded thickness, if the radiogenic heat pro-
duction is ignored.
Fig. 7 Burial plot with
temperature history of the
Gardena Valley model (a) andthe vitrinite reflectance
evolution of Bellerophon and
Buchenstein Fm. Simulated
with the predefined HF curve
and the best fitting eroded
thickness of 1800 m (see
Fig. 6a)
Burial history and thermal maturity of Mesozoic rocks…

4.5 Maturity
The model was calibrated by maturity data measured on
samples collected from outcrops. Calibration was per-
formed using VR data (‘‘Appendix’’), which were con-
firmed by Tmax-values from Rock–Eval analysis. Due to the
strong volcanic activities during Ladinian times in the area
of the western Dolomites there is some scatter in the data
observed (Fig. 6). Nevertheless, the results match largely
with published data. As described by Tscherny et al.
(2011), VR data for the Middle and Upper Triassic mea-
sured in the northern Gardertal near Badia by Balzas and
Koncz (1999) range between 0.67–1.03 % and VRs mea-
sured by Zattin et al. (2003) range between 0.6 and 1.0 %.
Tscherny et al. (2011) added own data in the range of
0.6–0.9 % VR. The results of the present study for the
Buchenstein Fm. (0.61–0.76 % VRr) agree more with the
results of Tscherny (2006) (Buchenstein: 0.63–0.75 %
VRr) as compared to those by Zattin et al. (2003), who
measured a value of 0.6 % VRr for the Moena Fm. (see
Fig. 2).
Reflectance data and sample locations were compared to
those of Tscherny (2006). For the samples of the Buchen-
stein Fm. no regional trend of increasing maturity is
observed (Fig. 8). Moreover, the comparison shows that
the Buchenstein data of Tscherny (2006) do not indicate an
increase in VR as suggested for other formations from
north to south. Slightly increased or decreased VR values
could also be explained by changes of sediment thicknesses
deposited and by local differences with respect to the
influence of tectonic events. For the Bellerophon Fm. it
seems that a weak increase of VR occurs from west to east.
This was suggested by Tscherny (2006) as well, based on
his and additional literature data. Furthermore, Emmerich
et al. (2008) analyzed sandstones of the Groden Fm. at the
Rosengarten, around 20 km south of the Frotschbach area,
and classified VRs higher than 0.9 % VRr as ‘‘not used:
proximity to a volcanic dyke’’. This threshold was con-
firmed in the present study.
As shown before, maturity levels based on vitrinite
reflectance data are basically in good agreement with Tmax
values from Rock–Eval analysis. They vary between 425
and 451 �C. Tscherny (2006) reported Tmax ranging from
420 to 465 �C. In addition, the samples of Tscherny (2006)
represent, like the ones measured here, type II and type III
kerogen.
4.6 Burial and temperature history
Summarizing the results from both regional models, an
eroded thickness of 1800 ± 200 m of Cretaceous sedi-
ments was documented for the northwestern area of the
Fig. 8 Regional distribution of
VR values of the Buchenstein
Formation. G is referring to this
study and T to Tscherny (2006).
Values in parentheses are
regarded as ‘too high’, possibly
influenced by local volcanism or
measured resedimented
vitrinites
A. Grobe et al.

Dolomites combined with a present day maturity gradient
of 0.02 % VRr/100 m. This erosion was initiated by the
Alpine Orogenesis starting around 65 Ma and lasting until
present day with most rapid uplift at Early Eocene and Late
Miocene times. This eroded thickness adds to the eroded
thickness of older layers. In the model, it is expected that
the eroded Triassic and Jurassic layers were removed
during the Late Jurassic (Table 3; Fig. 7a). For our Val
Gardena model, we assumed an eroded thickness of pre-
Cretaceous units of 500 m, which may be regarded as a
maximum scenario. Even if this maximum scenario
maturity (vitrinite reflectance) is overprinted by the much
larger Tertiary erosional phase. This underlines that even
the maximum possible case of Jurassic erosion is not
influencing present-day maturity.
Tscherny et al. (2011) published similar results of
1700–2400 m for the Cretaceous erosion with a vitrinite
reflectance depth gradient of 0.01–0.02 % VRr per 100 m.
These results were developed on the basis of relatively
low heat flows: A peak of 55 mW/m2 was assigned for
the rifting at Jurassic times (160 Ma) and a present day
value of 30 mW/m2. In contrast, this work used 75 mW/
m2 for the Jurassic rifting event and 41 mW/m2 for the
present day value. Based on sensitivity analyses with
constant erosion, this slightly higher HF value seems to
be more realistic. Heat flows at maximum burial, during
the latest Cretaceous, show similar differences with
35 mW/m2 in Tscherny et al. (2011) and 46 mW/m2 in
this work. It should be noted, that there are varying values
published for the Jurassic heat flows as some authors even
state very high values of up to 100 mW/m2 (e.g. Zattin
et al. 2003).
Former investigations by Tscherny (2006, without
radiogenic heat production and with a present day HF of
41 mW/m2) result in maximum eroded thicknesses for the
Upper Cretaceous of 2000 m (original value of 2300 m
prior to correction of internal heat production) and a
maturity trend of 0.02–0.03 % VRr/100 m. Carminati et al.
(2010) deduced an erosional thickness of 2200 m for
Cretaceous to Paleocene strata, applying relatively high
heat flows of 85–105 mW/m2 during Middle Jurassic
times. Thus, their results confirm the estimates of paleo
thicknesses presented here. The values of the recent HF are
the same in this and in Tscherny (2011, 41 mW/m2).
Ladinian volcanism did not influence maturity of the
deepest Triassic and Permian layers or had only local
influence (Tscherny 2006).
At this point it should be mentioned that a general
increase of maturity could have been influenced by the
assumption of overthrusting and later erosion of this
tectonical load as well. Doglioni (1985) documented that
there are minor overthrusts of Miocene age in the Dolo-
mites. Orogenic loading may have resulted in burial of
underlying sedimentary rocks, temperature increase and
maturation similar to burial by additional sediments.
5 Conclusions
New vitrinite reflectance data supplemented by solid
bitumen reflectance and Rock–Eval data provide impor-
tant information on thermal maturity of the northwestern
Dolomites. Almost all rocks are within the ‘oil window’,
but have not passed the peak oil generation stage (0.9 %
VRr). Exceptions are local areas influenced by
volcanism.
The vitrinite reflectance data was used to calibrate
temperature and burial history using PetroMod software.
Based on these numerical models an eroded thickness of
1800 ± 200 m appears likely for the Cretaceous layers of
the study area. The maturity of the Buchenstein Fm.
ranges from 0.61 to 0.76 % VRr. This requires a sub-
stantial burial and a thicker cover as present today. Times
of deepest burial and maximum temperatures presumably
correspond to Late Cretaceous/Early Paleocene times. The
present day maturity gradient (0.02 % VRr/100 m) indi-
cates quite a low paleo heat flow situation. After basin
inversion was initiated around 65 Ma, the original over-
burden was eroded during a process of basin uplift. This
process mainly took place during the Alpine Orogenesis
in Eocene and Miocene times. Burial histories indicate
that the influence of deepest burial at around 65 Ma with
respect to maturity of Permian and Early Triassic strata
overwhelmed earlier temperature events such as high heat
flows during the Ladinian.
Nevertheless, it cannot be excluded that the increase of
maturity was initiated by overthrusting and later erosion of
the overthrusted layer as orogenic loading may have caused
the same signal of deepest burial as loading by additional
sediments.
Acknowledgments Marco van Veen helped during the sampling
campaign in 2013 and Donka Macherey produced high quality pol-
ished blocks for vitrinite and solid bitumen reflectance analysis. The
text benefited considerably from the great review comments of P.
Gianolla and W. Leu.
Appendix
See Table 4.
Burial history and thermal maturity of Mesozoic rocks…

Table 4 Vitrinite reflectance data
Sample no. Location UTM coordinates
(32T. x/y)
Formation VRr (%) St. dev. Counts References Tpeak
(�C)
13/634 Pufels 701471 5160791 Bellerophon 0.70* – 62 Samples 106.7
13/635 Pufels 701471 5160791 Bellerophon 0.67* – 66 Samples 103.2
13/639 Pufels 701430 5160576 Perez 0.75* – 100 Samples 112.3
13/640 Pufels 701385 5160522 Contrin 1.70V. std 0.435 21 Samples 178.3
13/643 Pufels 701401 5160485 Buchenstein No VR – – Samples –
13/648 Pufels 701401 5160485 Moena 0.61 0.103 22 Samples 96.0
13/650 St. Christina 705865 5159593 Buchenstein 0.73* – 100 Samples 110.1
13/651 St. Christina 705913 5159577 Buchenstein 0.65 0.109 72 Samples 101.2
13/652 St. Christina 705988 5159684 Buchenstein 1.22V. std 0.348 23 Samples 151.5
13/653 St. Christina 706009 5159601 Buchenstein 0.73 0.095 23 Samples 110.2
13/655 St. Christina 705439 5159962 Bellerophon 0.76 0.086 100 Samples 113.1
13/656 St. Christina 705439 5159962 Bellerophon 0.75 0.097 103 Samples 111.9
13/660 Daunei 710463 5160167 Buchenstein 0.72 0.123 32 Samples 108.8
13/662 Daunei 710328 5160154 Buchenstein 1.21V. std 0.162 30 Samples 150.9
13/664 Daunei 710347 5160120 Buchenstein 1.03 V 0.119 25 Samples 137.9
13/666 Daunei 710800 5160091 Wengen 1.29V. std 0.190 101 Samples 156.0
13/677 Frommerbach 699311 5157053 Buchenstein 0.76 0.127 100 Samples 113.4
13/678 Frommerbach 699283 5157105 Buchenstein 0.71 0.056 3 Samples 108.3
13/679 Frommerbach 699283 5157105 Buchenstein 0.90 0.059 9 Samples 127.0
13/680 Frommerbach 699259 5157116 Buchenstein 1.26V. std 0.187 83 Samples 154.1
13/681 Frommerbach 699259 5157116 Buchenstein 1.75V. std 0.227 18 Samples 180.6
13/683 Frommerbach 699062 5156982 Contrin 0.92 0.067 7 Samples 128.7
13/684 Frommerbach 699010 5157006 Morbiac 0.79 0.147 37 Samples 116.9
13/686 Frotschbach 698515 5155588 Buchenstein 0.61 0.075 100 Samples 96.0
13/687 Frotschbach 698515 5155588 Buchenstein 0.98V. std 0.151 24 Samples 133.9
13/688 Frotschbach 698515 5155588 Buchenstein No VR – – Samples –
13/694 Frotschbach 698691 5155631 Buchenstein 1.49V. std 0.150 31 Samples 167.6
13/696 Frotschbach 698581 5155639 Buchenstein 0.73 0.140 101 Samples 109.9
13/698 Frotschbach 698581 5155639 Buchenstein 0.50 0.078 66 Samples 79.1
13/699 Frotschbach 698581 5155639 Buchenstein 0.74std 0.178 72 Samples 111.2
13/705 Frotschbach 698581 5155639 Buchenstein 1.07V. std 0.160 6 Samples 140.9
13/709 Frotschbach 698581 5155639 Werfen 1.29V 0.112 6 Samples 156.0
13/710 Frotschbach 698581 5155639 Werfen No VR – – Samples –
13/711 Nova Levante 698581 5155639 Val Gardena No VR – – Samples –
13/744 Colfosco 718126 5159610 Bellerophon 0.84 0.038 88 Samples 121.3
13/745 Colfosco 718133 5159607 Bellerophon 0.94V 0.077 96 Samples 130.5
13/755 Colfosco 718393 5159798 Bellerophon 0.94V 0.083 86 Samples 130.5
13/756 Colfosco 718389 5159792 Bellerophon 0.96V 0.066 68 Samples 132.2
13/746 Colfosco 718123 5159614 Morbiac 0.73 0.066 96 Samples 110.0
13/747 Colfosco 718123 5159617 Morbiac 0.77 0.063 39 Samples 114.4
13/749 Colfosco 718196 5159729 Morbiac 0.82 0.083 99 Samples 119.5
13/751 Colfosco 717392 5159620 Buchenstein 0.76 0.086 68 Samples 113.1
05/815 Seceda 707571 5161923 Werfen 0.46 0.086 25 Samples 73.2
05/816 Seceda 708750 5162436 Buchenstein 0.65 0.120 16 Samples 100.6
05/817 Seceda 707464 5161990 Bellerophon 1.01 0.138 20 Samples 136.1
05/820 Seceda 708363 5163103 Buchenstein 0.65std 0.179 25 Samples 100.7
05/930 Geislerspitze/Col Raiser 710077 5160513 Buchenstein 0.66 0.130 22 Samples 101.6
A. Grobe et al.

Table 4 continued
Sample
no.
Location UTM coordinates
(32T. x/y)
Formation VRr (%) St. dev. Counts References Tpeak
(�C)
05/931 Geislerspitze/Col
Raiser
710502 5159700 Buchenstein 0.72 0.094 20 Samples 109.2
05/932 Geislerspitze/Col
Raiser
709029 5161883 Morbiac 0.75 0.107 27 Samples 112.1
Kron3 Wurzjoch 715390 5172787 Val Gardena 0.79 0.060 25 Samples 116.5
Kron25 Wurzjoch 715593 5171339 Buchenstein 0.63 0.050 46 Samples 98.2
Kron8 Wurzjoch 715755 5171512 Morbiac 0.77 0.060 25 Samples 114.4
P6 San Lucano See
reference
See
reference
Contrin 0.81 0.070 55 Blendinger et al. (2013) 118.5
P8 San Lucano See
reference
See
reference
Contrin 0.82 0.080 50 Blendinger et al. (2013) 119.5
P9 San Lucano See
reference
See
reference
Contrin 0.71 0.110 50 Blendinger et al. (2013) 107.9
P600 Pala di San Martino See
reference
See
reference
Contrin 0.49 0.044 25 Blendinger et al. (2013) 78.0
P603A Pala di San Martino See
reference
See
reference
Contrin 0.76 0.073 72 Blendinger et al. (2013) 113.4
P603B Pala di San Martino See
reference
See
reference
Contrin 0.73 0.141 67 Blendinger et al. (2013) 110.1
P603C Pala di San Martino See
reference
See
reference
Contrin 0.64 0.123 59 Blendinger et al. (2013) 99.5
P603D Pala di San Martino See
reference
See
reference
Contrin 0.71 0.109 50 Blendinger et al. (2013) 107.9
P324 Pala di San Martino See
reference
See
reference
Contrin 0.56 0.158 50 Blendinger et al. (2013) 89.3
P326 Pala di San Martino See
reference
See
reference
Contrin 0.56 0.069 39 Blendinger et al. (2013) 89.2
P608 Pala di San Martino See
reference
See
reference
Contrin 0.94 0.110 50 Blendinger et al. (2013) 130.5
P85 San Lucano See
reference
See
reference
Contrin 1.55V. std 0.252 12 Blendinger et al. (2013) 170.8
P255 San Lucano See
reference
See
reference
Contrin 1.58V. std 0.163 51 Blendinger et al. (2013) 172.4
P256 San Lucano See
reference
See
reference
Contrin 1.33V. std 0.247 50 Blendinger et al. (2013) 158.5
P316 Pala di San Martino See
reference
See
reference
Contrin 0.71std 0.190 52 Blendinger et al. (2013) 107.9
P615 Pala di San Martino See
reference
See
reference
Contrin 1.22V 0.115 94 Blendinger et al. (2013) 151.5
P618 San Lucano See
reference
See
reference
Contrin 1.58V 0.013 50 Blendinger et al. (2013) 172.4
P606 Pala di San Martino See
reference
See
reference
Contrin 1.15V. std 0.278 50 Blendinger et al. (2013) 146.8
Bb40 Bletterbach 685800 5137100 Val Gardena 0.73 – – Buggisch (1978) 110.1
15e Bletterbach 685800 5137100 Val Gardena 0.60 0.090 – Bielefeld (1998) 94.3
– Bletterbach 686750 5136900 Val Gardena 0.88 – – Schulz and Fuchs (1991) 125.2
20a Rosengarten 698900 5142550 Val Gardena 0.76 0.100 – Bielefeld (1998) 113.4
N6a Rosengarten 701000 5142350 Val Gardena 0.37 0.140 – Bielefeld (1998) 55.3
belle Rosengarten 705014 5145331 Bellerophon 0.52 0.020 – Emmerich et al. (2008) 82.7
Calculated values based on solid bitumen reflectance measurements after the equation of Schoenherr et al. (2007) are marked with an asterisk (*).
Marked values seem to be too high and may be overprinted by volcanism (V) or show a too high standard deviation (std)
Burial history and thermal maturity of Mesozoic rocks…

References
Allen, J. R., & Allen, P. A. (2005). Basin analysis—Principles and
applications (2nd ed.). Baskerville, Hong Kong, Singapore:
Blackwell Publishing Ltd.
Balzas, E., & Koncz, I. (1999). Contribution to thermal evolution of
Southern Alps and paleogeographically adjacent areas based on
vitrinite reflectance data. 3rd Workshop on Alpine Geological
Studies.
Barker, C. E., & Pawlewicz, M. J. (1994). Calculation of vitrinite
reflectance from thermal histories and peak temperatures - A
comparison of methods. In P. Mukhopadhyay & W. Dow (Eds.),
Vitrinite reflectance as a maturity parameter (Vol. 570, pp. 216–229).
Washington: American Chemical Society Symposium Series.
Berner, R. A. (1984). Sedimentary pyrite formation: An update.
Geochimica et Cosmochimica Acta, 48, 605–615.
Bernet, M., Zattin, M., Garver, J. I., Brandon, M. T., & Vance, J. A.
(2001). Steady-state exhumation of the European Alps. Geology,
29, 35–38.
Berra, F., Jadoul, F., & Anelli, A. (2010). Environmental control on
the end of the Dolomia Principale/Hauptdolomit depositional
system in the central Alps: Coupling sea-level and climate
changes. Palaeogeography, Palaeoclimatology, Palaeoecology,
290, 138–150.
Bertotti, G., Picotti, V., Bernoulli, D., & Castellarin, A. (1993). From
rifting to drifting: Tectonic evolution of the South-Alpine upper
crust from the Triassic to the Early Cretaceous. Sedimentary
Geology, 86, 53–76.
Bielefeld, D. (1998). Reifebestimmungen an Kohlen des Grodner
Sandsteins in Sudtirol, unpublished Diploma Thesis. Univ.
Cologne.
Bigi, G., Cosentino, D., Parrotto, M., Sartori, R., & Scandone, P.
(1990). Structural model of Italy, 1:500.000. CNR—Italian
National Research Council.
Blendinger, W. (2004). Sea level changes versus hydrothermal
diagenesis: Origin of Triassic carbonate platform cycles in the
Dolomites, Italy. Sedimentary Geology, 169, 21–28.
Blendinger, W., Bertini, A., Lohmeier, S., & Meissner, E. (2013).
Dolomite in the Triassic Dolomites. Clausthaler Geowis-
senschaften, 9, 5–44.
Bosellini, A. (1998). Geologie Der Dolomiten. Bozen: Athesia
Ges.m.b.H.
Bosellini, A., Gianolla, P., & Stefani, M. (2003). Geology of the
Dolomites. Episodes, 26, 181–185.
Bostick, N. H., & Foster, J. N. (1975). Comparison of vitrinite
reflectance in coal seams and in kerogen of sandstones, shales,
and limestones in the same part of a sedimentary section. In B.
Alpern (Ed.), Petrography of Organic Matter in Sediments-
Relation to Paleotemperature and Petroleum Potential (pp.
13–25). Centre National de la Recharche Scientifique, Inter.
Collog., Paris, France.
Brandner, R. (1980). Geologische Ubersichtskarte von Tirol
(1:300.000) & Tektonik (1:600.000). Tirol Atlas Univ. Verlag
Wagner.
Brandner, R., Keim, L., & Adige, B. (2011). A 4-day geological field
trip in the western dolomites. Geo Alp, 8, 76–119.
Bruns, B., Di Primio, R., Berner, U., & Littke, R. (2013). Petroleum
system evolution in the inverted Lower Saxony Basin, northwest
Germany: A 3D basin modeling study. Geofluids, 13, 246–271.
Buggisch, W. (1978). Die Grodener Schichten (Perm, Sudalpen).
Sedimentologische und geochemische Untersuchungen zur
Unterscheidung mariner und kontinentaler Sedimente. Geolo-
gische Rundschau, 67, 149–180.
Carminati, E., Cavazza, D., Scrocca, D., Fantoni, R., Scotti, P., &
Doglioni, C. (2010). Thermal and tectonic evolution of the
southern Alps (northern Italy) rifting: Coupled organic matter
maturity analysis and thermokinematic modeling. AAPG Bul-
letin, 94, 369–397.
Carminati, E., & Doglioni, C. (2012). Alps vs. Apennines: The
paradigm of a tectonically asymmetric Earth. Earth-Science
Reviews, 112, 67–96.
Doglioni, C. (1984). Tettonica triassica transpressiva nelle Dolomiti.
Giornale Di Giologia, 46, 47–60.
Doglioni, C. (1985). The overthrusts in the Dolomites: Ramp-flat
systems. Eclogae Geologicae Helvetiae, 78, 335–350.
Doglioni, C. (1987). Tectonics of the Dolomites (Southers Alps,
Northern Italy). Journal of Structural Geology, 9, 181–193.
Doglioni, C. (1992). Relationships between Mesozoic extensional
tectonics, stratigraphy and Alpine inversion in the Southern
Alps. Eclogae Geologicae Helvetiae, 85, 105–126.
Dunkl, I., Di Giulio, A., & Kuhlemann, J. (2001). Combination of
single-grain fission-track chronology and morphological analysis
of detrital zircon crystals in provenance studies sources of the
Macigno Formation (Apennines, Italy). Journal of Sedimentary
Research, 71, 516–525.
Emmerich, A., Glasmacher, U., Bauer, F., Bechstadt, T., & Zuhlke, R.
(2005). Meso-/Cenozoic basin and carbonate platform develop-
ment in the SW-Dolomites unraveled by basin modelling and
apatite FT analysis: Rosengarten and Latemar (Northern Italy).
Sedimentary Geology, 175, 415–438.
Emmerich, A., Tscherny, R., Bechstadt, T., Buker, C., Glasmacher, U.,
Littke, R., & Zuhlke, R. (2008). Numerical simulation of the syn-
to post-depositional history of a prograding carbonate platform:
The Rosengarten, Middle Triassic, Dolomites, Italy. Spec. Publ.
International Association of Sedimentology, 40, 1–36.
Espitalie, J., Deroo, G., & Marquis, F. (1985). La pyrolyse Rock–Eval
et ses applications. Rev. l’Inst. Francais Du Petrole, 40, 563–579.
Hantschel, T., & Kauerauf, A. I. (2009). Fundamentals of basin and
petroleum systems modeling. Berlin, Heidelberg: Springer
Verlag.
Hardie, L., & Goldhammer, K. (1986). Repeated subaerial exposure
of subtidal carbonate platforms, Triassic, northern Italy: Evi-
dence for high frequency sea level oscillations on a 104 year
scale. Paleoceanography, 1, 447–457.
Hunt, J. M. (1995). Petroleum geochemistry and geology (2nd ed.).
New York: W. H. Freeman and Company.
Keim, L. (2008). Geologie im Gebiet Schlern – Seiser Alm : vom
Tethysmeer zum Gebirge. Gredleriana, 8, 25–46.
Keim, L., Brandner, R., Krystyn, L., & Mette, W. (2001). Termina-
tion of carbonate slope progradation: An example from the
Carnian of the Dolomites, Northern Italy. Sedimentary Geology,
143, 303–323.
Littke, R., Klussmann, U., Krooss, B., & Leythaeuser, D. (1991).
Keys to the depositional history of the Posidonia Shale in the
Hils syncline, northern Germany. Geochimica et Cosmochimica
Acta, 55, 3369–3378.
Littke, R., Urai, J. L., Uffmann, A. K., & Risvanis, F. (2012).
Reflectance of dispersed vitrinite in Palaeozoic rocks with and
without cleavage: Implications for burial and thermal history
modeling in the Devonian of Rursee area, northern Rhenish
Massif, Germany. International Journal of Coal Geology, 89,
41–50.
Luckge, A., Ercegovac, M., Strauss, H., & Littke, R. (1999). Early
diagenetic alteration of organic matter by sulfate reduction in
Quaternary sediments from the northeastern Arabian Sea.
Marine Geology, 158, 1–13.
Luckge, A., Horsfield, B., Littke, R., & Scheeder, G. (2002). Organic
matter preservation and sulfur uptake in sediments from the
continental margin off Pakistan. Organic Geochemistry, 33,
477–488.
A. Grobe et al.

Lukeneder, A. (2010). Lithostratigraphic definition and stratotype for
the Puez Formation: Formalisation of the Lower Cretaceous in
the Dolomites (S. Tyrol, Italy). Austrian Journal of Earth
Sciences, 103, 138–158.
Lukeneder, A., &Aspmair, C. (2006). Stratigrapic Implications of a new
Lower Cretaceous ammonoid fauna from the Puez area (Valangi-
nian - Aptian, Dolomites, Southern Alps, Italy). Geo Alp, 3, 55–83.
Mahlmann, R. F., & Giger, M. (2012). The Arosa zone in Eastern
Switzerland: Oceanic, sedimentary burial, accretional and oro-
genic very low- to low grade patterns in a tectono-metamorphic
melange. Swiss Journal of Geosciences, 105, 203–233.
Marocchi, M., Morelli, C., Mair, V., Klotzli, U., & Bargossi, G. M.
(2008). Evolution of large silicic magma systems: New U–Pb
zircon data on the NW Permian Athesian Volcanic Group
(Southern Alps, Italy). The Journal of Geology, 116, 480–498.
Masetti, D., Fantoni, R., Romano, R., Sartorio, D., & Trevisani, E.
(2012). Tectonostratigraphic evolution of the Jurassic exten-
sional basins of the eastern southern Alps and Adriatic foreland
based on an integrated study of surface and subsurface data.
AAPG Bulletin, 96, 2065–2089.
Massari, F., & Neri, C. (1997). The infill of a supradetachment (?)
basin: The continental to shallow-marine Upper Permian
succession in the Dolomites and Carnia (Italy). Sedimentary
Geology, 110, 181–221.
Mundil, R., Brack, P., Meier, M., Rieber, H., & Oberli, F. (1996).
High resolution U–Pb dating of Middle Triassic volcaniclas-
tics: Timescale calibration and verification of tuning param-
eters for carbonate sedimentation. Planet Science Letters, 141,
137–151.
Mundil, R., Palfy, J., Renne, P., & Brack, P. (2010). The Triassic
timescale: New constraints and a review of geochronological
data. In S. G. Lucas (Ed.), The Triassic timescale (pp. 41–60).
London: Special Pu. The Geological Society of London.
Noth, S., Karg, H., & Littke, R. (2001). Reconstruction of Late
Paleozoic heat flows and burial histories at the Rhenohercynian-
Subvariscan boundary, Germany. International Journal of Earth
Sciences, 90, 234–256.
Ogg, J. G., Huang, C., & Hinnov, L. (2014). Triassic timescale status:
A brief overview. Albertiana, 41, 3–30.
Peters, K. E. (1986). Guidelines for evaluating petroleum source rocks
using programmed pyrolysis. AAPG Bulletin, 70, 318–329.
Peters, K., Walters, C., & Moldowan, M. (2005). The biomarker guide
(2nd ed., Vol. 1). Cambridge: Cambridge University Press.
Rainer, T., Sachsenhofer, R. F., Rantitsch, G., Herlec, U., & Vrabec,
M. (2009). Organic Maturity trends across the variscan discor-
dance in the Alpine-Dinaric transition zone (Slovenia, Austria,
Italy): Variscan versus Alpidic thermal overprint. Austrian
Journal of Earth Sciences, 102, 120–133.
Rantitsch, G., Sachsenhofer, R. F., Hasenhuttl, C., Russegger, B., &
Rainer, T. (2005). Thermal evolution of an extensional detach-
ment as constrained by organic metamorphic data and thermal
modeling: Graz Paleozoic Nappe Complex (Eastern Alps).
Tectonophysics, 411, 57–72.
Rullkotter, J., Leythaeuser, D., Horsfield, B., Littke, R., Mann, U.,
Muller, P. J., et al. (1988). Organic matter maturation under the
influence of a deep intrusive heat source: A natural experiment
for quantitation of hydrocarbon generation and expulsion from a
petroleum source rock (Toarcian shale, northern Germany).
Organic Geochemistry, 13, 847–856.
Sachse, V. F., Littke, R., Jabour, H., Schumann, T., & Kluth, O.
(2012). Late Cretaceous (Late Turonian, Coniacian and Santo-
nian) petroleum source rocks as part of an OAE, Tarfaya Basin,
Morocco. Marine and Petroleum Geology, 29, 35–49.
Sachsenhofer, R. F. (1992). Coalification and thermal histories of
Tertiary basins in relation to late Alpidic evolution of the Eastern
Alps. Geologische Rundschau, 81, 291–308.
Saeed, M. Al, & Peters, K. (1994). Basin and petroleum system
modeling. Atlantic, 7, 1253–1262.
Saxby, J. D., Bennett, A. R., Corcorar, J. F., Lambert, D. E., & Riley,
K. W. (1986). Petroleum generation: Simulation over six years
of hydrocarbon formation from torbanite and brown coal in a
subsiding basin. Organic Geochemistry, 9, 69–81.
Scheidt, G., & Littke, R. (1989). Comparative organic petrology of interlayered
sandstones,siltstones,mudstonesandcoalsintheUpperCarboniferousRuhr
basin, Northwest Germany, and their thermal history and methane
generation. Geologische Rundschau, 78, 375–390.
Schenk, H. J., Witte, E. G., Littke, R., & Schwochau, K. (1990).
Structural modification of vitrinite and alginite concentrates
during pyrolytic maturation at different heating rates. A com-
bined infrared, 13C NMR and microscopical study. Organic
Geochemistry, 16, 943–950.
Schoenherr, J., Littke, R., Urai, J., Kukla, P., & Rawahi, Z. (2007).
Polyphase thermal evolution in the Infra-Cambrian Ara Group
(South Oman Salt basin) as deduced by maturity of solid
reservoir bitumen. Organic Geochemistry, 38, 1293–1318.
Schulz, O., & Fuchs, H. W. (1991). Kohle in Tirol: eine historische
kohlenpetrologische und lagerstattliche Betrachtung. Arch.
F. Lagerstattenforschung Geol. B.-A., 3, 123–213.
Senftle, J. T., Landis, R. L., & McLaughlin, R. L. (1993). Organic
petrographic approach to kerogen characterization. In M.
H. Engel & S. A. Macko (Eds.), Organic geochemistry (pp.
355–376). New York: Plenum Press.
Stefani, M., Furin, S., & Gianolla, P. (2010). The changing climate
framework and depositional dynamics of Triassic carbonate
platforms from the Dolomites. Palaeogeography, Palaeoclima-
tology, Palaeoecology, 290, 43–57.
Stock, H. W. (1994). Stratigraphie, Sedimentologie und Palaugeogra-
phie der Oberkreide in den nordlichen Dolomiten (Italien).
Jahrbuch Der Geologischen Bundes-Anstalt, 137, 383–406.
Suchy, V., Frey, M., & Wolf, M. (1997). Vitrinite reflectance and
shear-induced graphitization in orogenic belts: A case study
from the Kandersteg area, Helvetic Alps, Switzerland. Interna-
tional Journal of Coal Geology, 34, 1–20.
Sweeney, J., & Burnham, A. (1990). Evaluation of a simple model of
vitrinite reflectance based on chemical kinetics. The American
Association of Petroleum Geologists Bulletin, 74, 1559–1570.
Taylor, G. H., Teichmuller, M., Davis, A., Diessel, C. F. K., Littke,
R., & Robert, P. (1998). Organic petrology. Berlin/Stuttgart:
Gebruder Borntraeger.
Ting, T. C. (1973). Reflectivity of disseminated vitrinites in the Gulf
Coast region. Petrographie de la matiere organique des sedi-
ments relations avec la paleotemperature et le potentiel petrolier.
Centre Nationa de La Recherche Scientifique.
Tscherny, R. G. (2006). Numerische Simulation der thermischen
Evolution und Beckenentwicklung des permo-mesozoischen
Sudalpins (Dolomiten) entlang der TransAlp-Traverse. Disser-
tation RWTH Aachen University (ISBN 3-86130-828-2; German
with English Abstract).
Tscherny, R. G., Buker, C., Noth, S., Uffmann, A. K., & Littke, R.
(2011). Coalification of dispersed organic matter in the Dolomites,
Italy: Implications for burial and thermal history. Geo Alp, 8, 4–19.
Winterer, E., & Bosellini, A. (1981). Subsidence and Sedimentation
on Jurassic Passive Continental Margin, Southern Alps, Italy.
AAPG Bulletin, 65, 394–421.
Zattin, M., Cuman, A., Fantoni, R., Martin, S., Scotti, P., & Stefani,
C. (2003). Thermochronological evolution of the eastern South-
ern Alps from vitrinite reflectance and fission track data. Atti
Ticiensi Di Scienze Della Terra, 9, 92–95.
Zattin, M., Stefani, C., & Martin, S. (1990). Detrital fission-track
analysis and sedimentary petrofacies as keys of Alpine exhuma-
tion: The example of the Venetian foreland. Italy: European
Southern Alps.
Burial history and thermal maturity of Mesozoic rocks…