burak thesis. final.sept24 - mobt3ath.com · the effect of spray drying operational parameters on...
TRANSCRIPT

MICRO/NANOENCAPSULATION OF PROTEINS
WITHIN ALGINATE/CHITOSAN MATRIX BY SPRAY DRYING
By
Burak I Erdinc
Thesis submitted to the Department of Chemical
Engineering in conformity with the requirements for
The degree of Master of Science (Engineering)
Queen’s University
Kingston, Ontario, Canada
October, 2007
copyright© Burak I Erdinc, 2007

i
ABSTRACT
Currently, therapeutic proteins and peptides are delivered subcutaneously, as they
are readily denatured in the acidic, protease rich environment of the stomach or
gastrointestinal track and low bioavailability results from poor intestinal absorption
through the paracellular route. Encapsulation of therapeutic peptides and proteins into
polymeric micro- and nano- particle systems has been proposed as a possible strategy to
overcome limitations to oral protein administration. Furthermore, it was shown that
nanoparticles having diameters less than 5µm are able to be taken up by the M cells of
Peyer’s patches found in intestinal mucosa . However, the current methodologies to
produce particles within desired range involves organic solvents and several steps. In this
study, spray drying was investigated as a microencapsulation alternative, as it offers the
potential for single step operation, producing dry particles, with the potential for
extending the microparticle size into the nano-range. The particles were produced by
spray drying of alginate/protein solutions. The effect of spray drying operational
parameters on particle properties such as recovery, residual activity and particle size was
studied. Particle recovery depended on the inlet temperature of the drying air, whereas
the particle size was affected by the feed rate and the alginate concentration of the feed
solution. Increase in alginate:protein ratio increased protein stability during the process
and shelf live experiments. Presence of 0.2 g trehalose/g particle increased the residual
activity up to 90%. The resulting spherical micro and nanoparticles had smooth surfaces.
Stable glycol-chitosan-ca-alginate particles were produced with single step operation.
The resulting particles had mean diameter around 3.5µm and released 35% of the initial
protein content to the simulated stomach environment within 2 hours. The protein

ii
distribution within the particle was studied by confocal laser scanning microscope with
florescent labeled protein. The image showed protein deposition toward the surface of the
particles. Total drying time and Peclet number was calculated for the particles and found
to be 8.5 ms and 240, which indicates that particle formation was governed mainly by
convection, which resulted in a hollow central region and protein distribution toward the
particle surface. This study shows that stable alginate particles containing proteins can be
produced in a single step by spray drying, where the particles had a mean size lower than
the critical diameter necessary to be orally absorbed by M cell’s of the Peyer’s patches in
the gastrointestinal tract and thus can be considered as a promising technology for oral
peptide and protein delivery.

iii
ACKNOWLEDGEMENTS
First of all, I would like to express my deepest gratitude to my research supervisor
Dr. Neufeld for his superb guidance, teaching, patience, encouragement and
understanding during my graduate studies.
I would also like to sincerely thank Charlie Cooney, Andrea Liskova and Matt
Gordon for their help in scanning electron microscope, particle sizer and confocal laser
scanning microscope. My wholehearted thanks to my lab-mates Natinee Suvanasingha,
Ariel Chan for their invaluable help, advice and information. I would like to thank all my
close friends, who always stood by my side.
Finally, I would like to give my special thanks to my family for their
unconditional love and support. I would like to dedicate my thesis to my sister, Banu, for
always letting my dreams come through.

iv
TABLE OF CONTENTS
ABSTRACT………………………………………………….………….……….……....i
ACKNOWLEDGEMENTS…..……………………………….………….………..…..iii
TABLE OF CONTENTS……………………………………….………………….…...iv
LIST OF FIGURES…...……………………………………………….……………….vi
LIST OF TABLES..……………………………………………………...…………..…vii
NOMENCLATURE…………………………………………………………………...viii
CHAPTER 1.0 INTRODUCTION AND LITERATURE REVIEW………………....1
1.1 Protein Microencapsulation....................................................................................... 1
1.2 Microencasulation of Proteins by Spray Drying ....................................................... 2
1.3 Spray Drying ............................................................................................................. 6
1.4 Spray Drying Stages.................................................................................................. 8
1.4.1 Atomization........................................................................................................ 8
1.4.2 Spray-Air Contact ........................................................................................... 10
1.4.3 Separation of the Dried Product ....................................................................... 11
1.5 Alginate ................................................................................................................... 12
1.6 Glycol-Chitosan ...................................................................................................... 15
1.7 Subtilisin, Lysozyme and Bovine Serum Albumin (BSA) .................................... 16
1.8 Trehalose ................................................................................................................ 18
CHAPTER 2.0 OBJECTIVES ……………………………………………………19
CHAPTER 3.0 MATERIALS AND METHODS……..………………………………21
3.1 Materials.................................................................................................................. 21
3.2 Methods................................................................................................................... 21
3.2.1 Preparation of Feed Solution........................................................................... 21
3.2.2 Determination of Subtilisin Concentration and Activity ................................ 22
3.2.3 Protein Release from Micro- and Nano Particles in GI Simulated ................. 23

v
3.2.4 Characterization of Micro- and Nano Alginate Particles ................................ 24
3.2.4.1 Determination of residual moisture content .............................................. 24
3.2.4.2 Determination of the size distribution of the particles .............................. 24
3.2.4.3 Particle morphology and protein distribution within the particles............ 25
CHAPTER 4.0 RESULTS AND DISCUSSION ……………………………………26
4.1 Spray-dried Alginate Microparticles Carrying Active Biologicals......................... 26
4.1.1 Stability of Subtilisin in the Feed Solution ...................................................... 26
4.1.2 Residual Activity of Subtilisin within Particles ............................................... 28
4.1.3 Retention of Subtilisin Activity with Different Formulations of Alginate ...... 31
4.1.4 Effect of Feed Rate on Particle Size................................................................. 33
4.1.5 Effect of Alginate Concentration on Particle Size Distribution....................... 35
4.1.6 Residual Activity of Subtilisin with Different Amounts of Trehalose............. 39
4.1.7 Effect of Storage Time on Residual Activity of Subtilisin .............................. 43
4.2 Alginate Micro- and Nano Particles Produced by Spray Drying ........................... 44
4.2.1 Stability and Size of Alginate Micro- and Nano Particles .............................. 47
4.2.2 Protein Release from Micro- and Nano Alginate Particles .............................. 50
4.2.3 Protein Release from Particles Formulated with Glycol-chitosan and Calcium
Alginate ..................................................................................................................... 51
4.2.4 Physical Properties of the Chitosan-Alginate Particles.................................... 55
4.2.5 Protein Distribution Within the Particles ......................................................... 56
4.2.5.1 Estimation of Total Drying Time of Single Alginate Droplet. ................. 61
4.2.5.2 Estimation of Time Required for a BSA Molecule to Diffuse from the
Surface to the Center of the Droplet...................................................................... 66
4.2.5.3 Calculation of Peclet Number ................................................................... 67
4.2.6 Comparison of Present Study with a Previous Method .................................. 67
CHAPTER 5.0 CONCLUSIONS……………………………………………..………..69
6.0 REFERENCES …………………..…………………………………………………72
7.0APPENDIX………………………......……………...……………………………….78

vi
LIST OF FIGURES
Figure 1.1 Schematic illustration of a co-current spray dryer 7
Figure 1.2 Particle size ranges produced by different nozzle systems 9
Figure 1.3 Schematic illustration of droplet surface temperature and of the crust
formation of the particles 11
Figure 1.4 Alginate block types 13
Figure 1.5.I Probable binding mode between the calcium ion and two G residues
of alginate 14
Figure 1.5.II The conversion of alginate chains to buckled ribbon like structures 14
Figure 1.6.I Chemical structure of chitosan 15
Figure 1.6.II Chemical structure of glycol-chitosan 15
Figure 1.7 Molecular structure of trehalose 18
Figure 4.1.1 Activity retention of subtilisin in 2 % alginate feed solution. 27
Figure 4.1.2 Effect of protein loading and inlet temperature on residual activity
of subtilisin. 32
Figure 4.1.3 SEM image of spray dried alginate particles carrying subtilisin,
prepared at different alginate concentrations. 38
Figure 4.1.4 Effect of trehalose loading on residual activity of subtilisin within
particles. Protein loading 0.1 g/ g particle 40
Figure 4.1.5 Effect of trehalose loading on residual activity of subtilisin within
particles. Protein loading 0.33 g/ g particle 41
Figure 4.1.6
SEM images of spray dried alginate-trehalose particles carrying
subtilisin.
42
Figure 4.1.7 Effect of formulation parameters on storage residual activity of
alginate particles carrying subtilisin. 43
Figure 4.2.1 Schematic description of Coppi et al. (2001) and current method 46
Figure 4.2.2 Effect of alginate concentration in the feed solution on morphology
of ca-alginate particles. 50

vii
LIST OF TABLES
Figure 4.2.3
Release profile of BSA from alginate particles produced with
different amounts of Ca++
in the feed solution.
50
Figure 4.2.4 Release profile of BSA from glycol chitosan-alginate particles
produced by spray drying at different formulation ratios. 54
Figure 4.2.5 Release profile of model proteins from chitosan-alginate particles in
hydrochloric acid buffer at pH 1.2 and phosphate buffer at pH 6.8 56
Figure 4.2.6 SEM images of protein loaded chitosan-alginate particles. 57
Figure 4.2.7 FITC labeled BSA distribution within glycol chitosan-alginate
particles 60
Table 1.1 Properties of model proteins used in this study. 17
Table 4.1.1 Residual activity of subtilisin within alginate particles produced by
spray drying at different Tinlet
28
Table 4.1.2 Moisture content and recovery of the microparticles produced at
different Tinlet 30
Table 4.1.3 Effect of liquid feed rate on outlet temperature, particle size and
residual activity of subtilisin. 33
Table 4.1.4 Size and dimensional distribution of alginate microparticles 35
Table 4.1.5 Effect of alginate concentration on particle size, product recovery,
moisture content and residual activity of subtilisin 36
Table 4.1.6 Size and dimensional distribution of alginate particles prepared at
different concentrations. 37
Table 4.2.1 Stability of micro- and nano particles produced by spray drying. 48
Table 4.2.2 Size distribution of the alginate micro-and nano particles with
different amount of alginate in the feed solution. 49
Table 4.2.3 Comparison of particle size distribution of chitosan-alginate
particles carrying different proteins. 55
Table 4.2.4 Comparison of single method with the previously proposed method. 68

viii
NOMENCLATURE
η Viscosity of the droplet, cp
D Diffusion rate of BSA molecule within droplet, µm2/ s
Dav Average droplet diameter, µm
Dd Initial droplet diameter during constant rate period, µm
Dh Diameter of the hollow region in the particle
Dp Droplet and particle diameter during falling rate period, µm
kd Thermal conductivity of the water vapor in the stagnant layer around the droplet,
kcal/m h oC
dk a Thermal conductivity of the air in the stagnant layer around the particle , kcal/m h oC
Bk Boltzman constant, 1.3806503 × 10⁻²³ m2 kg / s 2 K
P Pressure of the atomizing air, psi
Pe Peclet number, dimensionless
Qaa Atomizing air feed rate, L/h
Qda Drying air flow rate, m3/h
Qlf Feed solution flow rate, mL/min
HR Hydrodynamic radius of BSA molecule, nm
R Radius of the droplet, µm
tcr Drying time during critical period, ms
td Drying time of constant plus falling rate,ms
Toutlet Outlet temperature of the drying air, oC
Tinlet Inlet temperature of the drying air, oC
inlet
wbT Wet bulb temperature of the drying inlet air, oC
outlet
wbT Wet bulb temperature of the drying outlet air, oC
crW∆ Total mass loss during constant rate period, kg
frW∆ Total mass loss during falling rate period, kg
Win Initial weight of the droplet, kg
Wp Weight of the particle during falling rate, kg
λ Latent heat of vaporization of water, kcal/kg
ρa Bulk density of alginate, kg/ m3
ρs Average density of the dry particle, kg/ m3

1
CHAPTER 1.0 INTRODUCTION AND LITERATURE REVIEW
1.1 Protein Microencapsulation
Microencapsulation is a process, where active biologicals such as enzymes, cells or
therapeutics such as antibiotics or vitamins, are entrapped within a semi-permeable
matrix. The resulting capsules or particles generally range from micrometers to
millimeters in size (Thies,2005). Applications of microencapsulation include controlled
release of the active components, particle coating, flavor stabilization, taste masking,
physical/chemical stabilization, improvement of shelf life and prevention of exposure of
the active material to the surroundings (Benita, 1996). Many microencapsulation
techniques have provided important innovations to the pharmaceutical, agricultural,
cosmetics, medical, biotechnology, food, paper and textile industries.
A number of microencapsulation strategies have been described in the literature,
which result in wet suspensions of microparticles, and often involve several processing
steps including the use of toxic solvents. The goal of the present study was to examine
spray drying as a microencapsulation alternative, as it offers the potential for single step
operation, producing dry particles, with the potential for extending the microparticle size
into the nano-range. Nanoparticles are becoming increasingly important in the
pharmaceutical field, such as toward the oral dosage of peptide or protein based
therapeutics. A variety of model proteins were nano/microencapsulated in the present
investigation, using alginate polysaccharide as a biodegradable matrix material.
2
1.2 Microencapsulation of Proteins by Spray Drying
Currently, therapeutic proteins and peptides are delivered subcutaneously, as they
are readily denatured in the acidic, protease rich environment of the stomach or
gastrointestinal track and low bioavailability results from poor intestinal absorption
through the paracellular route. Encapsulation of therapeutic peptides and proteins into
polymeric micro- and nano- particle systems has been proposed as a possible strategy to
overcome limitations to oral protein administration (Reis et al., 2006). Furthermore, it
was shown that nanoparticles having diameters less than 5µm are able to be taken up by
the M cells of Peyer’s patches found in intestinal mucosa (Hussein et al., 2001).
Several formulation techniques have been investigated previously to produce nano
particles (<5µm), including nanoemulsion dispersion (Reis et al., 2004), ionotropic pre-
gelation (Sarmento et al., 2006) and spray drying (Coppi et al., 2001). Although, the
desired particle sizes were achieved through nanoemulsion-dispersion and ionotropic pre-
gelation techniques, they have the drawback of requiring organic solvents and multiple
steps. However spray drying is a single step process, which can be operated continuously.
Spray drying utilizes heat from a hot gas stream to evaporate micro-dispersed droplets
created by atomization of continuous polymer/protein feed, thus the encapsulation of the
desired drug is achieved.
During the spray drying process, proteins can unfold due to dehydration stress
(Carpenter and Manning, 2002) although the droplets reach only the relatively low wet
bulb temperature by high rates of moisture evaporation (Broadhead et al., 1992). This
protein stability problem is prevented by using an additive such as sucrose, trehalose,
dextran or maltodextrin, which remain in the amorphous phase with the protein and/or
3
hydrogen bond to the protein in the place of water during drying, such as is the case with
sucrose or trehalose (DePaz et al., 2002). In addition to dehydration, there are also
stresses that lead to protein denaturation, such as shear in the spray nozzle, and protein
adsorption at the water/air interface (Adler and Lee, 1998). However, shearing stress
occurring during pumping, flow and atomization, do not appear to cause major damage to
proteins. For example, Maa and Hsu (1997) studied the high shear and adsorption to the
air/liquid interface. For recombinant human growth hormone (rhGH), shearing stress
occurring during pumping, flow and atomization, did not appear to cause major damage.
It was concluded that protein adsorption at the air/liquid interface is the primary cause of
the observed denaturation.
Spray drying was studied previously to produce protein loaded polymer particles
with diameters ranging from nanometers to several microns. In this context, several
polymeric matrices have been studied such as poly (D-lactide) (Tanaka, 1994),
poly(lactide-co-glycolide) (Blanco et al., 2005, Wang and Wang, 2003, Pavenetto et
al.,1993, Wageneer,1994), and poly (ε-caprolactone) (Blanco et al.,2003). However these
polymers all require organic solvents such as dichloromethane to formulate the spray
drying feed solution. Usage of hydrogels such as alginate as an encapsulation matrix is
favorable, since they form aqueous solutions, are biocompatible, highly inert toward
protein drugs and are bioadhesive, increasing drug residence time at the site of intestinal
absorption (Gombotz and Wee, 1998, Tønnesen and Karlsen, 2002). Alginates are known
to sustain release due to gelation with cations, such as Ca++
(Kim and Lee, 1992).
However, the cation crosslinked alginate network can degrade through removal of
calcium ions with chelators such as, citrate, lactate and phosphate, however these ions

4
generally do not appear in human intestinal fluid (Bhagat et al., 1994). Alginates form
strong complexes with polycations such as chitosan (Gombotz and Wee, 1998) and
glycol chitosan (Sakai et al., 2000) and these complexes do not dissolve in the presence
of Ca++
chelators and can be used to stabilize the gel and reduce its porosity.
Previously, spray drying was investigated to produce alginate based particles.
Takeuchi et al., (1998, 2000) investigated the properties of lactose-chitosan-alginate
composite particles produced by rotary atomizer for direct tabletting purposes. Coppi et
al., (2001,2002,2004) studied production of alginate microparticles for oral drug delivery
purposes, where BSA, L-lactade hydrogenase and a peptide antibiotic, polymixcin, were
used as model systems. In addition, several researchers studied spray dried alginate
particle systems focusing on production of particles with specific applications, such as
encapsulation of volatile materials (Rosenberg, 1990), and immobilization of cells (Begin
et al., 1990).
However, there have been no studies on alginate as spray dried encapsulation
matrix, involving the effects of operational parameters on particle properties, such as
size, morphology, residual activity and particle recovery, particularly for production of
nano-particles where bioactive biologicals, such as enzymes are encapsulated. These
operating parameters include formulation, concentration and feed rate of the feed
solution, and inlet temperature of the drying air. Moreover, the proposed methodology of
Coppi et al. (2001,2002,2004) to produce alginate particles for oral protein delivery
purposes, involved spray drying of an alginate/protein solution forming particles which
were subsequently subjected to several additional steps to enhance the properties, such as
physical crosslinking of the particles in CaCl2 aqueous solution and surface treatment of

5
the particles with chitosan to reinforce the alginate network and to improve adsorption
across the intestinal epithelia. Moreover, particles were subjected to a second and final
drying step involving freeze drying to remove water and to recover the particles. These
multiple steps can alter some of the properties of the particles. For example, the
entrapped drug can be released to the aqueous medium during the gellation step, or pH
sensitive proteins can be affected during surface treatment of the particles due to the
solubility requirements of chitosan (pH<5.5). Moreover, lypholization causes additional
stress on particles and proteins, such as changing the particle morphology and
denaturation of the proteins due to dehydration (Wang, 2000).
In the present study, alginate and alginate-sugar (trehalose) formulations were
investigated using the protease subtilisin as a model protein, in terms of how they can
affect the residual activity, since it is important in spray drying to determine the residual
activity, when heat sensitive materials, such as proteins, are needed to be encapsulated.
Subtilisin was selected due to it’s simple activity assay. The effect of inlet temperature,
feed rate, and protein:polymer and protein:polymer:disaccharide ratio, on the properties
of the resulting particles, including mean diameter, residual activity, storage stability,
moisture content, and product recovery was studied. Moreover, an alternative single
encapsulation step procedure was proposed for oral administration of proteins. The
present study, involved introduction of dilute Ca++
ions to a dilute alginate feed solution,
along with the protein and glycol-chitosan, where physical crosslinking of the alginate
and polyion complex formation takes place forming sprayable low viscosity gel. The
resulting particles were investigated, for size, protein content and protein release kinetics.
Two other model protein systems (lysozyme, and bovine serum albumin). were also used
6
along with subtilisin, since it’s been known that the properties of the proteins, such as
molecular weight and pI, can play an important role during their release from alginate
matrices (Gombotz and Wee, 1998) . The distribution of the model protein throughout the
polymer matrix was examined by using confocal laser scanning microscopy with
florescent labeled protein.
1.3 Spray Drying
The first detailed description of drying of a liquid system through a spray and hot
gas system appears in an 1872 patent. However spray drying started to be widely used in
the dairy and detergent industries in the 1920’s. Currently, it is used in many industries
such as pharmaceutical, food, electronics, chemical and cosmetics. Antibiotics (such as
penicillin), vitamins (such as ascorbic acid and vitamin B12) and enzymes (such as
amylase, protease, lipase and trypsin) are some of the materials spray dried in the
pharmaceutical industry (Çelik and Wendel, 2006). In spray drying, a liquid slurry or low
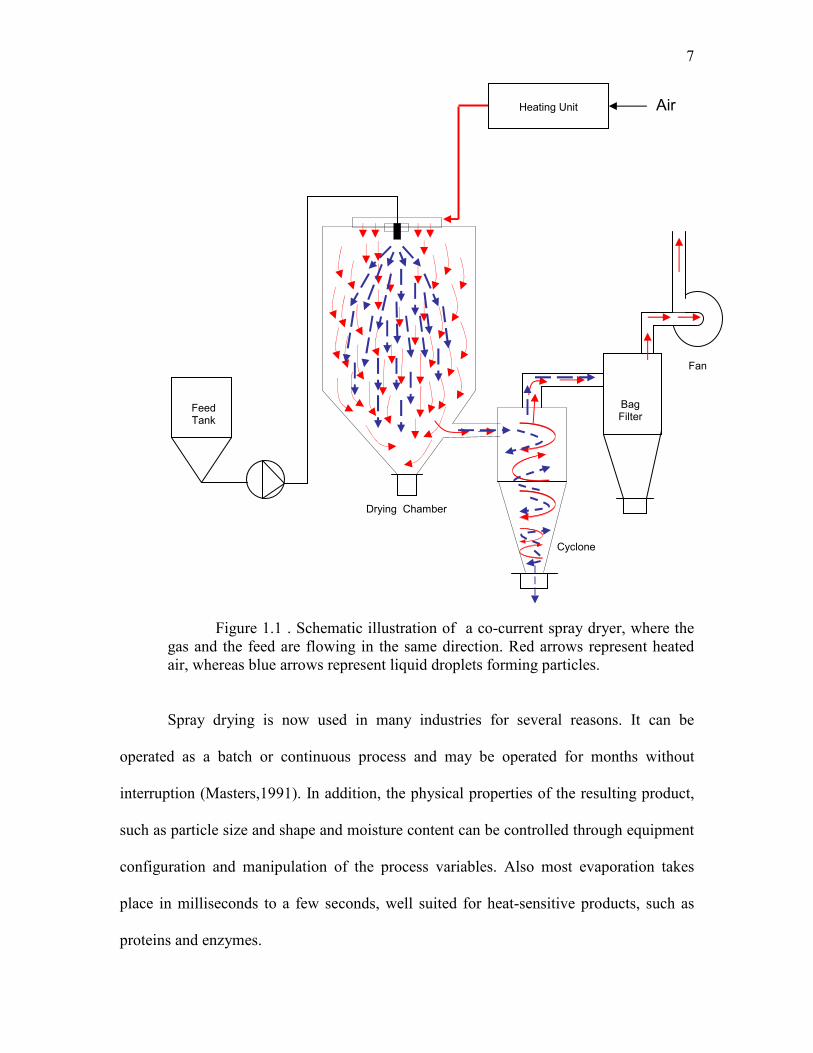
viscosity paste is converted into a free flowing powder in one unit operation. Figure 1.1
shows a general schematic of the spray-drying process. The liquid feed is pumped
through a nozzle, where it is dispersed into fine droplets. In the drying chamber, hot air
promotes simultaneous mass and heat transfer forming dry particles. The resulting
particles are separated into a collection vessel. A bag filter system is used to prevent the
fine particles from escaping to the atmosphere.
7
Figure 1.1 . Schematic illustration of a co-current spray dryer, where the
gas and the feed are flowing in the same direction. Red arrows represent heated
air, whereas blue arrows represent liquid droplets forming particles.
Spray drying is now used in many industries for several reasons. It can be
operated as a batch or continuous process and may be operated for months without
interruption (Masters,1991). In addition, the physical properties of the resulting product,
such as particle size and shape and moisture content can be controlled through equipment
configuration and manipulation of the process variables. Also most evaporation takes
place in milliseconds to a few seconds, well suited for heat-sensitive products, such as
proteins and enzymes.
Fan
Bag Filter
Cyclone
Feed Tank
Drying Chamber
Heating Unit Air
8
1.4 Spray Drying Stages
The spray drying process consists of three fundamental stages. The first stage is
atomization of liquid feed into fine droplets. In the second stage, spray droplets encounter
the heated gas stream and evaporation of the liquid from the droplet occurs, resulting in
the final dried particles. The final stage involves separation of the dried powder from the
gas stream and recovery of the particles in the collection vessel.
1.4.1 Atomization
The atomization stage produces a spray of droplets having a high surface to mass
ratio. There are several atomization systems available which may be classified according
to the nozzle design. Examples include rotary atomization, pressure atomization or two-
fluid (pneumatic) atomization. The selection of the nozzle type will affect droplet size
and subsequent particle size distribution as illustrated in Figure 1.2 (Masters, 1991). In
rotary atomization, the feed fluid is centrifugally accelerated to high velocity before
being discharged into the drying air atmosphere, which creates a spray of droplets.
Spinning wheels are used in larger-scale spray drying equipment (Masters, 1991). In
pressure atomization the fluid is fed to the nozzle under pressure which causes the fluid
to be dispersed into droplets as it leaves the nozzle. The formation of droplets occurs by
conversion of pressure energy within the liquid feed into kinetic energy of thin moving
liquid sheets. The sheets break up under the influence of the physical properties and by
the frictional effects with the air (Masters, 1991).

9
Figure 1.2 The particle size ranges produced by
different nozzle systems. Figure is adapted from Çelik and Wendel (2006).
The formation of droplets is influenced by the physical properties of the liquid
and by frictional effects with the air. In the two fluid nozzle, the liquid feed is
transported to the nozzle at a low flow rate where it encounters a high velocity gas stream
(Masters, 1991). The mixing of the feed and the gas stream causes the feed to break up
into fine droplets. Two fluid nozzles are generally used in laboratory-scale and small to
medium sized pilot plant spray-dryers. The droplet size is also influenced by the surface
tension and the viscosity of the liquid feed, and most importantly by the fluid velocity at
the nozzle orifice and by the air/liquid mass flow ratio (Masters, 1991).
2 3 5 10 20 30 50 100 200 300 500
Particle Size, µm
Rotary Wheel
Pressure Nozzle
2-Fluid Nozzle
10
1.4.2 Spray-Air Contact
Immediately after atomization, droplets encounter the heated gas stream, which is
usually air. The evaporation of water from the spray involves simultaneous heat and
mass transfer. On contact between the atomized droplets and the drying air, heat is
transferred by convection from the air to the droplets and consumed as latent heat during
moisture evaporation. The variables that affect the drying of the droplets in the drying
chamber of a laboratory-scale dryer are inlet temperature of the drying air (Tinlet) and the
outlet temperature (Toutlet), together with the relative humidity and the flow rate of the
drying air. The drying of a droplet to form a particle is considered as a three-step process
as illustrated in Figure 1.3. In the initial rate period, the drying rate increases until the
surface temperature of the droplet reaches the wet bulb temperature of the drying air, Twb,
which corresponds to 100% relative humidity. In the constant rate period, the drying rate
is constant, where the surface temperature of the droplet remains constant due to the
continuous evaporation of the solvent. In the falling rate period, the drying rate decreases
and crust formation occurs. During this third step, a high surface evaporation rate can
lead to formation of a dry crust surrounding the droplet (Masters, 1991). The crust may
collapse during further drying, resulting in particles with a deformed shape.

11
Figure 1.3 Schematic illustration of droplet surface temperature and of the crust
formation of the particles. I, II and III represents initial, constant and falling rate periods.
The figure is adapted from Çelik and Wendel (2006). Black lines represent the surface
temperature of the droplets vs time, whereas red dot lines represent the drying rate of the
particles vs time.
The drying rate of a droplet during the constant rate period is dependent on the
difference (∆T) between the air temperature and the temperature at the droplet surface,
TS= Twb. A decrease in inlet temperature and hence also in outlet temperature, Tout,
results in a lower ∆T, and therefore in a lower drying rate (Maa and Hsu, 1997). Tinlet is
considered as an independent variable, whereas the corresponding Tout is determined by
Tinlet and also the drying air flow rate and the liquid flow rate, Qlf. Tout is the dominating
temperature within the drying chamber since the high drying rate during the constant rate
period consumes much heat energy and causes the air temperature to fall rapidly on
contacting the droplets. In the second drying period, the drying rate continuously
decreases as illustrated in Figure 1.3 III, since the formation of an outer shell occurs at
the surface (Masters, 1991). The evaporation rate and the properties of the shell material
Droplet at initial temperature
Drying Time
Sensible Heating
Drying rate
III
Air wet bulb temperature
Drying droplet
with shrinkage
Crust formation
End of Drying
Droplet Surface
Temperature
I II

12
particles can influence the morphology of the particles, such as fast drying can deform
the particles and slow drying can leave the material wet and sticky (Çelik and Wendel
,2006).
1.4.3 Separation of the Dried Product
Particles are separated from the air stream by cyclonic air flow in a conical
chamber base, or by the ability of the particles to fall out of the air flow to a flat chamber
base. Irregardless of the type of separation used, some form of collection equipment is
required after the drying chamber. Collection equipment can be dry or wet cyclone bags,
bag filters, scrubbers or electrostatic precipitators. Cyclone separators have tangential air
entry, where the gas-particle stream enters a cyclindrical and conical chamber. The
downward spiraling motion results in powder collection in the bottom vessel, although
some powders tend to persist on the cyclone wall. The air leaves through a central
opening at the top (Masters, 1991).
1.5 Alginate
Alginate is one of the most widely used and studied polymers for encapsulation,
since it is biochemically inert and gels under mild conditions. Alginate is a naturally
occurring polysaccharide, produced commercially from algae or bacteria. It forms
hydrogels in the presence of multivalent cations. Alginate consists of linear
polysaccharide copolymer chains of 1-4 linked β-D mannuronic acid (M) and α-L
guluronic acid (G) of widely varying composition and sequence (Gombotz and Wee,
1998). The monomers are arranged mainly into three types of blocks: G, M and MG
blocks as shown in figure 1.4.

13
Figure 1.4 Alginate block types G = guluronic acid
M = mannuronic acid. Obtained from Tønnesen and Karlsen (2002).
Alginate-salt of monovalent ion such as sodium, is water-soluble. In the presence
of multivalent cations such as Ca++
, strong binding occurs between the two neighboring
G blocks, resulting in the formation of extended alginate networks where the G blocks
form stiff junctions as illustrated in Figure 1.5. The G blocks form cavities that function
as binding sites for ions (Skjak-Break, 1990).

14
Figure 1.5 I. Probable binding mode between the calcium ion and two G residues of
alginate. Obtained from Tønnesen and Karlsen 2002. II The conversion of alginate chains
to buckled ribbonlike structures which contain arrays of Ca++
ions. (Gombotz and Wee,
1998)
The selective binding of cations to the alginate accounts for its capacity to form
gels. The regions of M and MG blocks are not involved in network formation. Alginate-
Ca++
gels consisting of alginates rich in G blocks (high G content) are generally hard and
relatively brittle, whereas gels containing alginate with a relatively high content of M
blocks (low G content) are softer and can undergo larger deformations (Gombotz and
Wee, 1998). Due to the viscosity limitation of the spray drying system, low viscosity
alginate was used in this research.

15
1.6 Glycol-Chitosan
Chitosan is a linear polysacharride composed of randomly distributed ß-(1-4)-
linked D-glucosamine and N-acetly-D-glucosamine as shown in Figure 1.6. Chitosan is
derived from the shells of shrimp and other sea crustaceans (Illum,1998). It is
biodegradable and biocompatible and able to form a polyion complex with anionic
polymers, such as alginate. These complexes do not dissolve in the presence of calcium
chelators and are used to both stabilize and reduce porosity of the alginate matrix (Wee
and Gombotz, 1998).
I
II
Figure 1.6 Chemical Structure of chitosan (I) (Hu et al, 2005)
and glycol-chitosan (II) (Sakai et al., 2000)

16
Chitosan is normally insoluble in water above pH 6 due to its rigid crystalline
structure and requires acids to be protonated (Lee et al., 2007). This creates a limitation
when pH sensitive proteins are encapsulated, thus chemical modifications of chitosan
have been studied to increase its water solubility. A poly(ethlylene-glycol)–chitosan
hybrid system was produced, which is water-soluble over the entire pH range (Hu et al.,
2005). In present study glycol-chitosan was used mainly due to polymer solubility at
neutral pH, and ability to form polyion complexes with alginate. The structure of glycol-
chitosan is illustrated in Figure 1.6. Glycol-chitosan alginate complexes were also studied
previously. Sakai et al. (2000) made glycol-chitosan/alginate polyion complex
microcapsules to protect implanted encapsulated islets from the host immune response.
1.7 Subtilisin, Lysozyme and Bovine Serum Albumin (BSA)
Molecular weight and size of the proteins and their pI values play an important
role in the release of proteins from alginate matrices (Gombotz and Wee, 1998). In this
study, three model proteins having different molecular weights were used; bovine serum
albumin (BSA), subtilisin and lysozyme. However, during the investigation of the effect
of spray drying operational parameters on alginate nanoparticle properties, subtilisin with
a well studied spray drying history and simple assay was selected, since it is important to
determine the residual activity of the particles in the spray drying process where heat
sensitive materials are affected by several stresses. Subtilisin is a protease and one of the
most important groups of industrial enzymes as it accounts for 60% of industrial
microbial enzyme sales (Banarjee, 1999). It is used in detergent formulations to aid in
removing proteinaceous stains, has a molecular weight range of 25-35 kDa and an
isoelectic point of 9.4 (Ottessen, 1970). Subtilisins are produced by various Bacillus

17
species such as Bacillus subtilus and Bacillus licheniformis. Previously, polysaccharide
(dextran)-sugar (trehalose,sucrose) mixtures were used in spray drying to encapsulate
subtilisin into dry formulations to improve its process and storage stability. Several
researchers studied the effect of operational parameters on enzyme particle properties.
Samborska et al. (2005) investigated the effects of operational parameters on spray-dried
activity of α-amlyase. In their study increasing feed solution rate and maintaining low
outlet air temperatures, provided better protection of enzyme activity. Depaz et al. (2002)
focused on the effects of a number of additives including dissacharides (sucrose and
trehalose), polymers (dextran and maltodextrin) and dissacharide-polymer mixtures on
the stability of the subtilisin, both during drying and storage. It was reported that the
additives capable of hydrogen bonding inhibit the unfolding of subtilisin during drying,
hence improved shelf life. Namaldi et al. (2006) studied the effect of temperature and
additives (glucose and maltodextrin) on residual activity of serine alkaline protease. It
was found that the residual activity of the protein continuously decreased by increasing
drying temperature and presence of additives, and increased the residual activity at drying
temperatures of 110 oC. The properties of the proteins used in this study are represented
in Table 1.1.
Table 1.1. Properties of model proteins used in this study: BSA , Lysozyme, Subtilisin
BSA Subtilisin Lysozyme
Number
of Residues 583 275 129
Molecular weight 66.4 kDA 25-35 kDA 14.7 kDa
Theoretical pI 5.82 9.4 11.35

18
1.8 Trehalose
One of the challenges to preserve the stability of the enzymes and proteins during
drying processes is the dehydration stress. Thus water replacing excipients are used as
additives, such as sucrose, lactose, maltose and trehalose, which form hydrogen bonds
with proteins, during water removal (Allison et al, 1999). Trehalose is a disaccharide,
having high glass transition temperature (Tg = 84 oC, for particles produced at Tinlet=150
oC), making it the most suitable sugar for protecting proteins from denaturation during
drying (Adler and Lee, 1998). The molecular structure of trehalose is presented in Figure
1.9. Trehalose has been used previously as an protective agent in protein spray drying
applications in order to improve stability of the proteins. Adler and Lee, (1998) spray
dried lactate-dehydrogenase in the presence of trehalose. More that 90% of the activity
was retained and when the particles were stored at room temperature for 25 weeks, no
activity loss was observed. Furthermore spray drying of recombinant human growth
hormone was studied (Maa et al., 1997). Broadhead et al., (1994) spray dried β-
galactosidase in the presence of trehalose and the activity of the enzyme was completely
recovered.
Figure 1.9 Molecular structure of trehalose
19
CHAPTER 2.0 OBJECTIVES
A number of microencapsulation strategies have been described in the literature,
which result in wet suspensions of microparticles, and often involve several processing
steps including the use of toxic solvents. The goal of the present study was to examine
spray drying as a microencapsulation alternative, since it offers single step operation,
producing dry particles, with the potential for extending the microparticle size into the
nano-range. Nanoparticles are becoming increasingly important in the pharmaceutical
field, such as toward the oral dosage of peptide or protein based therapeutics. A variety of
model proteins were nano/microencapsulated in the present investigation, using alginate
polysaccharide as a biodegradable matrix material, since it is water soluble,
biocompatible, highly inert toward protein drugs, and is bioadhesive increasing drug
residence time at the site of intestinal absorption.
Specific objectives are as follows:
1. Spray drying process parameters will be studied including protein to alginate
ratio, alginate concentration, feed rate, and inlet temperature, in terms of how they
may affect the properties of spray-dried micro- and nano particles such as mean
size and distribution, residual activity of the encapsulated subtilisin, water
content, product yield and particle morphology.
2. The residual activity of a model protein, subtilisin, will be evaluated in terms of
how activity is affected by spray drying, with the addition of protectants, such as
trehalose.

20
3. The long term stability of the spray dried micro- and nano particles will be
determined.
4. In vitro release of low molecular weight model proteins (bovine serum albumin,
subtilisin and lysozyme) will be investigated in simulated gastrointestinal
environments.
5. The effect of additives such as glycol-chitosan, on release profiles, particle size
and morphology will be evaluated.
6. The potential of spray drying for the preparation of nanoparticulate proteins for
oral administration will be compared with other formulation methodologies.

21
CHAPTER 3.0 MATERIALS AND METHODS
3.1 Materials
Low viscosity sodium alginate (Na-A) (Sigma-Aldrich, Oakville, Canada) with
specifications; 250 cP for 2% solution at 25oC; molecular weight about 147 000; 61%
mannuronic acid and 39% guluronic acid; batch number 112K0931. Subtilisin enzyme
concentrate (Purafect UF concentrate, Lot L 20031) was supplied by Genencor International
Inc. (Palo Alto, USA). Bovine serum albumin (BSA), lysozyme, glycol chitosan, maltose,
sucrose, trehalose, peptide substrate (N-succinyl-L-Ala-L-Ala-Pro-L-Phe-p-nitroanaline) and
other excipients were purchased from Sigma-Aldrich (Oakville, Canada).
3.2 Methods
3.2.1 Preparation of Feed Solution
Sodium alginate at noted concentrations was dissolved in deionized water using a
magnetic stir plate, then dearated for 30 min. Model proteins at noted concentrations
were dissolved in distilled water and added to the alginate solution. If the alginate
solution was needed to be mixed with CaCl2 and glycol-chitosan solutions, the alginate
solution at various concentrations containing a model protein (subtilisin, lysozyme and
BSA) at desired formulation rate was slowly mixed with CaCl2 solution in a beaker aided
by mechanical mixer for 5 minutes. The three-blade upward directing marine-type
impeller was placed close to one third of the liquid depth to eliminate air entrainment,
and rotated at 250 rpm. For the formulations with glycol chitosan, glycol-chitosan at

22
desired amount was dissolved in distilled water and added to the alginate solution
containing the protein and dilute Ca++
. The solution was mixed in a beaker aided by
mechanical mixer for 5 minutes by a marine-type impeller at 250rpm. During spray
drying, all the feed solution formulations were continuously mixed with a magnetic
stirrer. The dryer nozzle and glass walls of the particle collection vessel were cooled
with tap water during the drying operation. Activity, yield, particle size and distribution
and residual moisture content were determined on formulated particles.
3.2.2 Determination of Subtilisin Concentration and Activity
Subtilisin concentration was determined spectrophotomerically using
ultraviolet absorbance at 280 nm. A protein standard curve was prepared with BSA in
tris-HCl buffer solution. The catalytic activity of subtilisin was determined
spectrophotometrically at 410 nm with 1 mg/ml N-succinyl-L-Ala-L-Ala-Pro-L-Phe-p-
nitroanaline as substrate in 100 mM Tris, 0.005 % Tween 80 pH 8.6 (DelMar EG), as
described in Chan, (2003). The particles dissolved in tris buffer system, and solution was
sampled to run activity assay. The residual activity of subtilisin within spray dryed
particles was determined by dividing the activity after rehydration of the particles, by the
activity obtained by the stock solution prior to spray drying.

23
3.2.3 Protein Release from Micro- and Nano Particles in GI Simulated
Environment
Protein release was carried out under simulated gastrointestinal (GI) conditions by
suspending 10 mg particles into 20 mL 0.1M hydrochloric acid solution at pH 1.2, 37oC for
2h, followed by transfer to 0.05M phosphate buffer at pH 6.8 for 3h. Experiments were
performed in triplicate with mixing. At appropriate time intervals, 1.2 mL aliquots were
removed, centrifuged and supernatant removed to be assayed for protein content
spectrophotometrically (Cary 1, Varian, Australia) at 595 nm using the Bradford modified
method (Coomassie plus kit, Pierce, Fisher, Canada). In order to keep the volume constant, 1.2
mL of the buffer solution was replaced. The percentage of released protein and encapsulation
efficiency were calculated assuming that all the protein was released after the first 4 hours
from the point when the particles were initially added to pH 1.2. The protein encapsulation
efficiency of the particles was determined by the ratio of the initial protein load to the particle
formulation to the spectrometrically determined amount of the proteins after rehydration.
Particle yield was determined by dividing the amount of recovered spray dried particles by the
initial mass of solids introduced to the spray dryer.

24
3.2.4 Characterization of Micro- and Nano Alginate Particles
3.2.4.1 Determination of residual moisture content
The residual moisture content of the spray dryed particles was determined by ratio
of the weight difference before and after lyophilization. The particles were assumed to be
moisture free after lyophilizing for 48hr.
3.2.4.2 Determination of the size distribution of the particles
Spray dryed particles were sized using a laser diffraction particle sizer (Malvern
Mastersizer 2000 with dry particle sizing accessory, Sirocco 2000). Around 100 mg of
particles were analyzed for each batch. The operating pressure was 3 bars and vibration
speed of the microplate tray was 30% of maximum. For each batch of particles, the mean
diameters were calculated in triplicate. The size distribution was estimated by a SPAN
factor, which is defined by the ratio;
( )
D
DD SPAN
50
1090 −=
where D90% , D50% and D10%, are the mean diameters at which cumulative volume percent
of 90, 50 and 10% of the particles are determined. A high SPAN indicates a wide size
distribution, whereas a low value indicates a narrow size distribution.

25
3.2.4.3 Particle morphology and protein distribution within the particles
Morphology was examined by scanning electron microscopy (JEOL, JSM-840)
with gold coated particles. Protein distribution within the particle matrix was determined
by confocal laser scanning microscope (Leica TCS SP2, Germany). A 3 mL amount of
BSA-FITC solution (10 mg/mL) was added to a sodium alginate, Ca++
, chitosan solution
(alginate/protein ratio of 9:1, for 0.3% Na-A solution) and the particles were analyzed by
“pro plus basic” Leica operating software. The imaging was performed with dry particles
in order to prevent swelling and release of the protein.
26
CHAPTER 4.0 RESULTS AND DISCUSSION
Spray drying was used to produce micro- and nano particles carrying model
proteins embedded within an alginate polymer matrix. One of the applications under
consideration for protein loaded nanoparticles is oral drug delivery. The effect of
operational parameters on the resulting properties of particles carrying an active
biological was investigated (chapter 4.1) and a single step method proposed to enhance
the properties of the micro- and nanoparticles for oral drug delivery applications (chapter
4.2).
4.1 Spray-dried Alginate Microparticles Carrying Active Biologicals
4.1.1 Stability of Subtilisin in the Feed Solution
The stability of subtilisin enzyme in the feed solution during the process period is
important to ensure highest levels of dry product activity. The activity of the subtilisin
feed solution was monitored for 1h, which is the total process time. Acitivity was
assayed spectrophotometrically at 410 nm with 1 mg/mL N-succinyl-L-Ala-L-Ala-Pro-
L-Phe-p-nitroanaline as substrate in Tris–HCl buffer (100 mM Tris-HCl, 0.005% Tween,
pH 8.6) and resultant activities presented in Figure 4.1.1.

27
50
60
70
80
90
100
110
0 20 40 60
time(min)
Activity of Subtilisin (%)
Figure 4.1.1 Activity retention of subtilisin in 2% alginate feed solution
Alginate:subtilisin = 9, pH = 7.1 at 20 O C. Data shown represent mean values and error
bars represent one standard deviation around the mean based on a minimum of 3
replicates
The optimum activity of subtilisin is known to be within the pH range of 7 and
8.5 (Chan, 2003), and since the pH of the feed solution was within this optimal range, the
average residual activity of the subtilisin was around 95 %, during the 1 h period. It may
be concluded that the subtilisin remains highly active during the spray drying process
period.

28
4.1.2 Residual Activity of Subtilisin within Particles
Inlet temperature of the drying air (Tinlet) is an important parameter for spray
drying processes and can affect the properties, such as residual activity of the protein in
the resulting particles, especially with thermo-sensitive biologicals. To study the effect
of inlet air temperature on residual activity of subtilisin, alginate-subtilisin solution (2%
alginate, subtilisin:alginate ratio 1:9) was spray dried at three different inlet temperatures.
For each batch, liquid feed rate (Qlf), aspirator rate (Qda), atomization pressure (P) and
subtilisin loading were kept constant. In addition, free soluble subtilisin solution (0.2%)
was spray dried at Tinlet =150oC to determine the activity loss of subtilisin without the
presence of alginate. The resulting particles were assayed for residual activity and results
presented in Table 4.1.1.
Table 4.1.1Residual Activity of subtilisin within alginate microparticles
produced by spray drying at different Tin. Operating conditions;
Qlf = 5mL/min, Qda = 38 m3/h , Qaa = 600 L/h, P = 80 psi,
Protein loading = 0.1 g subtilisin/g particle
* Free soluble subtilisin C = 0.2%,w/v
Increasing Tinlet from 125 oC to 175
oC, consequently Toutlet from 63
oC – 81
oC, did
not significantly affect the final residual activity yield of the subtilisin within particles, as
for all three conditions, the activity yield ranged from 76 to 81%. In sharp contrast,
Tinlet ºC Toutlet ºC Residual Activity[%]
125 63 76±2
150 69 81±2
175 81 77±3
150* 75 34±4

29
when subtilisin was spray-dried alone, more than 65% of the initial activity was lost. This
shows that alginate is playing a stabilizing role for the enzyme during spray drying. As
mentioned earlier, stability of the proteins can be affected by several stresses during spray
drying, including thermal stress due to the drying air, shear stress due to the shear forces
in the nozzle during atomization, adsorption due to the generation of new air/water
interfaces and dehydration stress caused by the rapid evaporation of the water (Lee et al.,
2002). However, globular proteins such as subtilisin are considered to be rigid and tend to
resist changes in conformation upon adsorption at interfaces (Tripp et al., 1995) and
show pressure stability up to 200 MPa (Webb et al., 2000). Therefore, activity loss due to
conformational changes as a result of adsorption and shear stresses might be minor
compared to dehydration and thermal stresses.
Immediately after atomization, the droplet surface temperature approximates the
wet-bulb temperature of the inlet air. For the free soluble subtilisin solution which has a
low solids concentration (0.2%,w/v), the enthalpy-humidity chart of the pure water
system can be used. For inlet temperature of 150oC, the surface temperature (Tsur) value
can be estimated to be 41oC, thus subtilisin solution droplets experience much lower
temperature than the hottest region of the dryer. However, the maximum temperature of
the microparticles can be assumed to attain the outlet temperature of the drying air where
Toutlet = 75 oC, and the time period of exposure of the drying droplets to the elevated
temperature is approximately 5-30 sec. (Broadhead, 1992). However, it has been known
that polysaccharides such as dextran, have the ability to form an amorphous phase with
proteins which limits the conformational changes due to the stresses involved in spray
drying (DePaz et al.,2002). As mentioned earlier, alginate which is a polysaccharide, may

30
also form an amorphous phase with subtilisin molecules creating a matrix structure
around the subtilisin, through hydrogen bonds which limits conformational changes,
caused by dehydration and thermal stresses.
Recovery of the particles is also an important parameter in terms of investigation
into the scaling up of the spray drying process. The water content and product yield of the
final microparticles were also studied and the results presented in Table 4.1.2.
Table 4.1.2 Water content and recovery of the microparticles produced at different inlet
temperatures by spray drying. Operating conditions; Qlf = 5mL/min,
Qda = 38 m3/h , Qaa = 600 L/h, P = 80 psi, C = 2% w/v
As can be seen, the final water content of the particles change from 7.1 to 5.5%
when the inlet temperature of the drying air increased. The product yield increased as the
inlet temperature increased from 125 ºC to 175 ºC. At 125oC, deposition of particles on
the cyclone wall was observed, which might be due to insufficient droplet/particle drying
within the drying chamber and higher moisture content particles, adhering to the cyclone
wall, leading to a lower product yield. At inlet temperatures 150ºC and 175ºC, higher
moisture removal and product yield was observed. In both systems, the moisture content
of the particles was less around 6% and around 35% of the particles are recovered in the
collection vessel. In terms of industrial scale up, higher inlet temperatures could be
Tinlet [ºC] Toutlet [ºC] Product recovery
[%]
Moisture
Content [%]
125 63 21± 2 7.1±2
150 69 33± 2 5.6±2
175 81 37± 3 5.5±2

31
selected, due to the better water moisture removal and higher product recovery, especially
as higher temperatures to 175 ºC do not significantly affect enzyme activity.
4.1.3 Retention of Subtilisin Activity with Different Formulations of Alginate
In spray drying of proteins, the ratio of amorphous phase to protein is important as
it affects the final residual activity within the microparticles. The subtilisin in the
formulation was varied from 0.1 to 0.33 g subtilisin/g particle keeping the total solid
concentration constant. The formulation was spray dried at two different inlet
temperatures, 150 ºC and 175 ºC, and the results are presented in Figure 4.1.2.

32
50
60
70
80
90
Residual Activity (%)
0.1 0.33 0.25
Subtilisin [g/g particle]
Figure 4.1.2 Effect of protein loading and inlet temperature on residual activity of
subtilisin. 175 ºC (light columns), 150 ºC (dark columns). Operating conditions;
Qlf = 5mL/min, Qda = 38 m3/h , Qaa = 600 L/h, P = 80 psi.
The formulations containing 0.1 g subtilisin/g particle showed around 80 %
residual activity, and as the subtilisin concentration increased to 0.33 g subtilisin/ g
particle, a decrease in the residual activity was observed. The residual activities for 0.25
and 0.33 g subtilisin/g particle were around 75 % and 65 %. Figure 4.1.2 also showed that
the effect of inlet temperature on the residual activity of subtilisin is minor compared to
the ratio of alginate:subtilisin. As the subtilisin in the formulation increases, the alginate
concentration decreases, as does the residual activity.

33
4.1.4 Effect of Feed Rate on Particle Size
Liquid feed rate is the major influencing factor on Tout and together with
atomization air pressure and liquid properties (viscosity and surface tension), it also
determines the spray droplet size (Maa et al., 1997). The effect of feed rate at constant
atomization pressure on moisture content, residual activity and product recovery is
presented in Table 4.1.3. For each batch, other spray drying parameters such as liquid
feed rate, aspirator rate, atomization pressure and other process parameters such as total
solute concentration in the feed solution and subtilisin loading were kept constant.
Table 4.1.3 Effect of liquid feed rate on outlet temperature, particle size and residual
activity of subtilisin. Operating conditions; Qda = 38 m3/h , Qaa = 600 L/h, P = 80 psi,
Protein loading = 0.1 g subtilisin/ g particle
Qlf
mL/min
Toutlet
[ºC] D[0.1] D[0.5] D[0.9] SPAN
Water
Content
Residual
Activity[%]
Product
Recovery
[%]
10 58 3.12 6.69 30.1 4.09 8.1±1 71±2 21± 2
7 61 2.32 6.31 22.2 3.19 7.2±2 72±2 21± 2
5 69 1.91 4.91 13.5 2.34 5.6±2 81±2 33± 2
Liquid feed rate affected the mean particle size (D[0.5]), the particles size
decreased from 6.69 to 4.91 µm by decreasing the feed rate, whereas the outlet
temperature of the drying air increased from 58 to 69oC . The effect of liquid feed rate
and the atomization air pressure on spray droplet size is defined by the air/fluid mass
ratio, which represents the energy available for atomization (Masters, 1991). When
atomization pressure was kept constant and liquid feed rate decreased, the energy
available for atomization increased, therefore spray droplet size decreased and
consequently the size of the dried particles. As a result of higher liquid feed rate, the

34
amount of water evaporated was increased, leading to a lower outlet temperature as
observed in Table 4.1.3. The water content of the particles also increased with increasing
liquid feed rate. Although, higher feed rates result in lower outlet temperatures, the
residual activity in the final particles decrease about 10%. This difference can be
explained due to particle deposits present inside the walls of the cyclone. As mentioned
earlier, when the particles leave the drying chamber with high moisture content, they
adhere to the walls of the cyclone. However, the temperature of the cyclone wall is close
to the outlet temperature of the drying air. As the process continues, the moisture content
of the particles might further decrease, and with the help of drying air they might further
travel to the collection vessel. This will affect residual activity, due to the high surface
temperature of the cyclone wall.
In terms of particle size, the Buchi-290 lab scale spray dryer is thought to be able
to produce particles with diameter range of 1-10 µm (Lee, 2002). From Table 4.1.3, it
may be concluded that in order to produce alginate nanoparticles having mean diameter
less than 5 µm, a low feed rate of 5 mL/min should be selected. Size and dimensional
distribution of the particles are presented in Table 4.1.4.

35
Table 4.1.4 Size and dimensional distribution of alginate microparticles.
Operating conditions; Qlf= 5mL/min, Qda = 38 m3/h , Qaa = 600 L/h, P = 80 psi,
C = 2% w/v Protein Loading = 0.1 g protein/ g particle
Diameter
Range (µm) Distribution
<1 3 %
1-2 25%
2-3 26%
3-4 18%
4-5 24 %
5-10 10%
Around 90 % of the particles were within the particle size range desired for oral
absorption though the intestinal mucosa.
4.1.5 Effect of Alginate Concentration on Particle Size Distribution
In addition to solution feed rate, liquid properties such as viscosity and surface
tension can also affect the particle size in spray-drying. The alginate concentration was
thus varied from 0.2 to 2%, and the particle properties are presented in Table 4.1.5.

36
Table 4.1.5 Effect of alginate concentration on particle size and residual activity of
subtilisin. Operating conditions; Qlf = 5mL/min, Qda = 38 m3/h , Qaa = 600 L/h, Paa = 80
psi, Protein Loading = 0.1 g subtilisin/ g particle
C
[%]
Viscosity
[cps] Tout D[0.1] D[0.5] D[0.9] Span
Residual
Activity
[%]
Product
Recovery
Moisture
Content
0.2 43 85 1.31 2.15 3.58 1.05 68±3.6 21±2.2 5.2±2.4
0.5 93 78 1.57 3.67 7.3 1.56 73±3.4 19±2.5 5.3±2.1
1 127 73 1.83 4.12 11.8 2.41 74±2.2 37±2.4 5.3±2.2
2 189 69 1.91 4.91 13.5 2.34 81±2.4 33± 2.1 5.6±2.2
The total solid content in the spray drying feed solution may affect the particle size
since higher solids content in droplets shortens the constant rate period because less water
must evaporate to build a crust, consequently forming larger particles. This case will
occur, where the solutes do not have large impact on solution viscosity. The viscosity
values of the feed solutions with corresponding alginate concentrations are presented in
Table 4.1.5. As seen, higher alginate concentration, increases solution viscosity,
consequently producing larger particles. The change in total solids concentration from 0.2
to 2% increases the mean particle size (D[0.5]) from 2.15 to 4.91 µm. The span value
also increases with higher alginate concentration, and thus viscosity of the feed solution.
This indicates that the microparticles produced with lower alginate concentration resulted
in a narrower size distribution. However, the residual activity and particle recovery
decreased around 15%, as the alginate concentration decreased from 2% to 0.2% in the
feed. As mentioned earlier, the particles are collected through a cyclone system under
centrifugal force. However, when the particle size is less than 2 µm, the gravitational
force may not be sufficient for recovery, allowing particles of diameter < 2 µm to pass

37
into the outlet air (Prinn et al., 2002). Therefore for the particles prepared with low
alginate concentration, there is a higher chance that the particles can escape, leading to
lower particle recovery. In addition, volumetric distribution of the particles can be also
affected, due to insufficient trapping of the particles having lower particle size. Recovery
of the nano-size range particles can be increased with electrostatic filters. The outlet
temperature of the spray dryer was increased to 85 oC as the alginate concentration in the
feed solution decreased to 0.2% leading to a lower residual activity of subtilisin
encapsulated within particles.
The volumetric size distribution of the particles is presented in Table 4.1.6. It can
be seen that for all the conditions tested, less than 5% of the particles are within the
submicron range. For all conditions, around 90% of the particles are within the range of
1-5 µm, which is an appropriate size for oral absorption within the intestinal mucosa.
Table 4.1.6 Size and dimensional distribution of alginate microparticles.
Operating conditions; Qlf = 5mL/min, Qda = 38 m3/h , Qaa = 600 L/h,
P = 80 psi, Protein loading =0.1 g protein/ g particle.
Total Solid
Concentration [C] 2% 1% 0.5% 0.2%
Mean Diameter [ µm] 4.91 µm 4.12 µm 3.67 µm 2.15 µm
<1 3 % 3% 4% 5 %
1-2 25% 31% 35% 43%
2-3 26% 24% 29% 31%
3-4 18% 17% 16% 15%
4-5 24 % 17% 10% 4%
5-10 10% 8% 5% 2%

38
However, the volumetric size distribution of the particles may extend more into
the nanorange, where lower alginate concentration was used. At lower alginate
concentration, there is a higher probability that the particles will have a smaller size
making separation more difficult affecting the particle population collected. These results
show that the mean particle size and the volumetric population of the particles depend on
the alginate feed solution concentration, and also particles prepared with low alginate
concentration have narrower size distribution.
SEM images of the particles are presented in Figure 4.1.3. The particles were
dimpled and spherical morphology.
Figure 4.1.3. SEM images of spray dried alginate particles carrying subtilisin, Left image:
Alginate particles prepared with 0.2% alginate in the feed solution. Scale bar represents
10 µm. The right image show alginate particles prepared with 2% alginate. Scale bar
represents 10 µm.
39
4.1.6 Residual Activity of Subtilisin with Different Amounts of Trehalose
As mentioned earlier, water removal can lead to conformational changes in the
protein/peptide, leading to loss of activity. Many proteins/peptides have been
successfully dried with minimal activity loss by use of stabilizing additives. Additives
can protect during the dehydration process by forming hydrogen bonds with the protein.
Several mono-and disaccharides, and several polyols and amino acids are known
stabilizers against water removal stress. Examples include lactose, trehalose, sucrose,
mannitol, sorbitol, lysine, histidine or arginine (Arakawa et al., 1993). Amongst these
examples, trehalose is known to be the best sugar for stabilizing proteins during spray
drying processes (Adler and Lee, 1998).
The total solids concentration of the feed was kept constant and the trehalose
amount changed from 0 to 0.25 then 0.33 g/g particle, with the subtilisin loading kept
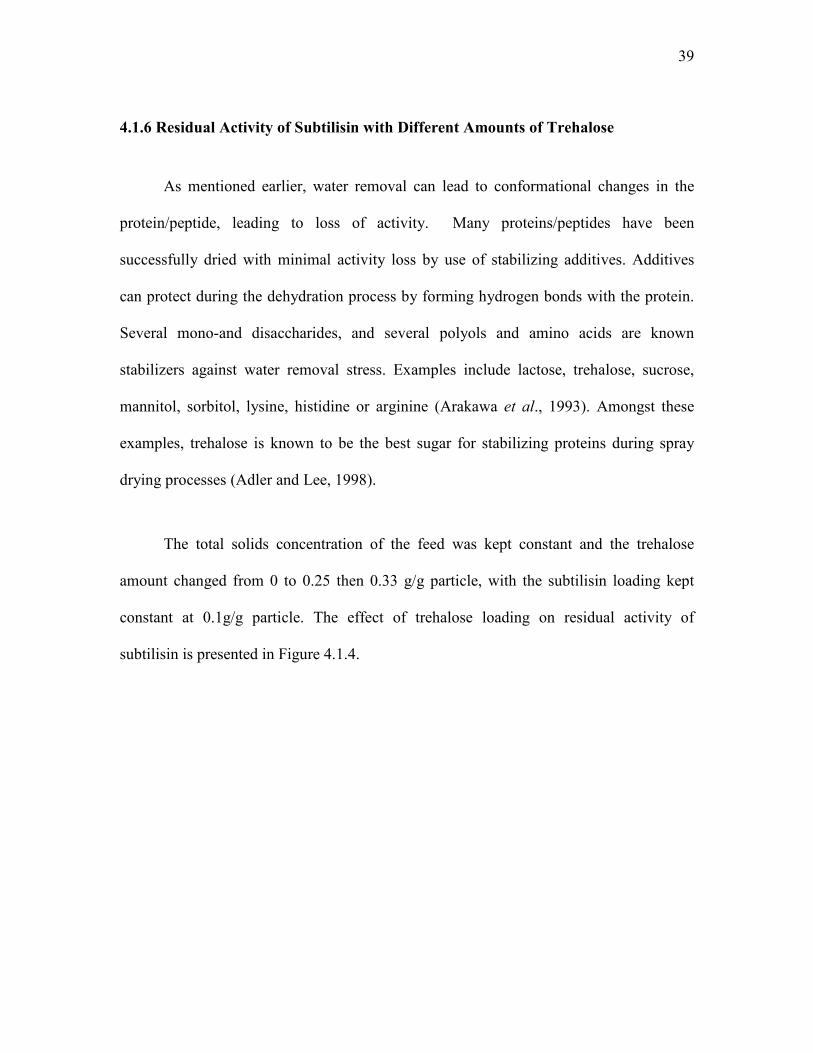
constant at 0.1g/g particle. The effect of trehalose loading on residual activity of
subtilisin is presented in Figure 4.1.4.
40
60
70
80
90
100
Residual Activity (%)
0 0.20 0.33
Trehalose [g/g particle]
Figure- 4.1.4. Effect of trehalose loading on residual activity of subtilisin within
microparticles. Spray drying operating conditions; Qlf = 5mL/min, Qda = 38 m3/h , Qaa =
667 L/h, Paa = 80 psi, C = 2% w/v, Protein loading = 0.1 g subtilisin/ g particle.
The presence of 20% trehalose in the formulation increases the residual activity of
subtilisin up to 90%. Further increase in trehalose did not affect the residual activity. It
might be concluded that the mixture of alginate and trehalose appear to promote the
stabilization of subtilisin during spray drying. This might be due to the ability of
trehalose to hydrogen bond with the proteins in the place of water during dehydration. A
second study was done with a higher protein loading (0.33 g subtilisin/g particle), and the
results are presented in Figure 4.1.5.
41
50
60
70
80
Residual Activity (%)
0 0.17
Trehalose [g/g particle]
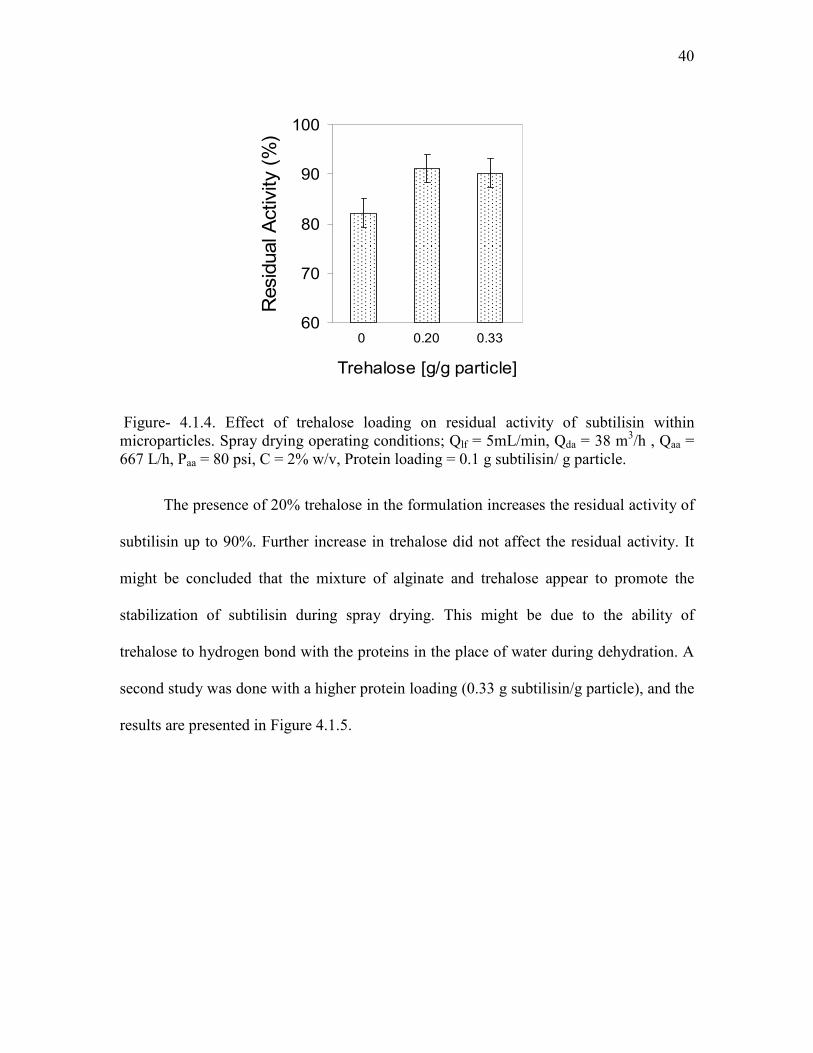
Figure 4.1.5 Effect of trehalose loading on residual activity of subtilisin within
microparticles. Spray drying operating conditions: Qlf = 5mL/min, Qda = 38 m3/h , Qaa =
667 L/h, Paa = 80 psi, C = 2 % w/v, Protein Loading=0.33 g protein/ g particle.
When the trehalose in the formulation was increased to 0.17 g/g particle, the
residual activity of the particles increased by 7 % compared to the activity of the particles
without the presence of trehalose. It can be concluded that the presence of trehalose in
alginate increases the stability of subtilisin within the particles, which results in higher
residual activity. It was also shown that more then 60% of the residual acitivity can be
recovered for particles having high protein concentration (0.33g/g particle). Similar
trends were also observed using sugar excipients with polysachharides. Bare et al. (1999)
spray dried cold adapted subtilisin in the presence of gum arabic and lactose mixture,
observing about 55% absolute increase in residual activity of subtilisin. DePaz et al.
(2002) showed that dextran-trehalose mixture showed full recovery of subtilisin activity
during freeze drying.

42
SEM image of the trehalose-alginate loaded with subtilisin are presented in Figure
4.1.6. The particles are spherical and have a smooth surface morphology and the smaller
particles were dimpled.
Figure 4.1.6. SEM image of the spray dried alginate-trehalose particles carrying
subtilisin. Alginate:trehalose ratio was 9:1. Scale bar represents 20 µm.

43
4.1.7 Effect of Storage Time on Residual Activity of Subtilisin
Along with the stability of the particles during spray drying, the storage stability
was also tested. Spray-dried powders were stored at 25oC and 25% relative humidity for
over 4 months. Figure 4.1.7 shows the residual activity of the particles with storage time.
60
80
100
0 4 8 12 16
Time (Weeks)
Residual Activity (%)
Figure 4.1.7 The residual activity of subtilisin loaded particles stored at 25 oC and
25% relative humidity relative to the activity of freshly prepared particles. Formulation
consists of trehalose:subtilisin (g/g particle) of 0.2:0.1(■), 0:0.1(●), 0:.0.25(▲), and
0:0.33(O)
As may be seen in Figure 4.1.7 the alginate-trehalose loaded particles retained
more then 90% of their initial activity during 4 months of storage. As the subtilisin in the
formulation was increased (0.1-0.33 subtilisin g/g particle) a decrease in the final residual
activity was observed. Also presence of trehalose in the formulation had a positive effect

44
on storage stability compared to particles produced without addition of any trehalose.
Within the first month of the storage period, all particles had more than 90 % residual
activity, however trehalose loaded particles showed nearly no activity loss within the first
month, but activity gradually decreased during the following 3 months. A similar trend
was observed for particles prepared without addition of trehalose, showing a slower
residual activity decrease rate within the first month. These trends show that within the
four months of storage, trehalose loaded particles showed the best storage stability.
4.2 Alginate Micro- and Nano Particles Produced by Spray Drying
In the first section of the results and discussion chapter some of the operating
parameters effecting the process parameter and particle properties were studied. In this
section an alternative single step procedure was proposed in order to enhance the
properties the alginate particles carrying proteins for oral drug delivery purposes.
Spray drying has been used previously by Coppi et al. (2001, 2002, 2004) to
produce alginate micro- and nano particles carrying proteins, such as BSA and a peptide
antibiotic, polymyxin. Although spray drying is a single step process, these earlier
published methodologies involved several additional steps to produce the final particulate
product. In this chapter, an alternative spray drying method is proposed and discussed to
produce alginate micro- and nano particles in a single step operation.
The method proposed by Coppi et al. (2001) as outlined in Figure 4.2.1, involved
spray drying of an alginate/protein solution forming particles which were subsequently
45
subjected to several additional steps to enhance the properties, such as ionic crosslinking
of the particles in CaCl2 aqueous solution and treatment of the particles in chitosan
solution to reinforce the alginate network and to improve adsorption across the intestinal
epithelia. In the final step, freeze drying was used as a second drying step, to remove
water and to recover the particles. However, these steps can alter some of the properties
of the particles. For example, the entrapped drug can be released to the aqueous medium
during the gellation step, and during surface treatment with chitosan. Moreover, pH
sensitive proteins can be affected due to the solubility requirements of chitosan (pH<5.5).
In addition, lyophylization (freeze drying) causes additional stress on particles and
proteins, such as changing the particle morphology and denaturation of the proteins due
to dehydration (Wang, 2000).

46
Figure 4.2.1: Schematic description of Coppi et al. (2001) and current method.
The scale bar represents10 microns.
Lyophylizatio
n
Final Product
Model
Protein
Spray
Dry
ing
Collecting particles &
Crosslinking with Ca++
Alginate Solution
Cen
trifugatio
n
Collecting particles &
Coating with Chitosan
C
entrifu
gatio
n
Collecting particles
Coppi et al., 2001 Current Method
Alginate Solution
Model Protein
Ca++
Glycol Chitosan
Spray
Dry
ing
Final Product
(Micro and Nano particles)

47
As an alternative, the single step procedure which forms the basis of the present
study, involved introduction of dilute Ca++
ions to a dilute alginate feed solution, along
with the protein and glycol-chitosan, where physical crosslinking of the alginate by dilute
calcium solution takes place forming sprayable low viscosity gel. In addition, glycol-
chitosan was used as an additive, to further reinforce the alginate network and improve
absorption of the particles. The SEM image of the particles produced is presented in
Figure 4.2.1. The final particles had smooth surface and spherical morphology, with
particle size ranging from a couple hundred nanometers to several microns. In the
following chapters, the stability, particle size distribution, morphology, formulation
aspects and protein release from the particles will be presented and discussed.
4.2.1 Stability and Size of Alginate Micro- and Nano Particles
One application for nanoparticles is in the oral delivery of therapeutic proteins.
Nanoparticles can appear in the lymph or blood circulation, following 10 min to 3 h after
dosing depending on the particle size and nutritional conditions (Hussein et al., 2001),
thus it is important to test the stability and the properties of the particles, as affected by
formulation parameters. The effect of Ca++
present in the alginate feed solution, on
stability and properties of micro and nano particles, such as particle size and protein
release, was examined. The amount of Ca++
(3-10 mM) and alginate solution
concentration (0.2-0.5%) was varied. Alginate and Ca++
concentrations were low due to
the viscosity limitation of the spray nozzle. At Ca++
ion concentrations greater than 10
mM, immediate viscous gel formation occurred, which was not suitable for
atomization.The stability of the resulting particles was tested by suspending in saline

48
solution (0.9%) at pH 6.8, and particles were observed under light microscope. Results
are presented in Table 4.2.1.
Table 4.2.1. Stability of micro- and nano particles produced by spray drying.
Spray dryer operating conditions; Qlf = 5mL/min, Qda = 38 m3/h , Qaa = 600 L/h, P
= 80 psi. The particles were suspended in saline solution (0.9%) for 3 h. The “-“
sign represents complete dissolution of the particles and the “+” sign represents
presence of particles.
Ca++ Concentration
in the Feed Solution
Alginate Concentration in the Feed
Solution (%,w/v)
0.2 % 0.3 % 0.5 %
3 mM - - -
5 mM + + -
10 mM + + +
Table 4.2.1 shows that the stability of the micro and nano particles was affected
by the concentration of Ca++
ions. The particles prepared with 3 mM Ca++
completely
dissolved at pH 6.8 in 3 h. However, the particles prepared with higher Ca++
showed
stability during 3 h of the test. Crosslinking of the alginate chains with calcium ions takes
place in the feed solution. With increasing calcium ion concentration , there is a higher
degree of crosslinking, increased the stability of the resulting particles. When there is
insufficient crosslinking and entanglements of the polymer chains, the particles swell and
disolve when dispersed into a saline solution, particularly as the non-gelling sodium in
the saline displaces the calcium in the particle matrix. It was observed that the particles
produced with higher calcium concentrations were more stable in saline solution (0.9%),
therefore preparation of particles with higher calcium concentration in the feed solution is
more suitable for oral delivery purposes.

49
The objective was to produce particles within an appropriate size range to be
taken up by the intestinal mucosa. Thus, the effect of alginate concentration on particle
size was examined. The particles were sized by laser diffraction and the size distribution
is presented in Table 4.2.2. The mean size of particles increased from 3.17 µm to 4.18
µm as the alginate concentration in the feed solution increased from 0.2 % to 0.5 %,
while keeping the calcium concentration constant. As the alginate concentration
increased, higher SPAN values were obtained, which indicates broader size distribution.
This trend might be due to the increase in the viscosity of the solution, since the higher
the alginate concentration in the feed solution, the higher is the viscosity of the feed,
consequently leading to larger droplets and larger particles. All the resulting particles
prepared with different amounts of alginate had appropriate size for oral absorption.
Table 4.2.2 Size distribution of the alginate micro- and nano particles with
different amount of alginate in the feed solution. The particles were produced with
different amounts of alginate , 0.2, 0.3 and 0.5%. The Ca++
ion concentration was
constant at 10 mM. Spray drying operating conditions; Qlf = 5 mL/min, Qda = 38 m3/h ,
Qaa = 600 L/h, P = 80 psi.
Alginate concentration in the
feed solution D[0.1] D[0.5] D[0.9] SPAN
0.2 1.61 3.17 11.5 3.12
0.3 2.12 3.41 13.2 3.25
0.5 2.72 4.18 19.1 3.92
In order to further investigate and improve the particle properties, 0.3% alginate and
10 mM Ca++
in the feed solution formulation were selected for further study, due to the
lower recovery of the particles with 0.5% alginate, which might be due to the insufficient
drying.

50
4.2.2 Protein Release from Micro- and Nano Alginate Particles
For oral delivery, it is important to examine the release profile of proteins from the
encapsulated matrix. In order to study the effect of Ca++
on protein release, Ca++
concentration was varied (5 mM, 10 mM) and a control batch prepared without calcium.
BSA was added along with 0.3% alginate, where the protein:alginate ratio was held
constant at 1:9. The effect of Ca++
on protein release is presented in Figure 4.2.2, where
the released percentage is plotted with time. The release studies were carried out in saline
solution (0.9 %) at pH 6.8.
0
20
40
60
80
100
120
0 15 30 45 60 75 90
time (min)
Protein Released (%)
Figure 4.2.2: Release profile of BSA from alginate particles produced with 0 (●), 5
(▲) and 10 mM (■) Ca++
. Release was carried out in saline solution at pH 6.8. Particles
were formed from 0.3% alginate at protein to alginate ratio 1:9. Data shown are the
standard deviation of the mean values of a minimum of 3 repeated experiments.
51
All of the profiles showed a burst release profile, with about 60% of the BSA released
in the first 5 min. Particles without Ca++
dissolved in 15 min and more than 90% of the
BSA was released. Particles prepared with 10 mM Ca++
showed a nearly constant release
rate after 15 min and more than 90% of the protein was released at the end of 75 min.
Initially, the burst release profile might be due to the swelling and disintegration of the
particle structure, however particles prepared with calcium, showed a sustained release
profile after 15 min. The effect of calcium on the release profile, is likely due to the
change in permeability of the particles due to the higher degree of physical crosslinking
taking place in the feed and polymer entanglements during the formation of the particles.
4.2.3 Protein Release from Particles Formulated with Glycol-chitosan and Calcium
Alginate
As mentioned earlier, the objective was to investigate an encapsulation method that
would form nanoparticles in single step operation. Glycol chitosan, a positively charged
polysaccharide, was used as an additive to enhance the properties of the particles, since it
is known to reinforce the negatively charged alginate network and to improve the
intestinal uptake of the particles, while decreasing the particle permeability. Glycol-
chitosan was selected as it is water-soluble at pH 7.4 and forms polyion complexes with
negatively charged polymers, such as alginate (Sakai et al., 2000).
The aim of this experiment was to understand the effect that the amount of glycol-
chitosan had on the release profile of BSA. The ratio of glycol-chitosan:alginate:protein
was varied and protein release plotted with time in Figure 4.2.3. Release was carried out
in different simulated pH environment of the gastro intestinal track.

52
0
20
40
60
80
100
0 30 60 90 120 150 180 210 240 270
time (min)
Protein Released (%)
Figure 4.2.3: Release profile of BSA from glycol chitosan-alginate particles produced by
spray drying prepared at formulation ratios of glycol chitosan:protein:alginate, 0:2:18
(O); 2:2:16 (▲); 3:2:15 (●); and 4:2:14 (■) in hydrochloric acid at pH 1.2 and phosphate
buffer at pH 6.8. The feed solution consisted of 0.3% alginate and 10 mM Ca++
. Data
shown are the standard deviation of the mean values of a minimum of 3 repeated
experiments.
Particles formulated with glycol chitosan showed around 40% release after 2 h in
the low pH, stomach simulation medium. When the particles were transferred into a
simulated intestinal media, a sharp release was observed within the first 5 min, which
might be due to particle swelling. The particles formulated without glycol chitosan or low
glycol chitosan content, reached equilibrium within the first 30 min of the simulated
intestinal environment, whereas the formulation having higher glycol chitosan (4:2:14)
reached the equilibrium after 120 min. Figure 4.2.5 indicates that protein release was
affected by increased glycol-chitosan in the formulation. This result was expected, since
glycol chitosan can form a polyion complex with alginate decreasing solute diffusivity.
pH = 1.2
pH = 6.8

53
However, the buffer system used can also affect protein release, since phosphate ions can
remove calcium ions from the crosslinked alginate network, consequently the
permeability of the particles is affected. In addition, Ca++
concentration was not changed
as the chitosan to alginate amount was varied, effectively increasing the ratio of Ca++
to
alginate, consequently the crosslinking of the alginate chains might also increase, which
would affect solute diffusivity.
Alginate particles were also formulated with subtilisin and lysozyme, which are
smaller proteins than BSA. In these experiments the ratio of chitosan:protein:alginate was
4:2:14. Release profile of the particles is presented in Figure 4.2.4.

54
0
20
40
60
80
100
0 30 60 90 120 150 180 210 240 270
time (min)
Protein Released (%)
Figure 4.2.4 Release profile of BSA (●), subtilisin (▲) and lysozyme (■) from chitosan-
alginate particles in hydrochloric acid buffer at pH 1.2 and phosphate buffer at pH 6.8.
Particles were formulated from 0.3% alginate and 10 mM Ca++
. Data shown are the
standard deviation of the mean values of a minimum of 3 repeated experiments.
All particles released more than 35% of the protein load within 30 min in the
simulated stomach environment. After 2 h, the particles were transferred to a simulated
intestinal environment at pH 6.8. Within the first 5 min, a second burst release profile
was observed, possibly due to the swelling of the particles. Although the positively
charged lysozyme (pI = 11.4) and subtilisin (pI = 9.4) had different molecular weights,
they showed similar release profiles, possibly due to the large pore size of the resulting
particles compared to the molecular size of the proteins. However, BSA showed a
slightly slower release profile, which might be due to the larger molecular size of the
protein compared to the pore size of the particles.
pH = 1.2
pH = 6.8

55
4.2.4 Physical Properties of the Chitosan-Alginate Particles.
Chitosan-alginate particles were tested for particle size, protein loading and
morphology. The final protein loading within the particles and the particle size
distribution is presented in Table 4.2.3.
Table 4.2.3 Comparison of particle size distribution of chitosan-alginate particles
carrying different proteins. The chitosan:protein:alginate ratio was 4:2:14. The
feed solution contained 0.3% alginate and 10 mM Ca++
. Spray drying operating
conditions; Qlf = 5mL/min, Qda = 38 m3/h , Qaa = 600 L/h, P = 80 psi.
Protein D[0.1] D[0.5] D[0.9] SPAN Encapsulation
[%]
BSA 2.16 3.17 12.8 3.36 96±2
Subtilisin 2.11 3.53 12.1 2.83 94±1
Lysozyme 2.01 3.16 13.1 3.51 95±2
The mean particle size D[0.5], was found to be around 3.5 µm for subtilisin
loaded particles, while those loaded with BSA and lysozyme had mean size around 3.16
µm. SPAN values showed a relatively broad size distribution. For all of the particles,
encapsulation yield was more than 94%.
The protein loaded particles showed spherical morphology with smooth surface as
illustrated in Figure 4.2.5.

56
Figure 4.2.5. SEM images of protein loaded particles. The scale bar represents 10
microns. The particles are loaded with lysozyme (a), subtilisin (b) and BSA (c).
4.2.5 Protein Distribution Within the Particles
The distribution of the protein throughout the polymer matrix was examined by
confocal laser scanning microscopy with florescent labeled BSA, as shown in Figure
4.2.6. The particles show a donut-like structure with hollow center, and protein
deposition toward the particle surface. This might be due to evaporation of the water

57
from the droplet surface, carrying solutes from the particle core to the surface during
formation.
Figure 4.2.6 Confocal laser scanning microscope image of glycol-chitosan alginate
micro- and nano particles carrying BSA. The green sections represent the presence of
FITC labeled BSA. Scale bar represents 3 µm.
As mentioned earlier, in lab scale spray dryers, the time required to dry a single
atomized droplet is expressed in milliseconds. During that extremely short period of time,
solutes such as proteins can be assumed to be stationary during the formation of the
particles, however this may not be the case for formulations where total solid
concentration is low and the selected encapsulation matrix material can form porous
networks, such as the present alginate/protein (BSA) system.
During the formation of particles in spray drying, two characteristic times are
important, the first being the time required for a solute to diffuse from the edge of the
58
droplet to it’s center, defined by R2/D, where R is the radius of the droplet and D is the
solute diffusion coefficient, and second being the total drying time, td, for a droplet. The
ratio of these two characteristic times defines the peclet number, Pe = R2/ td D which
characterizes the relative importance of diffusion to convection. If the drying of a droplet
is sufficiently slow, Pe<1, and solutes have time to diffuse throughout the droplet,
yielding relatively dense particles. When Pe>1 the particles have insufficient time to
diffuse from the surface to the center of the droplet (Tsapis et al.,2002). Also when Pe>1,
the water molecules must diffuse from the center to the surface, since evaporation only
occurs from the surface, carrying along solutes from within the droplet towards the
surface. Therefore when Pe>1, the diffusion of the solutes from the center to the surface
of the particle might be more favorable than diffusion of solutes from the surface to the
center, due to the mobile phase, water, which is diffusing from the particle core to the
surface. This would be a stronger possibility, if the solid concentration is low. In addition,
the encapsulation matrix material, which tends to form porous polymeric network
structure, can also play an important role in the final distribution of the solutes within the
particle matrix. For example, if the proteins have a smaller size than the pores of the
encapsulated polymeric network, as the water migrates to the surface for evaporation, the
protein can migrate as well without interruption.
For the present system, the total drying time of the droplet was calculated as 8.5
ms, whereas the diffusion coefficient of the BSA molecule was estimated to be 990
µm2/s. Pe was calculated as 240, (calculations appear in sections to follow) which
indicates that for proteins, the driving force is dominated by convention, instead of
diffusion. It might be concluded that the proteins which were at the surface of the droplet
during formation of the particle, did not have sufficient time to diffuse from the surface to

59
the center. Moreover, the mobile phase, water, continuously diffused from the center to
the surface of the droplet, while it carried the other solutes, such as polymer chains and
proteins as illustrated in Figure 4.2.7. The hollow region at the center of the particles also
confirms this theory that the other solutes, such as polymer chains, were being drawn
outwards during evaporation, forming a hollow core.
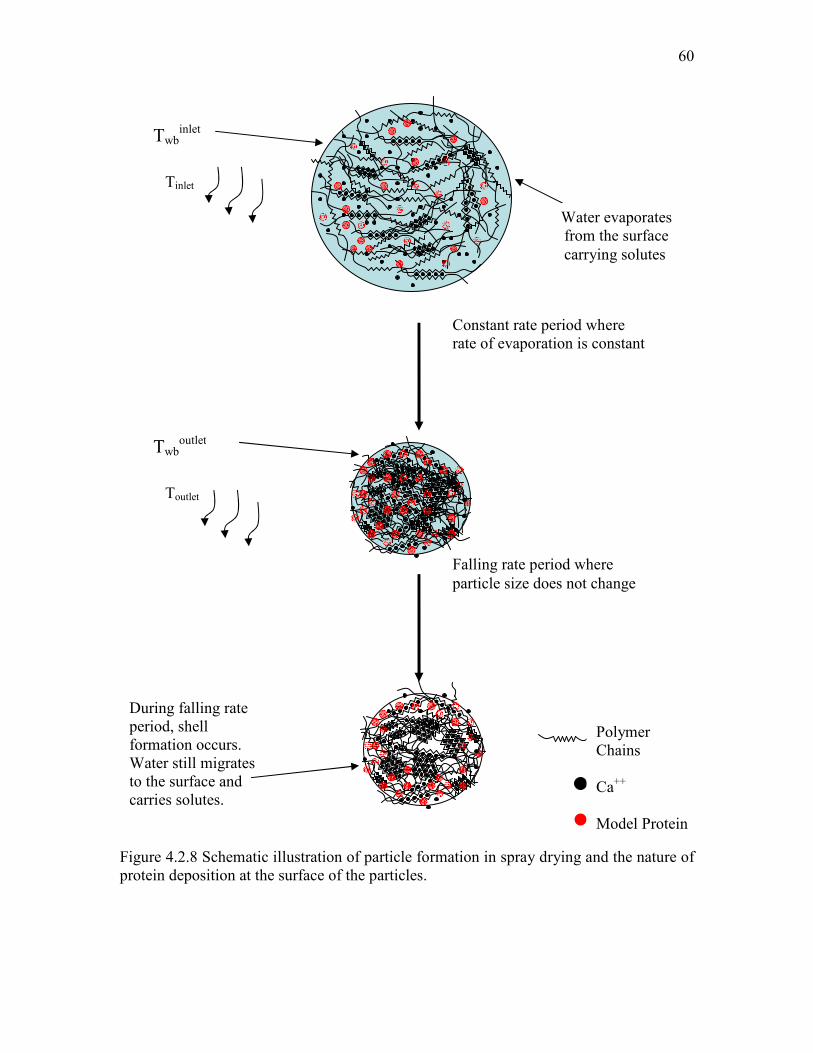
60
Figure 4.2.8 Schematic illustration of particle formation in spray drying and the nature of
protein deposition at the surface of the particles.
Constant rate period where
rate of evaporation is constant
Falling rate period where
particle size does not change
Twbinlet
Twboutlet
Polymer
Chains
Ca++
Model Protein
Tinlet
Toutlet
Water evaporates
from the surface
carrying solutes
During falling rate
period, shell
formation occurs.
Water still migrates
to the surface and
carries solutes.

61
In order to discuss protein distribution within the particle, the Peclet number was
calculated. The total drying time of a single droplet was calculated through a series of
heat and mass balance equations, and diffusion coefficient of the protein solute, was
estimated through the Stokes-Einstein equation.
4.2.5.1 Estimation of Total Drying Time of Single Alginate Droplet.
The drying of a spray droplet containing low concentration of alginate (0.3%) can
be divided into two phases, initial constant rate period and falling rate period. Previously
total drying time of a droplet was calculated by Adler and Lee (1999), during these
calculations heat and mass transfer equations presented in Master’s (1991) was used. In
order to estimate the Pe number of the alginate droplets during spray drying process the
regarding equations was used. In the initial constant rate period, the rate of evaporation
was assumed to be constant, whereas in the falling rate period, the particle size was
assumed to be constant due to the crust present at the droplet surface (Masters,1991). In
the initial constant rate period, water concentration at the droplet surface and hence the
rate of evaporation, dW/dt was calculated with the regarding equation;
λ
π TDk
dt
dW avdcr
∆=
2
where, T∆ is the log mean temperature difference;
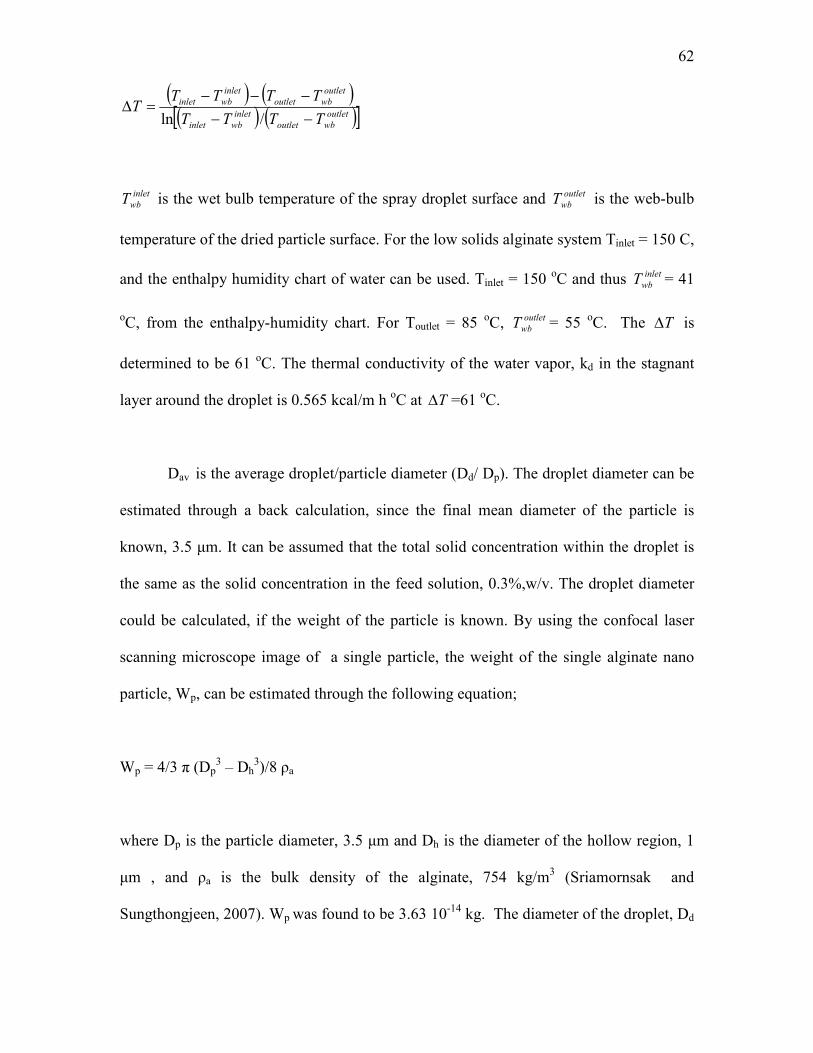
62
( ) ( )( ) ( )[ ]outlet
wboutlet
inlet
wbinlet
outlet
wboutlet
inlet
wbinlet
TTTT
TTTTT
−−
−−−=∆
/ln
inlet
wbT is the wet bulb temperature of the spray droplet surface and outlet
wbT is the web-bulb
temperature of the dried particle surface. For the low solids alginate system Tinlet = 150 C,
and the enthalpy humidity chart of water can be used. Tinlet = 150 oC and thus inlet
wbT = 41
oC, from the enthalpy-humidity chart. For Toutlet = 85
oC, outlet
wbT = 55 oC. The T∆ is
determined to be 61 oC. The thermal conductivity of the water vapor, kd in the stagnant
layer around the droplet is 0.565 kcal/m h oC at T∆ =61
oC.
Dav is the average droplet/particle diameter (Dd/ Dp). The droplet diameter can be
estimated through a back calculation, since the final mean diameter of the particle is
known, 3.5 µm. It can be assumed that the total solid concentration within the droplet is
the same as the solid concentration in the feed solution, 0.3%,w/v. The droplet diameter
could be calculated, if the weight of the particle is known. By using the confocal laser
scanning microscope image of a single particle, the weight of the single alginate nano
particle, Wp, can be estimated through the following equation;
Wp = 4/3 π (Dp3 – Dh
3)/8 ρa
where Dp is the particle diameter, 3.5 µm and Dh is the diameter of the hollow region, 1
µm , and ρa is the bulk density of the alginate, 754 kg/m3 (Sriamornsak and
Sungthongjeen, 2007). Wp was found to be 3.63 10-14
kg. The diameter of the droplet, Dd

63
can be calculated as follows. If the initial feed solution total concentration is 0.3%,w/v,
what is the volume required to produce a particle weighing 3.63 10-14
kg.
mD
mr
cmmlg
kgrV
d
d
dd
µ
µ
π
4.28
2.14
10 *1.12100*3.0
10*63.3)(
3
4 39-14
3
=
=
===−
By averaging the Dd and Dp which are assumed to be 28.4 µm and 3.5 µm respectively,
Dav = 16 µm. λ is the latent heat of vaporization of water = 540 kcal/kg. The evaporation
rate can be calculated to be;
kgkcal
CmC
TDkcr
dt
dW
oo
avd
/540
61*61* h kcal/m 0.565*2
2
µπ
λ
π
=
∆=
= 6.4 kg 10-6 /h
The total mass of water removed, crW∆ , in constant-rate period can be calculated through;
1
33 )(3
4WrrW dwcr ρπ −=∆
where rd is the droplet radius, rp is the particle radius, ρ is the density of the
alginate/water solution equal to 996 kg/m3 . rw is the diameter of the droplet and assumed
to be 10 µm and rd = 3.5 µm. W1 is the water content of the spray solution (0.997kg/kg).
Wcr can be calculated;

64
0.997kg/kg* kg/m3996*)875.12.14(3
4
)(3
4
3333
1
33
mm
WrrW pdcr
µµπ
ρπ
−=
−=∆
= 1.185 10-11
kg
The drying time of the droplet in the constant rate period, tcr, can be calculated by
(Masters,1991) ;
=∆
=crdtdW
Wt cr
cr/
1.185 10-11
kg / 6.4 10-6 kg/hr = 6.7 ms
During the calculation of the falling rate, the crust or solid shell formation occurs and
it is assumed that the particle size does not change further, and the rate of evaporation is
given by frdtdW / ;
particledry ofwt *dt
dW
dt
dWfr =
where,
sc
d
D
Tk
dt
dW
ρλ 2
12 ∆=

65
and dk a is the thermal conductivity of the drying air around the particle, 0.0236 kcal/h m
oC at T∆ = 61
oC. Dc is the critical particle diameter which is equal to the final diameter
of the particle, 3.5 µm. ρs is the average particle density during the falling rate period, and
the particle density is assumed to be 773 kg/m3, by volumetric average of the water and
alginate content of the particles at the critical point. dW/dt can be calculated as follows;
( )s
mkgmkgkcal
CCmhkcal
D
Tk
dt
dW oo
sc
d /937/774*5.3*/540
61*./0236.0*1212322==
∆=
µρλ
skgkgsfrdt
dW/10*4.310*63.3*/937 1114 −− ==
The total mass of water removed during the falling rate period can be calculated by
difference in initial weight of the droplet (Win) and the water removed during constant
period (∆Wcr) and the final weight of the particle (Wp).
∆Wfr = Win – (∆Wcr + Wp)
For a droplet having diameter of 28.4 µm, where ρ is the density of alginate/water
solution, 996kg/m3.
Win = 4/3 π (Dd/2)3 ρ
= 1.195 10-11
kg
∆Wf = 1.195 10-11
kg –(1.185 10-11
kg + 3.63 10-14
kg)

66
= 6.37 10-14
kg
=∆
=frdtdW
Wt
fr
fr/
6.37 10-14
kg / 3.4 10-11
kg/s = 1.87 ms
The total time required to dry a nano alginate particle is
td = 6.7ms+1.87ms ~8.5 ms
4.2.5.2 Estimation of Time Required for a BSA Molecule to Diffuse from the Surface
to the Center of the Droplet
The diffusion of BSA within the droplet can be calculated by Stokes-Einstein Equation:
H
Bs
R
TkD
πη6=
where Bk is Boltzman’s constant, η the viscosity of the solvent (water), T is the
temperature and HR is the hydrodynamic radius of the solute.
For BSA system
Bk = 1.3806503 × 10⁻²³
m2 kg s
-2 K
-1
T = 41+85 / 2 = 63 oC = 331.3 K (the average of wet bulb temperature and outlet
temperature)
η = 0.544 cp at 63 oC
HR = 4.5nm acquired from Böhme and Scheler, 2007
=
×
=− mx
KDs9
2
223-
105.4*·m·s
g 544.0*6
K 331.13* *s
kg m 10 1.3806503
π
99 µm2/ s

67
4.2.5.3 Calculation of Peclet Number
Pe = R2 / td D
Where R is the radius of the droplet and td is the total drying time of the droplet and D is
the diffusitivty constant of a BSA molecule.
Pe = (14.2µm)2/ (99 µm
2/ s * 8.5ms) = 240
4.2.6 Comparison of Present Study with a Previous Method
As mentioned, several methods have been proposed to produce micro- and nano
particles by spray drying. But the proposed methods involved use of organic solvents and
several process steps. Previously, Coppi et al.,(2001) proposed production of alginate
micro- and nano particles by spray drying for oral drug delivery purposes. However, the
proposed method included several additional steps to enhance properties of the alginate
particles, including crosslinking the particles in CaCl2 aqueous solution and treatment of
the particles with chitosan to reinforce alginate network and a final lyophilization step
was used for recovery. (schematic description of the process illustrated in Figure 4.2.1).
Several attempts were made in the present investigation to reproduce the method
proposed by Coppi et al., 2001. During aqueous treatment of the particles with calcium
and chitosan, particle aggregation and disintegration were observed. Furthermore, the
lyophilization step altered the morphology of the particles and fabric like structures were
formed. The Coppi method was difficult to reproduce due to additional steps involved.
Moreover, the published data showed around 30 % protein release during these additional
steps.

68
The current proposed method and the previously published method are compared
in Table 4.2.4. The present study and the previously proposed methodology are compared
based on the model protein, BSA, which was used in both protocols.
Table 4.2.4. The comparison of current proposed method with Coppi et al., 2002.
Coppi et al., (2002) Present Study
Total Process Time 14 hours
100 minutes
Final Protein Loading 63 % 94 %
Total Protein Released in
Simulated Stomach
Environment
30 % 35 %
Mean Particle Size 2.5 µm 3.5µm
The total time required to produce 2 grams of micro- and nano alginate particles
carrying proteins. Assuming 12 hour lyophilization process.
The present proposed method was much faster being a single step protocol, thus it is
relatively easier to reproduce. The two methods showed similar release profiles in
simulated stomach environment, around 30% of the encapsulated BSA was released in
the previous work done by Coppi et al., 2002, whereas in the present study around 35 %
protein release was observed. However, it should be noted that in the present study the
protein association of the particles is around 30 % higher, thus around 30% more protein
is likely to be carried to the intestinal environment. For both systems, the mean particle
size (<5µm) was within the desired range for oral absorption across the intestinal
epithelia. The comparison of the two system shows that the present single step protocol
is more efficient, in terms of process time and protein encapsulation.

69
CHAPTER 5.0 CONCLUSIONS
Stable calcium alginate/chitosan protein-loaded micro- and nanoparticles were
produced using a proposed single step methodology involving the spray drying of a
polymer/protein solution. This method eliminates the need for toxic solvents and multiple
processing steps involved in alternative methods, and leads directly to a stable dry
product within a short processing time. The following findings and conclusions represent
contributions to our understanding of the production of alginate micro- and
nanoparticulate proteins by spray drying.
1 Increase in inlet air temperature up to 175 oC of the spray dryer did not significantly
affect subtilisin residual activity, but improved the product yield. The highest particle
yield of 40% was achieved at 175 oC and highest activity yield of 80% achieved at
150 oC. Particle yield was also found to be dependant on the feed rate, with highest
yield at 5 mL/min.
2 The moisture content of the spray dried particles was found to be dependent on the
inlet temperature of the drying air. The moisture content was 7 % for Tinlet = 125 oC,
whereas it was decreased to 5.5 % for Tinlet = 150 oC and 175
oC.
3 Subtilisin residual activity increased with increase in alginate:subtilisin ratio.
Presence of alginate in the feed solution increased the residual activity of the
subtilisin by more than 50% compared to spray drying of free subtilisin feed solution.
The particles containing 0.33 g subtilisin/ g particle, exibited more than 65 % residual
activity. The encapsulation yield of subtilisin was more than 95%.

70
4. The formulations containing 0.2g trehalose /g showed residual activity of 90%.
Increase in the amount of trehalose in the formulation (0.33g trehalose /g particle) did
not significantly affect the residual activity.
5. Particles formulated with 0.2 g trehalose / g particle exhibited greater protein stability
than the formulations without presence of trehalose, with over 4 months of storage,
maintaining more than 80% of their initial activity. The formulations prepared with
higher subtilisin:alginate ratio showed less protein stability during the shelf life
experiments.
6. Spray dried particles showed spherical morphology. The larger particles showed
more spherical morphology, whereas smaller particles were dimpled. Trehalose
loaded particles showed a smoother surface.
7. The alginate concentration in the feed solution affected the particle size. Particles
prepared with less alginate had smaller mean diameter and narrower size distribution.
The size ranged from 2.51 µm to 4.91µm, which was within the desirable range for
absorption across the intestinal mucosa.
8. Chitosan-Ca-alginate particles were produced in a single step process by spray
drying. The mean diameter was around 3.5 µm and particles had spherical
morphology and smooth surface. The particles showed 35 % protein release in a
simulated stomach environment.

71
9. In vitro release profiles of the resulting particles did not show significant variation for
different molecular weight proteins.
10. The confocal laser scanning microscopy image of the particles showed the presence
of fluroscent-labeled protein towards the outer surface of the particles. The particles
had a donut shaped structure with a hollow central region.
11. Peclet number and drying time was calculated for the particles and found to be 340
and 8.5ms. These results show that during particle formation, convection was more
dominant than diffusion of the solutes, leading to the formation of a hollow central
region and protein distribution toward the surface of the particle.
12. The smallest mean particle size of 2.5 µm was achieved with 0.2% alginate feed
concentration with the spray drying operation conditions; Qlf = 5mL/min,
Qda= 38, m3/h, Qaa = 600 L/h, P = 80 psi. The formulation consisting of an
alginate:trehalose:subtilisin ratio of 7:2:1 gave the highest subtilisin residual activity.

72
6.0 REFERENCES
Adler M., and Lee G, 1999. Stability and surface activity of lactate dehydrogenase in
spray dried trehalose, J. Pharm. Sci. 88:2, 199-208.
Allison S.D., Chang B., Randolph T.W. and Carpenter J.F., 1999. Hydrogen bonding
between sugar and protein is responsible for inhibition of dehydration-induced
protein unfolding. Arch. Biochem. Biophys. 365, pp. 289–298.
Banerjee, U. C., Sani, R. K., Azmi, W. & Soni, R. ,1999. Thermostable alkaline protease
from Bacillus brevis and its characterization as a laundry detergent additive.
Process Biochem. 35, 213-219. . (Ottessen, 1970).
Barre G, Diakiese A, Zgoulli S, Sabri A, Gerday C, Thonart P. , 1999. Modification of
the thermoresistance to spray-drying of a cold adapted subtilisin by genetic
engineering. Appl. Biochem. and Biotech. 77-79, 857-865.
Begin A, Castaigne F, Goulet J. 1991. Production of alginate beads by a rotative
atomizer. Biotechnol Tech 5:459–464.
Benita S, 1996, , Microencapsulation methods and industrial application, Marcel Dekker,
Inc., NY
Bhagat, H.R., Mendes, R.W., Mathiowitz, E., Bhargava, H.N., 1994. Kinetics and
Mechanism of Drug Release from Calcium Alginate Membrane Coated Tablets.
Drug Dev. Ind.Pharm. 20, 387–394.
Blanco M.D., Bernardo M.V., Sastre R.L., Olmo R., Muñíz E. and Teijón J.M., 2003.
Preparation of bupivacaine-loaded poly(ε-caprolactone) microspheres by spray
drying: drug studies and biocompatibility, Eur. J. Pharm. Biopharm. 55, pp. 229–
236.

73
Blanco, M.D., Sastre, R.L., Teijón, C., Olmo, R., Teijón, J. M., 2005. 5-Fluorouracil-
loaded microspheres prepared by spray-drying poly(d.l-lactide) and poly(lactide-co-
glycolide) polymer: characterization and drug release. J. Microencapsul. 22, 671–
682
Broadhead J, Edmond Rouan S.K., and Rhodes C. T., 1992. The spray drying of
pharmaceuticals. Drug Development and Industrial Pharmacy 18(11): 1169-1206
Böhme U. and Scheler U., 2007. Effective charge of bovine serum albumin determined
by electrophoresis NMR. Chemical Physics Letters. Vol 435, (4), 342-345
Carpenter J.F. and Manning M.C., 2002,, Rational Design of Stable Protein
Formulations, Theory and Practice, Kluwer Academic/Plenum Publishers
Chan A. Granulation of Active Subtilisin, 2003 Master’s Thesis, Queen’s University.
Coppi G., Iannuccelli V., Leo E., Bernabei T.M., Cameroni R., Chitosan-Alginate
microparticles as a Protein Carrier, Drug Dev. Ind. Pharm, 2001, 27(5), 393-400
Coppi G., Iannuccelli V., Sala N , Bondi M., 2004 Alginate microparticles for Polymyxin
B Peyer's patches uptake: microparticles for antibiotic oral administration. Journal
of Microencapsulation, (8 ): 21
Coppi G , Iannuccelli V , Leo E. , Bernabei M. T., Cameroni R. 2002. Protein
immobilization in crosslinked alginate microparticles. Journal of
Microencapsulation. Vol. 19, (1).
Çelik M. and Wendel S., 2005. Spary Drying and Pharmecuticals Applications.
Handbook of Pharmecutical Granulation Technology, ed. Parikh D.P., Taylor and
Francis, NY. 129-155

74
DePaz R.A., Dale D.A., Barnett C.C., Carpenter J.F., Gaertner A.L., Randolph T.W,
2002. Enzyme and Microbial Technology, Volume 31, Number 6, 1 November pp.
765-774(10)
Hu Y., Jiang H., Xu, C., Wang Y. and Zhu K., 2005. Preparation and characterization of
poly(ethylene glycol)-g-chitosan with water and organosolubility, Carbohydrate
Polymer, 61 : 472–479.
Hussain N, Jaitley V, Florence AT. 2001. Recent advances in the understanding of uptake
microparticulates across the gastrointestinal lymphatics. Adv Drug Deliv Rev
50:107–142.
Illum L., 1998, Chitosan and its use as a pharmaceutical excipient, Pharm. Res. 15:
1326–1331
Kim, C.K. and Lee, E.J., 1992. The Controlled Release of Blue Dextran from Alginate
Beads. Int. J. Pharm. 79: 11–19.
Lee G., 2002 “Spray-Drying of Proteins” . In: Carpenter, John ; Manning, Mark :
Rational Design of Stable Protein Formulation. 13. New York : Kluwer
Academic/Plenum Publishers, : 135-158.
Lee S. E. , Park
K. H. , Park
I. S. and Na K., 2007. Glycol chitosan as a stabilizer for
protein encapsulated into poly(lactide-co-glycolide) microparticle. International
Journal of Pharmaceutics, 338: 310–316
Maa Y. and Hsu C.C., 1997. Protein denaturation by combined effect of shear and air–
liquid interface. Biotechnol Bioeng 54:503–512.
Maa Y. F. and Prestrelski S. J., 2000. Biopharmaceutical powders: particle formulation
and formulation considerations, Curr. Pharm. Biotechnol. 1 : 283–302.

75
Maa Y-F, Costantino HR, Nguyen P-A, Hsu CC. The effect of operating and formulation
variables on the morphology of spray-dried protein particles. Pharm Dev Technol.
1997;2(3):213-223
Maa, Y. F. and Hsu, C. C. , 1997. Protein denaturation by combined effect of shear and
air-liquid interface. Biotech. Bioeng. 54, 503-512.
Masters K., 1991. Spray-Drying Handbook. Longman Scientific and Technical, Essex
U.K. 5TH
ed.
Namaldi, A., Çalik, P., and Uludag, Y. 2006. Effects of spray drying temperature and
additives on the stability of serine alkaline protease powders. Drying Technology:
24: 1495.
Pavenetto F, Genta I, Giunchedi P, Conti B. 1993. Evaluation of spray drying as a
method for polylactide and polylactide-co-glycolide microspheres preparation.
Journal of Microencapsulation 10:487–497.
Pinto Reis, C., Ronald J. Neufeld, A.J. Ribeiro and F. Veiga. 2006. Nanoencapsulation I.
Methods for preparation of drug-loaded polymeric nanoparticles. Nanomedicine:
Nanotechnology, Biology and Medicine, 2: 8-21
Reis CP, Ribeiro AJ, Neufeld RJ, Veiga F. 2004. Insulin-loaded alginate nanoparticles
obtained by emulsification/internal gelation. XII International workshop on
bioencapsulation; 24–26 September 2004; Vitoria. Spain: Servicio editorial
universidad del Paı´s Vasco. p 251.
Rosenberg, M., Kopelman, I.J., and Talmon, Y. 1990. Factors affecting retention in
spray drying microencapsulation of volatile materials. J. Agric. Food Chem. 38:
1288-1294.
76
Sakai S., Ono T., Ijima H. and Kawakami K., 2000. “Control of molecular weight cut-off
for immunoisolation by multilayering glycol chitosan-alginate polyion complex on
alginate-based microcapsules Control of molecular weight cut-off for
immunoisolation by multilayering glycol chitosan-alginate polyion complex on
alginate-based microcapsules”. Journal of Microencapsulation. 691-699
Samborska, K.; Witrowa-Rajchert, D.; Gonc¸alves, A. Spray-drying of a-amylase—The
effect of process variables on the enzyme inactivation. Drying Technology 2005,
23, 941–953.
Sarmento, B., S. Martins, A. Ribeiro, F. Veiga, R.J. Neufeld and D. Ferreira. 2006.
Development and comparison of different nanoparticulate polyelectrolyte
complexes as insulin carriers. Intern. J. Peptide Research and Therapeutics, 12: 131-
138
Smidsrød, O. and Skjåk-Bræk, G , 1990. Alginate as immobilisation matrix for cells.
Trends Biotechnol. 8: 71-78.
Sriamornsak P. and Sungthongjeen S.,2007. Modification of Theophylline Release With
Alginate Gel Formed in Hard Capsules. AAPS PharmSciTech; 8(3), article 51
Takeuchi H., Yasuji T. , Yamamoto H. and Kawashima Y., 2000. Spray-Dried Lactose
Composite Particles Containing an Ion Complex of Alginate-Chitosan for
Designing a Dry-Coated Tablet Having a Time-Controlled Releasing Function
Pharm. Res. 2000, 17, 94–99
Takeuchi H., Yasuji T., Hino T., Yamamoto H. and Kawashima Y., 1998. Spray-dried
composite particles of lactose and sodium Alginate for direct tabletting and
controlled releasing, International Journal of Pharmaceutics, 174 , 91-100

77
Thies C, 2005, Microencapsulation, Kirk-Othmer Encyclopedia of Chemical
Technology, 4th Edition, John Wiley, Vol. 16, p. 628-651
Tønnesen HH and Karlsen J. ,2002. Alginate in drug delivery systems, Drug Dev. Ind.
Pharm. 28 pp. 621–630.
Tripp B.C., Magda J.J. and Andrade J.D., 1995. Adsorption of globular-proteins at the
air/water interface as measured via dynamic surface-tension—Concentration-
dependence, mass-transfer considerations, and adsorption-kinetics, Journal of
Colloid and Interface Science 173, 1, pp. 16–27.
Tsapis N, Bennet D., Jackson B., Weitz D.A. and Edwards D.A., 2002. Trojan particles:
large porous carriers of nanoparticles for drug delivery, Proc. Natl. Acad. Sci.
U.S.A., 99, pp. 12001–12005.
Wagenaar B.W. and Müller B.W., 1994. Proxicam Release from Spray Dried
biodegradable microspheres, Biomaterials, 15, 1, 49-54
Wang FJ, Wang CH. 2003. Etanidazole-loaded microspheres fabricated by spray-drying
different poly(lactide/glycolide) polymers: Effects on microsphere properties.
Journal of Biomaterials Science, Polymer Edition 14:157–183.
Wang W. Lyophilization and development of solid protein pharmaceuticals. Int. J. of
Pharmaceutics, Vol. 203, pp. 1-60 (2000).
Webb J. N., Carpenter J. F. and Randolph T. W., 2000. Stability of subtilisin and
lysozyme under high hydrostatic pressure. Biotechnol. Prog. 16, 630-636.
Wee S. Gombotz WR. 1998. Protein release from Alginate Matrices . Adv Drug Deliv
Rev. 31(3):267-285

78
7.0 APPENDIX
7.1 Calculation of Residual Activity of Subtilisin with Alginate micro particles after
spray drying.
The catalytic activity of subtilisin was determined spectrophotometrically at 410 nm with
1 mg/ml N-succinyl-L-Ala-L-Ala-Pro-L-Phe-p-nitroanaline as substrate in 100 mM Tris,
0.005 % Tween 80 pH 8.6. The activity was also expressed in international units (IU),
which is defined as µmoles of substrate hydrolyzed per minute at 25 oC and pH 8.6. The
activity of the protease was determined through Beer-Lambert law.
A = ε c l
∆C/∆t = ∆A/ ε l
∆C/∆t = slope / ε l
A is the absorbance reading, ε is the molar extinction coefficient (8480 M-1 cm
-1 for
subtilisin), c is the concentration of product and l is the optical path length of the cuvette.
(1cm)
7.2 Determination of Activity of Subtilisin within Microparticles
Initially 1mL of tris buffer solution was added to cuvette. The cuvette was placed into a
25 oC waterbath (set point 25.2
oC) and incubated for 10minutes. Then 10 µL of N-
succinyl-L-Ala-L-Ala-Pro-L-Phe-p-nitroanaline stock solution was added. Around 20mg

79
of particles, having 0.1g subtilisin/g particle was dissolved in tris buffer system (at 25
oC). 10 µL of enzyme solution was sampled and added to the cuvette for
sphectrometrically determination of the activity. Also a standard cuvette was placed in
the blank photometers cell. Absorbance readings were taken at 0.33 sec time intervals
and overall data acquisition was 1minutes.. Slope of the absorbance vs time curve was
determined for the linear abs range of 0.2-0.8. The residual activity of the particle can be
determined by dividing the acitiviy of the stock solution by the experimental activity of
the subtilisin after spray drying.
7.3 Sample Calculation for Activity of the Subtilisin Stock Solution
∆C/∆t = ∆A/ ε l
= slope / ε l
= 0.81 / (8480 *1)
= 0.0000963 M/min
= 0.0963 mM/min
Total Volume in cuvette is 1020 µL
Reaction Rate = 0.0963 mM/min *1020 µL = 0.0982 µmole/min
10 µL sample can convert the syntetick protein subtrate into 0.0982 µmole/min product
per min, 1 L protease can catalyse:
= 0.0982 µmole/min (1L/10 µL)
= 9820 µmole/min/L
80
The activity can be also expressed as in international units (IU), which can be defined as
the amount of enzyme that catalyzed the production of 1µmoles of p-nitroaniline per
minute at 25 oC in 100Mm Tris/HCl buffer at pH 8.6.
= 9820 µmole/min/L protease = 9820 IU/L
= 9.82 IU/mL
The dilution fold applied to the enzyme was 1981
The protease activity of the stock solution = 9.82 IU/mL * 1891= 18569 IU/ml
7.4 Sample Calculation for Tinlet = 150 oC, with 0.1 g subtilisin/g particle.
The same calculation procedure can be followed to determine the experimental
Activity of the subtilisin encapsulated within the microparticles. For Tinlet = 150 oC, with
0.1 g subtilisin/g particle. The slope was determined to be 0.89 26 mg of particles
dissolved in 10mL tris/HCl buffer solution.
∆C/∆t = ∆A/ ε l
= slope / ε l
= 0.89(8480 *1)
= 0.0001049 M/min
= 0.1049 mM/min
Total Volume in cuvette is 1020 µL
Reaction Rate = 0.1049 mM/min *1020 µL = 0.1070 µmole/min
10 µL sample can convert the syntetick protein subtrate into 0.1070 µmole/min product
per min, 1 L protease can catalyse:

81
= 0.1070 µmole/min (1L/10 µL)
= 10700 µmole/min/L
The activity can be also expressed as in international units (IU), which can be defined as
the amount of enzyme that catalyzed the production of 1µmoles of p-nitroaniline per
minute at 25 oC in 100Mm Tris/HCl buffer at pH 8.6.
= 10700 µmole/min/L protease = 10700 IU/L
= 10.70 IU/mL
The dilution of the sample can be calculated through the protein loading and the
dissolution volume of the medium. 26mg of particles was dissolved in 10 mL of tris/HCl
buffer system, where the particles had a protein loading of 0.1g subtilisin/g particle.
Protein concentration of the sampled solution can be calculated as;
= 0.1 g subtilisin/g particle * 26mg particle / 10mL
= 0.26mg/mL
The initial stock solution of the enzyme was 359mg /mL.
The dilution fold is found to be; = 359mg/mL / 0.26 mg/mL = 1380 times
The protease activity of the original solution = 10.70 IU/mL * 1380 = 14774 IU/mL
Residual activity % = (experimental activity/ stock solution activity)*100
= (14774 IU/mL / 18569 IU/ml )*100
= 79.5 %