buncombe county tourism update presentation to leadership asheville class january 21, 2009 kelly...
TRANSCRIPT
Buncombe County Tourism Update
Presentation to Leadership Asheville Class
January 21, 2009
Kelly Miller, CDME
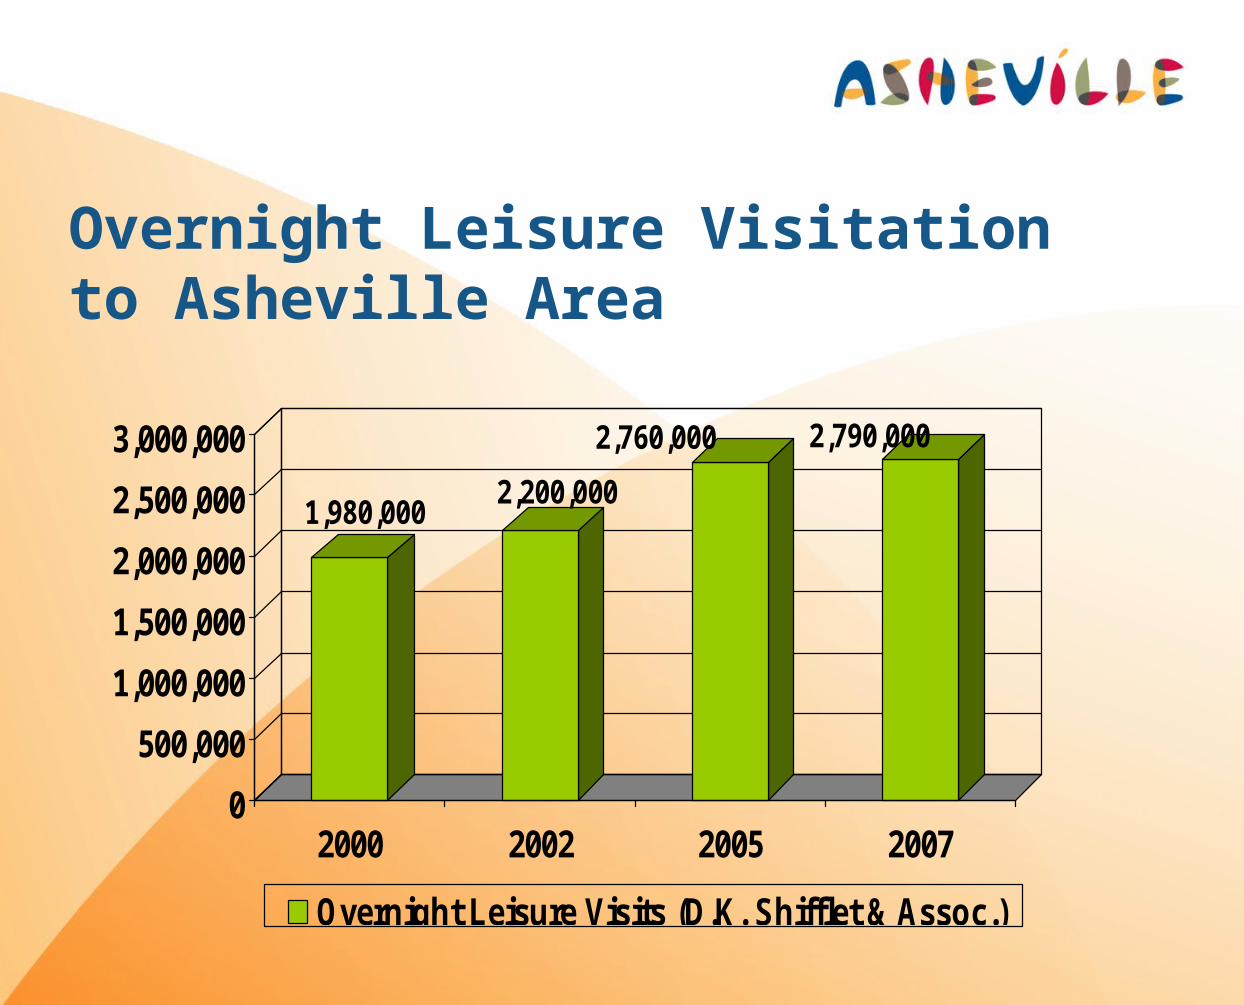
Overnight Leisure Visitation to Asheville Area
1,980,0002,200,000
2,760,000 2,790,000
0
500,000
1,000,000
1,500,000
2,000,000
2,500,000
3,000,000
2000 2002 2005 2007
Overnight Leisure Visits (D.K. Shifflet & Assoc.)
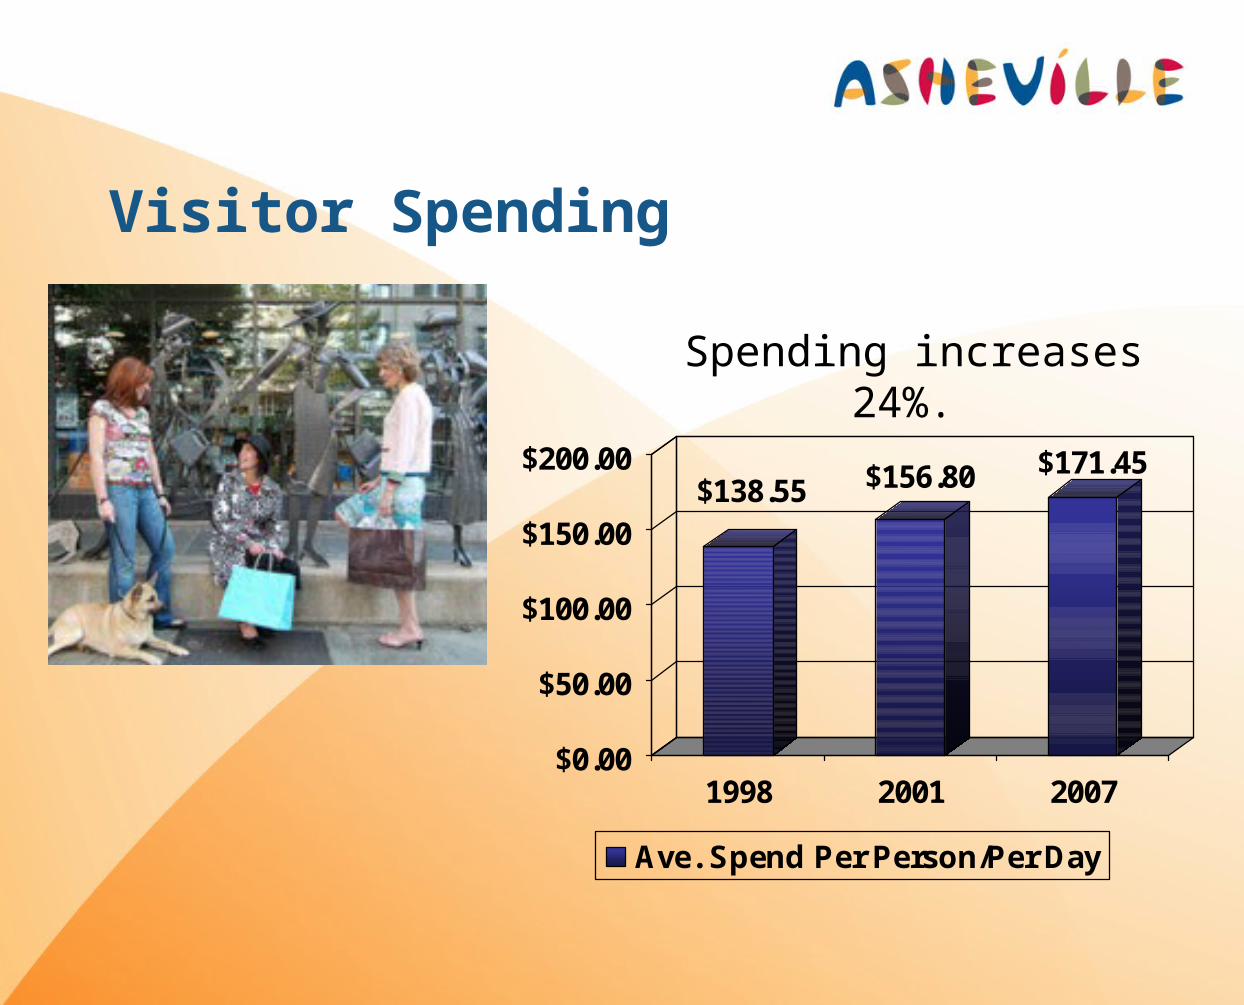
Visitor Spending
$138.55 $156.80 $171.45
$0.00
$50.00
$100.00
$150.00
$200.00
1998 2001 2007
Ave. Spend Per Person/Per Day
Spending increases 24%.
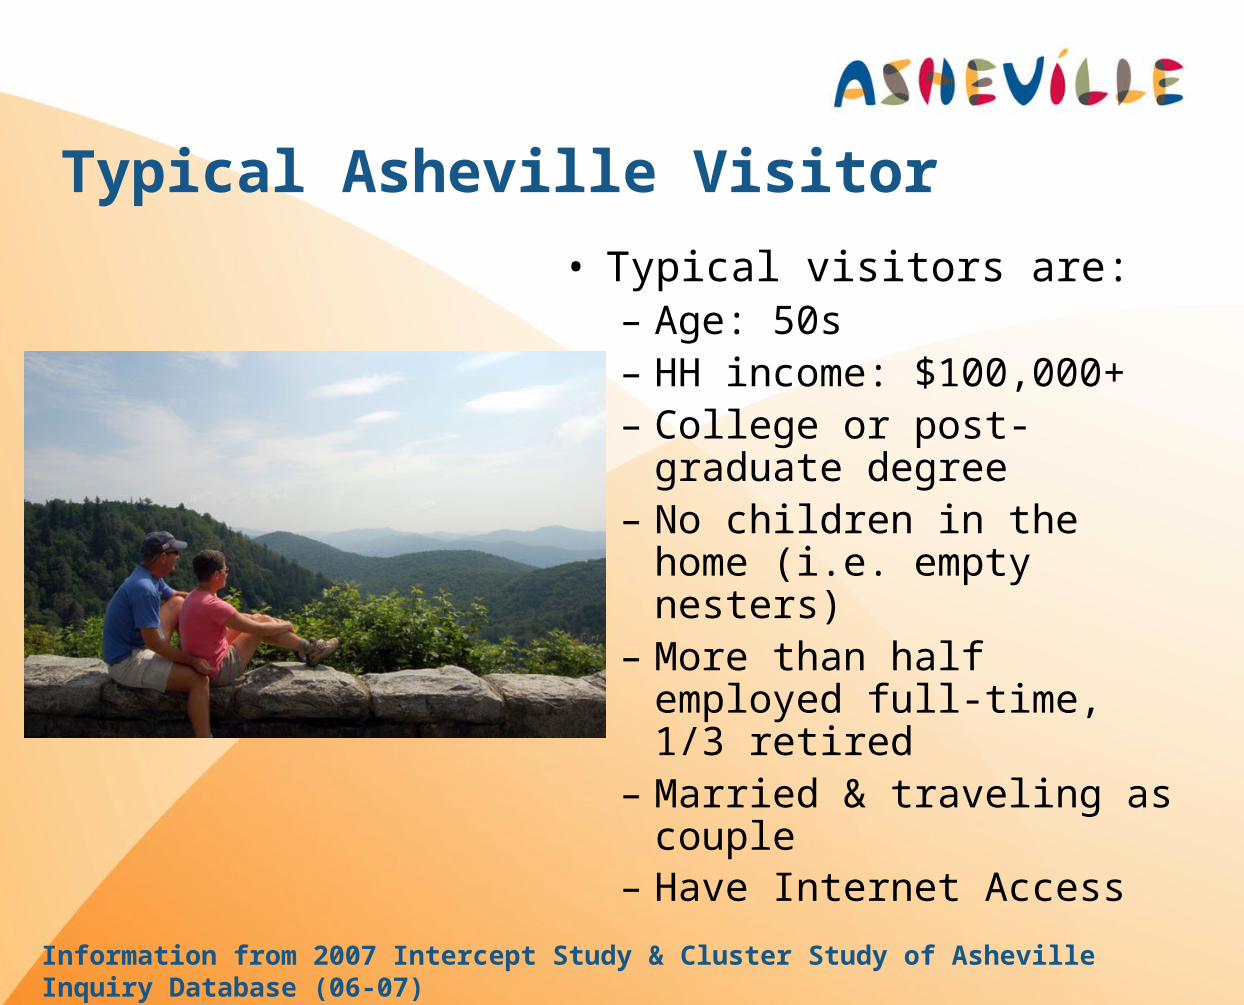
Typical Asheville Visitor
• Typical visitors are:– Age: 50s– HH income: $100,000+– College or post-
graduate degree– No children in the home
(i.e. empty nesters)– More than half
employed full-time, 1/3 retired
– Married & traveling as couple
– Have Internet Access
Information from 2007 Intercept Study & Cluster Study of Asheville Inquiry Database (06-07)

Anticipated Growth in Hotel Rooms
6,3436,534
7,004
7,144
5,800
6,000
6,200
6,400
6,600
6,800
7,000
7,200
Numer of Rooms
2007
2008 (estimated)
2009 (estimated)
2010 (estimated)
• Lodging Econometrics reported 36 percent growth in pipeline projects nationwide at the end of the 2007 that will come online in the next few years.

The Impact of Visitors
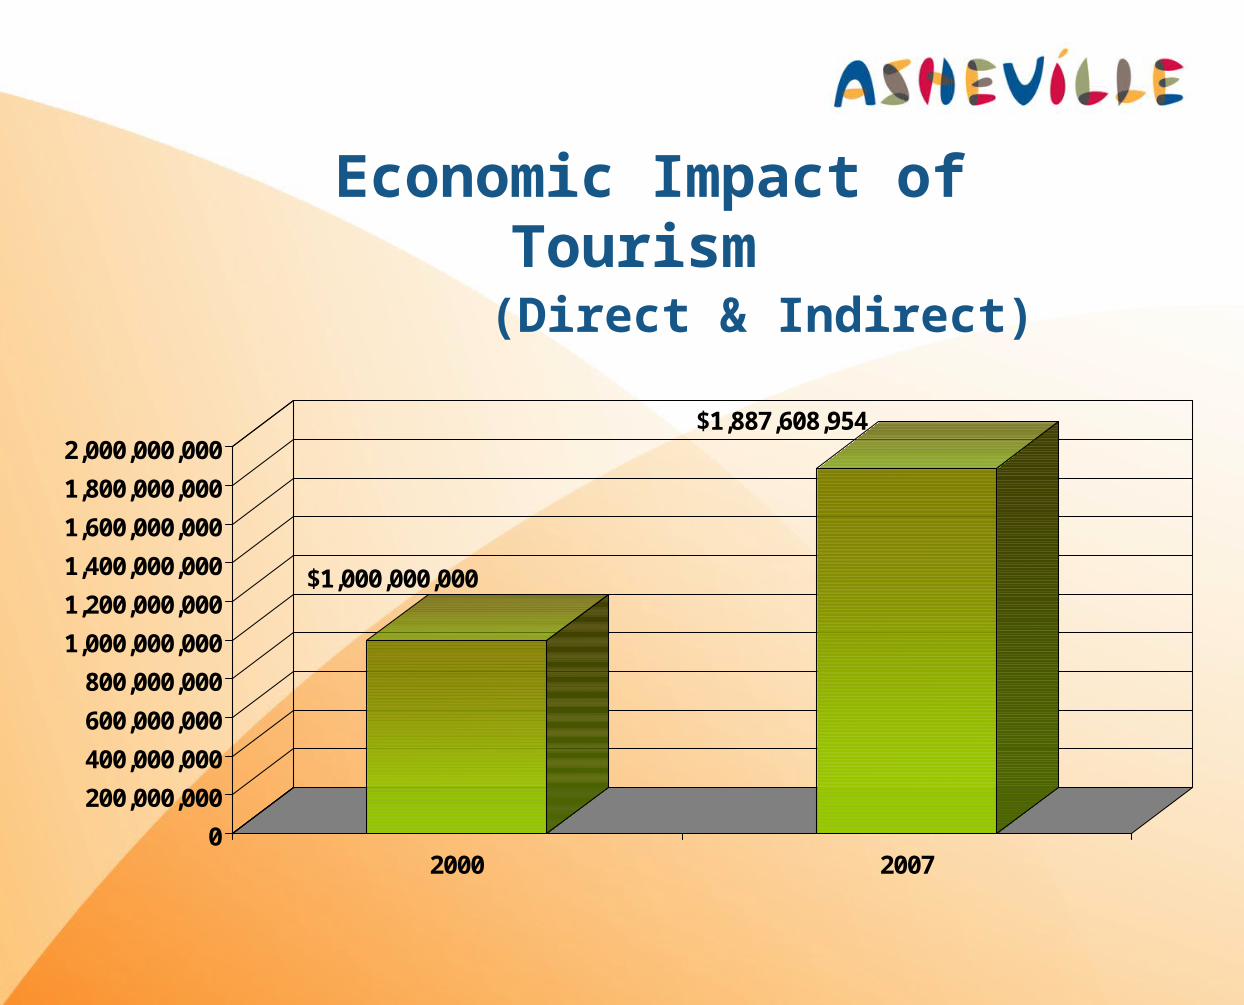
Economic Impact of Tourism
(Direct & Indirect)
$1,000,000,000
$1,887,608,954
0
200,000,000
400,000,000
600,000,000
800,000,000
1,000,000,000
1,200,000,000
1,400,000,000
1,600,000,000
1,800,000,000
2,000,000,000
2000 2007
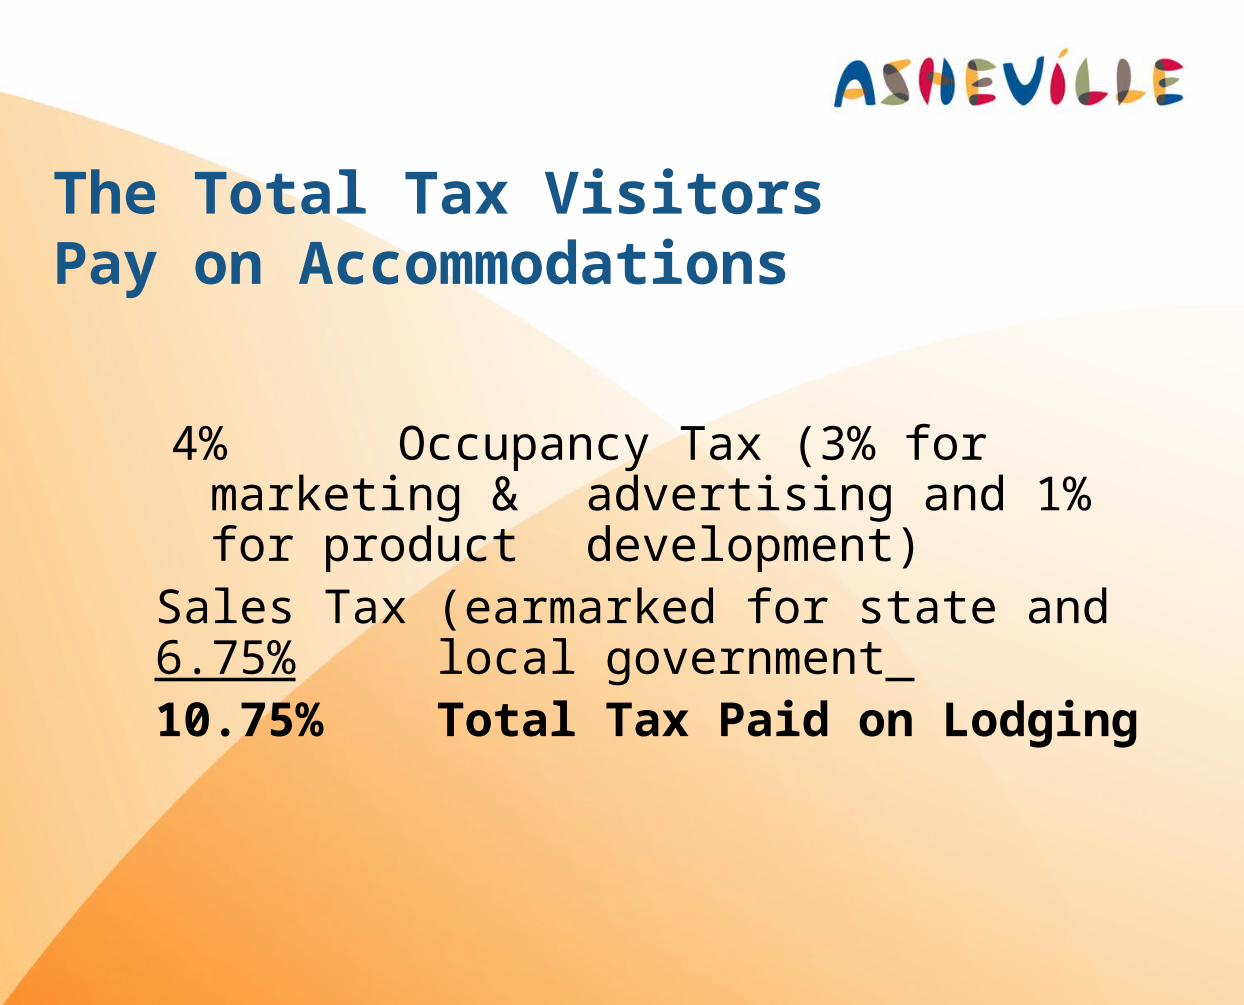
The Total Tax Visitors Pay on Accommodations
4% Occupancy Tax (3% for marketing & advertising and 1% for product development)
Sales Tax (earmarked for state and 6.75% local government 10.75% Total Tax Paid on Lodging
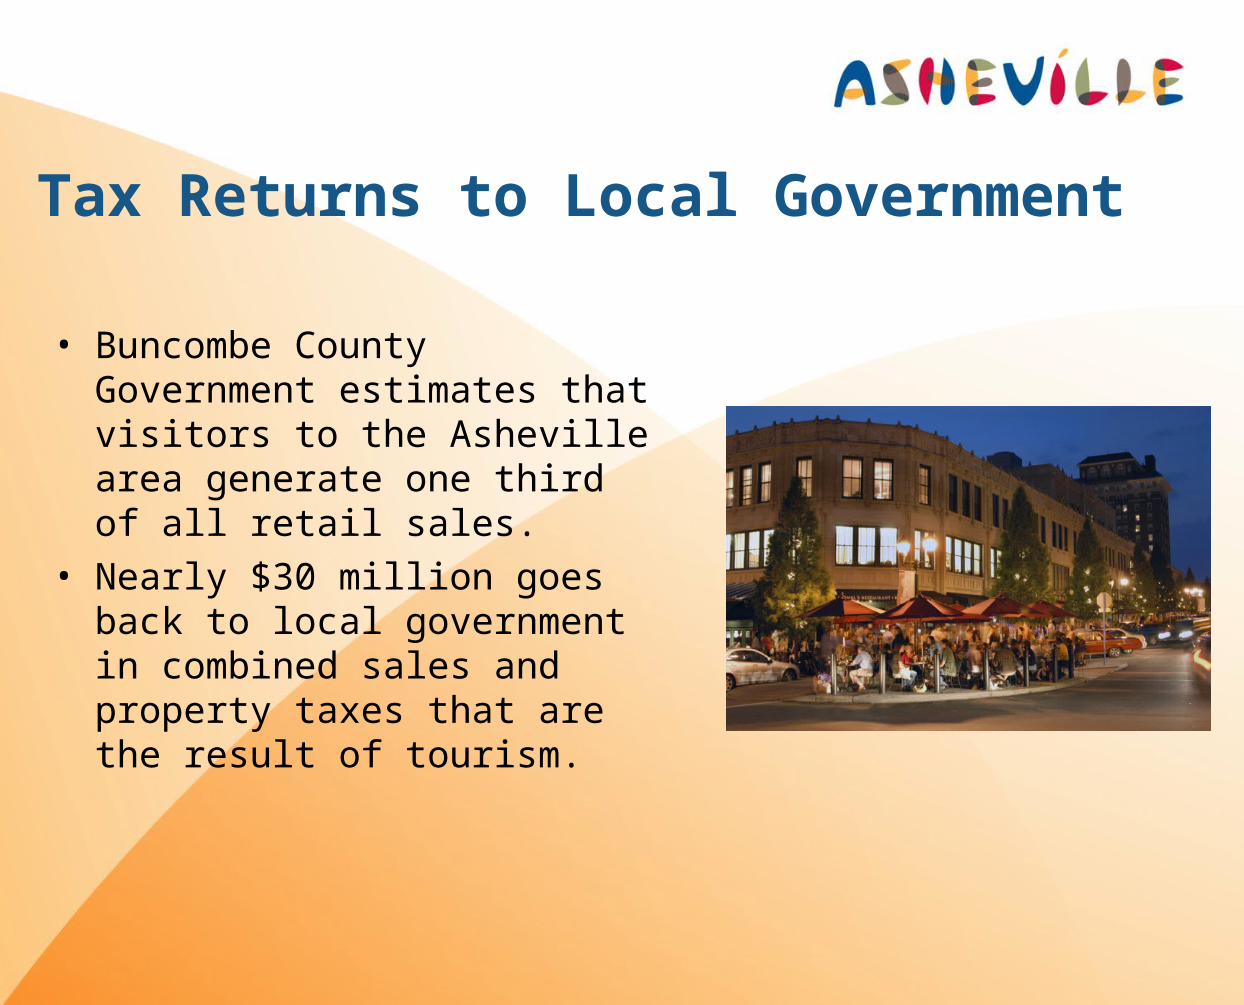
Tax Returns to Local Government
• Buncombe County Government estimates that visitors to the Asheville area generate one third of all retail sales.
• Nearly $30 million goes back to local government in combined sales and property taxes that are the result of tourism.
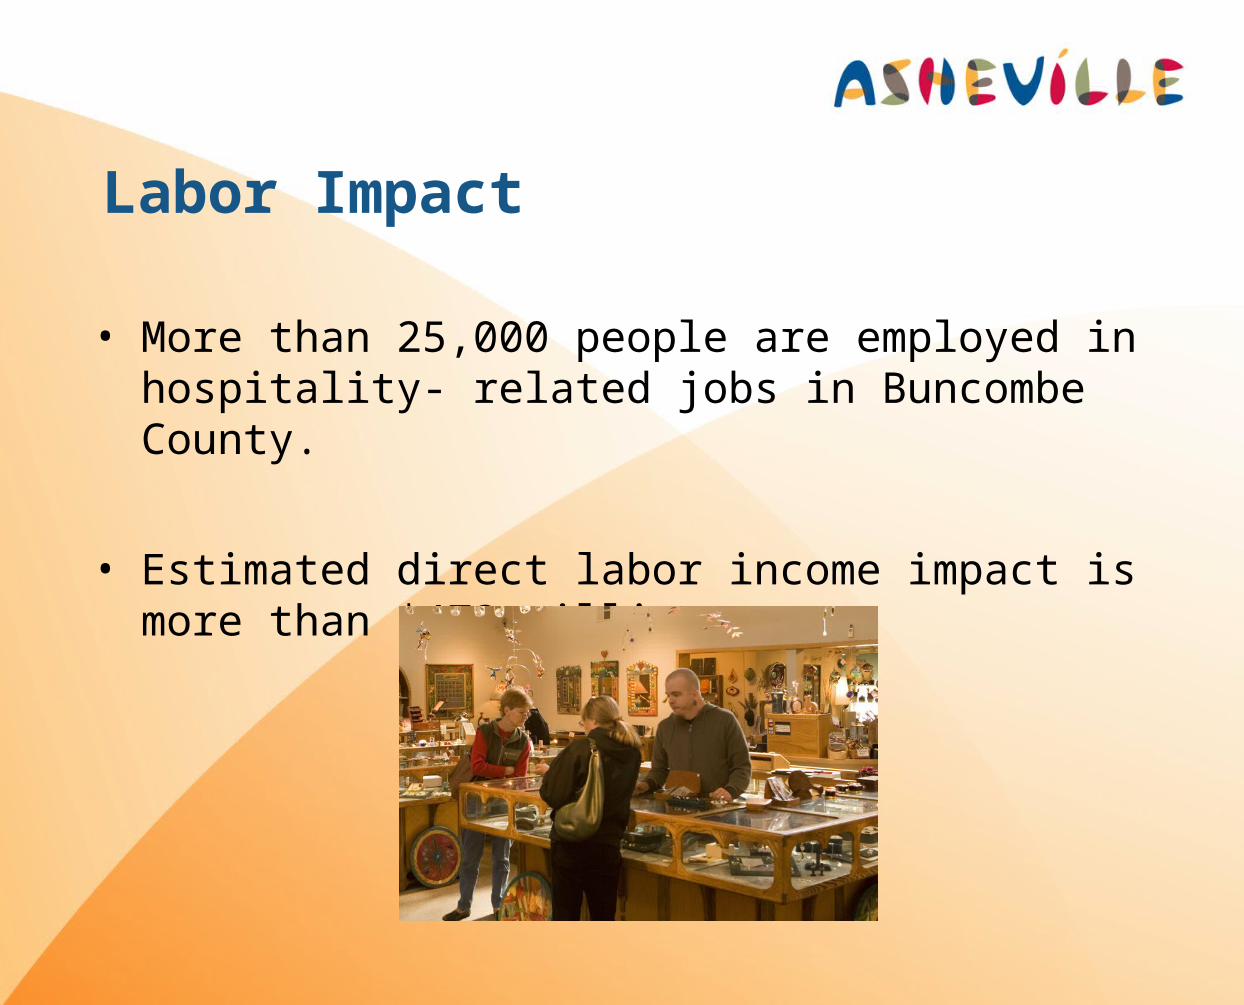
Labor Impact
• More than 25,000 people are employed in hospitality- related jobs in Buncombe County.
• Estimated direct labor income impact is more than $473 million.
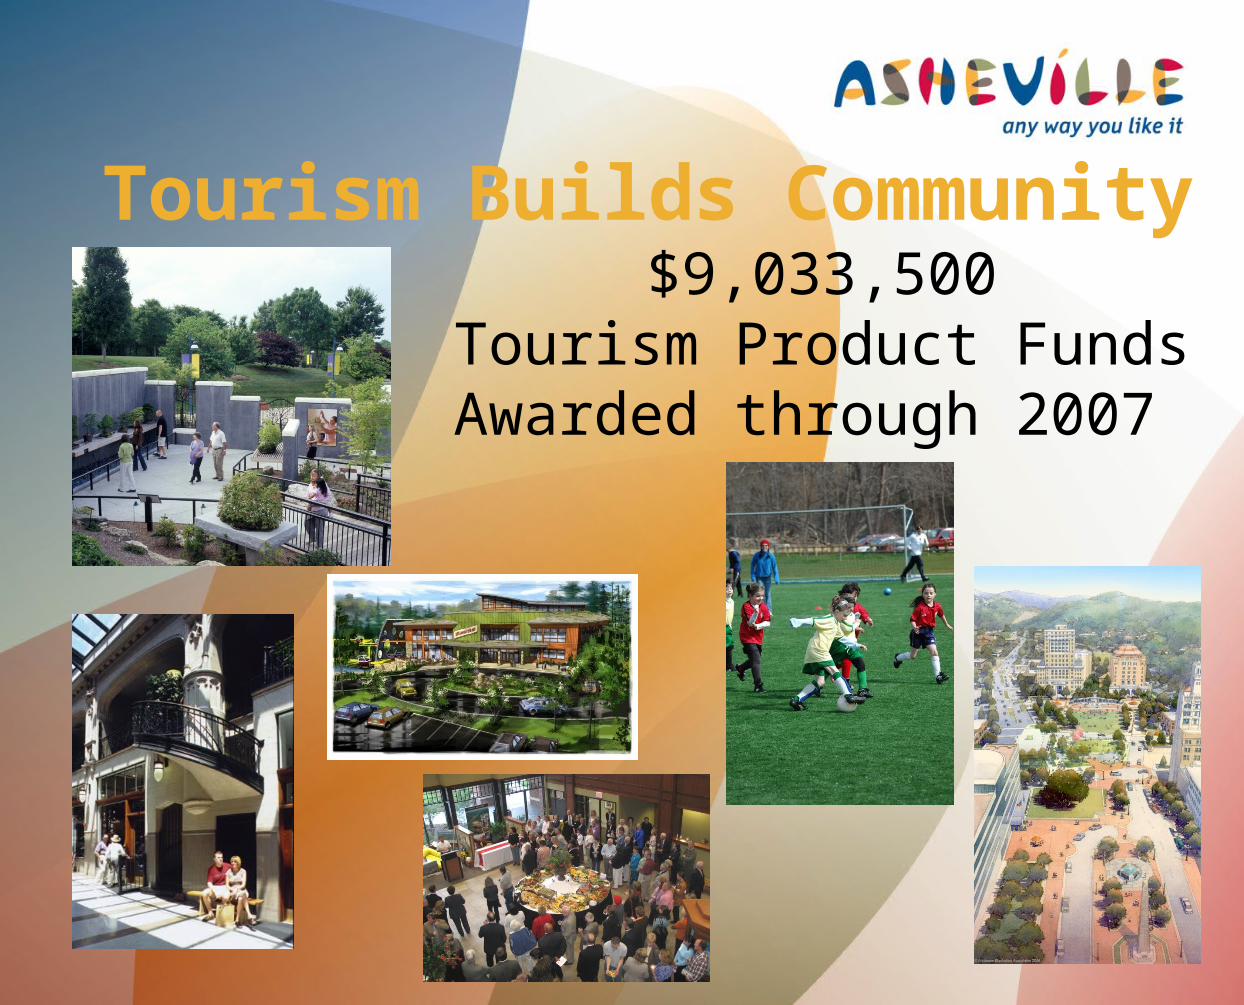
Tourism Builds Community $9,033,500
Tourism Product Funds Awarded through 2007
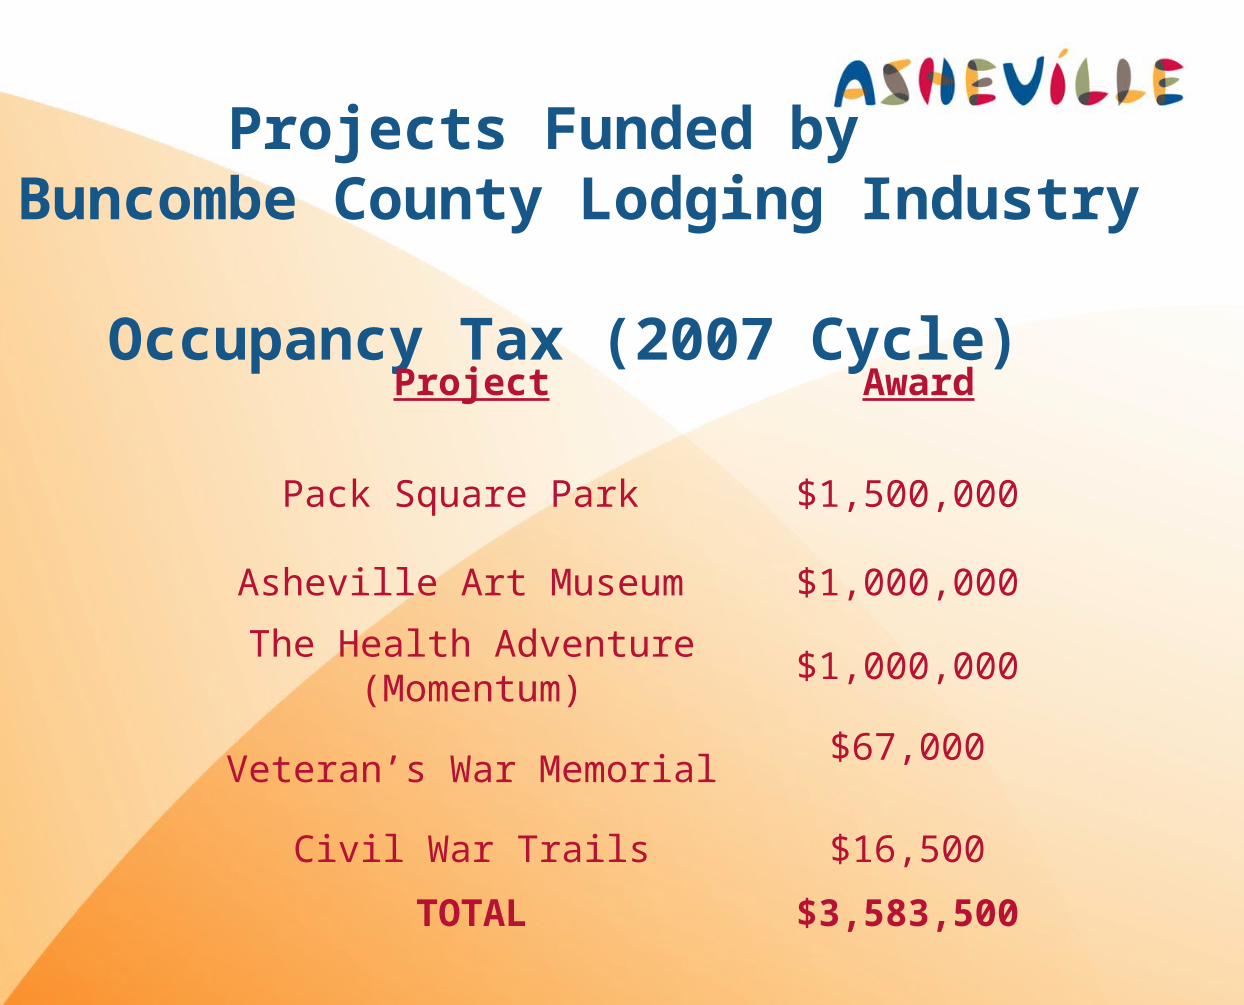
Projects Funded by Buncombe County Lodging
Industry Occupancy Tax (2007 Cycle)
Project Award
Pack Square Park $1,500,000
Asheville Art Museum $1,000,000
The Health Adventure (Momentum)
$1,000,000
Veteran’s War Memorial$67,000
Civil War Trails $16,500
TOTAL $3,583,500
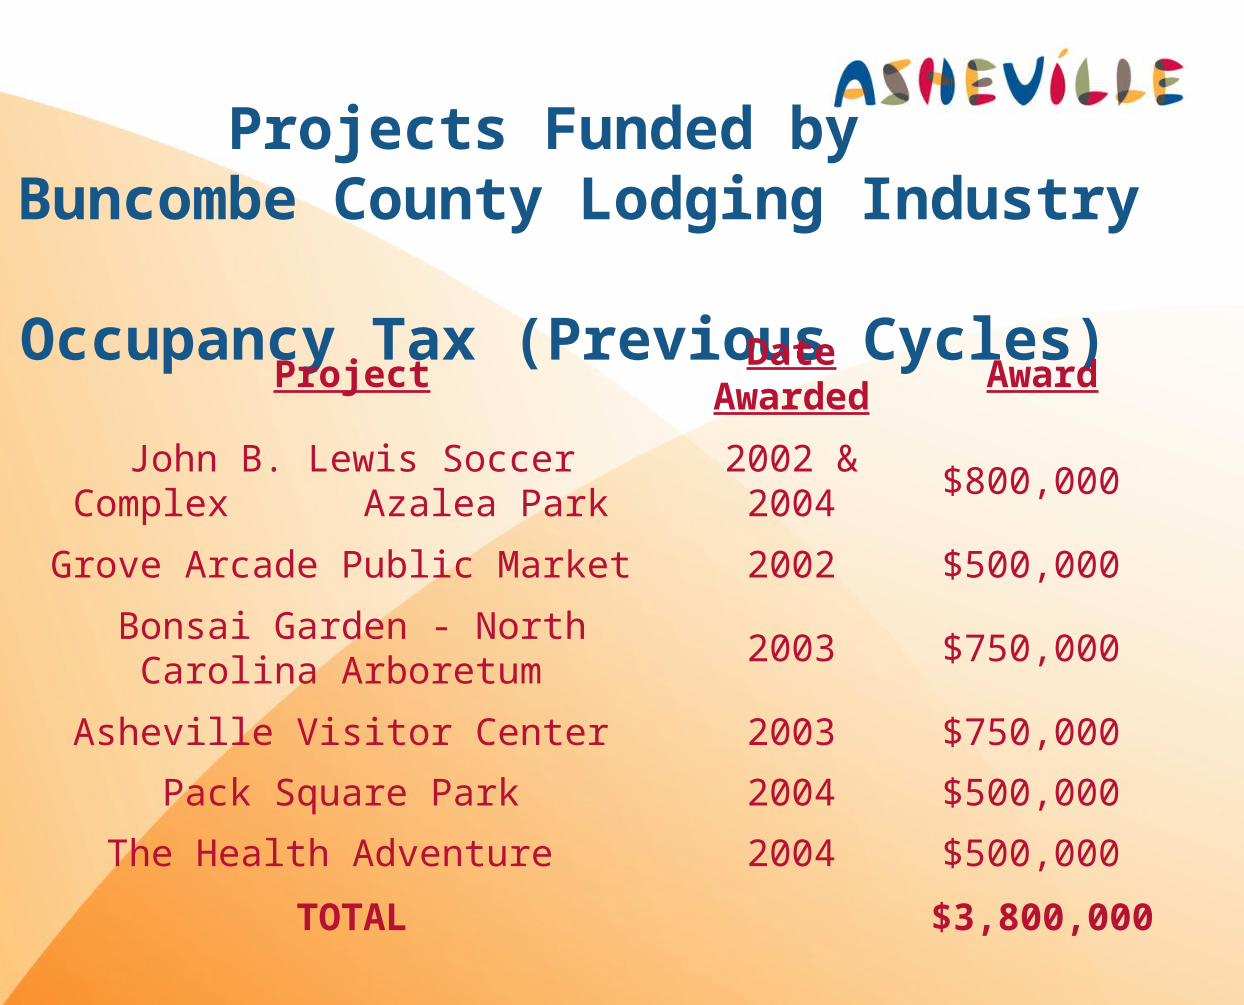
Projects Funded by Buncombe County Lodging
Industry Occupancy Tax (Previous Cycles)
ProjectDate
AwardedAward
John B. Lewis Soccer Complex Azalea Park
2002 & 2004
$800,000
Grove Arcade Public Market 2002 $500,000
Bonsai Garden - North Carolina Arboretum
2003 $750,000
Asheville Visitor Center 2003 $750,000
Pack Square Park 2004 $500,000
The Health Adventure 2004 $500,000
TOTAL$3,800,00
0
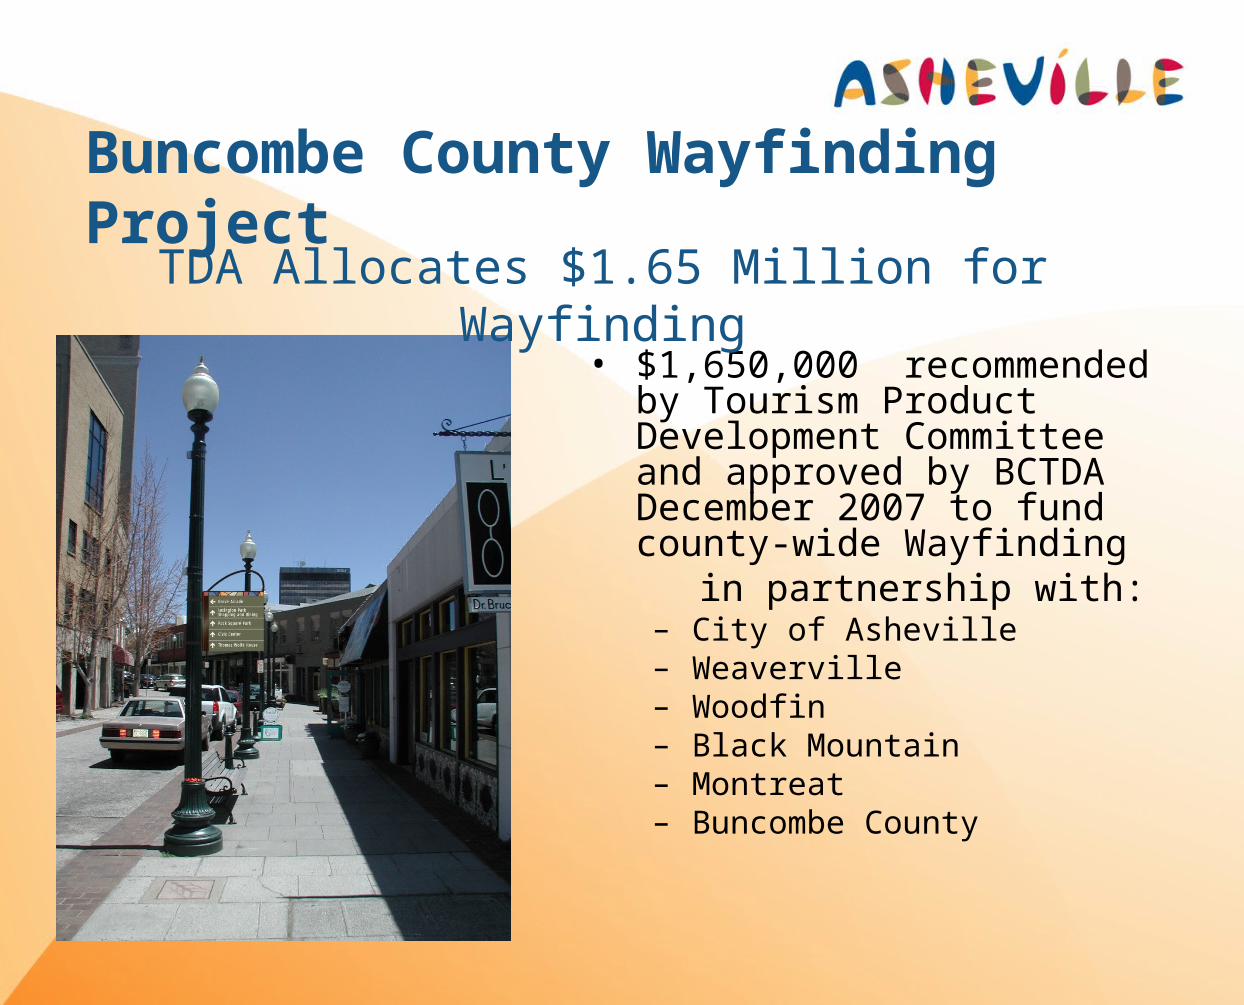
Buncombe County Wayfinding Project
• $1,650,000 recommended by Tourism Product Development Committee and approved by BCTDA December 2007 to fund county-wide Wayfinding
in partnership with:– City of Asheville– Weaverville– Woodfin– Black Mountain– Montreat– Buncombe County
TDA Allocates $1.65 Million for Wayfinding
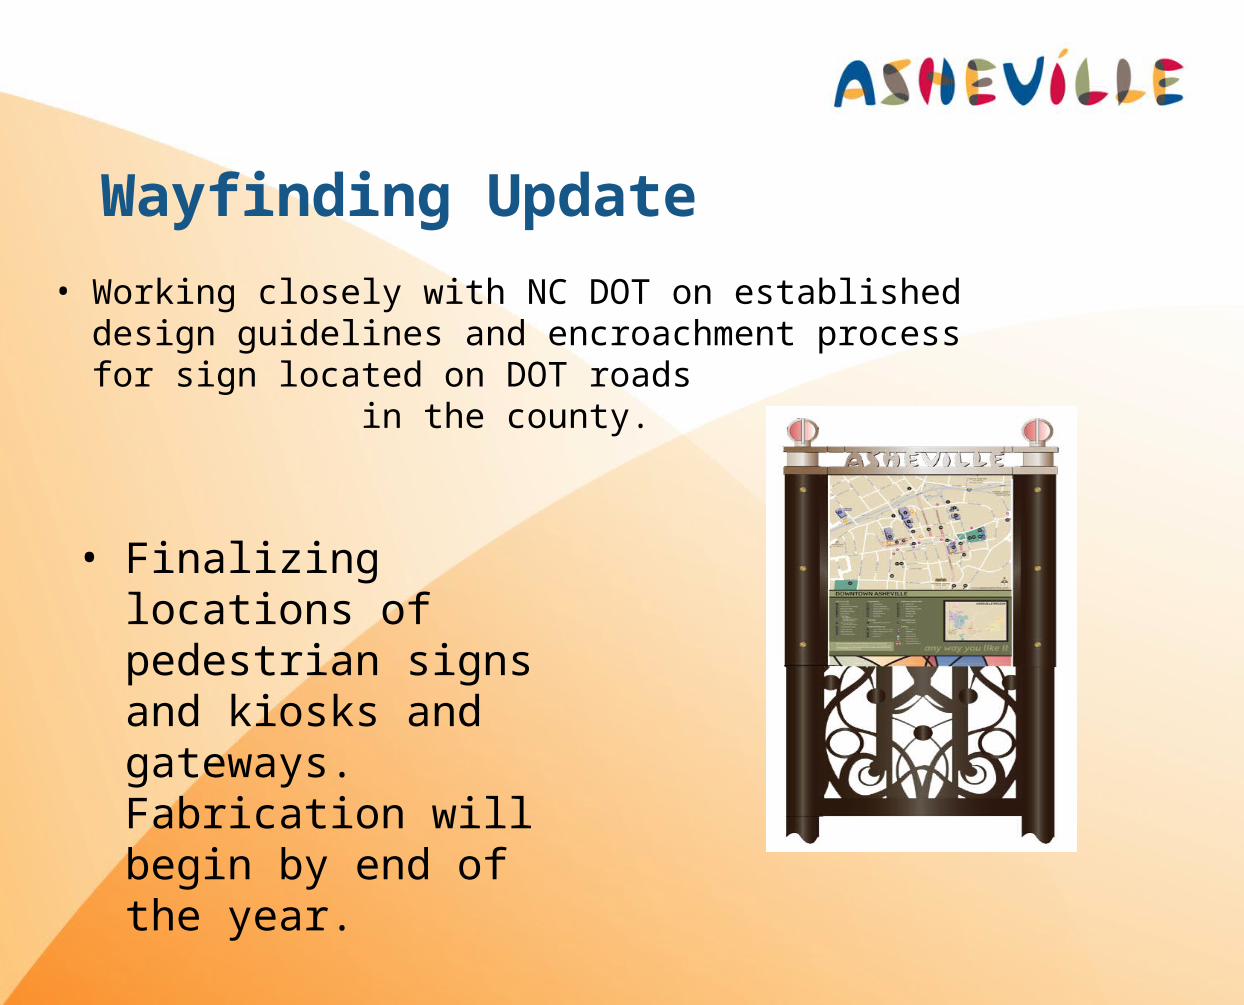
Wayfinding Update
• Working closely with NC DOT on established design guidelines and encroachment process for sign located on DOT roads in the county.
• Finalizing locations of pedestrian signs and kiosks and gateways. Fabrication will begin by end of the year.

Tourism Advertising Efforts$2.76 Million in Net
Media
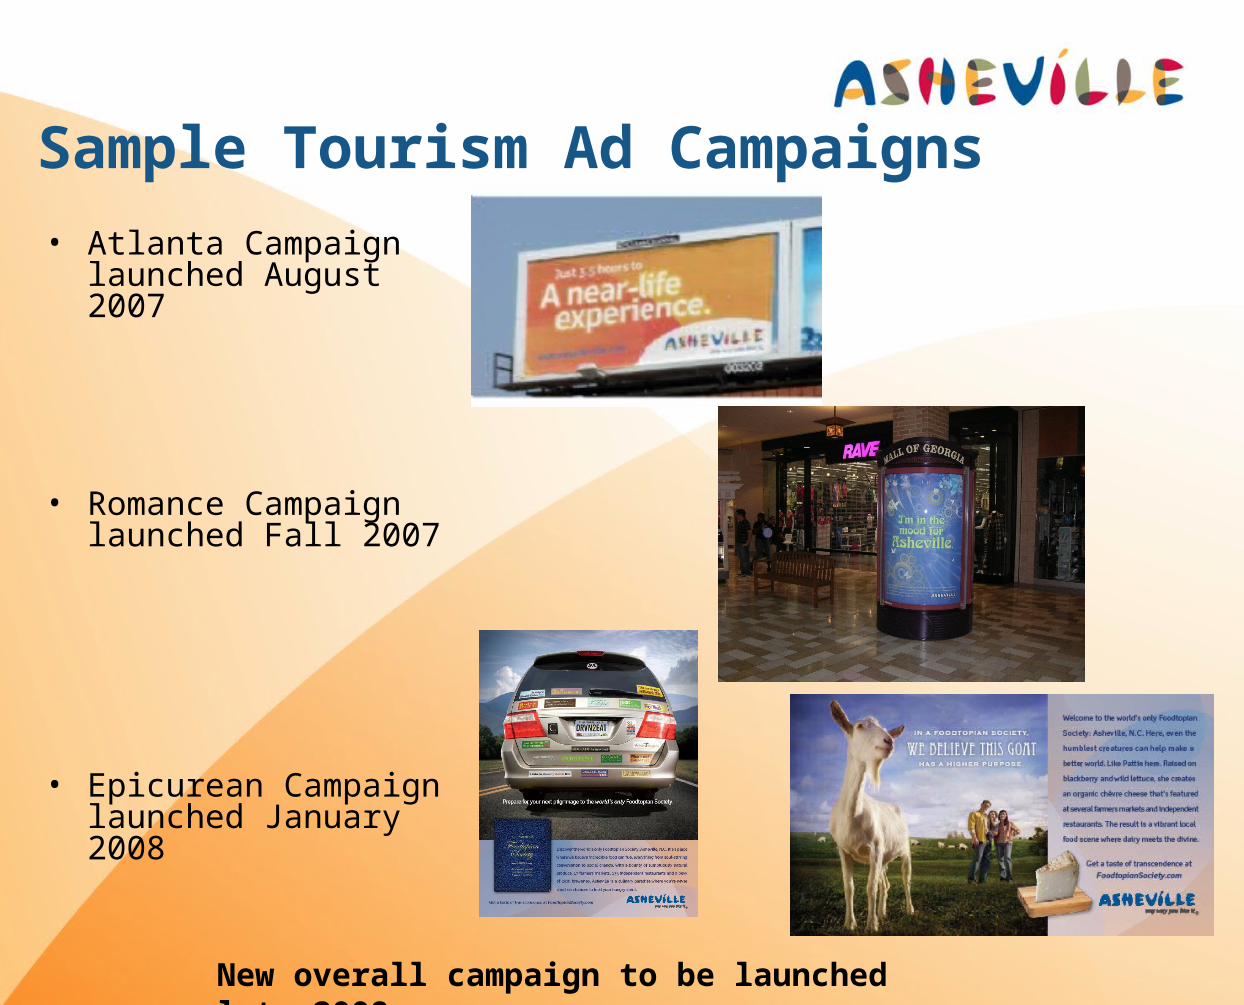
Sample Tourism Ad Campaigns
• Atlanta Campaign launched August 2007
• Romance Campaign launched Fall 2007
• Epicurean Campaign launched January 2008
New overall campaign to be launched late 2008

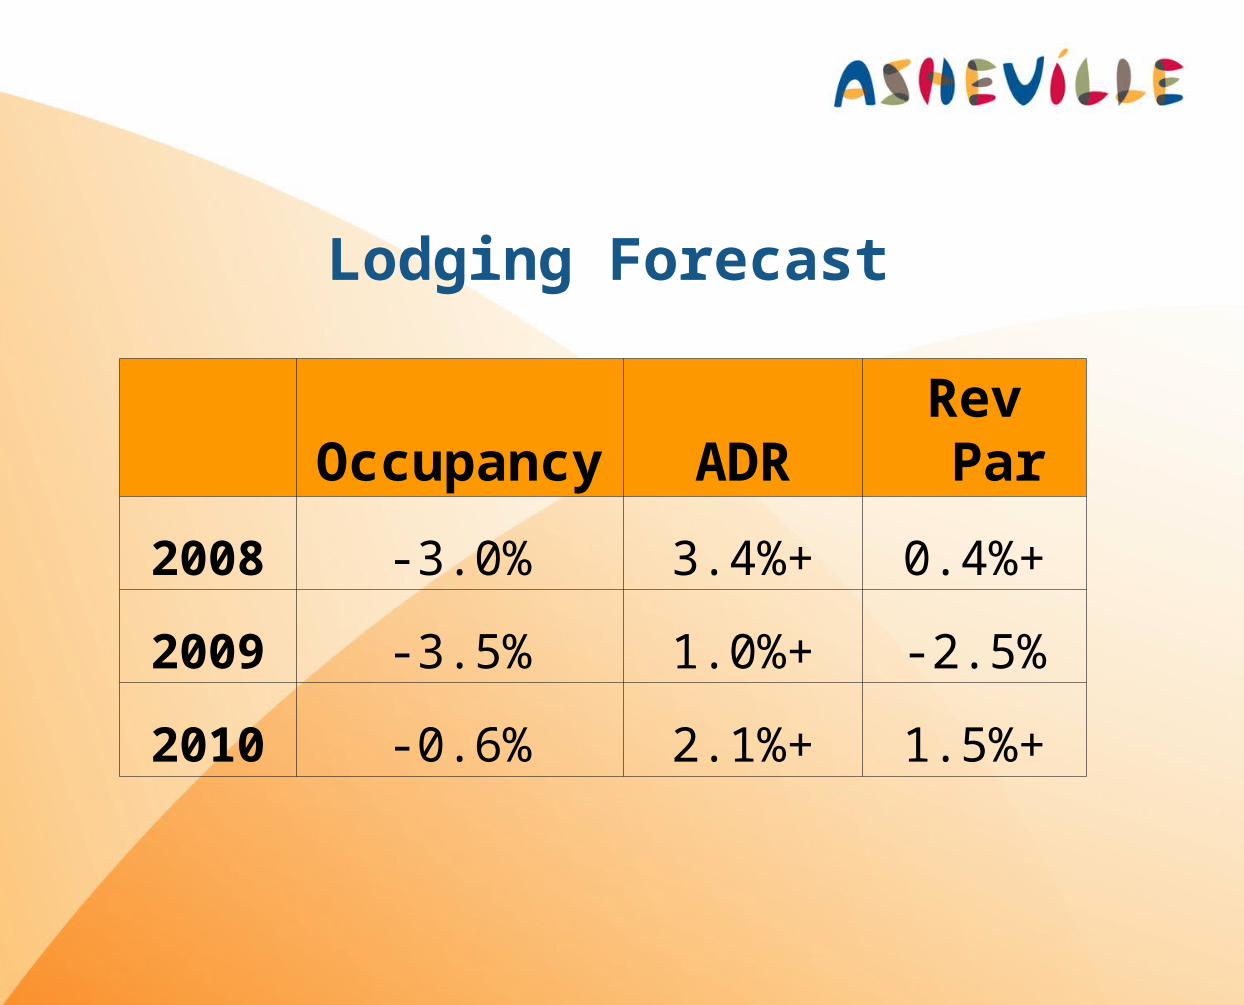
Lodging Forecast
Occupancy ADR Rev Par
2008 -3.0% 3.4%+ 0.4%+
2009 -3.5% 1.0%+ -2.5%
2010 -0.6% 2.1%+ 1.5%+

Thank You.