bulletin of the jsme mechanical engineering reviews
TRANSCRIPT

1
Bulletin of the JSME
Mechanical Engineering ReviewsVol.1, No.2, 2014
Paper No.14-00079© 2014 The Japan Society of Mechanical Engineers[DOI: 10.1299/mer.2014se0010]
Keiji KOMATSU* and Hideki UCHIDA** * Institute of Space and Astronautical Science, Japan Aerospace Exploration Agency
3-1-1 Yoshinodai, Chuo-ku, Sagamihara-shi, Kanagawa 252-5210, Japan E-mail: [email protected]
** Aerospace Research and Development Directorate, Japan Aerospace Exploration Agency 2-1-1 Sengen, Tsukuba-shi, Ibaraki 305-8505, Japan
Abstract The limitation of technology to estimate the on-orbit microvibration of a spacecraft is shown in this review paper. At present, the mechanical engineering ability cannot meet the mission requirements and the configuration of the pre-flight ground tests is far from the on-orbit configuration from the microvibration point of view. It is also extremely difficult to correlate the mathematical dynamical model (Finite Element Model (FEM)) exactly to test data up to the mid-frequency range where microvibration can be problematic even if considerable manpower is committed to analyze the correlation. Accordingly, a safety factor of at least single digit range must be introduced as part of disturbance control management.
: Spacecraft, Microvibration, Jitter, Disturbance, Control, Pointing accuracy
1. Introduction
The need for very high pointing accuracy and an extremely quiet on-board environment has become increasingly
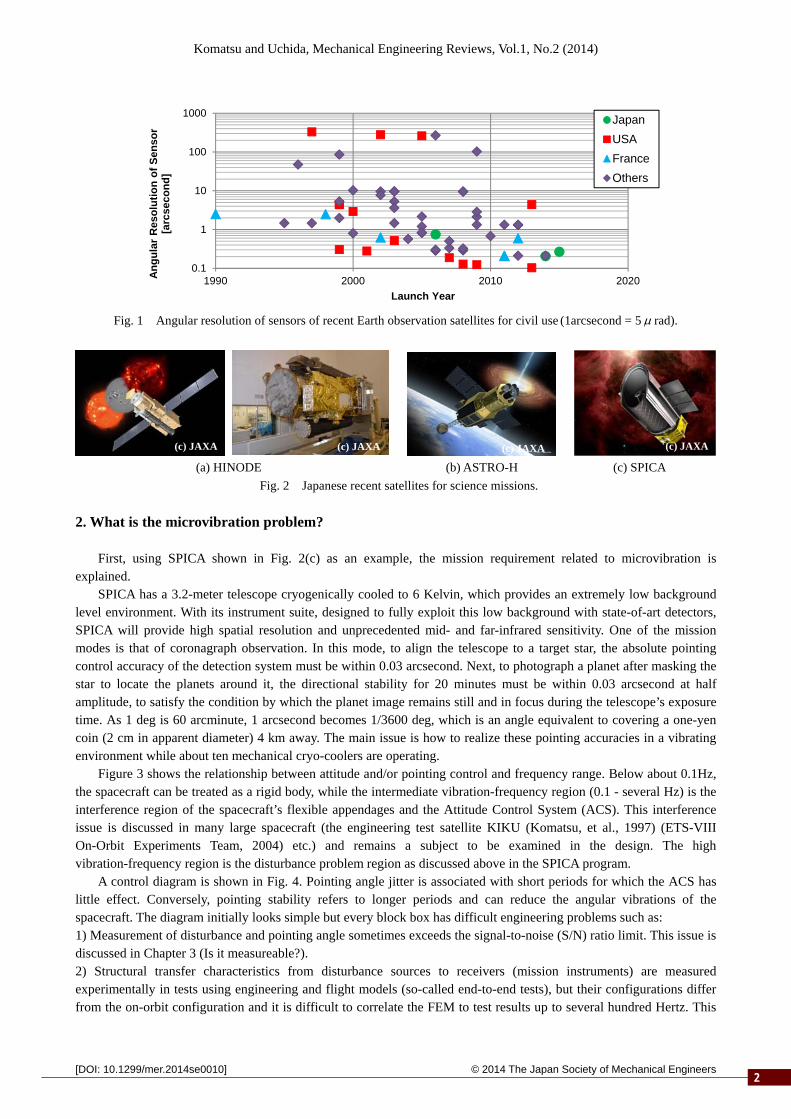
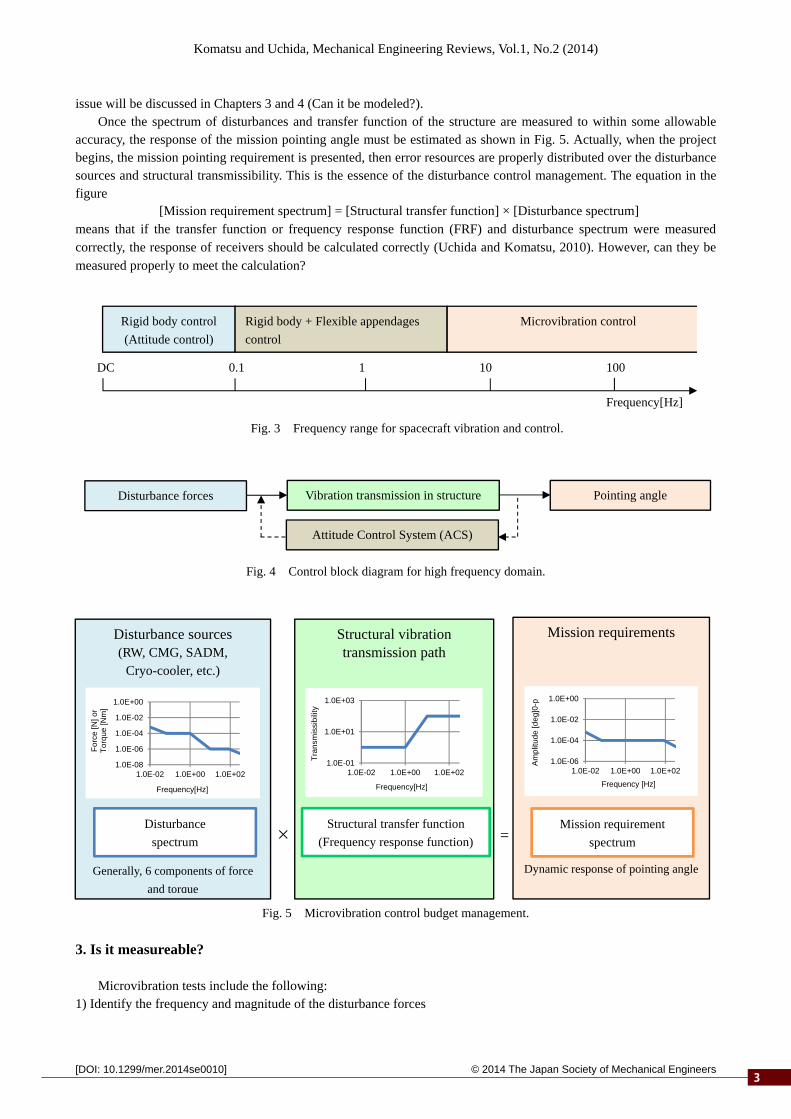
important in the most advanced space missions (Ley, et al., 2008) (Sevilla, 1998) (Toyoshima, et al., 2003) (Yoshida, et al., 2004). For example, Fig. 1 shows trend of requirement with respect to the angular resolution of sensors as mission instruments of recent Earth observation satellites for civil use only (Lier, et al., 2008) (Capderou, 2002) (Bond, 2011). To realize resolution of the observation, the spacecraft needs to keep its attitude and pointing angle within the values in the figure, and the accuracy has already been required up to 0.1 arcsecond (0.5 rad) order. Conversely, astronomical science mission requirements are stricter, for example, the requirement of the pointing stability of the solar observation satellite “HINODE” in Fig. 2(a) launched by M-V rocket in 2006 was 0.06 arcsecond within a 10-second interval on Solar Optical Telescope (SOT) (Yoshida, et al., 2004), and for the X-ray astronomy satellite “ASTRO-H” in Fig. 2(b) and the next-generation space infrared observatory “SPICA” in Fig. 2(c), the requirements are even more severe. Once on-orbit, the spacecraft faces minute vibration environments called “internal disturbances”. Typical disturbance sources are gyroscopes, Reaction Wheels (RWs), Control Moment Gyros (CMGs), cryogenic coolers (cryo-coolers), Solar Array Drive Mechanisms (SADMs), motors operating observation instruments, etc. The disturbance forces and torques are passed onto the spacecraft structure and affect the pointing performance of mission instruments. In particular, when vibration travels the spacecraft structural part, the vibrational magnitude is amplified due to structural resonances. Unfortunately, it is difficult to estimate and control the magnitude accurately.
In this review paper, the state-of-the-art microvibration issues are addressed.
Microvibration in spacecraft
Received 18 February 2014
Key words
22
Komatsu and Uchida, Mechanical Engineering Reviews, Vol.1, No.2 (2014)
© 2014 The Japan Society of Mechanical Engineers[DOI: 10.1299/mer.2014se0010]
Fig. 1 Angular resolution of sensors of recent Earth observation satellites for civil use (1arcsecond = 5 rad).
(a) HINODE (b) ASTRO-H (c) SPICA
Fig. 2 Japanese recent satellites for science missions. 2. What is the microvibration problem?
First, using SPICA shown in Fig. 2(c) as an example, the mission requirement related to microvibration is
explained. SPICA has a 3.2-meter telescope cryogenically cooled to 6 Kelvin, which provides an extremely low background
level environment. With its instrument suite, designed to fully exploit this low background with state-of-art detectors, SPICA will provide high spatial resolution and unprecedented mid- and far-infrared sensitivity. One of the mission modes is that of coronagraph observation. In this mode, to align the telescope to a target star, the absolute pointing control accuracy of the detection system must be within 0.03 arcsecond. Next, to photograph a planet after masking the star to locate the planets around it, the directional stability for 20 minutes must be within 0.03 arcsecond at half amplitude, to satisfy the condition by which the planet image remains still and in focus during the telescope’s exposure time. As 1 deg is 60 arcminute, 1 arcsecond becomes 1/3600 deg, which is an angle equivalent to covering a one-yen coin (2 cm in apparent diameter) 4 km away. The main issue is how to realize these pointing accuracies in a vibrating environment while about ten mechanical cryo-coolers are operating.
Figure 3 shows the relationship between attitude and/or pointing control and frequency range. Below about 0.1Hz, the spacecraft can be treated as a rigid body, while the intermediate vibration-frequency region (0.1 - several Hz) is the interference region of the spacecraft’s flexible appendages and the Attitude Control System (ACS). This interference issue is discussed in many large spacecraft (the engineering test satellite KIKU (Komatsu, et al., 1997) (ETS-VIII On-Orbit Experiments Team, 2004) etc.) and remains a subject to be examined in the design. The high vibration-frequency region is the disturbance problem region as discussed above in the SPICA program.
A control diagram is shown in Fig. 4. Pointing angle jitter is associated with short periods for which the ACS has little effect. Conversely, pointing stability refers to longer periods and can reduce the angular vibrations of the spacecraft. The diagram initially looks simple but every block box has difficult engineering problems such as: 1) Measurement of disturbance and pointing angle sometimes exceeds the signal-to-noise (S/N) ratio limit. This issue is discussed in Chapter 3 (Is it measureable?). 2) Structural transfer characteristics from disturbance sources to receivers (mission instruments) are measured experimentally in tests using engineering and flight models (so-called end-to-end tests), but their configurations differ from the on-orbit configuration and it is difficult to correlate the FEM to test results up to several hundred Hertz. This
0.1
1
10
100
1000
1990 2000 2010 2020An
gu
lar
Res
olu
tio
n o
f S
enso
r [a
rcse
con
d]
Launch Year
JapanUSAFranceOthers
(c) JAXA (c) JAXA (c) JAXA (c) JAXA
33
Komatsu and Uchida, Mechanical Engineering Reviews, Vol.1, No.2 (2014)
© 2014 The Japan Society of Mechanical Engineers[DOI: 10.1299/mer.2014se0010]
issue will be discussed in Chapters 3 and 4 (Can it be modeled?). Once the spectrum of disturbances and transfer function of the structure are measured to within some allowable
accuracy, the response of the mission pointing angle must be estimated as shown in Fig. 5. Actually, when the project begins, the mission pointing requirement is presented, then error resources are properly distributed over the disturbance sources and structural transmissibility. This is the essence of the disturbance control management. The equation in the figure
[Mission requirement spectrum] = [Structural transfer function] × [Disturbance spectrum] means that if the transfer function or frequency response function (FRF) and disturbance spectrum were measured correctly, the response of receivers should be calculated correctly (Uchida and Komatsu, 2010). However, can they be measured properly to meet the calculation?
Fig. 3 Frequency range for spacecraft vibration and control.
Fig. 4 Control block diagram for high frequency domain.
Fig. 5 Microvibration control budget management. 3. Is it measureable?
Microvibration tests include the following: 1) Identify the frequency and magnitude of the disturbance forces
Pointing angle Vibration transmission in structure Disturbance forces
Attitude Control System (ACS)
Disturbance sources (RW, CMG, SADM,
Cryo-cooler, etc.)
Generally, 6 components of force and torque
1.0E-08
1.0E-06
1.0E-04
1.0E-02
1.0E+00
1.0E-02 1.0E+00 1.0E+02
Forc
e [N
] or
Torq
ue[N
m]
Frequency[Hz]
Structural vibration transmission path
1.0E-01
1.0E+01
1.0E+03
1.0E-02 1.0E+00 1.0E+02
Tran
smis
sibi
lity
Frequency[Hz]
Mission requirements
Dynamic response of pointing angle
1.0E-06
1.0E-04
1.0E-02
1.0E+00
1.0E-02 1.0E+00 1.0E+02
Am
plitu
de [d
eg]0
-p
Frequency [Hz]
Disturbance spectrum
Structural transfer function (Frequency response function)
Mission requirement spectrum =
Rigid body control (Attitude control)
Rigid body + Flexible appendages control
Microvibration control
Frequency[Hz]
DC 0.1 1 10 100
44
Komatsu and Uchida, Mechanical Engineering Reviews, Vol.1, No.2 (2014)
© 2014 The Japan Society of Mechanical Engineers[DOI: 10.1299/mer.2014se0010]
2) Identify the vibration sensitivity of the receivers (mission instruments) 3) Identify the dynamic characteristics of the vibration transmission path 4) Modify the mathematical dynamical model (FEM) by the test results 5) Validate the design by the use of an FEM or flight model test. 3.1 Component test
The input force root-mean-square (rms) value is usually less than 1N level, while the output acceleration will lie within the micro-g to mili-g range. Due to the very low response levels, an extremely quiet test ambient is needed for the test. As for ground-borne and acoustic noise, an acoustic enclosure and seismic isolator must be introduced. As the electrical S/N ratio must be kept over certain limits, the only practical way is by selecting high-quality, low-noise sensors and amplifiers.
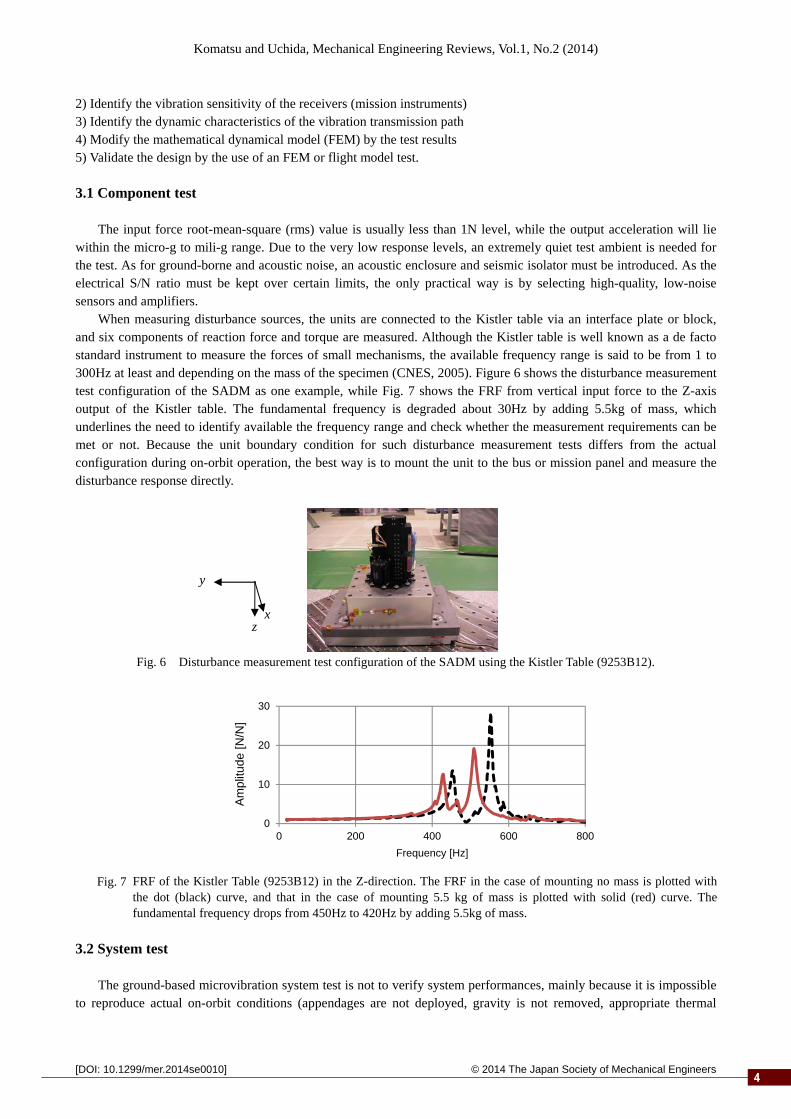
When measuring disturbance sources, the units are connected to the Kistler table via an interface plate or block, and six components of reaction force and torque are measured. Although the Kistler table is well known as a de facto standard instrument to measure the forces of small mechanisms, the available frequency range is said to be from 1 to 300Hz at least and depending on the mass of the specimen (CNES, 2005). Figure 6 shows the disturbance measurement test configuration of the SADM as one example, while Fig. 7 shows the FRF from vertical input force to the Z-axis output of the Kistler table. The fundamental frequency is degraded about 30Hz by adding 5.5kg of mass, which underlines the need to identify available the frequency range and check whether the measurement requirements can be met or not. Because the unit boundary condition for such disturbance measurement tests differs from the actual configuration during on-orbit operation, the best way is to mount the unit to the bus or mission panel and measure the disturbance response directly.
Fig. 6 Disturbance measurement test configuration of the SADM using the Kistler Table (9253B12).
3.2 System test
The ground-based microvibration system test is not to verify system performances, mainly because it is impossible to reproduce actual on-orbit conditions (appendages are not deployed, gravity is not removed, appropriate thermal
x
y
z
0
10
20
30
0 200 400 600 800
Am
plitu
de [N
/N]
Frequency [Hz]
Fig. 7 FRF of the Kistler Table (9253B12) in the Z-direction. The FRF in the case of mounting no mass is plotted with the dot (black) curve, and that in the case of mounting 5.5 kg of mass is plotted with solid (red) curve. The fundamental frequency drops from 450Hz to 420Hz by adding 5.5kg of mass.

55
Komatsu and Uchida, Mechanical Engineering Reviews, Vol.1, No.2 (2014)
© 2014 The Japan Society of Mechanical Engineers[DOI: 10.1299/mer.2014se0010]
conditions are not established). However, this test can be used to characterize the spacecraft disturbance transmission paths and provide the necessary data to assess the validity of mathematical models.
The spacecraft structure (test bed) shown in Fig. 8 was prepared to investigate microvibration issues (Uchdia, et al, 2011). The dimensions were 1.2×1.2×1.9m, and the weight of the bare structures was about 70kg. Regarding seismic suspension, several types of support were used, namely, (a) fixed to the vibration isolation stone table (b) spring suspension (c) mounted on airbags as shown in Fig. 8. Soft support test configurations (b) and (c) have been said to be valid for resonance frequency identification within the low-frequency range. However, questions remain about their accuracy for the higher frequency range and the effects of the presence/absence of appendages. To answer these questions, a series of tests and calculations is performed using the test bed.
Figure 9 shows a comparison of the FRFs from torque input along the y-direction at the RW dummy location to angular acceleration along the y-direction at the mission panel. The FRF of the support condition (a) differ from those of (b) and (c), while several FRF frequency peaks of (b) and (c) are in good agreement with each other.
(a) Fixed to the table (ground)
(b) Spring suspension (c) Airbag ride Fig. 8 Test bed and configurations under several boundary conditions.
x
y
z
Four double springs
Dummy masses Access panel
Mission panel
Vibration isolation stone table
Four airbags
Four RW dummies

66
Komatsu and Uchida, Mechanical Engineering Reviews, Vol.1, No.2 (2014)
© 2014 The Japan Society of Mechanical Engineers[DOI: 10.1299/mer.2014se0010]
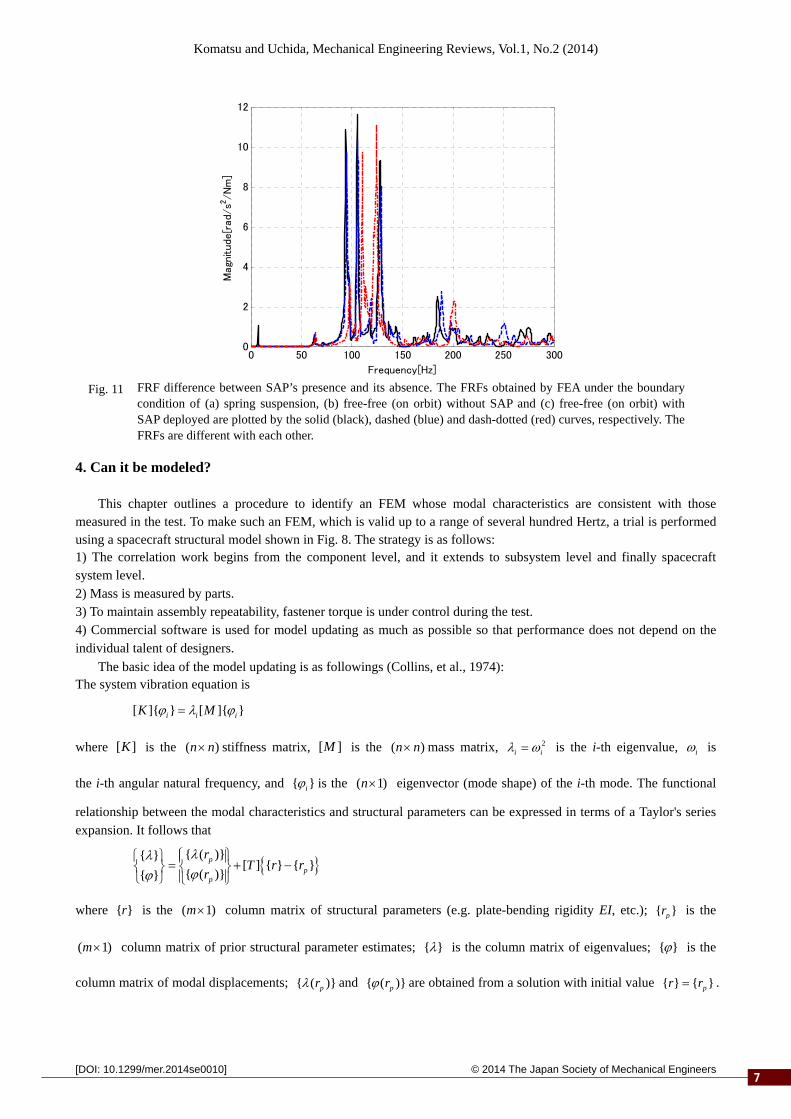
Next, the FRFs are calculated with the conditions (a) spring suspension (b) free-free without SAP and (c) free-free with SAP deployed. The configurations for the analysis are shown in Fig. 10 and the results are shown in Fig. 11. The modal damping ratio is assumed to be 0.5% for each mode. We can see that the effect of SAP's presence/absence cannot be ignored because the resonant frequencies shift, which means the ground-based system test without the SAP does not necessarily constitute an end-to-end test. Unfortunately, there is no effective way to perform the end-to-end test on the ground unless the SAP is small enough to deploy with harmless deformation there. Therefore, what we can do as much as possible is to perform Finite Element Analysis (FEA) despite insufficient accuracy of the analysis. In other words, the best way to estimate the on-orbit microvibration characteristics is to 1) modify the FEM to correlate to the ground-based test without appendages (SAP etc.). 2) add an appendage FEM to the above modified spacecraft model and execute dynamic analysis of the on-orbit configuration.
In the next chapter, the FEM modification methodology is discussed.
(a) ground test configuration (b) free-free without SAP (c) on-orbit configuration (wtih SAP deployed)
Fig. 10 Spacecraft FEM.
0 50 100 150 200 250 3000
1
2
3
4
5
6
7
Frequency[Hz]
Magn
itud
e[ra
d/s
2/N
m]
Fig. 9 A comparison of FRFs from Y-axis torque at the RW dummy to Y-axis angular acceleration at the mission panel. The FRFs obtained by tests under the boundary condition of (a) fixed to the table, (b) spring suspension and (c) airbag ride are plotted with the solid (black), dashed (blue) and dash-dotted (red) curves, respectively. The FRFs obtained by tests under the boundary condition of (b) spring suspension and (c) airbag ride are quite similar.
77
Komatsu and Uchida, Mechanical Engineering Reviews, Vol.1, No.2 (2014)
© 2014 The Japan Society of Mechanical Engineers[DOI: 10.1299/mer.2014se0010]
4. Can it be modeled?
This chapter outlines a procedure to identify an FEM whose modal characteristics are consistent with those
measured in the test. To make such an FEM, which is valid up to a range of several hundred Hertz, a trial is performed using a spacecraft structural model shown in Fig. 8. The strategy is as follows: 1) The correlation work begins from the component level, and it extends to subsystem level and finally spacecraft system level. 2) Mass is measured by parts. 3) To maintain assembly repeatability, fastener torque is under control during the test. 4) Commercial software is used for model updating as much as possible so that performance does not depend on the individual talent of designers.
The basic idea of the model updating is as followings (Collins, et al., 1974): The system vibration equation is
[ ]{ } [ ]{ }i i iK M
where [ ]K is the ( )n n stiffness matrix, [ ]M is the ( )n n mass matrix, 2i i is the i-th eigenvalue, i is
the i-th angular natural frequency, and { }i is the ( 1)n eigenvector (mode shape) of the i-th mode. The functional
relationship between the modal characteristics and structural parameters can be expressed in terms of a Taylor's series expansion. It follows that
{ ( )}{ }[ ] { } { }
{ ( )}{ }p
pp
rT r r
r
where { }r is the ( 1)m column matrix of structural parameters (e.g. plate-bending rigidity EI, etc.); { }pr is the
( 1)m column matrix of prior structural parameter estimates; { } is the column matrix of eigenvalues; { } is the
column matrix of modal displacements; { ( )}pr and { ( )}pr are obtained from a solution with initial value { } { }pr r .
0 50 100 150 200 250 3000
2
4
6
8
10
12
Frequency[Hz]
Magn
itude[r
ad/
s2/N
m]
Fig. 11 FRF difference between SAP’s presence and its absence. The FRFs obtained by FEA under the boundary condition of (a) spring suspension, (b) free-free (on orbit) without SAP and (c) free-free (on orbit) with SAP deployed are plotted by the solid (black), dashed (blue) and dash-dotted (red) curves, respectively. The FRFs are different with each other.
88
Komatsu and Uchida, Mechanical Engineering Reviews, Vol.1, No.2 (2014)
© 2014 The Japan Society of Mechanical Engineers[DOI: 10.1299/mer.2014se0010]
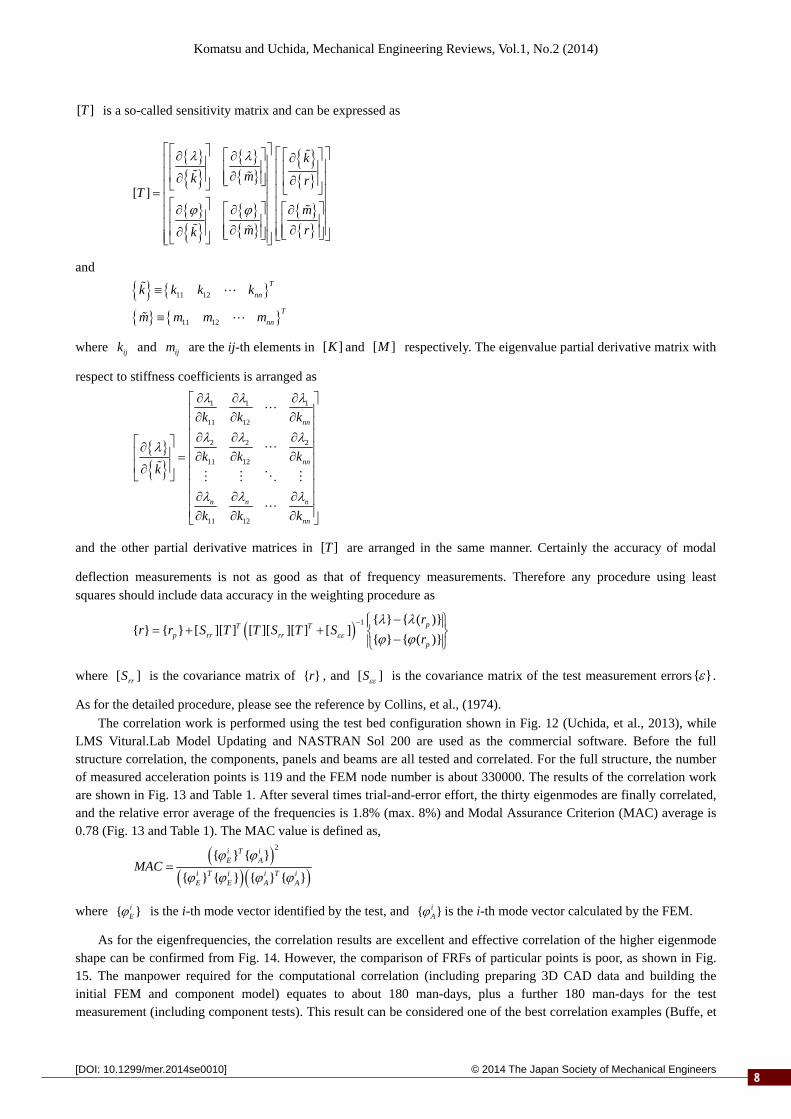
[ ]T is a so-called sensitivity matrix and can be expressed as
[ ]
kmk r
Tm
m rk
and
11 12
11 12
Tnn
Tnn
k k k k
m m m m
where ijk and ijm are the ij-th elements in [ ]K and [ ]M respectively. The eigenvalue partial derivative matrix with
respect to stiffness coefficients is arranged as
1 1 1
11 12
2 2 2
11 12
11 12
nn
nn
n n n
nn
k k k
k k kk
k k k
and the other partial derivative matrices in [ ]T are arranged in the same manner. Certainly the accuracy of modal
deflection measurements is not as good as that of frequency measurements. Therefore any procedure using least squares should include data accuracy in the weighting procedure as
1 { } { ( )}{ } { } [ ][ ] [ ][ ][ ] [ ]
{ } { ( )}pT T
p rr rrp
rr r S T T S T S
r
where [ ]rrS is the covariance matrix of { }r , and [ ]S is the covariance matrix of the test measurement errors{ } .
As for the detailed procedure, please see the reference by Collins, et al., (1974). The correlation work is performed using the test bed configuration shown in Fig. 12 (Uchida, et al., 2013), while
LMS Vitural.Lab Model Updating and NASTRAN Sol 200 are used as the commercial software. Before the full structure correlation, the components, panels and beams are all tested and correlated. For the full structure, the number of measured acceleration points is 119 and the FEM node number is about 330000. The results of the correlation work are shown in Fig. 13 and Table 1. After several times trial-and-error effort, the thirty eigenmodes are finally correlated, and the relative error average of the frequencies is 1.8% (max. 8%) and Modal Assurance Criterion (MAC) average is 0.78 (Fig. 13 and Table 1). The MAC value is defined as,
2{ } { }
{ } { } { } { }
i T iE A
i T i i T iE E A A
MAC
where { }iE is the i-th mode vector identified by the test, and { }i
A is the i-th mode vector calculated by the FEM.
As for the eigenfrequencies, the correlation results are excellent and effective correlation of the higher eigenmode shape can be confirmed from Fig. 14. However, the comparison of FRFs of particular points is poor, as shown in Fig. 15. The manpower required for the computational correlation (including preparing 3D CAD data and building the initial FEM and component model) equates to about 180 man-days, plus a further 180 man-days for the test measurement (including component tests). This result can be considered one of the best correlation examples (Buffe, et

99
Komatsu and Uchida, Mechanical Engineering Reviews, Vol.1, No.2 (2014)
© 2014 The Japan Society of Mechanical Engineers[DOI: 10.1299/mer.2014se0010]
al., 2011), and we must accept this order of accuracy (Laurence, et al., 1997) as the upper limit for spacecraft structural models.
(a) Bus part (Substructure) (b) Full structure
Fig. 12 Configuration of modal tests.
Table 1 Final correlation result between test data and FEA.
TEST FEA MAC value
Mode No. Eigenfrequency [Hz] Mode No. Eigenfrequency [Hz] 1 21.5 1 21.8 0.996 2 26.6 2 24.8 0.957 3 43.5 3 43.6 0.961 4 72.2 4 67.8 0.707 6 76.2 5 74 0.811 7 77.6 6 77.3 0.722 10 91.3 8 92.7 0.932 12 102.2 9 101.5 0.94 13 109 10 106.2 0.904 14 110.8 11 108.6 0.539 19 130.3 15 130 0.889 21 139.7 16 137.1 0.536 22 142.9 17 145.8 0.785 23 149.1 18 148.6 0.712 24 152.3 19 152.9 0.674 26 158.5 20 156.8 0.857 27 164.4 21 163.4 0.884 28 167.8 22 170.3 0.795 29 171.4 23 173.3 0.909 31 181.8 25 188.4 0.744 32 188.5 26 192.5 0.816 33 192.2 27 202.5 0.539 34 202.8 28 204.7 0.887 35 205.4 31 215.4 0.562 36 208.1 30 212.3 0.712 37 211.8 29 211.1 0.655 38 217.6 32 219 0.765 39 225.2 33 226.8 0.672 42 233.4 34 232.7 0.662 43 237.2 36 238.5 0.754
Excitation points

1010
Komatsu and Uchida, Mechanical Engineering Reviews, Vol.1, No.2 (2014)
© 2014 The Japan Society of Mechanical Engineers[DOI: 10.1299/mer.2014se0010]
(a) Before correlation (Bus part)
(b) After final correlation (Full structure) Fig. 13 MAC value between test and FEA.

1111
Komatsu and Uchida, Mechanical Engineering Reviews, Vol.1, No.2 (2014)
© 2014 The Japan Society of Mechanical Engineers[DOI: 10.1299/mer.2014se0010]
(a) FEM 238Hz (b) Test 237Hz
5. How to suppress it?
To suppress the response by external excitation, three classical methods are considered to be valid (Agrawal, 2009)
and can be categorized into 1) reducing excitation force, 2) shifting eigenfrequencies (isolation), and 3) adding damping. Figure 16 shows the concepts for vibration suppression.
Fig. 16 Concepts for vibration suppression.
0
0.2
0.4
0.6
0.8
1
0 50 100 150 200 250 300
Mag
nitu
de o
f FR
F[m
/s2 /N
]
Frequency [Hz]
Disturbance
Frequency
Strengthening
Resonance
Isolation Adding mass
Adding damping (Passive damping)
Active control
Res
pons
e m
agni
tude
Semi-active control
Fig. 15 FRF after correlation work. The measured FRF by the modal test is plotted with the dashed (black), and that by FEA after correlation work is plotted with the solid (red) curves. They have still difference with each other.
Fig. 14 A comparison of eigenmode shape of one of higher modes. The standstill and mode shape of the wire flame model of the test bed are plotted with the solid (red) and solid (blue) curves, respectively. They have good coincidence.

1212
Komatsu and Uchida, Mechanical Engineering Reviews, Vol.1, No.2 (2014)
© 2014 The Japan Society of Mechanical Engineers[DOI: 10.1299/mer.2014se0010]
1-1) Reduction of disturbance sources First of all, the disturbance force must be minimized.
1-2) Cutting off the transfer path
If there is no path of disturbance traveling, there is no problem. In the SPICA program, bus and mission parts will be separated on orbit and are connected only by soft springs (Mizutani, et al., 2014).
As a more ambitious approach to overcome problems which fundamentally originated from microvibration, the Disturbance-Free Payload (DFP) concept was proposed and demonstrated by the Lockheed Martin Advanced Technology Center (Pedreiro, 2003). The payload and the bus modules are not in contact with each other in this concept, just like formation flight. This concept also utilizes non-contact actuators and position sensors to maintain the relative position between payload and the bus modules, and wireless data transfer system and microwave power transmission system are adopted. In theory, the isolation can be achieved from zero Hertz. 1-3) Disturbance source arrangement
When disturbance sources are reciprocating machines, their forces may be reduced if they are located to mutually cancel the forces. 2-1) Base isolation
Mission components are supported softly to avoid the resonant response (Belvin et al., 1995) (Clapp, et al., 2002) (Bronowicki, 2006). The disturbance sources are also supported softly to reduce the excitation force transmissibility (Oh, et al., 2013). This measure involves the problem of how to ensure such a flexible structure withstands the launch vibration environment. Introducing launch-lock devices is one solution, but the weight penalty and the risk of being not unlocked on orbit remains.
Vibration isolation platforms are used to isolate the bus structure from reaction wheel disturbances or determine the optical payload from vibration transmitted through the bus structure. Several types of 6-axis vibration isolator based on Stewart platforms have been investigated, some of which has heritage of flight (Pendergast, et al., 1998). 2-2) Shifting eigenfrequencies
This measure is to strengthen the support or structure and ensure the eigenfrequency is in the higher frequency range. Conversely, it is possible to make the eigenfrequency in a lower range by adding mass. The disadvantage of both approaches is the cost in terms of weight, while other resonant frequencies can be problematic because such structural modification may influence not only eigenfrequencies but also FRF amplitude over a wide frequency range. 3-1) Installation of damping materials
Polymer damping materials are hardly used in space due to their volatility and adherence. The damping ratio of metal alloy is very small (titanium alloy 0.015%, aluminum alloy 0.02%, stainless steel 0.06%), but damping alloys (M2052) have a one digit bigger damping ratio as shown in Fig. 17.
Fig. 17 Damping ratio of damping alloys (Kawahara and Yin, 1999).
0 200 400 600 8000
0.5
1
1.5
2
strength (MPa)
dam
ping
ratio (%)
M2052
Mg Mg-Zr
Al-Zn Ni-Ti
Mn-Cu
Cu-Al-Ni
1313
Komatsu and Uchida, Mechanical Engineering Reviews, Vol.1, No.2 (2014)
© 2014 The Japan Society of Mechanical Engineers[DOI: 10.1299/mer.2014se0010]
3-2) Passive damping a) Dynamic (Tuned mass) damper (Maly, et al., 2001) (Maly, et al., 2010) (Maly, et al., 2012)
A dynamic or tuned mass damper has the same eigenfrequency as the main system and splits the main resonant response into two small resonant responses. To extract its performance, the eigenfrequency must be tuned exactly to the main system, and one dynamic damper is valid for only one resonant frequency of the system. Although the dynamic damper has many advantages compared with other damping devices: reliability, robustness and low maintenance cost, it is very sensitive to slight changes in tuning parameters, which can be a disadvantage. For example, if some viscous materials are used inside the damper, the damping performance is significantly affected by temperature, which makes it important to maintain the temperature of the damper.
b) Eddy current (Electromagnetic) damper (Camelo, et al., 2009) The damping force of an eddy-current or electromagnetic damper is based on the Lorentz force. The magnetic damping force is generated in the direction opposite the relative motion between a magnet and armature plate. Typically, the damper structure comprises two magnets acting on an armature plate. The magnets are mounted to the base, while the passive armature is attached to the payload, and they are separated by some gap. The most unique characteristic is the non-contacting interference, which helps ensure a friction-free mechanism and long service life.
c) Viscous (Viscoelastic) damper A basic and typical viscous damper is a fluid damper in which viscous fluid is sealed. The Hubble Space Telescope of NASA used such viscous fluid dampers called D-Struts® developed by Honeywell Inc. to attenuate disturbances from RWs (Davis, et al., 1986) (Davis and Ginter, 1991) (Davis, et al., 1994). The Chandra X-ray Observatory of NASA employed a hexapod isolator for RW disturbance isolation (Pendergast, et al., 1998). The RW isolator assembly comprises six titanium springs fitted with viscoelastic material to provide damping.
d) Particle damper
A particle damper is a traditional vibration suppression device for industrial machines and turbo machinery, which provides vibration attenuation over a wide frequency range, and performance does not depend on temperature. The damper comprises a volume of granular particles enclosed within a hollow cavity. The cavity is prepared inside the damper (Sienkiewicz, et al., 2008) or inside the vibrating structure itself (Michon, et al., 2009). The energy-dissipation mechanism is based on impact damping, where energy is lost due to the kinetic energy of the particles from collisions between them and the cavity walls. The damper has been proved to provide vibration attenuation during launch (Pendleton, et al., 2008). Conversely, the behavior of particles on orbit differs from that during launch because the particles float in the cavity under zero gravity on orbit. It tends to be difficult to validate the effectiveness of the ground test results.
3-3) Active vibration control
Active vibration control is a powerful measure. When used in space, long-term reliability and fail-safe steps are required. This measure is applied separately to disturbance sources and mission components. A tip-tilt mirror system is an example (Enya, et al., 2011) of the active control system installed into mission components. 3-4) Semi-active vibration control
An alternative approach is semi-active vibration control, which has the advantage of being robust and fail-safe because it guarantees passive energy dissipation even if the semi-active control parts fail or are damaged. A low-powered variable damping device can approach the active actuator. Several intelligent materials have been used to study feasibility of such devices for space applications (Watanabe and Yamakawa, 2004) (Oh, et al., 2006). 6. Conclusion
The issues to estimate the on-orbit microvibration during the spacecraft development phase were addressed, and
the technical limits were shown in this review paper. At present, mechanical engineering ability lags behind the mission
1414
Komatsu and Uchida, Mechanical Engineering Reviews, Vol.1, No.2 (2014)
© 2014 The Japan Society of Mechanical Engineers[DOI: 10.1299/mer.2014se0010]
requirements. Unfortunately, the system test configuration before flight is far from the on-orbit configuration from the microvibration point of view and it is difficult to ensure the FEM correlates exactly to the experimental data of response magnitude at a certain point, regardless of the manpower consumed. Accordingly, in disturbance control management, a safety factor in the order of at least one digit must be introduced. This promising measure must be an on-orbit tuning system and may be a type of active control or so-called smart structure (Wada, 1999).
References Agrawal, B., Jitter control for imaging spacecraft, Proceedings of the 4th International Conference on Recent Advances
in Space Technologies (2009), pp.615–620. Belvin, W. K., Sparks, D. W., Horta, L. G. and Elliott, K. B., On the isolation of science payloads from spacecraft
vibrations, Proceedings of the 36th AIAA/ASME/ASCE/AHS/ASC Structures, Structural Dynamics and Materials Conference (1995), Paper No. AIAA-95-1234-CP.
Bond, P. R., Jane's Space Systems and Industry 2011-2012 (2011), Jane's Information Group. Bronowicki, A. J., Vibration isolator for large space telescopes, Journal of Spacecraft and Rockets, Vol. 43, No. 1
(2006), pp.45-53. Buffe, F., Roy, N. and Cogan, S., Modal identification and modal updating of pleiades, Advanced Aerospace
Applications, Vol.1, IMAC-XXIX Conference and Exposition on Structural Dynamics, Conference Proceedings of the Society for Experimental Mechanics Series 4 (2011), pp.131-143.
Camelo, V., Bronowicki, A., Hejal, R., Simonian, S. and Brennan, S., Damping and isolation concepts for vibration suppression and pointing performance, Proceedings of the 50th AIAA/ASME/ASCE/AHS/ASC Structures, Structural Dynamics and Materials Conference (2009), Paper No. AIAA-2009-2637.
Capderou, M., Satellites: Orbites et missions (2002), Springer-Verlag. Clapp, B., Sills, J. and Voorhees, C., Hubble space telescope pointing performance due to micro-dynamic disturbances
from the NICMOS cryogenic cooler, Proceedings of the 43rd AIAA/ASME/ASCE/AHS/ASC Structures, Structural Dynamics and Materials Conference (2002), Paper No. AIAA-2002-1249.
CNES, Spacecraft Techniques and Technology: Space Technology Course (3 volumes) (2005), Vol.3, Cépaduès Collins, J. D., Hart, G. C., Haselman, T. K. and Kennedy, B., Statistical identification of structures, AIAA Journal,
Vol.12, No.2 (1974), pp.185-190. Davis, L. P., Wilson, J. F., Jewell, R. E., and Rodden, J. J., Hubble space telescope reaction wheel assembly vibration
isolation system, Proceedings of NASA Workshop on Structural dynamics and control interaction of flexible structures (1986), NASA Report N87-22702 16-15, p.669.
Davis, L.P. and Ginter, S. D., An advanced D-StrutTM, Proceedings of Damping ‘91 Conference (1991), pp. 1-17. Davis, L.P., Cunningham, D. and Harrell, J., Advanced 1.5 Hz passive viscous isolation system, Proceedings of the
35th AIAA/ASME/ASCE/AHS/ASC Structures, Structural Dynamics and Materials Conference (1994), Paper No. AIAA-94-1651-CP.
Enya, K., Kotani, T., Nakagawa, T., Matsuhara, H., Kataza, H., Wada, T., Kawada, M., Takeuchi, S., Komatsu, K., Uchida, H., Fujiwara, K., Mita, M., Mitani, S., Haze, K., Aono, K., Miyata, T., Sako, S., Nakamura, T., Tamura, M., Nishikawa, J., Yamashita, T., Narita, N., Hayano, H., Itoh, Y., Matsuo, T., Fukagawa, M., Shibai, H., Honda, M., Baba, N., Murakami, N., Abe, L., Guyon, O., Yamamuro, T., Bierden, P., Cornelissen., S., Lam, C. and Feinberg, M., Introduction to coronagraphs: coronagraph for SPICA, Proceedings of the conference on Exploring Strange New Worlds: From Giant Planets to Super Earth (2011).
ETS-VIII On-Orbit Experiments Team (Structures Research Group, Advanced Control System Group, Spacecraft Guidance Control and Dynamics Engineering Group), On-orbit system identification and attitude control experiment of ETS-VIII, JAXA Research and Development Report, JAXA-RR-04-007(2004) (in Japanese).
Kawahara, K. and Yin, F., A new type of damping materials, M2052 alloys, Journal of the Vacuum Society of Japan, Vol. 42, No.1(1999), pp.11-17 (in Japanese).
Komatsu, K., Kida, T., Sano, M., Yamaguchi, I., Kasai, T., Suzuki, T., Ishikawa, S., Sekiguchi, T., Tanaka, S., and Ichikawa, S., On-orbit system identification and attitude control experiment of ETS-VI, Technical Report of National Aerospace Laboratory, NAL TR-1328T (1997).
Laurens, P., Decoux, E. and Janvier, M., SOHO microvibrations : analyses, tests and flight results, Proceedings of the

1515
Komatsu and Uchida, Mechanical Engineering Reviews, Vol.1, No.2 (2014)
© 2014 The Japan Society of Mechanical Engineers[DOI: 10.1299/mer.2014se0010]
3rd ESA International Conference on Spacecraft Guidance, Navigation and Control Systems, ESA SP-381 (1997), p.489.
Ley, W., Wittmann, K. and Hallmann, W. (eds), Handbook of Space Technology (2008), John Wiley & Sons, Ltd. Lier P., Valorge C. and Briottet X., Imagerie Spatiale (2008), Cépaduès. Maly, J. R., Erickson, D. and Pargett, T. J., Vibration suppression for the gemini planet imager, Proceedings of the
SPIE Conference: Ground-based and Airborne Telescopes III, Vol. 7733, Paper No. 77331F (2010). Maly, J. R., Keas, P. J. and Glaese, R. M., Damping SOFIA: passive and active damping for the stratospheric
observatory for infrared astronomy, Proceedings of the SPIE Conference: Smart Structures and Materials 2001, Vol. 4331 (2001), pp. 60-71.
Maly, J. R., Yingling, A. J., Griffin, S. F., Agrawal, B. N., Cobb, R. G. and Chambers, T. S., Vibration damping for the segmented mirror telescope, Proceedings of the SPIE Conference: Modern Technologies in Space- and Ground-based Telescopes and Instrumentation II, Vol. 8450, Paper No. 845004 (2012).
Michon, G., Almajid, A., Ferrero, J-F., Aridon, G., Fascio, V. and Heurteau, J-P., Dissipation mechanisms identification of soft hollow particle-dampers in honeycomb structures for micro-vibrations environment, Proceedings of the 11th European Conference on Spacecraft Structures, Materials and Mechanical Testing (2009).
Mizutani, T., Yamawaki, T., Komatsu, K., Goto, K., Takeuchi, S., Mochida, N., Okada, Y. and Iida, H., Preliminary design and testing of truss separation mechanisms for SPICA spacecraft, Proceedings of the JSASS 45th annual meeting (2014) (in Japanese).
Oh, H., Taniwaki, S., Kinjyo, N. and Izawa, K., Flywheel vibration isolation test using a variable-damping isolator, Smart Materials and Structures, vol. 15 issue 2 (2006), pp.365-370.
Oh, H., Lee, K. and Choi, H., Experimental demonstration of cryogenic cooler disturbance attenuation using the non-linear passive isolation system, Transactions of the Japan Society for Aeronautical and Space Sciences, Vol.56, No.3(2013), pp.121-128.
Pedreiro, N., Spacecraft architecture of disturbance-free-payload, Journal of Guidance, Control, and Dynamics, Vol. 26, No. 5 (2003), pp.794-804.
Pendergast, K. J. and Schauwecker, C. J., Use of a passive reaction wheel jitter isolation system to meet the advanced x-ray astrophysics facility imaging performance requirements, Proceedings of the Conference on Space Telescopes and Instruments V. Part 1 (of 2) (1998), pp.1078–1094.
Pendleton, S. C., Basile, J. P., Guerra, J. E., Tran, B., Ogomori, H., and Lee, S. H., Particle damping for launch vibration mitigation: design and test validation, Proceeding of the 49th AIAA/ASME/ASCE/AHS/ASC structures, structural Dynamics, and Material Conference (2008), Paper No. AIAA-2008-2027.
Sevilla, L. M., Microvibration tests of the ARTEMIS structural model, Proceedings of European Conference on Spacecraft Structures, Materials and Mechanical Testing (1998) (ESA SP-428, 1999).
Sienkiewicz, J., Simonian, S. and Camelo, V., Disturbance suppression using particle dampers, Proceedings of the 49th AIAA/ASME/ASCE/AHS/ASC Structures, Structural Dynamics, and Materials Conference (2008), Paper No. AIAA-2008-2105.
Toyoshima, M., Jono, T., Takahashi, N., Yamawaki, T., Nakagawa K., and Arai K., Transfer functions of microvibrational disturbances on a satellite, Proceedings of the 21st International Communications Satellite Systems Conference (2003), Paper No. AIAA-2003-2406.
Uchida, H. and Komatsu, K., Prediction of jitter based on transfer function synthesis, Proceedings of the 52th JSASS/JSME/JAXA Structures Conference (2010) (in Japanese).
Uchida, H., Shimizu, R., Kamiya, T., Komatsu, K., Yasuda, S., Utsunomiya, S., Yamawaki, T. and Mizutani, T., A testbed structure for research on micro-vibration tests of satellite, JAXA Research and Development Memorandum, JAXA-RM-11-003(2011) (in Japanese).
Uchida, H., Komatsu, K., Kamiya, T., Coster, C. and Mizutani, S., Finite element modeling and correlation techniques for disturbance analysis of a satellite, Proceedings of the 55th JSASS/JSME/JAXA Structures Conference (2013) (in Japanese).
Wada, B. K., Smart structures for space application, Journal of the Japan Society of Mechanical Engineers (JSME), Vol.102, No.963(1999), pp.76-79 (in Japanese).
Watanabe, K. and Yamakawa, H., Development of semi-actively controlled damper for improving microgravity environment, 10th AIAA/ISSMO Multidisciplinary Analysis and Optimization Conference (2004), Paper No.

1616
Komatsu and Uchida, Mechanical Engineering Reviews, Vol.1, No.2 (2014)
© 2014 The Japan Society of Mechanical Engineers[DOI: 10.1299/mer.2014se00 ]10
AIAA-2004-4496. Yoshida, N., Takahara, O., Kosugi, T., Ninomiya, K., Hashimoto, T., Minesugi, K., Tsuneta, S., Ichimoto, K. and
Shimada, S., Systematic approach to achieve fine pointing requirement of SOLAR-B, Automatic Control in Aerospace (Proceedings of the 16th IFAC symposium on automatic control in aerospace) (2004), pp.101-106.