bulletin no. 16a · chemical cha~acte~ of south carolina 1 945-50 by f. h. pauszek bulletin no. 16a...
TRANSCRIPT

BULLETIN NO. 16A

Chemical Cha~acte~
of South Carolina 1 945-50
BY
F. H. PAUSZEK
BULLETIN NO. 16A
South Carolina Research, Planning and Development
Board
Prepared Cooperatively by the Geological Survey of the United Stater Department of the Interior
Columbia 1951

RESEARCH, PLANNING AND DEVELOPMENT BOARD STATE OF SOUTH CAROLINA
COLUMBIA July 1, 1951
CHARLES N. PLOWDEN, Director
Members of Board
A. Stanley Llewellyn, Chairman Camden
R. Frank Brownlee Anderson
John P. Cooper Mullins
Homer M. Pace ....... Charleston
Roger C. Peace Greenville

LETTER OF TRANSMITTAL Columbia, South Carolina, July 1,1951
To His Excellency, ZYon. James F. Bymzes, Govemuvr of Smdh Carolina :
Sir :
The Research, Planning and Development Board presents to you Bulletin No. 16A on the "Chemical Character of Surface Waters of South Carolina."
The progress of a State is dependent in a large measure on the availability of its natural resources. One of the most valuable is water. It is essential for the public welfare and the economic development of the State. I n order to satisfy present and future requirements, it is necessary to know the quantity and quality of surface waters in the State.
This publication is the second in a series of reports on the chemical character of surface waters in South Carolina. It in- corporates data which will be helpful in answering some of the questions about water resources in the $tab.
$incerely,
CHARLE$ N. PLOWDEN, Director.

CONTENTS Page
Introduction 1 Acknowledgments 2 Station and laboratory operation.--: 1-i 2 Physical and chemical characteristics of water 3 Mineral matter in water --_.-_.__-.---_---....-------------.-.-.-.....--..----------.------ 4
Water m p e a t e 6 Chemical character of surface waters in South Carolina..---.-_-- 6
TABLES Chemical analyses for daily stations and periodic samples col-
lected at the same point:
Lynches River near Bishopville 10 Saluda River a t Chappells 12 Wateree River near Camden 14 Broad River near Boiling Springs, N. C 34 Lumber River a t Boardman, N. C 36 Pee Dee River near Rockingham, N. C .--.--.----..-.------------------ 38 Pee Dee River near Rockingham, N. C .._--_....__-__-_.--------.--...- 40
Chemical analyses for monthly stations and periodic samples col- lected at the same point:
Broad River near Carlisle 16 Broad River near Gaffney ..................................................... 17 Congaree River a t Columbia ~~-----.~~~-~~..-----.--~---~~------------......... 18 Edisto River near Branchville 19 Enoree River near Enoree ..--------------------------..--.........-.---..-.---- 20 North Fork Edisto River at Orangeburg 21 North Tyger River near Moore ..---..--_.--...---.--.------------.___-.-.-..._ 22 Pee Dee River a t Peedee ........................................................... 23 Savannah River a t Augusta, Ga 24
Chemical analyses of miscellaneous streams in South Carolina 25 Chemical analyses of miscellaneous streams in North Carolina 42

TABLECContinued Page
Water temperatures for daily stations:
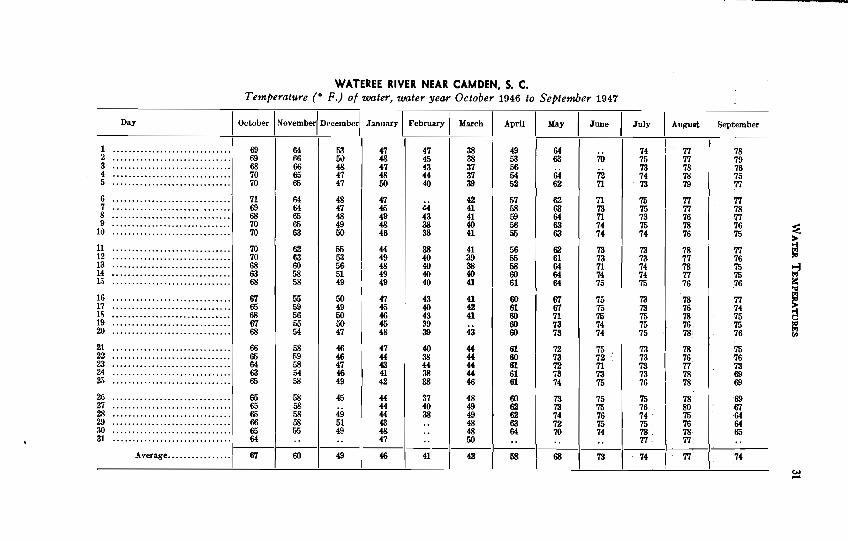
Lynches River near Bishopville 29 Saluda River a t Chappella 30 Wateree River near Camden 31 Broad River near Boiling Springs, N. C 43 Lumber River at Boardman, N. C .-----------.----p------ 44 Pee Dee River near Rockingham, N. C 45 Pee Dee River near Rockingharn, N. C 46
Figure 1-Map of South Carolina showing approximate loca- t.ions of sampling stations and miscellaneous sam- pling points 8
Index to map of South Carolina 8
Figure %Maximum and minimum dissolved solids of surface waters examined from 1945 to 1950 32
Figure 3-Maximum and minimum total hardness as CaCos of surface waters examined from 1945 to 1950..----- 33

Chemical Character of Surface Waters of South Carolina
INTRODUCTION
One of the questions raised whenever a source of water supply is being considered is: What is its chemical quality? For many purposes a water supply is judged to be of good or poor quality on the basis of its mineral content.
All waters are not equally suitable for all purposes owing to their dissolved mineral content. Some waters may be hard and are objectionable for domestic and industrial uses because of the soap-consuming properties, formation of precipitates, and scale deposition. Other waters are corrosive. Some may contain unde- sirable quantities of iron, fluoride, chloride, and other constitu- ents. For some mineral constituents the concentrations need not be very great to produce an undesirable effect. Fo r example, a total amount of about 0.3 parts per million of iron and manga- nese niay stain laundry and fixtures. I n percentage, this con- centration would be expressed as 0.00003 of one percent. Ob viously, this concentration is very low; however, this amount of iron would be considered excessive in a water supply for domestic and many industrial uses.
Knowledge of the chemical character of surface waters offers a means of evaluating a water supply as to its suitability for various purposes or suggest some treatment that would make a water more usable. This is important to the state concerned with the problem of having adequate water supplies of good quality to satisfy increasing requirements of growing municipalities and to attract and expand industrial activity. It is important to an industry seeking a location. A water supply that requires very little treatment means lower production cost. The same is true for the water works engineer. He, too, is interested in plant facilities and their operational cost. The public health officer is interested in the chemical character of water as i t may affect
1
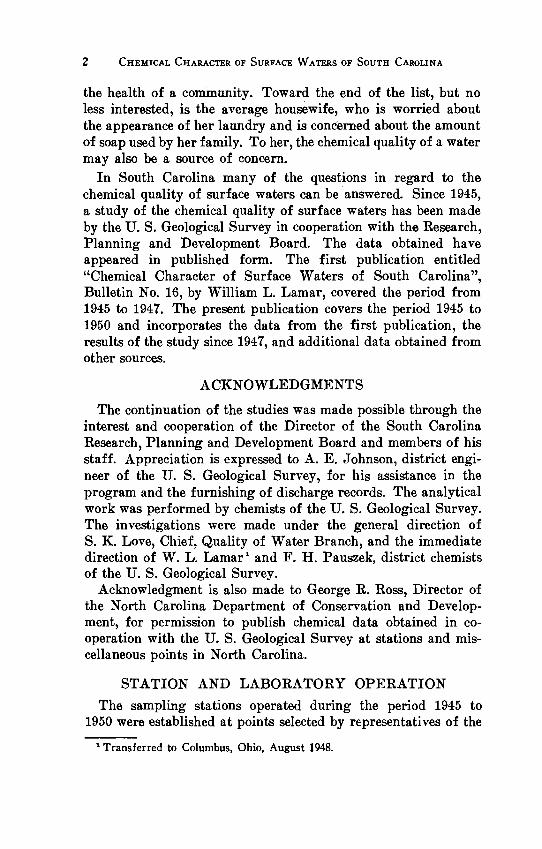
the health of a community. Toward the end of the list, but no less interested, is the average housewife, who is worried about the appearance of her laundry and is concerned about the amount of soap used by her family. To her, the chemical quality of a water may also be a source of concern.
I n South Carolina many of the questions in regard to the chemical quality of surface waters can be answered. Since 1945, a study of the chemical quality of surface waters has been made by the U. S. Geological Survey in cooperation with the Research, Planning and Development Board. The data obtained have appeared in published form. The first publication entitled "Chemical Character of Surface Waters of South Carolina", Bulletin No. 16, by William L. Lamar, covered the period from 1945 to 1947. The present publication covers the period 1945 to 1950 and incorporates the data from the first publication, the results of the study since 1947, and additional data obtained from other sources.
ACKNOWLEDGMENTS
The continuation of the studies was made possible through the interest and cooperation of the Director of the South Carolina Research, Planning and Development Board and members of his staff. Appreciation is expressed to A. E. Johnson, district engi- neer of the U. S. Geological Survey, for his assistance in the program and the furnishing of discharge records. The analytical work was performed by chemists of the U. S. Geological Survey. The investigations were made under the general direction of S. K. Love, Chief, Quality of Water Branch, and the immediate direction of W. L. Lamar1 and P. H. Pauszek, district chemists of the U. S. Geological Survey.
Acknowledgment is also made to George R. Ross, Director of the North Carolina Department of Conservation and Develop- ment, for permission to publish chemical data obtained in co- operation with the U. S. Geological Survey at stations and mis- cellaneous points in North Carolina.
STATION AND LABORATORY OPERATION
The sampling stations operated during the period 1945 to 1950 were established at points selected by representatives of the
'Transferred to Columbus, Ohio, August 1948.

PHYSICAL AND CHEMICAL CHARACTERISTICS OF WATER 3
U. S. Geological Survey and the South Carolina Research, Plan- ning and Development Board. Daily and monthly sampling sta- tions were established on streams a t or near stream flow measur- ing stations. At the daily stations 12-ounce samples were col- lected, and a t the monthly stations 1-gallon samples were taken during the year of study. I n addition, to enlarge the scope of data, many spot samples were collected a t later dates at the same stations or other locations on streams throughout the State. For the daily stations, three composites a month were made by mixing together equal volumes taken from the 12-ounce samples collected from the 1st to loth, 11th to 20th and the remainder of the month. Chemical analyses were made of these composite samples. For the monthly and miscellaneous sampling points, a chemical analysis was made of each sample collected.
The analyses were made according to methods regularly used by the U. S. Geological Survey.
PHYSICAL AND CHEMICAL CHARACTERISTICS OF WATER
I n determining the chemical quality of water, certain determi- nations are made and accepted descriptive terms are used in water analysis. These may or may not be familiar to the average reader. For a clearer understanding, some of the determinations and terms are discussed below.
Ha~dness: The characteristic of water that most people prob- ably think about first is the hardness. Physically, hardness is evidenced by the amount of soap required to produce a lather and by the formation of an insoluble curd. I n contrast, soft water forms a lather readily. Chemically, hardness is caused for the most part by the calcium and magnesium present in water. I n terms of numerical values, a water having a hardness of 60 parts per million or less would be considered soft; water having a hardness of 61 to 120 parts per million would be classified as moderately hard; and water having a hardness of more than 120 parts per million would be considered hard. Conductivity: Another characteristic of water is its ability to
conduct an electric current. The amount of current varies with the concentration and degree of ionization of the constituents in solution and with the temperature. I n water analysis, specific conductance measurements are expressed in units of micromhos

a t a specified temperature, usually 25" Centigrade. This measure- ment is sometimes useful in estimating the total concentration of mineral matter in solution. A high specific conductance gener- ally indicates a larger concentration of dissolved mineral matter, whereas a low conductance indicates that the water is low in mineralization.
p H : Hydrogen-ion concentration of water expressed as p H is a measure of its acidity or alkalinity. Water having a p H value of 7 is considered neutral? that is neither acid nor alkaline. Values above p H 7 indicate increasing alkalinity and values below p H 7 denote increasing acidity.
Swrpended matter: Suspended matter is the undissolved ma- terial in water which usually gives a stream a muddy or turbid appearance, depending on the kind of material in suspension. The amounts of suspended matter vary throughout the year and usually increase and decrease with the amount and intensity of rainfall. Values for suspended matter only approximate the true concentrations of sediment in surface water at the time of collection of the sample.
Color: Color in water is considered to be the visual effect due to material in solution and not that due to turbidity or suspended material in the water. The color of surface waters varies with the regions through which the waters flow. Usually, clear, colorless water is characteristic of mountain streams, whereas surface waters originating or flowing through swamps are highly colored owing to the presence of organic material in solution.
Oxyge~ t con.surned: Oxygen consumed is an approximate meas- ure of the amount of oxidizable matter present in filtered and unfiltered samples of water and does not distinguish between organic and inorganic material. However, high values for oxygen consumed when considered in conjunction with other determinations will indicate the possible presence of large amourits of organic material in water.
MINERAL MATTER I N WATER
Basically, water is composed of two parts of hydrogen and one part of oxygen. However, water in its passage from the at- mosphere over the earth's surface or percolating through the ground undergoes many changes in chemical characteristics.

First, i t absorbs the gases of the atmosphere, such as oxygen, nitrogen, ammonia, and carbon dioxide. These gases in solution, especially carbon dioxide, tend to increase its solvent activity. Upon coming in contact with the soils and rocks, water dissolves considerable mineral matter depending on the solubility of the soils and rocks. Iron, calcium, magnesium, fluoride, and chloride are some of the chemical elements that are leached from the mineral matter of which soils and rocks are composed. The chemical quality of water is determined by the chemical elements or compounds present and their concentrations.
I n the table given below are listed the mineral constituents usually found in water and their effects which vary with the concentrations.
Mineral Constituent Effect
Silica (SiOz)
Iron (Fe) and Manganese (Mn)
Calcium (Ca) and Magnesium (Mg)
Sodium (Na) and Potassium (K) Bicarbonate (HICOB)
Sulfate (SO4)
Chloride (Cl)
Fluoride ( F )
Forms boiler scale and deposits on tur- bine blades. Concentrations of about 0.3 parts per million or more stain laundry, porcelain fixtures, and other materials. Soap consuming, form an insoluble curd and deposit in pipes and boiler tubes. Large amounts may cause foaming in boiler operation. Large amounts may affect taste of drinking water. I n conjunction with calcium and mag- nesium, forms permanent hardness and hard scale in boiler operation. Large amounts affect the taste of drinking water. Also, increase corros- iveness of water at higher concentra- tions. Small amounts, about 1.0 parts per million, reduce tooth decay. Amounts much larger than 1.5 parts per million may result in mottled enamel on chil- dren's teeth.

Nitrate (NOS) Small amounts have no effect. Large amounts are reported to produce me- themoglobinemia in infants. Also, large amounts may indicate pollution.
WATER TEMPERATUR,E
The requirements for a public supply are fulfilled by a water of good quality and sufficient quantity; whereas in industry, the temperature of the water is an additional requirement that must be considered, especially where water is needed for cooling. A water of poorer quality but more suitable temperature in some instances is more desirable than one of superior quality and undesirable temperature. Generally, the temperature of surface water is more variable than that of ground water and is more affected by the changes in air temperature. Daily temperature readings were made of the water when the samples were col- lected at the daily stations. Temperature readings were also made of monthly and spot samples. Seasonal variations in the temperatures are evident.
CHEMICAL CHARACTER O F SURFACE WATERS O F SOUTH CAROLINA
The data on the chemical character of surface waters of South Carolina examined during the period 1945-1950 are presented in the tables that follow. Data on 3 inter-state rivers and mis- cellaneous streams obtained at sampling stations in North Caro- lina are also included. Tables of water temperatures are also incorporated in this report if daily temperature readings were made; otherwise, a single temperature reading, made at the time the sample was collected, is included with the chemical data. Graphs for maximum and minimum values for dissolved solids and total hardness for all daily stations follow the tabular material. Generally, on the basis of mineral content, the surface waters examined were of good quality and would be suitable for nearly all domestic and industrial uses with little treatment. With only a few exceptions, the surface waters were comparatively low in mineral matter. The maximum amount of dissolved solids (248 parts per million) of all the surface waters was found in a water


sample from the North Tyger River near Moore, S. C. I n addi- tion, during the water year 1948 to 1949, five other samples of water from the North Tyger River had a dissolved solid content of 100 or more parts per million. Dissolved solid content a t other stations in South Carolina was considerably less. Such waters of good quality are always desirable for industrial, muni- cipal, and other uses.
A water may be low in dissolved solids and yet some of the individual concentrations may be high enough to produce unde- sirable effects. For example, iron and manganese in very small amounts of about 0.3 parts per million, either together or sepa- rately, may produce effects which would be undesirable for industrial and domestic uses. I n the surface waters examined, the following rivers and streams were found to have iron in excess of 0.3 parts per million for the period of record listed below :
IRON DATE (parts per million)
Congaree River at Columbia October 14, 1948 0.38 August 15, 1949 0.47
March 12, 1946 Lynches River at Effingham----.
0.36 June 2, 1950 0.54
Thompson Creek near Cheraw j October 29,1947 1.1 ]May 24, 1950 0.38
Calcium'and magnesium are the main constituents that cause hardness in water. Fortunately, these were present in small con- centrations in the waters examined. As a result, all the surface waters examined would be classified as soft.
The fluoride content will be of special interest to those in- terested in the dental health of children. The maximum found was 0.5 parts per million in a water sample from Tyger River near Delta, S. C. This concentration, as well as the concen- trations found in all other surface waters, was within the limits of 1.5 parts per million recommended by the U. S. Pu'blic Health Drinking Water standards.
The concentrations of other dissolved mineral constituents were also within the limits set for acceptable water supplies for domestic and most industrial uses.

INDEX 70 MAP OF SOUTH CAROLINA
Showing Approximate Locations of Sampling Stations and Miscellaneous Sampling Points
No. on Map Stream and Location
Black Mingo Creek at Nesmith Black River at Kingstree Broad River near Carlisle Broad River near Gaffney Broad River at Richtex Broadway Creek near Anderson Buck Creek near Mayo Buffalo Creek near Blacksburg Bullocks Creek near Sharon Cane Creek near West Union Cannon Creek near' Pomaria Catawba River near Rock Hill Cedar Creek at Society Hill Coneross Creek at Richland Congaree Creek near Cayce Congaree River at Columbia Coosawhatchie River near Hampton Caronaca Creek near Greenwood Edisto River near Branchville Edisto River near Givhans Fighteen Mile Creek at Pendleton Enoree River near Enoree Fairforest Creek near Union Fishing Creek near Fort Lawn Gills Creek near Columbia Grove Creek near Piedmont K m e e River near Newry Kings Creek at Kings Creek Lakes Marion-Moultrie diversion canal Lightwood Knot Creek near Leesville Little Pee Dee River near Dillon Little Pee Dee River at Wivants Ferry Little River near Mount Carmel Little Saluda Iliver a t Saluda Long Cane Creek near Abbeville Lynches River near Bishopville Lynches River at Effingham Middle Tyger River a t Lyman Ninety Six Creek near Ninety Six North Fork Edisto River near North North Fork Edisto River at Orangeburg

No. on Map Stream' and Location :(Continued)
North P m l e t River at. P"ingmviUe North mger River near Mmre P w l e t River near Clifton Pee Dee River at Peedee Pee Dee River at Society Hill Red Bank Creek a t Rea Bank Reedy Biver near Ware Shoals Rocky River near Ancbmon Rocky River near Calhoun Falls Salkehahhie River near Barnwell (St. Hwy. 3) Sdkehatchie River near Barnwell (St. Hwy. 64) Sdkehatchie River near Hampton Saluda River at Chappells Saluda River near Columbia Saluda Biver near Greenville Saluda River near Ware Shoals Sandy River neaP Leeds Savannah River at Augusta, Ga. Savannah River new Calhoun Falls Savannah River near Millhaven, Ga. Seneca, River Anderson Shaw Creek near Eureka South Fork Edisto River near Denmark South Fork Edisto River near Montmorenci South Tyger River near Reidville South Tyger River near Waodruff Stevens Creek near Modoc Thicketty Creek a t Thicketty Thompson Creek near Cheraw Twelvemile Creek near Pickem Tyger River near Delta Tyger River near Woodruff Wateree River near Camden W h w Creek near Springdell Wilson Creek near Iva Wilson Creek near Ninety Six
NORTFI CAROLINA
Broad River near Boiling Springs Catawba River near Belmont , Cabawba River near Cramertcp Lumber River a t Boardman Pee Dee River near Rockingham Waccamaw River at Freeland

L
LYNCHES RIVER NEAR BISHOPVILLE, S. C. 0
Location.-At gaging station at bridge on U. S. Highway 15, 1 mile upstream from Seaboard Air Line Railroad bridge, 2.9 miles northeast of Bishopville, Lee County, and 3.3 miles downstream from Bells Branch.
Drainage Area.-675 square miles. Records Available.-Chemical analyses and water temperatures : October 1 9 4 5 to September 1946.
Extremes.-Dissolved solids: Maximum, 4 1 parts per million Oct. 1-10, Dec, 1 -10 ; minimum, 2 6 parts per million Sept. 1-10.
Total hardness: Maximum, 1 0 parts per million Dec. 1-10, Jan. 21-31, Feb. 11-28, Mar. 1-10, Apr. 1-30, May 1-10, July 21-31; minimum, 7 parts per million Nov. 11-30, Aug. 21-31, Sept. 1-10, 21-30.
Water temperatures: Maximum, 78" F. June 23 , July 11, 12, 14 , 17; minimum, 36" F. Dec. 20-22.
Chemical analyses, in parts per million, water year October 1 9 4 5 to September 1946
I
Silica (SiO.)
8.0 8.4 8.4 7.9 7.9 8.0
7.5 7.8 7.1 6.7 7.1 7.4
7.0 6.9 6.0 6.7 6.4 6.7
Tem- pera- ture ('F.) -
Sus- pended matter
DATE
-- Total
Iron (Fe)
0.03 .& .14 .02 1.7 .8 3.4 .03 1.6 .8 3.8 .01 1.6 .I 4.0
.21 1.9 1.2 5.4 .O1 1.8 1.0 3.4 .O1 1.9 1.0 3.4 .O1 .O1 .O1
.O1 2.0 1.0 4.1
.02 2.1 1.1 4.2
.O1 2.0 1.1 3.5
.03 2.2 1.0 3.2
.O1 1.8 1.0 4.3
.01 1.8 1.1 3.9
Mean din-
charge (second-
feet)
Oxygen consumed
25 1 16 11 8 6
6 11 16 11 13
13 18 14 9
17 14
Oct. 1-10, 1945.. 916 61 Oct. 11-10 ........ 1 623 1 5 7
Unfil- tered
12 8.6 9.2 9.0 7.0 5.2
. . . . . . . . 3.9 7.1 6.9 7.0 5.8
5.5 5.8 5.1 5.2 6.0 6.6
Oct. 21-31.. ...... Nov. 1-10 ........ Nov. 11-20 ........ Nov.21.30 ........ Dec. 1-10 ........ Dec.11-20 ........ Dec.21-31. ....... Jan. 1-10.1946..1,994 Jan. 11-20 ........ Jan. 21-31 ........ Feb 1-10 ........ Feb. 11-19.. ...... Feb.20-28 ........ Mar. 1-10 ........ Yar.11-20 ........ Mar. 21-31 ........
Specific conduct-
ance (micromhos
a t 25°C.) Color Fil-
tered --
8.8 4.4 5.6 4.1 5.0 3.9
3.9 5.3 5.5 5.3 4.0
3.8 5.2 4.8 3.2 4.1 4.5
........ ........ ........ ........ ........ ........
........ ........ ........ ........ ........ ........
........ ........ ........ ........ ........ ........
pH
45 17 22 22 24 15
35 15 19 20 20 20
19 15 15 22 20 25
663 610 566 640
9i6 930
1,6X
1,223 1.279
860 1,128
967 707 849
1,039
6.2 6.1 6.0 6.4 6.2 6.2
6.1 6.0 6.2 6.0 6.1 6.3
6.1 .. 6.1 6.2 6.2 6.1
60 56 57 50
47 42 41 48 48 42
46 48 48 54 56 59

April 1-10 ........ ........ April 11.20 April 21.30 ........
1.10 ........ E; 11-20 ........ May 21-31 ........
Aug . Aug . Aug . Sept . Sept . Sept .
June 1-10 ........ June 11.20 ........ June 21-30 ........ July 1-10 ........ July 11-20 ........ July 21-31 ........
...... Average ( 7791 61
Chemical analyses. in barts per million. of sbot samples
424 385 332 398 6 2 508
1 Nov 28 1949 ..... 6.1 1 0.0 0.1 48 14
May ?dar.31.1%0 23 ........... ..... 1 % 257 1 1 :: . . 1 : : I . . . . :: I ! 1 :::! 86.1 1 ':;I . 10 3.6 ti 1 ;! 1 441 $ I l l 8 -
69 74 75 75 76 75

SALUDA RIVER AT CHAPPELLS, 5. C.
Location.-At gaging station at bridge on State Highway 39 at Chappells, Newberry County, 7 miles downstream from dam at Lake Green- wood and 8 % miles upstream from Little River. C]
Drainage Area.-1,350 square miles. 3 Records Available.-Chemical analyses and water temperatures : October 1946 to September 1947.
2 i;
Extremes.-Dissolved solids: Maximum, 6 2 parts per million Dec. 1-10. 21-31; minimum, 39 parts per million Feb. 20-28. * P . -
Total hardness: Maximum, 1 7 parts per million Nov. 11-20, Dec. 21-31, Aug. 1-10, 21-31, sept. ; - l o ; minimum, 1 2 parts per million Feb. 11-19, C] Mar. 1-20. F.
Water temperatures: Maximum, 82" F. Aug. 2 5 ; minimum, 40" F. Feb. 10, Mar. 3. k! n 4
Chemical analyses, in parts per million, water year October 1946 to September 1947 9 0
Tem- pera- ture
('F.)
68 66 65 64 60 68
5a 53 49 48 48 47
45 43 42 42 44 47
DATE
Oct 1-10, 1946.. Oct.11-20 ........ Oct2 l -31 . ....... Nov. 1-10. .. . .. . . Nov.ll-20 ........ Nov.2l- ........ Dee 1-10 ........ Dec.11-20 ........ Dee . M I . . . . . . . . J a n 1-10,1047..2,057 Jm.11-20 ........ Jan. 2l-81. ... .. . . Feb. 1-10 .....,.. Feb. 11-19. ....... Feb. 20-28.. .. .. . .
1-10 .... ... . Mar.11-20 ........ Mar. 21-31 ........
Mean din-
charge (second-
feet)
1,613 1,150 1423 1:2m 1,530 1,767
1,678 1,666
932
2,800 3,932
2,480 2,026 1,934 2.401 4477 2,227
Sus- pended matter
ji) 8 7
12 17
12 9 8
23 36 22
30 31 . . 51 66 40
Yul- fate
(SO.)
Po- tm-
sium (K)
Specific conduct-
ance (micromhos a t 25°C.)
pH Bicar- bonate (HCOa)
3.2 3.5 3.5 3.8 4.5 4.5
4.1 4.5 4.5 4.4 3.9 3.6
3.8 2 2 2.8 2.8 4.2 4.5
Ni- tmte (NOa)
Dis- solved solids
Chlo. ride (CI)
Color
Oxygen consumed
0.1 .1 -1 .I .1 .1
.1
.1
.O .O .2 .1
.1
.1 .1 .I .1 .1
Silica (Si02)
w Total V, hard- C new ra
CaCO. Ej Fluo- ride (F)
Unfil- tered
........ ........ ........ . . . . . . . . ........ ........
........ ........ ........ ........ ........ . . . . . .. .
........ . ...... . ........ 48.6 ........ ........
6.9 7.0 7.0 7.1 7.0 6.0
7.2 7.1 6.9 6.9 6.7 h 7 , 6.9 6.0 6.9 7.1 6.6 6.6
Fil- tered
Iron (Fe)
16 5 5 5
20 14
19 16 6
18 20 10
10 20 18 14 5 6
3.3 2.8 2.4 2.7 2.2 2 4
2.4 2 4 2.8 4.0 5.5 3.6
4.2 4.8
4:i 2.5 3.7
13 I2 13 14 15 16
18 16 16 16 13 I2
I2 11 10 10 12 13
2.0 2.4 2 0 2.4 2.2 2 2
1.9 1.6 1.7 2.8 4.4 2,s
3.2 2 9 .. 3.2
1
Cal- cium (Ca)
0.06 .05 .I7 .13 .14 .14
.16
.I5
.07
.16
.01
.01
.16 .01 .O1 .02 .04 .03
%= sium (Mg)
3.4 3.8 3.5 3.9 4.4 3.7
3.7 3.8 4.0 3.8 3.7 3.0
3.0 2 8 3.2 2.7 2.3 8.0
Sodi- um
(Na)
1.5 1.5 1.4 ~5 1.5 1.3
1.6 1.4 L6 L5 1.5 1.3
1.3 1.1 L8 1.2 1.5 1.6
4.3 5.1 4.8 5.3 5.7 5.8
6.4 6.7 6.5 6.6 5.8 5.1 4.6 4.3 4.9 4.2 4.4 4.2
7.2 2.1 8.4 9.2 9.7 i .2
11
11 ll 11 9.6
7.4 2 2 7.6 2 1
7.5 6.0 5.1 4.8 6.3 7.3
28 28 29 n 30 3l
31 30 33 28 26 24
22 20 18 16 18 22

April 1-10 ........ April 11.20 ........ A P ~ I 2130 ........ Mny 1-10 ........ bfay11-20 ........ MayZL31 ........ June 1.10 ........ ........ June 11.20 June 21-30 ........ JUIY 1-10 ........ JUIY 11-20 ........ July 2131 ........
.... A g e 2 1 6 2 ( 22 1 8.81
1 965 1:914 1. m 1. 761 1. 230 1. 386
Aug . 1.10 ........ AUK . 11-20 ........ ........ Aug.2131 Sept . 1-10 ........ Bept . ll-P ........ . ........ & ~ t 21-30
Chemical m l y s e s . in parts fier million. o f sfiot sumfiles
8.2 3.6 8.0 2.5 2 6 2.8
68 68 61 61 65 69
1. 209 1 451 1'282 1:im 1, 369 1. 520
23 1 12 11 12 24
1. 216 inti 1'253 1:Ml 1. 200 1. 189
7l 73 73 74 76 76
78 76 79 79 78 78
17 88 25 16 la 12
2.3 3.6 8.6 8.2 2.8 8.0
16 a 83 17 14 10
2.9 8.6 2.7 2 7 2.6 2.7

WATEREE RIVER NEAR CAMDEN, S. C.
Location.-At gaging station at new bridge on U. S. Highway 1, 1,500 feet downstream from Twenty-five Mile Creek. 4,000 feet upstream from Seaboard Air Line Railroad bridge, 2.2 miles west of Camden, Kershaw County, and 7.4 miles downstream from Wateree Dam.
Drainage Area.-5,070 square miles. Records Available.-Chemical analyses and water temperatures: October 1946 to September 1947. Ertrew~es.-Dissolved solids : Maximum, 56 parts per million June 11-20; minimum, 44 parts per million Feb. 1-10, Sept. 1-10.
Total hardness: Maximum, 21 parts per million June 21-30; minimum, 15 parts per million Feb. 1-19, Sept. 21-30. Water temperatures,: Maximum, 80" F. -4ug. 27; minimum, 37' F. Feb. 26, Mar. 3, 4.
Chemical analyses, in parts per million, water year October 1946 to Septenrber 1947
Oxygen consumed
Unfil- Fil- tered tered
Color DATE
7.0 7.0 7.0 7.2 7.1 6.9
Dec. 1-10 ........ Dec.11-20 ........ Dec .2l-31 ........ Jan. 1-10? 1947.. Jan.11-20 ........ Jan. 2131. .......
pH ture matter
Oct. 1-10, 1946.. Oct. 11-20. ....... act. 21-31. ....... Nov.1-10 ........ Nov.11-20 ........ Nov. 81-8, .......
Feb. 1-10. ....... Feb. 11-19. ....... Feb. 20-28. ....... Mar. 1-10. ....... Mar. 11-20. ....... Mar. 21-31. .......
Specific conduct-
ance (micromhos at 25°C.)
........ ........ ........ ........ ........ ........
........ ........ ........ ........ ........ ........
........ ........ ........ 58.2 ........ ........
2.2 3.2 3.7 3.8 4.2 3.1
3,193 3,706 1953 5:756
10,280 19,290
Silica (SiO.)
9.7 9.1 9.0 12 9.1
12
12 12 11 11 11 10
10 11 13 11 12 11
Iron (Fe)
4,216 4,615 5,017 6,214 9,684 5,431
Cal- cium (Ca)
---
Mag- ne-
sium (Mg)
1.3
3 i ..
3.6 2 0
38 9
12 8 9
11
5,722 6,081 4,796 4,576 4,277 4,810
49 51 48 48 47 44
16 7
10 9
10 8
69 67 65 66 58 57
42 40 89 39 41 47
Sodi. um
(Na)
.. 5 8
12 9
38
20 .. .. 36 32 ..
Po- tas- sium (K)
2.7 3.2 3.1 3.3 8.2 4.6
3.0 26 7.1 . . 17 7.1 .. 8 7.2
Bicar- bonate (HCOs)
.. 2 0 2.0 2.7 2.4 3.2
Sul- fate
(SO,)
9 5 5 7 8
16
7.1 7.1 7.1 7.0 7.1 6.9
Chlo- ride (01)
Fluo- ride (F)
Ni- trate (NOs)
Die- solved solids
Total hard- new aa
CaCO. --

Chemical analyses. in parts per million. of spot samples
........ April 1.10 ........ April 11.20 April 21.30 ........ ........ 1-10 2 11-20 ........ May 2131 ........
........ June 1.10 June 11.20 ........ June 2130 ........ ........ July 1.10 ........ July 11.20 July 2131 ........
........ Aug . 1-10 ........ . Aug 11-20 . ........ Aug 2131 ........ . Sept 1.10 ....... . Sept 11.20. ........ Sept . 21-30
Average .....
Aug Dec . . 13. 14. 1949 1946 ..... ..... 1 5. 7. 830 300 1 2 1 1 ' - - ! ; I 4 1 1 1 9 0.04 4.4
g 1 r 1 0 1 1; 1 18 h b y 12. 1950 ..... 4. 460 I
6. 656 7. 684 5. 688 4. 381 2. 275 2. 910
3. 212 6. 180 3. 759 3. 212 3. 386 3. 484
3. 065 4. 569 3. 553 3. 327 3. 482 3, 568 - 5, 130

BROAD RIVER NEAR CARLISLE, S. C. L
Locatioa-At gaging station at bridge on State Highway 72, 2 miles upstream from Sandy River, 2 miles downstream from Seaboard Air Line a
Railway bridge, 2 % miles east of Carlisle, Union County, and 5 miles downstream from Neals Shoals Dam. Drainage Area-2,790 square miles. Records Am.lable.-Chemical analyses and water temperatures : October 1 9 4 7 to September 1948. Ertremes.-Dissolved solids: Maximum, 4 6 parts per million June 1 5 ; minimum, 3 2 parts per million Feb. 17.
B Total hardness: Maximum 1 9 parts per million Dec. 1 5 ; minimum, 11 parts per million Oct. 1 5 , Feb. 17, July 16. E Water temperatures: Maximum 81" F. July 1 6 ; minimum, 37" F. Jan. 19. ij *
P
Chemical analyses, in parts per million, of spot samples
Chemical analyses, in parts per million, wafer year October 1 9 4 7 to September 1 9 4 8 Cl x
S i l i u (SiO.)
9.9 9.9
14
14 10 12
13 12 15
11 U 12
DATE
Oct.15.1947 ..... Nov.17 ........... Dec l6. .......... Jan. 19,1948 ..... F e b . 1 7 ........... hfnr.12 ........... April 19 ........... hfny14. .......... J u n e 1 5 ........... July 16 ........... Aug.16. .......... Sept.14. ..........
Feb. 26, 1446.. ... Nov. 28, 1949 ..... Feb. 15 1960 ..... .... f i r . 31: 1 9 ~ ) . May 4.1950 .....
6,140 3.840 3,740 4,760 4,980
Iron (Fe)
0.17 .05 .08
.06
.02
.01
.02
.09
.02
.02
.02
.02
64 66 73
Sul- fate
(SO.)
r
Cal- cium (Ca)
2.8 3.6 4.6
3.8 2.8 8.6
3.3 3.9 8.8
2.B 8.3 2.8
Mean Oxygen
B i u r - bonate (HCOa)
Total E Mag- ne-
eium (blg)
Color
7 10 8
40 16 6
26 . 8 6
18
8 8 6
2.070 7,980 3,650
3,610 8,200 6,940
4,240 5,140 8,840
4,240 2,100 2,800
. . .. .. .. ..
0.0 .O .O .1 .1
Sodium and
Potaaaium Na+K
36 44 61 40 44 -
0.6 .4 .4 .6 .8
Chlo- ride (01)
pH
7.0 6.9 6.9
7.1 6.9 7.1
7.1 7.1 6.9
6.4 6.7 6.9
.. .. 42
37 44 62
66 72 80
81 78 76
0.9 1.2 1.8
1.7 1.0 1.3
1.6 1.3 L 4
1.0 L 6 1.3
12 18 18 15 1B
Ni- trate (NOS)
Fluo- ride (F)
11 6" 14 7 19
16 a
11 14
16 l6 , 15 8 11 14 12
n
Specific oonduct-
mce (micromhon a t WC.)
........ ........ ........
........ ........ ........
........ ........ 76.8
........ ........ ........
4.9 18 4.3 19 4.3 25
6.0 24 3.7 14 6.1 18
4.3 n 21
4.6 3.8 28
4.3 18 6.2 6.2
. . . . . . . . . . . . . . . . . . . .
199 104 21
10 86 18
42 8
64
105 56 42
2.6 4.2 3.2
3.6 3.6 3.3
3.3 2.4
2 2
2.1 3.0 2 2
6.9 6.4 7.1 6.6 6.3
4 7 6 7 3
Din- solved solids -
0.1 .1 .1
.1
.O
.1
.I
.1
.1
.1
.1
.I -
2.4 2.0 2 6
2.6 2.6 4.8
2.6 2.8
1.1
2.1 8.8 2.4
new M
CaCOa 8
3.6 4.2 3.0
1.2 3.2
.8
1.1 1.2 6.7
8.8 2.2 2.4
0.6 .1 .3
.1
.6
.4
.I
.3
.6
.8 1.6 .6
1.8 2.7 2.5
1.0 1.9 .4
LO
4.6
2 6 1.3 1.4
41.2 64.6 64.9 61-4 6B.S
86 87 44
42 82 36
40 39
46
87 44 42
2.8 116 3.9 2 8 3.1
2.1 3.4 2.6 2.9 2.9
11 15 17 18
. I3
0.02 .06 .l6 .8 .09
2.7 3.9 4.6 3.4 4.9
17 28 26 22 26
1.3 2.0 1.6 1.6 L 6
3.8 4.4 6.2 6.1 4.9

BROAD RIVER NEAR GAFFNE~, S. C.
Location.-At gaging station at bridge on U. S. Highway 29, 0.3 mile upstream from Cherokee Creek, 4.4 miles downstream from Gaston Shoals Dam, and 4.5 miles east of Gaffney, Cherokee County.
Drainage Area.-1,490 square miles. Records Available.-Chemical analyses and water temperatures: October 1949 to September 1950. Extremes.-Dissolved solids: Maximum, 43 parts per million Aug. 15; minimum, 32 parts per million Mar. 15.
Total hardness: Maximum, 13 parts er million Nov. 15, June 16, Aug. 15; minimum, 10 parts per million Feb. 15, Mar. 15, July 15, Sept. 15. Water temperatures: Maximum, 76" E. June 16; minimum, 48" F. Dec. 15, Mar. 15.
Chemical analyses, in parts per million, water year October 1949 to September 1950
Chemical analyses, in. parts per million, of spot samples
DATE
Oct. 16,1949 ..... Nov. S... . . . . . . . . Dec. 16 ........... Jan. 14,1950 ..... Feb. 16. ... . . . . . . . Mar. 16 ........... April16 ........... b y 1 5 ........... June I& .. . . . . . . . . July 16. .. . . . . . . . . Aug.16 ........... Sept.16 ...........
pE Silica (SiOp)
Specific conduct-
ance (micromhoa a t 25'C.)
Mean din-
charge (aecond-
test)
3,120 2,600 2,500
2,300 5,650 5,240
2.040 3,960 2,880
3,810 1,728 2,600
Tem- pera- ture ('F.)
67
8
52 56 48
53 68 76
75 78 73
6.5 6.5 6.3
7.0 7.0 6.2
6.9 6.0 5.9
6.4 6.8 6.6
Color
-
8 7 8
7 14 7
8 8 2
3 4 4
Sua- pended matter
.. .. ..
.. . . ..
.. .. . .
. . .. ..
6
Imn (Fe)
8odi- um
(Na)
4.14 .04 .01
.U7
.02
.03
.02
.02
.04
.04
.06
.02
Orygen consumed
Cal- cium (Ca)
Unfll- tered -
8.0 2 0 2 2
2.1 2.4 4.0
2.0 17 8.9
11 3.1 4.5
11 Id 12
11 10 10
11 12 Id
10 111 10
Mag- ne-
sium (Mg)
2.6 8.2 2 8
2 7 2.4 2 4
2.6 3.0 3.1
2 4 8.0 2.5
Fil- tered -
1.9 1.0 1.1
1.7 L7 .. 1.6 1.6 1.6
2.0 1,2 1.4
Total hard- nesa aa
CaCOa -
1.1 L 2 1.1
1.1 1.0 .9
1.0 1.2 l.8
.9 L 3 .9
Po- tan-
slum (K)
8.8 2 3 2 2
2.8 2.0 2 6
1.9 5.6 4.3
3.0 2.3 3.0
8.8 0.8 4.0 4.0
4.5 l.l 8.8 3.1
3.9 . 8 8.9 4.3
4.2 l .4 6.0
4.5 1.5
2.4 2.5 3.0
3.0 2.2 1.6
2.6 2 6 2 1
8.8 3.4 2.6
17 19 16
16 14 14
18 12 16
14 2Z 16
Blcar- bonate (HCOs)
0.1 .O .1
.2
.1
.O
.O
.1
.1
.1
.1
.1
Sul- fate
(SO,)
Chlo- ride (Cl)
0.5 .2 .4
.5
.4
.1
.4 1.6 1.9
.7
.4
.5
Ni. tmte (NO.)
Fluo- ride (F)
86 35 39
87 S 52
84 36 41
38 43 37
Dia- aolved aolids

CONGAREE RIVER AT COLUMBIA, 5. C.
Location.-At Coldmbia, Richland County, 1,000 feet downstream from Gervais Street Bridge and 1.4 miles downstream from confluence o f Broad and Saluda Rivers.
Drainage Area.-7,850 square miles. Records Available.-Chemical analyses and water temperatures: October 1948 to September 1949. Extremes.-Dissolved solids : Maximum, 50 parts per million Oct. 14 ; minimum, 41 parts per million Apr. 20.
Total hardness: Maximum, 37 parts per million Jan. 14 ; minimum, 13 parts per million Apr. 20. Water temperatures: Maximum, 78" F. July 15; minimum, 52' F. Jan. 14.
Chenlical analyses, in parts per million, water year October 1948 to September 1949
Choraical analyses, in parts per nill lion, of ~ P o t saw~ples
Silica (SiOd
10 10 8.8
8.6 8.2 8.0
9.4 11 13
12 11 12
Aug. 15, 1946.. . . . Jan. 18, 1950.. .. . Mar. 24 .... . . . ... . May 2. .. . . . . . . . . June 19. .. . . . . . . . .
Iron (Fe)
0.38 .04 .02
.04
.06
.06
.02
.12
.05
.02
DATE
Oct.14,1948 ..... Nov.15 ........... Dec.16 ........... Jan.14,1949 ..... Feb. 15 ........... Mar.15 ........... April 20 ........ .. . May 16 ........... J u n e 2 3 ........... July 15 ........ ... Aug.15 ........... Sept.14 ...........
Sodi- um
(Na) -----
1 Mean d i e
charge (second-
feet)
7,710 5,120
14,500
12,700 14,100 12,400
11,700 10,500 5,970
11,500 5,310
12,900
lProvisiona1 mean daily discharge (second-feet).
9,280 9,620 9,740 6,550 5,130
.47
.21
Cal- cium (Ca)
3.5 3.2 3.1
3.4 3.2 3.4
3.2 3.3 3.4
3.5
Tem- pera- ture
(OF.)
66 60 57
52 54 55
57 62 73
78 75 66
Mag- ne-
sium (a)
1.6 1.4 1.4
2.1 1.4 1.4
1.3 1.6 1.4
1.3
Po. tas- sium (K)
Sus- pended matter
10 11 28
9 9
12
10 23 58
231 14 11
. . 52 55 60 83
3.6 3.7
4.6 ' 0.9 23 7.9 26 7.7 24
5.4 1 22 6.5 22 6.0 22
5.6 20 5.8 22 5.2 a
2.6 1 17
Specific conduct-
ance (micromhos a t 25°C.)
........ 62.4 58.2
57.7 55.1 65.5
55.4 56.3 50.9
49.9 57.0 59.7
Bicar- honate (HCOa)
Oxygen consumed
. . .. . . . . . .
7.5 24 1 5.0 1 25
3.8 3.8 4.3
4.2 4.2 4.1
4.0 3.9 3.2
4.0
Color
6 8 8
8 5 5
6 4 3
3 4
18
Unfil- tered
3.7 3.4 4.6
4.3 3.6 3.8
3.9 3.8 3.1
6.0 3.1 2.8
pH
6.6 6.8 6.2
7.0 7.0 7.0
6.8 6.7 6.6
6.5 7.5 6.7
Fil- tered
3.7 3.4 3.3
3.2 2.9 3.6
3.0 2.6 1.8
2.2 2.6 2.3
.. .. .. .. ..
4.8 5.0
Sul. fate
(SO,)
Chlo- ride (C1)
3.5 3.6 3.6
3.6 ' 3.2 3.2
3.5 3.2 2.8
2.9
.. .. .. .. ..
Total hard- ness a8
CaCOs
Fluo- ride (F)
0.3 .4 .9
.5
.6
.4
.7
.6
.9
.7
0.1 .1 .1
.1
.2
.1
.1
.1
.1
.O 4.5 3.9
9 8 7 3 8
Ni- trate (NOS)
.4
.3
60 47 43
45 42 43
41 46 42
42 .1 .O
Dis- solved solids
--PA
15 14 14
17 14 14
13 15 14
14
7.1 6.7 6.8 7.1 6.5
46 46
15 16
........ 57.3 61.1 61.1 65.1
12 10 12 13 14
0.05 .03 .04 .04 .W
3.3 3.8 5.0 4.6 4.1
1.4 1.6 1.7 1.8 1.4
--
7.8 5.7 5.4 7.3 7.1
3.2 3.6 3.2 3.5 3.2
----
25 21 24 28 21
0.2 .5 .6
1.0 .2
4.4 4.3 5.0 4.0 3.3
1.1 .4 .4 .1
1.0
49 43 49 62 46
14 16 20 19 16

EDISTO RIVER NEAR BRANCHVILLE, S. C.
Location.-At gaging station 400 feet downstream from bridge on U. S. Highway 21, 4.7 miles downstream from Brier Branch, and 5.2 miles south of Branchville, Orangeburg County.
Drainage Area.-1,720 square miles. Records Available.-Chemical analyses and water temperatures: October 1949 to September 1950. Extremes.-Dissolved solids : Maximum, 43 parts per million July 1 9 ;minimum, 25 parts per million Apr. 19.
Total hardness: Maximum, 11 parts per million July 1 9 ; minimum, 6 parts per million Feb. 20. Water temperatures: Maximum, 79" F. July 1 9 ; minimum, 49" F. Feb. 20.
Chemical analyses, in parts per million, water year October 1949 to September 1950
DATE
Oct. 16, 1949.. . . . Nov.16 ........... Dec.15 ........... Jan.17,1950 ..... Feb.20 ........... Mar.19 ........... April 19. .. . . . . . . . . May18 ........... June14 ........... July 19 ....... .... Aug.16 ........... Sept.21 ...........
Oxygen consumed Specific
conduct-
M i l - 1 Fil- 1 tered tered
Tem- pera- ture ("F.)
68 57 51
58 49 66
58 72 74
79 76 73
Mean dia-
charge (wcond-
feet)
1,850 1,540 1,540
1,610 1,540 2,160
1,300 915
1,300
1,340 720
1,680
15 6.9 6.6
8.7 8 2
11
9.0 6.0 9.1
11 4.1
12
Sus- pended matter
. . .. ..
.. .. ..
. . .. ..
.. .. ..
9.5 5.0 4.5
6.3 6.1 6.9
5.9 3.5 6.5
8 4 2.7
10
45 5.9 8 1.9 3.8 0.1 0.2 38 8 22 5.9 8 1.6 3.5 .O .1 27 8 17 6.3 8 1.6 3.9 .O .3 28 7
29 6.4 .7 8 1.8 4.0 .1 .6 29 9 33 6.4 6 1.4 3.6 .1 .1 26 6 28 5.9 10 1.8 3.5 .O .O ZI 8
20 6.1 .5 9 1.7 3.1 .O .4 25 7 12 6.9 8 2.1 3.0 .O 1.6 26 7 21 5.9 7 2.1 3.2 .O .7 S4 7
40 6.7 37.0 10 .5 8 3.7 4.0 .1 .7 43 11 17 6.0 8 1.7 2.8 .1 1.2 26 8 60 6.9 .6 8 1.9 4.4 .O .2 41 8
I

ENOREE RIVER NEAR ENOREE, 5. C.
Location.-At gaging station at bridge on State Highway 30, three-quarters of a mile upstream from Warrior Creek, and 4 miles southeast of Enoree, Spartanburg County.
Drainage Area.-307 square miles. Records Available.-Chemical analyses and water temperatures: October 1947 to September 1948. Extremes.-Dissolved solids : Maximum, 56 parts per million Oct. 15; minimum, 34 parts per million Feb. 17.
Total hardness: Maximum, 15 parts per mill~on May 17; minimum, 7 parts per million July 15. Water temperatures: Maximum, 78" F. June 15; minimum, 39" F. Jan. 19.
Chemical analyses, in parts per million, umter year October 1947 to September 1948
Chemical anulyses, in parts per million, of spot samples
Feb. 25, 1946 ..... 532 0.9 43 Nov.30,1949 ..... 12; 1 % 1 !! 1 1 1 O;;l ii 1 131 1:: May 4, l W . . . . . 65.2 1.2 42 11

NORTH FORK EDISTO RIVER AT ORANGEBURG, 5. C.
L0cotic-n.-At gaging station at bridge on U. S. Highway 301 at Orangeburg, Orangeburg County, 0.5 mile upstream from Atlantic Coast Line Railroad bridge, and 1% miles downstream from Caw Caw Swamp.
Drainage Area.-683 square miles. Records Available.-Chemical analyses and water temperatures: October 1947 to September 1948. Extremes.-Dissolved solids: Maximum, 42 parts per million Sept. 14; minimum, 26 parts per million Aug. 16.
Total hardness: Maximum, 12 parts per million Jan. 1 9 ; minimum, 6 parts per mill~on Oct. 15, July 14. Water temperatures: Maximum, 75' F. July 1 4 ; minimum, 39' F. Jan. 19.
Chemical analyses, in parts per million, water yew October 1947 to September 1948
Chemical analyses, in parts per million, of spot smples
Mar 11 1946.. 0.09 1.6 ... ~ e c May :lS:194g.....l 18, l960.. ... $$ 1 $ 1 !! 1 !: 1 ""$! 1 $ 1 .mi .09 1.6 L 7 1 1 1 021 1 6
Ni- t n t e (NOa)
8111- fate (80.)
Dia- solved solid8
Mag- ne-
sium (Mg)
Total hard- new u
CaCO,
Chlo- ride (CI)
pH DA*
0.6 .6 .7
.8 6 .9
1.2 1.1 .6
.6
.8
.8
Sodium and
Potaaaium Na+K
Fluo. ride (F)
Mean diu-
charge (second-
feet)
Biur. honnte (EGOa)
6.3 6.1 6.8
6.6 6.7 L6
6.7 6.7 6.9
6.7 6.9 6.6
Color Tern. pen- ture
(OF.)
Oct. 15, 1947 ..... N 0 v . Z .......... Dec.16 ........... Jan. 19, 1948.. ... Feb.16 ........... Mar. 9 ........... April 22 ........... May 11 ........... June18 ........... July 14 ........... Aug.16 ........... Sept.14 ...........
S l M 82
81 80 28
M M 82
29 26 42
0.1 .8 .2
.1
.1
.2
.2
.1
.1
.4
.6
.1
0.9 1.9 21
1.1 2.8 2.1
1.9 2 6 La
1.6 1 2 2 6
Specific conduct-
ance (micmmhos a t 26'C.)
491 1460 1:820
1,200 2,410 2,610
602
693 489
1,050
6 7 7
12 8 9
10 10 7
6 9 9
6.1 2 8 1.8
L6 1.2 2.7
1.0. 1.2 LO
2.9 1.7 1.1
Iron (Fe)
30 42 40
76 20 21
65 65 34
17 17 65
.. 48 46
89 46 63
64 66 73
76 74 69
Silica (SiOa)
Sus- pended matter
8.0 3.2 2.9
8.6 8.0 8.2
8.2 2.8 1.1
2.8 2.6 8 9
17 6 6
8 10 9
7 8 8
7 9 6
Ca1- cium (01)
........ ........ ........
........ ........ ........
........ ........ 44.9
........ ........ ........
0.1 .O .O
.O
.O
.1
.1 .O .1
1 .O .O
0.W .03 .O1
.02
.O1 .O1
.02
.09
.01
.05
.01
.04
6.6 6.8 6.8
4.6 8.6 2.7
4.2 4 9 6.2
7.7 6.8 7.6
96 4 6
1 62 2
6 1 U
8 2 8
Oxygen consumed
1 7 1.8 1 8
& 1 2.6 2.0
2 2 2 4 2 0
1.4 2 2 2.3
Unfil- tered
Fil- tered
8.6 12 12
3.4 7.4 L7
6.9 8.8 9.9
7.6 6.8
14
6.4 11 10
6:i 4.9
6.7 7.6 9.2
6.4 3.6
11
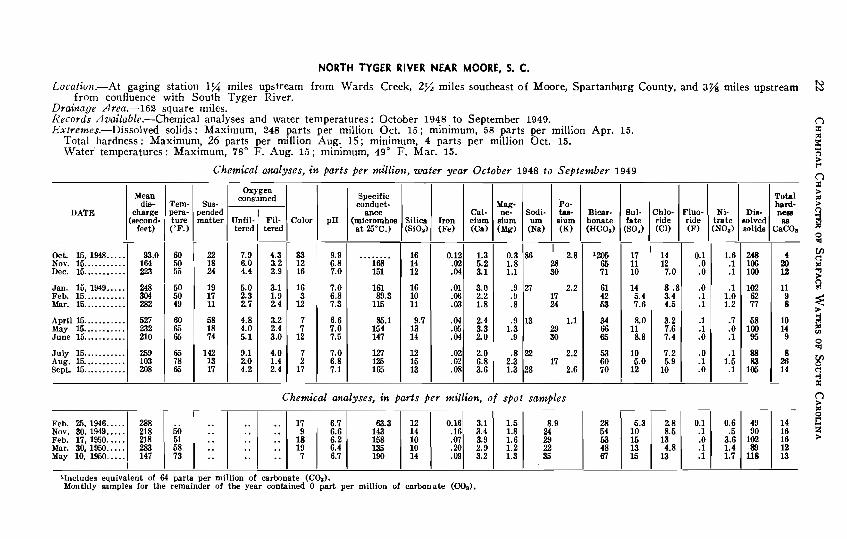
NORTH TYGER RIVER NEAR MOORE, 5. C.
Locotiotr.-At gaging station 1% miles upstream from Wards Creek, 2% miles southeast of Moore, Spartanburg County, and 3% miles upstream from confluence with South Tyger River.
Drainage Brea.-162 square miles. Records Available.-Chemical analyses and water temperatures : October 1948 to September 1949. C) Extremes.-Dissolved solids: Maximum, 248 parts per million Oct. 15; minimum, 58 parts per million Apr. 15.
Total hardness: Maximum, 26 parts per million Aug. 15; minimum, 4 parts per million Oct. 15. s z Water temperatures: Maximum, 78" F. Aug. 15; minimum, 49" F. Mar. 15. Z
Chemical analyses, in parts per milliotr, water year October 1948 to September 1949
DATE
Oct. 15, 1948 ..... N 0 . 1 5 .......... Dec.15 ........... Jan. 15, 1949.. . . . Feb .15 ........... Mar.15 ........... April15 ........... M a y 1 5 ........... J u n e 1 5 ........... J u l y 1 5 ........... Aug.15 ........... Sept. 15. .. . . . . . . . .
Chemical analyses, in. parts per millioa, of spot samples
Specific conduct-
ance (micromhos
a t 25°C.)
........ 168 151
161 89.3
115
85.1 154 147
127 125 165
Feb. 25, 1946 ..... Nov. 30, 1949 ..... Feb. 17, 1950. .. . . Mar. 30, 1950 ..... May 10, 1950 .....
Mean dia-
charge (second-
feet) Silica (SiOd
16 14 12
16 10 11
9.7 13 14
12 15 13
'Includes equivalent of 64 parle per million of carbonate (COs). Monthly aamples for the remainder of the year contained 0 part per million of carbonate (COa).
288 218 218 283 147
Tem- pera- ture ("F.)
--
.. 50 51 58 73
Iron (Fe)
0.12 .02 .04
.01 .06 .03
.04
.05
.04
.02
.02
.OS
Sus- pended matter
lgOlz 223 55
, . x
Oxygen consumed
pH
22 18 24
19 17 11
58 18 74
142 13 17
248 304 282
521 232 210
259 103 208
.. . . .. ..
Cal- cium (Ca)
1.3 5.2 3.1
3.0 2.2 1.8
2.4 3.3 2 0
2.0 6.8 3.6
Sodi. urn (Na)
50 50 49
60 65 65
65 78 65
Mag- ne-
sium (Mg)
0.3 1.8 1.1
.9
.!I
.8
.9 1.3 .9
.8 2.3 1.3
.. .. .. .. ..
7.9 6.0 4.4
5.0 2.3 2.7
4.8 4.0 5.1
9.1 2.0 4.2
Po- tan- sium (K)
33 12 16
16 3 12
7 7
12
7 2
17
4.3 3.2 2.9
3.1 1.9 2.4
3.2 2.4 3.0
4.0 1.4 2.4
.. .. .. .. ..
Bicnr- bonate (HCOs)
9.9 6.8 7.0
7.0 6.8 7.3
6.6 7.0 7.5
7.0 6.8 7.1
86 ' 2.8 28 30
21 2.2 17 24
13 1.1 29 33
22 2.2 17
28 2.6
17 11 10
14 5.4 7.6
8.0 11 8 8
10 5.0 12
Bul- fate
(SO,)
'205 65 71
61 42 53
34 66 65
53 60 70
17 9
18 19 7
Ni- trate (NO,)
Chlo- ride (C1) --
14 12 7.0
8 .8 3.4 4.5
3.2 7.6 7.4
7.2 5.9
10
6.7 6.6 6.2 6.4 6.7
Din- solved solids
Fluo- ride (F)
Total $
?; CaCOa
63.3 143
135 190
248 106 100
102 62 77
58 100 95
88 83
105 --
0.1 .O .O
.O
.1
.I
.1
.1 .O
.O
.1
.O
1.6 .1 .1
.1 1.0 1.2
.7
.O
.1
.1 1.5 .1
12 14 lo 10 14
3.1 3.4 3.9 2.9 3.2
0.16 .16 .07 .20 .09
1.5 1.8 1.6 1.2 1.3
8.9 24 29 22 35
28 54 53 48 67
0.1 .1 .O .1 .1
5.3 10 15 13 15
0.6 .5
3.6 1.4 1.7
--
2.8 8.5
13 4.8
13
-- 0
49 14 90
102 -89 l l 8
16 2 16 * 12 13

PEE DEE RIVER AT PEEDEE, S. C.
Location.-At new bridge on U. S. Highway 76, at Peedee, Marion County, 0.2 mile downstream from Atlantic Coast Line Railroad bridge and 8% miles downstream from Black Creek.
Drainage Area.-8,870 square miles. Records Available.-Chemical analyses and water temperatures: October 1948 to September 1949. Extremes.-Dissolved solids: Maximum, 45 parts per million Nov. 20, Dec. 18, Apr. 17; minimum, 38 parts per million Jan. 15.
Total hardness: Maximum, 18 parts per million Mar. 17; minimum, 13 parts per million Oct. 15, Jan. 15, Feb. 16. Water temperatures: Maximum, 86" F. Sept. 18; minimum, 46" F. Jan. 15.
Chemical analyses, in parts per million, water year October 1948 to September 1949
Chemical analyses, i n parts per million, of spot samples
Total hard-
Ni- Dis- ness trate solved as (NO.) solids CaCOg
DATE
bov. 30, 1949.. . . . Mar. 2. 1950.. . . . May 26 ........... June 28... . .. . . . . .
Mean din-
charge (second-
feet)
Tem- pera- ture ("F.)
57.3 64.8 60.9 68.4
Specific conduct-
ance (micromhos a t 25.C.)
Sus- pended matter
Oxygen consumed
Oct . l5 ,1948 ..... (5.820
6,130 7,250 7,730 5,970
Color
64 60 54
46 64 54
61 67 77
82 78 86
Unfil- tered
Nov.20 ........... Dec.18 ........... Jan. 15. 1949.. . . . Feb. 16 ........... Mar.17 ........... April 17 ........... M a y 1 5 ........... June 19 .... . . . . . . . J u l y 1 7 ........... Aug. 20 ... . . . . . . . . &pt. B... . .. . . . . .
12 9.1 9.3
11
........ 57.2 52.9
46.9 49.5 55.3
68.7 53.5 51.7
53.1 54.4 48.4
pH
------
41 63 41
29 30 27
39 58
126
277 62 53
Fil- tered
7.1 6.2 8.0
5.4 6 4 3.6
4.2 5.1 5.7
9,190 11,600
21,100 15,000 10,100
14,700 23,400 7,410
12,100 13,200 9.860
52 48 74 85
25 11 20
11 16 7
7 5 7
2 6
11
6.3 4.8 6.7
4.2 6.2 3.4
3.5 3.6 3.2
0.46 .08 .04 .08
Po- tas- sium (a)
6.6 6.6 6.6
6.6 6.3 6.9
6.8 6.4 6.5
6.6 6.6 6.4
Silica (Si0.)
5.1 1.9
i t 1 : ----
. . . . 17 . . 9 .. 3 . . .. .. 3 1:
Cal- cium (Ca)
Iron (Fe)
9.4 10 9.9
9.6 8.7 9.3
11 11 9.6
11 10 11
3.2 4.0 3.9 4.1
6.4 6.4 6.3 6.2
Bicar- bonate (HCOJ
2.9 3.6 3.1
3.1 3.1 4.2
3.9 4.0 3.6
3.8 3.6 3.5
--
0.05 .OS .09
.03
.04 .03
.02
.06
.06
.02
.14
.13
Mag- ne-
sium (w) -
1.8 1.7 1.6 1.6
Sul- fate (SO.)
Sodi- um
(Na)
1.4 1.5 1.4
1.3 1.4 1.7
1.7 1.6 1.5
1.4 1.5 1.5
5.6 7.1 5.5 6.2
Chlo- ride (Cl)
Fluo- ride (F)
4.8 0.7 7.1 6.0
5.0 .8 5.7 4.9
5.2 .6 4.3 4.3
4.2 .6 5.2
4.2 1.5
20 25 22 22
4.2 4.6 4.9
4.9 4.4 3.8
4.0 4.1 3.5
3.9 4.2 3.7
18 23 18
18 18 22
24 20 19
20 21 20
4.1 3.9 4.1 3.9
4.6 4.5 4.4
4.6 4.1 3.9
3.6 3.2 3.2
3.5 3.1 4.5
0.1 .O .O
.O
.I
.1
.1
.1
.O
.O
.1
.O ---
4.8 5.1 3.6 3.6
0.0 .I .1 .1
15 17 16 17 2
0.3 .6 .9 .9
48 47 41 44

SAVANNAH RIVER AT AUGUSTA, GA. N .&
Location.-At gaging station at New Savannah Bluff lock and dam, 0.3 mile upstream from Butler Creek and 12 miles downstream from Augusta, Richmond County.
Drainage Area.-7,508 square miles, including that of Butler Creek. C!
Records Available.-Chemical analyses and water temperatures : October 1949 to September 1950. Extremes.-Dissolved solids: Maximum, 47 parts per million Feb. 1 5 ; minimum, 3 1 parts per million Sept. 15.
B Total hardness: Maximum, 15 parts per million Feb. 15, Mar. 1 6 ; minimum, 8 parts per million Sept. 15.
z * P Water temperatures : Maximum, 84" F. Aug 15; minimum, 48' F. Dec. 15. A
w Chemical analyses, in parts per million, water year October 1949 to September 1950 %
Oxygen Mean Specific Total
din- Tem- Sus- conduct- hard- camumed
DATE charge pera- pended Color pH ance CaI- (second- ture matter Unfil- Fil. (micromhw Silica Iron cium sium sium bonate
feet) ('F.) E e d tered a t 25'0.) (Si0,) (Fe) (Ca) ( Oct.15,1949 ..... 8,610 74 .. 3.8 2.7 13 6.4 40.5 12 0.05 8.2 1.0 8.7 0.9 17 2 6 21 0.1 0.8 36 I2 Nov.15 ........... 8,ZM) 57 .. 2.0 1.6 8 6.6 39.1 1s .10 3.0 1.1 4.9 18 2.8 3.2 .1 .S 86 I2 Dec.15 ........... 11,600 48 .. 3.0 1 4 8 6.7 4 .0 16 .03 3.2 1 4 4.8 21 2.3 2 9 .1 .S 41 14
Jnn.16,1950 ..... 7,430 55 .. 2.4 1.6 6 6.9 46.9 14 .04 3.4 1.0 4.9 1.2 20 2 4 3.0 .1 .4 40 U Feb.15 ........... 8,510 65 .. 2.9 2.4 14 6.8 61.1 17 .15 3.6 1.6 4.9 22 2 7 3.1 .I 4 47 15 Mur.16 .......... 20,200 54 .. 6.0 2.4 7 6.6 64.1 15 .05 3.7 1 5 5.2 23 2 8 8.1 .I .4 46 15
April18 ........... 6,830 58 .. 2.4 2.1 8 6.8 467 16 .03 3.1 1.2 4.4 1.0 22 21 2.6 .O .1 42 13 May 16. .......... 6,130 76 .. 2 0 1.4 2 6.7 49.2 l8 .02 3.2 1.3 4.9 n 2 6 2.4 .I .7 18 June16 ........... 6,780 80 .. 3.4 2.0 3 6.8 401 11 .02 2.7 1.1 a 9 16 a 8 1.9 .1 .4 M ll
J u l y 1 7 ........... 18,860 78 .. 6.4 2.0 3 6.5 a6.6 I2 .03 2.6 1.0 3.7 LO 16 2.0 2 4 .I .6 83 11 Aug.15 ........... 3,490 84 .. 1.9 1.2 3 6.7 43.4 14 .09 3.0 1.2 4.6 20 2.0 2.2 .2 .4 40 la Sept.16 ........... 6,830 68 .. 2.6 1.7 5 6.4 34.1 11 .05 2.2 .7 3.7 .9 14 2 0 1.9 .1 .6 dl 8
Chemical analyses, in parts per million, of spot sampIes

MISCELLANEOUS ANALYSES OF STREAMS I N SOUTH CAROLINA Chemical analyses, in parts per million, October 1945 to September 1950
SOURCE
Black Mingo Credr a t Nnrmith ..... Black River a t Kingntree .......... Broad River a t Richtex ............ 1 Broadway Creek near Andemn . . . , Buck Creek near Mayo .............. Buffalo Creek near Blackebur~ .... Buffalo Creek near Blacksbur~ .... Bullock Creek near Sharon ......... Bullock Creek near Sharon ......... Bullock Creek near Sharon ......... BullockCreeknearSharon ......... Bullock Creek near Sharon ......... Bullock Creek near Sharon ......... Cane Creek near West Union ...... Cannon Creek near Pomaria .......
Total hard- ness 81)
CaCO.
Cutawba River near Rock Hill ...... Cedar Creek a t Society Hill ........ Cedar Creek at Society Hill ........ Cedar Creek a t Society Hill ........ Cedar Creek a t bciety Hi11 ........ Cedar Creek a t Society Hi11 ........ Cedar Creek a t Society Hi11 ........ Conerose Creek a t Richland .......... Conerose Creek a t Richland .......... Con~areeCreeknearCayce ........ Congaree Creek near Cayce ........ ... .. Congaree Creek near Cayce .:. Coomwhatchie River near Hampton.
1 Measured discharge. Large proportion of organic matter; sum of mineral constituents 24 parts per million.
DATE
Sept. 27, 1916 .. Mar. 11 ........ Feb. 23 ........ Oct. 27, . Nov. 23, U. .. Feb. 15 ........ May 11, 1950 ... Nov. 7, 1947 ... Feb. 15, 1949 ... Nov. 28 ....... Feb .9 1960.. . Mar. h ....... May 5 ......... June 13 ........ May 10 ........ Sept. 24, 1946 .. May 31. 1949 ... Nov. 28 ........ Feb. 27, 1950 .. Apr. 25 ........ June 1 ........ June 26 ....... Dec. 1, 1499 ... May 12, 1950 .. M a r . 3 0 , W . .
Nov. 23 ....... .. Apr. 24, 19% Feb. 21, 1916 ..
Mean d i e
charge (second-
feet)
2,510 16 6.8 '68.6 B 5.6 i6;i 3.7 .CQ .3 .1 4.6 '99.1 . 32 5.6 20.1 7.6 .02 .9 .8 2.2 '68.0 20 5.0 '46.4 7 5.5 .1 .3 20
'821 14 5.2 '252 9 6.0 '10.5 4 6.7 '53.2 4 6.2 '252 23 5.6
'242 10 5.9 .S 20 '199 12 5.7 .3 14 '361 , 80 6.6 .1 55
18.66 85 6.4 .... 11 0.12 .3 '55
'190 4 6.4 '126 3 6.6 '75.8 6 .. "75.5 6 6.8 '44.8 7 6.6
'6&7 11 6.9 '50.4 4 6.5 '67.8 4 6.3 '17.8 3 6.8
Color pH
Specific conduct-
ance m~cromhos
; t 'W C.) Silica (SiO.)
Iron (Fe)
Cal- cium (Oa)
Mag-
ne- slum (Mg)
Sodium and po- tassium (Na+ K)
Bicar- bonate (HCOS)
Sul- fate
(SO.)
Chlo- ride (C1)
Fluo- ride (F)
Ni- trate (NOS)
Die solved solids

MISCELLANEOUS ANALYSES OF STREAMS I N SOUTH CAROLINA-Continued Che?nical anelyses, in parts per million, October 1945 to September 1950
-- --
SOURCE
Coosawhatchie River near Hampton. Mar. 16 1949 .. 1.2 / 3.0 o r c near C r e e n w d ...I 0 . , 1 . . . I '%.a 1 % 1 :: I 8:: 1 g6 1 :$ 1 ::! 1 2.6 , 8.0 1 1 i:: 1 .!:: 1 :: 1 :t
I I Edisto River near Civhans . . . . . . . . . . Mar. 11, 1946 . . 2,600 92 7.2 .... 1 . 5 .23 5.1 1.0 3.8 18 2.7 5.2 1 .O .2 Ediato River near Qivhans . . . . . . . . . . Feb. 16, 1449 . . 7,630 70 6.1 37.7 4.0 .12 3.7 1.2 2.3 14 1.7 4.1 .2 Eiahteen Mile Creek a t Pendleton . . Oct. 6, 1947 . . . 118.9 3 6.9 .... 2.6 .8 4.8 Fairforest Creek near Union ...... SPpt. 24, 1946 .. 421 18 6.5 Fishing Creek near Fort Lawn ....., Jan. 16, 1950 .. 1145
. 6 3 . 8 1.9 4.4 H:!":: 1 :! 4 7.0 167 10 5.2 12 63 8.1 (8.4 .2 .4
DATE
Gills Creek near Columbia ......... June 7, 1949 .. 138.4 1 8 5.8 Gills k k near Columbia ......... June 14. 1950 .. 135.9 25 5.7 Grove Creek near Piedmont ........ Oct. 25, 1948 ... 3 6.6 Keowee River near N e w ......... Aug 14, 1946 .. 2% / 13 Keowee River near Newry ......... June 15, 1949 .. 1,840 7 60
Color
Mean die-
c h a r ~ e (-nd.
feet)
Kings Creek a t Kinas Creek ....... May 16, 1949 ... 159.4 97.2 14 .m 11 3.0 Kings Creek a t Rings Creek ....... May 2, 1950 . . 4 1 1 : 1 101 16 .OB 11 3.1 Lakes Marion-Moultrie Diversion
Canal near Pineville ........... Sept. 21, 1946 .. ll,100 23 1 6.6 .... 10 .16 3.8 1.4 6.7 Lakw Marion-Moultrie Diversion
Canal near Pineville ........... Feb. 15, 1949 .. 29,500 52.5 9.6 .10 3.6 1.5 Lightwood Knot n e k near Leer i l le Nov. 2, l!M . 111.0 1 2 1 ::n 19.6 4.3 0 2 1 1.4 1 6 \
Total X- 1 Dis- 1 2 solved an solids CaCOS
pH
Little Pee Dee River near Dillon .. Mar. 12, 1946 Little Pe Dee River near Dillon ..I Feb. 24. W 1:) 1.2; 1 3 1 i:: 1 Little Pee Dee River a t Calivants
Ferry . . . . . . . . . . . . . . . . . . . . . . . . . . . . Mar. 12, 1946 3 470 145 5.7 Little River niar Mount Carmel ....I Aug. 15 ..... :::I ' 58 1 5 I . . 1 Little River near Mount Carmel .... Mar. 24, 1949 194 ) 3 1 7.2 )
Spmiflc conduct.
ance (micromhos a t 25" C.)
Little River near Mount Carmel .... June 14. 1950 ..'I 90 '1 3 '1 7.1 'I R5.3 22 / .O1 1 5.6 1 2.4 1 6.1 / 36 / 2.9 1 2.6 / .2 ! .5 1 62 1 24 2 Little Saluda River at Saluda .. .... AUK. 9 ......... 4.22 21 6.5 107 .04 6.5 2.5 10 36 13.7 Long Cane Creek near Abbeville .. Nov. 2 1948 . . . 12i 2 6.6 Long Cane Creek near Abbeville ..I Dee. 2. l949 ..I 7 1 6.9 1 : 1 !! 1 : 1 : j 1 Lynches River a t Effingham ....... I Mar. 12, 1946 . . 842 6.9 .... 1 5.1 ( .36 5.6 1 12 4.3 15.0 1 .O 1 .3 ( a8 1 9
Silica t S i W
Iron (Fe)
Cal- cium (Ca)
Mag-
ne- slum (MK)
Sodium and po- tassium
(Na+ K)
Bicar- honate (HC03)
Chlo- ride (CI)
Sul- fate
(SO.)
Fluo- ride (F)
Ni- trate (NO31
. . Lynches River a t Effingham ....... Apr 28 1950 .. 469 1 6.0 42.1 ....... Lynches River a t Effingham June 2 ......... 401 7.6 35.6 .. Middle Tyger River a t Lyman ..... Sept . 23. 1946 ... . Ninety Six Creek near Ninety Six . I Dec . 2. 1949 1 1 2 . 9 8 1 '1 1 I i%
North Fork Edisto River near North . June 14. 1950 22 7
.. North Pacolet River a t Fingerville Sept . 23. 1946 North Pacolet River a t Fingerville ::I May 18. 1949 . . ......... ... Pacolet River near Clifton / Feb . 26 . 1946 .. I'acolet River near Olifton . . . . Fcb . 15. 1949 ..... Pee Dee River near Mars Bluff 1 Mar . 12. 1946 ..
. Pee Dee River a t Society Hill .... Mar 2 1950 ... "6. 870 / 9 ........ Pee Dee River a t Society Hill .... June 28 '5. 490 3 Red Bank Creek a t Red Bank ..... June 19 ........ ' a 9 S Reedy River near Ware Shoals ..... Aug . 12, 1946 .. 18 Reedy River near Ware Shoals . ) Feb . 14. 1949 . % 1 12
225 198 7l5 @?
8. 100
........ Rocky River near Anderson Rocky River near Calhoun Falls . ... Rocky River near Calhoun Falls Salkehatchie River near Barnwell . .
6.7 6.5 5.4 . . 6.6
Salkehatchie River near Hampton . . .. Salkehatchie River near Hampton ....... Saluda River near Columbia
7 1 6.1 6.9 6.9 ! 1 6.8
15 7.3
65.1 58.8 19.9 .... 90.7
(State Highway 64) Salkehatchie River near Barnwell . . 1 Mar . 16. 1949 . . (State Highway 3) 1 lz4 1 6.7 1 41.4
1 1
......... Dec . 2 '34.1 5 Feb. 10. 1950 .. / '270 I gI . Apr 27 ........ '85.8 Feh . 27, 1946 . .
..... Baluda River near Ware Shoals Saluda River near Ware Shoals ..... ............ Sandy River near Leeds ............ Sandy River near Leeds
1 Measured discharge . ' Large proportion of organic matter; sum of mineral constituents 24 parts per million .
.... 51.5 32 7 36.8 ....
6.7 57.2 1 3 . 5 59.7 41.3
Sept . 23. 1946 .. .... .. Feb . 14. 1949 . .. 57.3 Dec 16. 1949
... 88.8
May 4. 1950
Savanna11 River near Calhoun Falls . Savannah River near Millhaven . Ca . Seneca River near Anderson ........ Seneca River near Anderson ........
a Large proportion of organic mbtter; sum of mineral constituents 12 parts per million . ' Large proportion of organic matter; mm of mineral constituents 20 parts per million .
Sept . 25. 1946 . . 1 '196 Jan . 25. 1950 ... 12.50
Savannah River near Cnlhoun Falls .I Aug . 15. 1946 . . .... Mar . 4. 1949 ... 6. 230 38.1 May 25 ......... 48.7 Aug . 14 . 1946 .. 1. .... June 16. 1949 .. 3.470 30.5
55 28 13 Sept . 25. 1946 .. ..... Saluda River near Qreenville Aug . 13. 1946 ..
Saluda River near Qreenville ..... / June 14. 1949 ..
Shaw Creek near Eureka ...........I Sept . 24 . 1946 .. '41.0 ....
8 4
3. 640 310 755
6.9 6.7 6.2
.... 63.6 ....
6:3 %7

MISCELLANEOUS ANALYSES OF STREAMS I N SOUTH CAROLINA--Continued to September 1950
SOURCE
Shaw Creek near Eureka ........... Shaw Creek near Eureka ........... Shaw Creek near Eureka ........... ShawOreeknea rEureka ........... ShawCkeeknearEureka ........... South Fork Edisto River near
Denmark ........................ South Fork Edisto River near
Denmark ........................ South Fork Edisto River near
Montmorenci .................... South Fork Edisto River near
Montmorenci .................... Sauth Ty-r River near Reidville .. South T y ~ e r River near Woodmfl ... ... South Tyger River near Woodrul? Stevens Creek near Modoc .......... Stevens Creek near Modoc .......... Thicketty Creek a t Thlcketty ...... Thompson Creek near C h e w ...... Thompson Creek near Oheraw ...... Thompson Creek near Cheraw ...... Twelve Mile Creek near F'ickeu ... Tyge rR lve rnea rDe l t a ............ Tyger River near Wwdr?lff ......... Waxhaw Creek near Sprln~dell ..... Wilaon Creek near Iva ............. ..... Wilmn Creek near Ninety Six Wilson Creek near Ninety Six .....
1 Meewed discharge.
Mag- ne-
aium (Mg)
1945
Cal- cium (Ca)
l.4 2.2 1.6 1.1 2
1.6
2.0
.8
1 0 2.6
3.0 2 8 8.2 8 4 2 8
1.9 2.2 3.1 2 5 6.Z
2.8 8.6 2 8 8.8 8.4 -
in parts p e r million, October Chemical analyses,
Sodium and po- tassium
(pf DATE
May 23, 1949 ... Dec. l2 ........ Apr. 24. 1950 .. M a y 2 3 ........ J u n e l 6 ........ Y t a r . l l , W . .
Mar. 16, 1949 .. Mar. ll. 1946 .. Map 23, 1949 ... May 17 ........ Feb. 25 EM .. : May 17: EM9 .. Aug. 15, 1946 .. Map 23, 1949 .. May 18 ......... Oct. 29 1947 ... Mar. 3' 1950 ... May 24 ........ June 16, 1949 .. May 10, 1950 .. May 12 ........ Mar. 27 ........ Aug. 14 .......
Color
Mean din-
charge (second-
feet)
143.1 147.8 129.7 137.4 128.3
648
1,090
196
188 234
201 257
7.6 90.0
l a 2
130.8 1156 193.0
1166 1609
368 125.6 10.3
Bicar- bonate (HCOa)
Specific conduct-
ance (micromhos a t 25' C.)
ph
.4 1 0 .5 .6 .6
.7
.7
.7
.4
.8
l.3 LO 3.6 3.7 1.3
l.1 l.2 1.6 LO 2 1
l.1 2.9 l.8 3.7 3.3
: 8 6 7
9
8
8
6
17 17 49 52 14
12 12 17 16 35
67 49 17 51 46
m y 10 ......../ 124.3
3.2 2.5 3.7 3.1 3.6
3.3
2.2
4.0
4.1 4.0
3.4 4.9 8.3 9.5 3.9
4.3 5.2 6.3 3.7 10
35 8.9 2 6 9.4
10
17 7 6 9 6
66
. 21
33
17 4
27 3
16 l2 4
38 . 18 5 2 3
7 6 " i 7 June 14 ........
Silica (SiOa)
::: 1.2 1.2 .9
1.8
1.6
2.1
3.4 1.9
2 3 2 9 4.1 4.4 4.9
1.4 2.1
6.1
11 4.3 2.0 4.8 3.6
Sul- fate
(SO,)
119.9
Iron (Fe)
5.6 7.7 8.6 6.2 6.6
1.7
2.6
3.4
6.0 11
14 12 14 17 12
8.5 5.7 7.2 l2 16
15 18 20 28 26
Dis- solved solids
.06 I .06 .I0 .06
.08
.04
.I3
.04
.05
.12
.05 .05 .26 .Oa
1.1 .l2 .38 0 6 .%
.06
.03 .05 .I3 .22
26.5 bf 1 27.0
Total hard- new as
CaCO.
Chlo- ride (CI)
6.0 7.2 6.0
6.2
6.8
6.5
5.8 6.8
6.9 6.8 .. 7.3 6.9
6.9 6.2 6.2 6.2 6.6
6.5 7.0 6.8 6.6 6.7
5
6 10
6 6
7
1.3 27.4 25.6 21.1
.... 22.9
.... 20.0 35.4
41.0 40.4
lii" ... .... 45.7 61.4 32.8 92.9
183 103 40.8
121 127
Fluo- ride (F)
26
Ni- trate
(Nod
::: ( ( 1:; I 5
3.4
3.1 2.2
2.1 2.4 6.8 6.4 2.4
6.0 6.6
2l
23
Z1 S
41 37 74 77 35
42 34
22 !B
28
b 6
6.4
15 6.5 2 1 6.2 8.8
6
4 10
18 11 35 36 ]a
9 10 14
. O I .2
.O
.O
.O
.1
.1
.1
.1
.1
.O
.O
.7 1.4
.2
3.2 3.2
3.4
.2
.3
.9
9 1.3 .5 .3 .7
.4
.4
3.1
.1 .1
.O
10 22
l2 33 14 87 34
:: .6
. 1
.1
.2
. 1 kf
I 1.6 66
.8
.1
.7
116 76 4
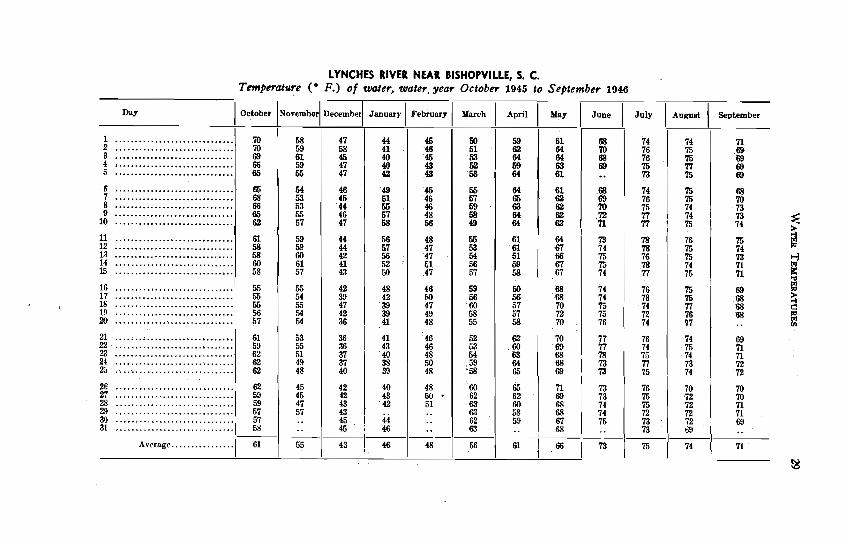
LYNCHES RIVER NEAR BISHOPVILLE. S . C . Temperature ( O F.) of wafer. water . year Octobm 1945 to September 1946
Day I October INovtmber/ Decemberl January 1 February / March ( April I Yay ( June I July I August September
26 .............................. 62 45 48 60 65 n 2: 59 60 62 62
73 .............................. 29 59
69 73 .............................. 42 51 63 60 23 57
6s 74 .............................. 57 63 58 68 74 30 .............................. 57 45 1 44 62 31 58
59 67 75 73 .............................. 69 45 1 46 63 68 73 6
I.... .... Average ................ 55 48 56

SALUDA RIVER AT CHAPPELLS. S . C . Temperature (" F.) of woter. woter year October 1946 to September 1947
Day e I July I A u ~ n t I L~tember
1 .............................. 2 .............................. 3 .............................. 4 .............................. 5 .............................. $ . ............................. .............................. ; .............................. 9 .............................. .............................. 10 66
11 .............................. 68 12 .............................. 13 .............................. 14 .............................. 15 .............................. 16 .............................. 17 .............................. 18 .............................. 19 .............................. 66 U) .............................. 66
21 .............................. 65 22 .............................. 64
75 75 74 74 74
74 73 75 73 74
75 76 75 73 76
76 76 76 TI 75
75 76 76 76 75
75 74 75 76 77 77
21 .............................. 24 .............................. 25 ..............................
Average ................ 51 1 48 43 45 6 8 ) 6 6 / 7 2 1 7 5 '% I 61
78 76
79 79 78 76 78
78 77 TI TI 77
75 76 75 TI n
' 76 77 76 77 7'7
78 78 79 78 82
79 79 79 80 79 TI
63 63 65
- TI 79 79 80 80
80 79 79 79 79
79 79 78 TI 78
TI 78 77 TI 76
75 75 72 70 n 70 69 67 €6 65 . .
24 .............................. 65 69 46 48 47 63 2; .............................. 64 60 48 41 62 28 .............................. 65 58 46 47 60 29 .............................. L 67 . . 47 62 30 .............................. €6 58 48 63 31 .............................. G6 49 49 .. 48
58 54 5s
I----
68 68 70 70 70 70
46 47 4s
73 74 74
74 75
45 45 46
43
41 41
47 48 48
60 61 6.2
68 68 68
70 n 73
WATEREE RIVER NEAR CAMDEN. 5 . C . Temperature (" F.) of water. w t e r year October 1946 to September 1947
October November December 1 1 1. January February .-
Mmch ( April / May ( June I July I A u ~ n t September
26 .............................. 65 58 37 27 .............................. 65 58 40 28 .............................. 65 58 49 44 38 29 .............................. 30 .............................. 66
65 31 ..............................
58 55
64 -
. . . . -
60 ................ Average I 67 " 1 1 - . - 49 46
.. .. 41
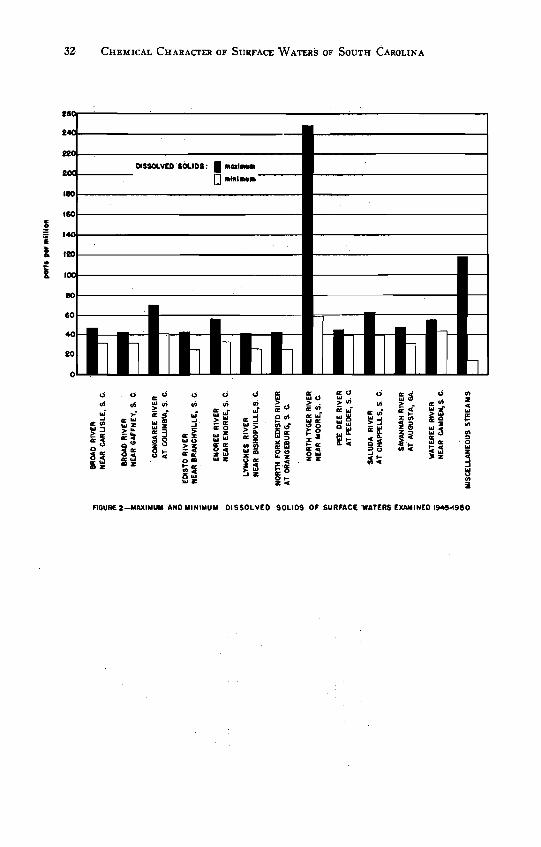
FIGURE 2-MAXIMUM AND MlNlUUM DISSOLVED SOLIDS O f SURFACE 'WATERS EXAMINED 1-1950

FIGURE 3-I*PXIMUM MOMlNlYUM TOTAL HARDNESS AS C o w 3 OF SURFACE WATERS EXAMINED 1945-1950

BROAD RIVER NEAR BOILING SPRINGS, N. C.
Location.-At bridge on county road, a quarter of a mile downstream from gaging station, a quarter of a mile upstream from Sandy Run Creek, and .3'/2 miles southwest of Boiling Springs, Cleveland County.
Drainage Area.-864 square miles. Records Available.-Chemical analyses and water temperatures : October 1945 to September 1946. Extremes.-Dissolved solids: Maximum, 45 parts per million June 11-20; minimum, 28 parts per million Jan. 1-10, 21-31, Feb. 1-10.
Total hardness: Maximum, 13 parts per million June 1-10, 11-20; minimum, 8 parts per million Jan. 1-10, Feb. 1-10. Water temperatures: Maximum, 81" F. Aug. 6, 7, 12, 13, 19, 20, 31; minimum, freezing point Feb. 3, 4.
DATE
Oct. 1-10, 1945.. Oct, 11-20.. ..... Oct. 21-31 ....... ....... Nov. 1-10 Nov. 11-20 ....... ..... Nov. 21-30..
M e b dis-
charge (second-
feet)
..... Dec. 1-10.. ..... Dec. 11-20.. Dec. 21-31.. ..... Jan. 1-10, 1946.. ..... Jan. 11-20.. Jan. ZL-31.. .....
April 1.10. ...... 1 2,038 1 64 April 11-20 ....... 1 1,877 1 60
Tem- pera- ture (OF.)
1,108 1,025 994 911 943
1,359
Peb. 1-10 ....... Feb. 11-19 ....... ....... Feb. 20.28 .. 1-10,. ..... ..... Mar. 11-20.. Mar. Zl-31.. .....
Chemical analyses, in parts per million, water year October 1945 to September 1946
65 59 59 54 56 51
2,361 1,563 3.137 5,805 2,816 1,970
Oxyg-en 1 I consumed I
46 43 45 47 43 42
2.941 3,641 2,089 1,701 2,841 2,388
pended Unfil- Fil- Color 1::: IJZI
38 43 44 46 48 61
Bicar- bonate (HE%)
i; 19 17 L8 17
15 15 14 ll 14 12
12 14 15 14 13 14
14 14
Sul- fate (SO,)
:; 2.3 2.2 2 7 3.0
2.5 2.3 2.5 2.7 2.2 2.2
2 7 2.3 2.3 1.9 1.9 1.5
1.6 1.5
Chlo- ride (C1)
Fluo- ride (F)
I I
Ni- trate (NOJ
Dis- solved solids
Total hard- ness an
CaCOs

1.1 1.8 1.1 1.a 1.8 2.2 1.8 2.4 2.6 2.0
2 2
81 4.8
13 9.6
5.3 6.3 6.5 6.2
April 21-30.. ..... 1.688 61 256 1-10 ....... 2.305 62 212 Ei; ll-20 ....... 12,061 1: 1 5 %
8 8 8 4
4 4 5 4 3 4
3 ........ Aug. 11-20 ....... 904 80 3 .. AUK. 21-31.. ..... ........ &pt. 1-10 ....... ........ .. %.~t. 11-20.. ..... ........ ........ Sept.21-30 .......
Average.. .. 1,818 ........ -
xs 185 254 205
my 21-31.. ..... 1,m
Chemical anqJyses, in parts per million, o f spot samples $
1 I I ........ Nor. 1 0 , U U .... / BQ ) .. 1 5 8 1 .. 1 . . 1 5 1 . . 1 113 l 0 . 0 7 2 . 2 i l . l I 4.5 1 1 9 ( 1 . 7 ( 1 . 5 / 0 . 1 ( 0 . 2 ( 3 5 / 10 r 2 H
12 12 14 12 11
11
( 7.1 5.0
347 9.6 .02 .02 .02 .04 .03
0.04
69 70 75 75
an 80
June 1-10. ...... June 11-20,. ..... June 2149. ...... ..... July 1-10..
..... July 11-20.. July 21- 31 ....... Aug. 1-10 .......
.. .. .. . .
.. .. .. .. .. ..
..
1,405 1,416 1,149 1,412 1,369 1.m 1.308
3.2 2.6 2.8 2 9 2.6 ---- 2.5
20 15 19 17 18
16
........ ........ ........ ........
........ ........ ........ ........ ........ ........
........
.07
.07
.04
.m
.02
.02
.04
.04
.04
.02
.02 2 2 2 6 21 2.8 3.0 -- 2.3
1.6 2.0 2.5 2.0 2.2
10 10 9.5
10
14 14 14 11 13 13
10 1.1 1.0 1.3 1.0 1.0
1.0
2.2 2.3 2.4 2.4
3.0 3.0 2.4 2.6 2 4 2.6
2 6 4.1 3.6 4.3 4.3
3.9 1.2
4.0
14 16
16 15
23 24 18 16 17 20
19
1.6 2.1
1.5 1.6
2.5 2.3 2.1 2.0 2.1 2.3
4.1 12 11
!: 11 2
.8
.9
.9
.9
1.3 1.3 1.0 1.1 1.0 1.1
1.1
1.4 1.5
1.5 1.4
3.8 3.8 2.2 1.8 2.0
7 i;
37 34 38 37 36
.O
.O
.O
.2
.2
3.2 4.0 3.2 3.5
6.8 7.1 4.9
3.0 1.2 4.4 5.2
5.6
.1
.1
.I 1
.1
.1
.1
.1
.6 9
.5
.4 10
.6 I " !: 7
.5
.7 .6 .5 .3
ib( or
L 8
2.0
.6 44
.7 45
.7 38
. 8 , 3 4 36
.a
13 13 10 11 10 11
11
40
40
:: I :I .O .8

W
LUMBER RIVER AT BOARDMAN, N. C. 0\
Location.-At gaging station at bridge on U. S. Highway 74, 1 mile downstream from Atlantic Coast Line Railroad bridge at Boardman, Co- lumbus County. CI Drainage Area.-1,220 square miles. Records Available.--Chemical analyses and water temperatures : October 1946 to September 1947.
E 2
Extremes.-Dissolved solids: Mz'ximum, 59 parts per million Sept. 21-30; minimum, 28 parts per million Mar. 1-10. ii Total hardness : Maximum, 11 parts per million Nov. 21-30, Aug. 21-31 ; minimum, 6 parts per million Feb. 11-19, 20-28, Apr. 21-30, May 11-20,
June 11-20, 21-30, July 1-10. CI Water temperatures: Maximum, 82" F. June 11; minimum, 36" F. Feb. 11. x
% Chemical malyses, in parts per million, water year October 1946 to September 1947 6
Oct. 1-10, 1946.. 564 64 11 15 12 85 6.0 ........ 6.5 ........ k t . 11-23 ....... ll,M 62 5 24 22 I l l 0 5.7 8.9 ........ Oct. 21-31 ....... 786 63 10 18 15 ll0 5.7 7.5 Nov. 1-10.. ..... 958 63 6 21 17 150 5.4 ........ 7.3 NGV. 11-20.. ..... 782 55 7 18 17 110 5.5 ........ 7.5 Nev. 21-30. ...... 1,002 54 5 18 17 1 110 81 ........ 3.7
DATE
Dec. 1-10. ...... 115 6.0 ........ 7.2 ........ 6.6 ........ ........ 4.5 ..... ........ 4.4 ....... Jan. 2l.31 ........ 5.2
..... Feb. 1-10.. 1,316 ....... Fcb. 11-19 913 ....... Feb. %28 828 Mar. 1-LO ....... 982 ..... Mar. 11-20.. 1,992 Mar. 21-31.. ..... 1.896
Yem die- Tem-
charge pera- Sun- Color Iron
(Fe) pH
Cal- cium (Ca)
Specific conduct-
ance (micromhon at 25' C.)
Mag-
ne slum (Yc)
Silica (SiOa)
Sodi- um
,(Na)
Po- tan- nium (K)
-
Bicar- bonate (HC%:
Sul. fate (SO.)
Chlo- ride (C1)
Fluo- ride (F)
Ni- trate (8%)
Din- mlved solids1
Total hard- ness aa
CaC%

--- .- .- . k S. C A A A 2 g 845.3 titikddd . aaa zz3sgs 222222 442&&$ I

PEE DEE RIVER NEAR ROCKINGHAM, N. C.
Location.-At gaging station at bridge on U. S. Highway 74, 1 mile upstream from Falling Creek, 4 miles downstream from Blewett Falls hydroelectric plant, and 6 miles west of Rockingham, Richmond County.
Drainage Area.-6,870 square miles. Records Avoi1able.-Chemical analyses and water temperatures : October 1946 to September 1947. Extremes.-Dissolved solids: Maximum. 57 Darts Der million Jan. 1-10: minimum. 44 Darts per million Mar. 1-10.
Total hardness: Maximum, 21 parts per &ll ion '~ec. 21-31,jan. 1-10, May 21-31, June 1-10; minimum, 16 parts per million Mar. 1-10, 11-20, Apr. 11-20, Sept. 21-30.
Water temperatures: Maximum, 83" F. Aug. 25-27; minimum, 39" F. Feb. 9.
Chemical analyses, in parts per million, uroter year October 1946 to September 1947
charge DATE
Oct. 1-10. 1946.. 5.530 . Oct. 11-20 ....... '4.7% Oct. 21-31 ....... 3,412 Nov. 1-10.. . . . . . 2,576 Nov. 11-20.. . . . . . 3,763 HOV. n-a. ..... . 4,m I Dec. Dec. Dec. Jan. Jnn. Jan.
Feb. 1-10.. . . . . . 5.696 Feb. 11-19.. . . . . . . 5,867 Feb. 20-28.. . . . . . 8,167 Mar. 1-10.. . . . . . 10,250 Mar. u-20.. . . . . . 11,m Mar. 2l-31....... 7,691
Tem- pera- ture (OF.)
Oxygen 1 consumed
Oolor pH
I I
Specih I conduct- Map Po-
Cal- Sodi. tas- Bicar- Sul- Chlo- Fluo- Iron cium s2& urn aium bonate fate ride ride (Fe) (Ca) (Ma) (Na) (K) (HCOa) (SO.) (GI) (F)
I I
Total hnrd-
Ni- Dis- ness trate solved M ( N 4 ) solids C a C 4
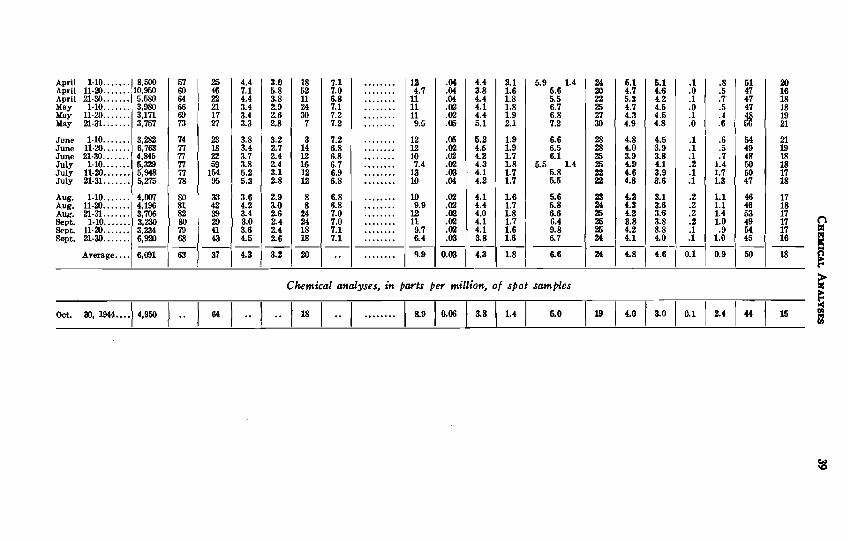
April 1.10 ....... April 11-20 ....... April 21.30 ....... 5, 580 22 Yay 1.10 ....... May ll-20 ....... 3. 171 17 ....... June 1-10 ....... June 11.20 ....... June 21.30 ....... July 1.10 ....... July ll-20 ....... July 21-31 .......
Chemical analyses. ifi ports per million, o f spot samples $ 5;
Aug . 1-10 ....... 4. 007 A . 1 . . 1 . . E6 Aug . 21.a ....... 3. 706 Sept . 1-10 ....... 3. 230 Sept . 11.20 ....... 3. 234 Sept . 21.30 ....... 6.9a)
3. 282 6.763 4. 845 5. 329 5. 948 5. 275
33 42 39
80 1 2 79 68 43
Average . . I--- 6, 091 63 1 31
74 77 77 77 77 78
23 18 Z! 59
154 95

&
PEE DEE RIVER NEAR ROCKINGHAM, N. C. 0
Location.-At gaging station at bridge on U. S. Highway 74, 1 mile upstream from Falling Creek, 4 miles downstream from Blewett Falls hydroelectric plant, and 6 miles west of Rockingham, Richmond County. 0
Drainage Area.-6,870 square miles. m Records Available.-Chemical analyses and water temperatures : October 1947 to September 1948. I2 Extremes.-Dissolved solids: Maximum, 54 parts per million Jan. 11-2'0, Mar. 21-31; minimum, 38 parts per million Mar. 1-10. 8
Total hardness : Maximum, 24 parts per niillion Mar. 21-31; minimum 13 parts per million Mar. 1-10. $ Water temperatures: Maximum, 83" F. July 30, 31, Aug. 1 ; minimum, 33" F. Feb. 13. 9
Chemical analyses, in parts per million, water year October 1947 to September 1948 S E'
Mean dis-
charge DATE (second-
feet)
1 Oct. 1-10, 1947.. 3,506
..... Oct. 11-20.. I 5.308 Oct. 21-31.. ..... 7,916 Nov. 1-10. ...... 16 880 Nov. 11-W.. .... .!1$890 KOV. 21-30.. ..... )ld,460 I
Fcb. Feb. Feb. Mar. Mar. Mar.
April 1-10.. .I24 440 I .... ...... ~ p r i l U-a) .(ll;770 1
Oxygen
Tem- I / conaumed 1 I 1 pera- Sus- ture pended Unfil- Fil- Color ('F.) / m a t h 1 bred 1 k e d I I pH 1
Specific I I conduct-
(microml~os Silica a t 25" C.) (SO2) I I
Po- Cal- =n? Sodi- taa- Bicar- Sul- Chlo-
Iron cium sium urn sium bonate fate ride (Fe) (Ca) (YE) (Na) (K) ( K C 6 (SO.) (C1)
--
Fluo- Ni- Dis- ride trate solved (F) (N%) mlids
I I
m a 1 a hard- ness $
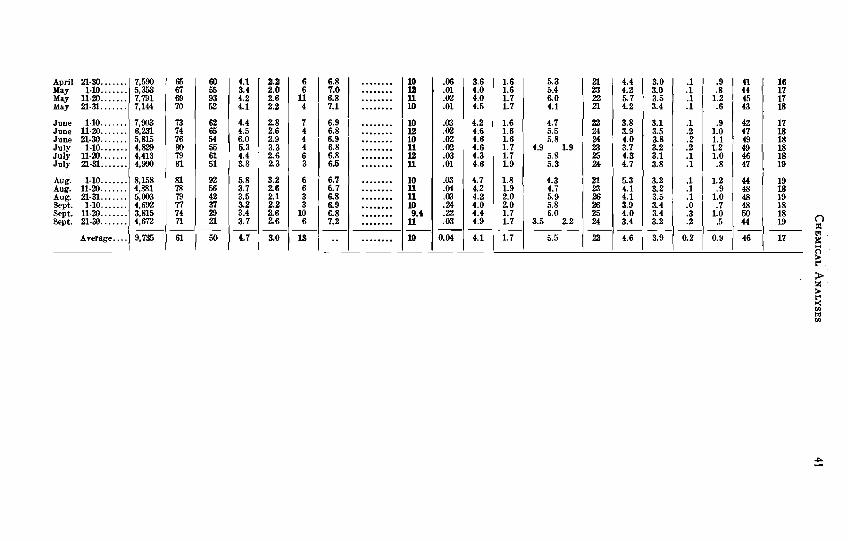
June 1-10.. . . . . . June 11-20 ....... June 21-30.. . . . . . July 1-10.. . . . . . July 11-ZO. .. . ... July 21-31 .......
7,903 6,23l 5,815 4,829 4.413 4,990
Aug. 1-10.. . . . . .\ 8,158
April 21-30 ....... May 1.10.. . . . . . May 11-20.. . . . . . May 21-31.. . . . . .
Aug. 11-20.. . .. . . Aug. 21-31. .. .. .. Sept. 1-10 ....... Sept. 11-20.. ..... Sept. 21-30,. . . . . .
7.590 1 - I I I 5.3 5,358
I 7,791 7,144 8.2 4.1 18
4,881 5,OW 4,692 3,815 4,672
*"era ge....! 9 i
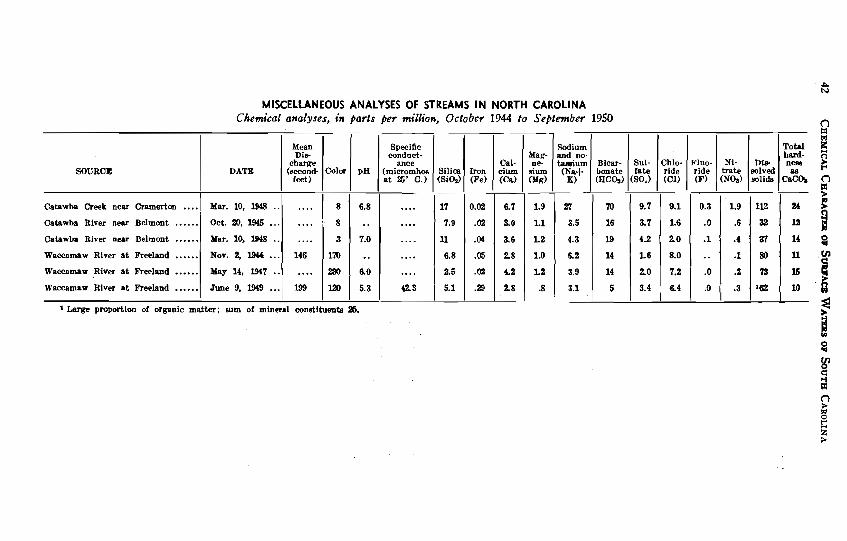
R MISCELLANEOUS ANALYSES OF STREAMS IN NORTH CAROLINA
Chemical analyses, in parts per million, October 1944 to September 1950 j:
Large proportion of organic matter; sum of mineal constituente a6. e I UO
3
SOURCE DATE
Mean Dis
charge
feet) (sccond-
Bicar- bonate ( H C a )
Sodium and DO- t-um (Na+ K)
pH Color
Catnwba Creek near Cramertm .... I Mar. 10, U. 2
24
I2 8 14 3 11
U
10 a
6.8
.. 7.0
.. 6.0
5.3
Specific condud-
ance (mimomhoe a t 25' C.)
Catawba River near Belmont ...... Catawba River near Belmont ...... Waccamaw River a t Freeland ...... Waccamaw River a t Weeland ...... Waccamaw River a t Weeland ......
. . . . . . I 8
. . . . . . . . ~ 8
T o w !2 nem " I aa
C a C h C)
Sul- fate
(SO.)
Oct. 20, 1945
Mar. 10, 1498
Nor. 2, 1944 ... May 14, 1347
June 9. I949 ...
. . . . . . 146
. . . . . . l99
....
....
....
....
.... 423
3
170
230
99
Silica {SiQI)
Chlo- ride (C1)
Cal- cium (Ca)
Iron (Fe)
Man-
ne. slum (Mu)
17
7.9
11
6.8
2.6
5.1
Fluo- ride (F)
0.02
.m
.CW
.05
.m
.23
Ni- trate (NOD)
6.7
t 0
3.6
2 8
&2
2 8
Dls mlved solids
1 9
1.1
1.2
1.0
1 2
.8
9.7
3.7
4.2
1 6
1 0
3.4
9.1
6
2.0
8.0
7.2
6 4
0.3
.O
.1
.. 0
.O
27
3,s
4.3
6 2
3.9
3.1
70
16
19
14
14
5
1.9
.6
.4
.I
.2
.3
112
32
27
&>
n '62

8188s 8gFe8 8PCC6 6RSFF FFFFZ:
-- 88'3BG @%BY@ 8%%%% @B%%M 8818% 888618

88BRR FGBXX BEFEZ FREES EEZB2 Z E E Z R : F CJ
SSk?EE FGGFG %S?2F@ E Z a 8 6 FEESF F E Z S F : R CJ
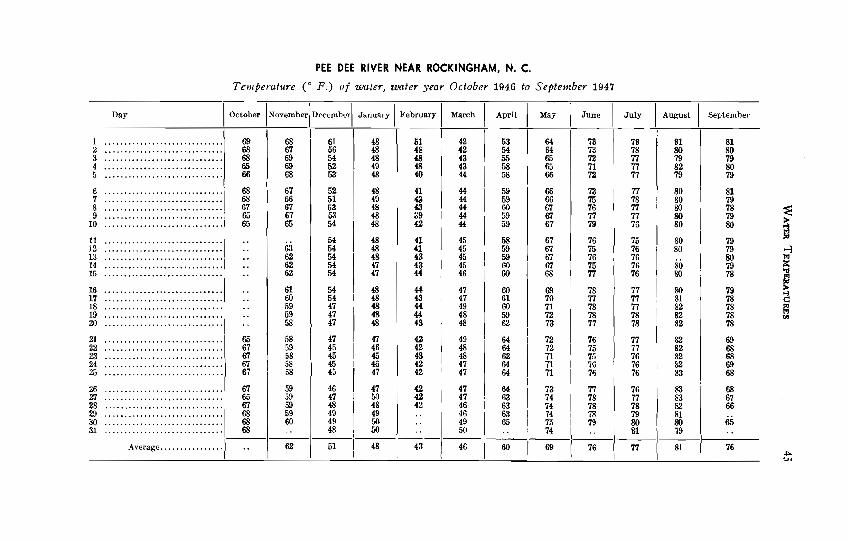
PEE DEE RIVER NEAR ROCKINGHAM. N . C . Tenrperatz~re (" F . ) of water. water year October 1946 to September 1947
Day I October (November[Deccrnberl January I February / March I April ( May / June /
.. 1_-1-1- 1 Average ................ 62 1 51 /817-!(6 60 1 69 i 76 1
July I Auwat I Sertenlhs

