bulk density and soil resistance to penetration as ... · pdf filebulk density and soil...
TRANSCRIPT
United StatesDepartment ofAgriculture
Forest Service
Pacific NorthwestResearch Station
Research PaperPNW-RP-551April 2003
Bulk Density and Soil Resistance to Penetration as Affected by Commercial Thinning in Northeastern Washington
Johanna D. Landsberg, Richard E. Miller, Harry W. Anderson, and Jeffrey S. Tepp

Johanna D. Landsberg, retired, was a soil scientist, Forestry Sciences Laboratory, 1133 N Western Avenue, Wenatchee, WA 98801; Jeffrey S. Tepp is a soil scientist, Superior National Forest, 8901 Grand Avenue Place, Duluth, MN 55808; Richard E. Miller is an emeritus scientist, and Harry W. Anderson is a volunteer, Forestry Sciences Laboratory, 3625 93rd Avenue SW, Olympia, WA 98512-9193.
Authors
Abstract Landsberg, Johanna D.; Miller, Richard E.; Anderson, Harry W.; Tepp, Jeffrey S. 2003. Bulk density and soil resistance to penetration as affected by commercial thinning in northeastern Washington. Res. Pap. PNW-RP-551. Portland, OR: U.S. Department of Agriculture, Forest Service, Pacific Northwest Research Station. 35 p.
Bulk density and soil resistance to penetration were measured in ten, 3- to 11-ha operational units in overstocked, mixed-conifer stands in northeast Washington. Resistance was measured with a recording penetrometer to the 33-cm depth (13 in) at 10 stations on each of 8 to 17, 30.5-m-long, randomly located transects in each unit. Subsequently, different combinations of felling and yarding equipment were used to thin eight units; no combination was replicated. Two units remained as nonharvested controls. Soil measurements were repeated after harvest. Most trails were designated, others were supplemental, especially where designated trails were spaced at 40 m (130 ft) (center to center). Trails occupied 6 to 57 per-cent of the area of harvested units. In the 15- to 25-cm depth, average resistance to penetration on trails increased by 500 kPa or more in six of the eight units. Drier soil in the after-harvest sampling on the flat terrain may have contributed to in-creased resistance. Bulk density on trails after harvest (fall 1999) averaged 3 to 14 percent greater than that in nontrail portions. Area and severity of soil compaction were less on steep terrain than on flat terrain, probably because soil textures were sandier. Whether compaction was sufficiently severe to hinder root penetration or reduce tree growth is unknown. The absence of replication precluded statistical testing for differences among the several combinations of harvesting equipment and trail spacing.
Keywords: Soil strength, penetration resistance, cone penetrometer, bulk density, commercial thinning, northeast Washington, ashy soils, yarding equipment, soil disturbance.
Summary Forest land managers attempt to harvest trees efficiently yet minimize the extent and severity of soil disturbance. At the Fritz Timber Sale on the Kettle Falls District of the Colville National Forest, for example, various equipment combinations were used experimentally to thin overstocked stands of mixed conifers. We report and discuss changes in extent and severity of soil compaction after harvest by measuring soil re-sistance to penetration and bulk density. In both flat and steep terrain, four units with different harvest methods and a nonthinned control unit were installed. The 10 units ranged in size from about 3 to 11 ha.
Most of the stand on the flat terrain and the entire stand on the steep terrain of this sale area originated as natural regeneration in 1930 or 1931 after the 57 000-ha Dollar Fire in 1929. Portions of that burned area were salvage logged; residual traces of 70-year-old skid trails remain in the steep area. Before the current harvest, the stand on the flat terrain was primarily subalpine fir (Abies lasiocarpa (Hook.) Nutt.) with under-story of twinflower (Linnaea borealis L. var. longiflora (Torr.) Hulten) and big huckle-berry (Vaccinium membranaceum Dougl. ex Torr.). The stand on steep terrain dif-fered among the research units: two units were classified as Pinus contorta Dougl. ex Loud./Shepherdia canadensis (L.) Nutt. (lodgepole pine/russet buffaloberry), and two were classified as Pseudotsuga menziesii (Mirb.) Franco/Vaccinium membranaceum (Douglas-fir/big huckleberry). Soils in both flat and steep terrain are relatively young and developing on different thicknesses of volcanic ash over either glacial till or glacial outwash (on some of the flat terrain).
The stands were commercially thinned from below in summer 1998 (steep) or in sum-mer 1999 (flat) to about 247 crop trees per ha (100 per acre), although the total num-ber of live stems after thinning ranged from 366 to 2,055 trees per ha. Crop trees were marked; larch (Larix occidentalis Nutt.) was favored as a leave tree. Among the eight thinned units, 24 to 69 percent of trees were removed. Each unit was assigned a dif-ferent combination of equipment to fell or process (to log lengths) and to yard logs or whole trees. Equipment combinations were not replicated among the eight harvested units. Trails were designated at 12- or 40-m (40- or 130-ft), center-to-center intervals. Track-mounted feller-bunchers, harvesters, or chain saws were used to fell trees; both tracked implements had extendable booms that enabled the operator to reach trees located within 9 m of the trail. With trail spacing of 40 m, however, equipment had to move off of designated trails. Where track-mounted harvesters were used to fell trees or process trees into logs, the harvester placed slash on the trails and moved atop the slash. Where tracked feller-bunchers were used to fell trees, this machine bunched whole trees before they were either ground-skidded or cabled to the landing for pro-cessing into logs.
Soil strength (resistance to penetration) was measured to 33-cm depth at 10 system-atically located stations on 30.5-m-long, randomly located transects in each of the 10 units (2 remained uncut). Measurements were done before and after harvest by using a Rimik CP-20 cone penetrometer. Preharvest measurements were made in summer 1998 (steep terrain) or 1999 (flat). Postharvest measurements were made that same summer or fall, shortly after each unit was harvested. Control units were sampled in the same periods. The location of each station relative to trails was documented: code 2 = rut, code 6 = beside or between ruts, and code 0 = nontrail location.
Bulk density within the 0- to 7.5-cm depth was measured within units on flat terrain, both before (summer 1997) and after harvest (fall 1999). Only a few bulk density samples were collected in the steep terrain.

As expected, resistance to penetration before thinning was greater at greater soil depth on all 10 units. In those steep units with residual skid trails from salvage logging about 70 years earlier, soil resistance on former skid trails averaged more than else-where in these units.
To infer the effects of harvesting on soil strength, we used three methods. According to method 1, overall (unit-wide) mean resistance to penetration increased after har-vest of the eight thinned units. A large increase also was measured in the flat control unit, so some of the increase in after-harvest soil resistance in the finer textured soils in the flat terrain was possibly explained by drier soil conditions in the fall samplings (soils in this control unit became more resistant with drying). Although resistance was measured to the 33-cm depth, we focused on results from the 15- to 25-cm depth. In the 15- to 25-cm depth, unit-wide increase in mean resistance to penetration (aver-aged for all stations in each unit) ranged from <1 to 115 percent, with the flat control averaging an 80-percent increase and the steep control averaging only a 3-percent increase. A 500-kPa or more increase in the 15- to 25-cm depth is currently proposed to the Pacific Southwest Region (Region 5) of the USDA Forest Service as a standard for judging potentially detrimental soil resistance. Our unit-wide increase in resistance to penetration exceeded the proposed Region 5 threshold (500 kPa) at all flat units (including the control) and at none of the steep units.
In using method 2, we restricted our comparison of before- vs. after-harvest resistance to those stations that were coded (after harvest) as either in trail ruts or beside them (code 2 or 6, respectively). We assumed that the original stations were resampled and that change in soil resistance could be explained as an effect of (1) subsequent trails on these original stations, (2) drier soil after harvest, or (3) both. Among flat units, mean resistance in the 15- to 25-cm depth in trails increased by 608 to 1334 kPa (43 to 135 percent) over preharvest means. Thus, in all flat units and two of the four steep units, the average increase over pretrail measurements exceeded the proposed stan-dard (a 500-kPa or more increase), and the trails in these units would be considered detrimentally impacted. Increases in soil resistance on steep units were smaller and less consistent.
Our third method of comparison equaled the usual, retrospective (after-harvest) moni-toring in which one measures soil resistance or bulk density on trails and compares these estimates to concurrent estimates from nontrail portions. When interpreting results, one assumes (1) that trails were placed on soils representative of the remain-ing portions (soils were similar), (2) that soil moisture conditions on and off trails were similar when sampled, hence (3) that differences can be explained by equipment im-pact (a typical monitoring question). Based on this conventional procedure (method 3), we note that trails in only one of eight thinned units exceeded the proposed standard defining detrimental resistance. Percentage changes computed from this retrospec-tive method were consistently less than those calculated from before- vs. after-harvest measurements at the same trail stations (method 2).
We also measured soil bulk density, but with sufficient sampling intensity only in the four harvested units on flat terrain. Unit-wide mean bulk density (0- to 7.5-cm depth) averaged about 3 to 15 percent greater after harvest (method 1). Standard errors of estimated means for each unit were similar before and after harvest, ranging from 2.0 to 3.5 percent of before-harvest means and 2.4 to 3.7 percent of after-harvest means.

This suggests that harvesting and seasonal differences in soil moisture did not in-crease sampling error, and that the 95 percent confidence interval around each mean is about 5 to 7 percent (two times the standard error).
Guidelines for monitoring soil disturbance in the Pacific Northwest Region of the Forest Service apply to the Fritz Timber Sale. The intent of this monitoring is to check that soil disturbance in an activity area is being kept within acceptable levels. The Pacific Northwest Region’s standard for judging detrimental compaction is a 20-per-cent or more increase in bulk density of Andic-like soils (USDA FS 1998). Among the four harvested units on flat terrain, an estimated 17 to 57 percent of the harvested area was in trails. Bulk density on trails after harvest (fall 1999) averaged 3 to 14 per-cent greater than that in nontrail portions (method 3). According to this retrospective method of comparison, trails on flat units averaged no detrimental soil compaction. According to another method of comparison, however, trails in unit 19 were detrimen-tally compacted because increases in bulk density exceeded mean before-harvest bulk density by 20 percent.

1
Commercial thinning of overstocked stands in the inland West can reduce fuel for forest fires and provide wood products. Tree harvest necessitates a decision about the most appropriate combination of equipment to fell, to process, and to yard logs or whole trees to roadside for transport. Equipment choice is often based on extraction costs, damage to residual trees, and the extent and severity of soil disturbance. For example, Youngblood (2000) compared consequences of removing about 64 percent of stand basal area with either skyline or rubber-tired forwarders in mixed-conifer stands of northeastern Oregon. At this “Limber Jim” project, forwarders damaged only slightly more residual trees than did skyline yarding but exposed more mineral soil. Of the 43 total ha assessed in this project, only 8 percent were detrimentally displaced or compacted according to the USDA Forest Service (USDA FS) Pacific Northwest Region’s standards (McIver 1998). Displacement was the most common disturbance in all harvested units. Detrimental compaction on these ash-derived soils was minimal and more prevalent after forwarders than after skyline yarding (1.7 vs. 0.2 percent of the total area). For an earlier investigation on Deerhorn Ridge (near Ukiah, Oregon) on ash-derived soil (Tolo silt loam), McIver (1995) reported that thinning mixed conifers with a harvester-skyline system disturbed about 40 percent of the area, but most dis-turbance was light, and bulk density increases averaged less than 20 percent. These recent combinations of logging equipment have proved less damaging to soils derived from volcanic ash than yarding by rubber-tired skidders, as reported by Geist and oth-ers (1989). Volcanic ash soils are noncohesive (have low percentage of clay) and will compact over a wide range of moisture content (Cullen and others 1991, Davis 1992).
To confirm results of these earlier studies on ash-derived soils, we measured soil im-pacts from operational-scale thinning of the Fritz Timber Sale on the Colville National Forest (NF). The forest implemented this thinning as part of a 1994 program (creating opportunities or CROP) to investigate treatments that would improve health and vigor of dense, small-diameter stands and also provide economic benefits to rural com-munities in northeastern Washington. Camp (2002) reported the extent and severity of damage to residual trees at the Fritz Sale. Here we report and discuss changes in extent and severity of soil compaction. Because we measured soil resistance to penetration (RP) and bulk density (BD) both before and after harvesting, we could compare several methods for expressing the effects of harvesting on soil density and resistance.
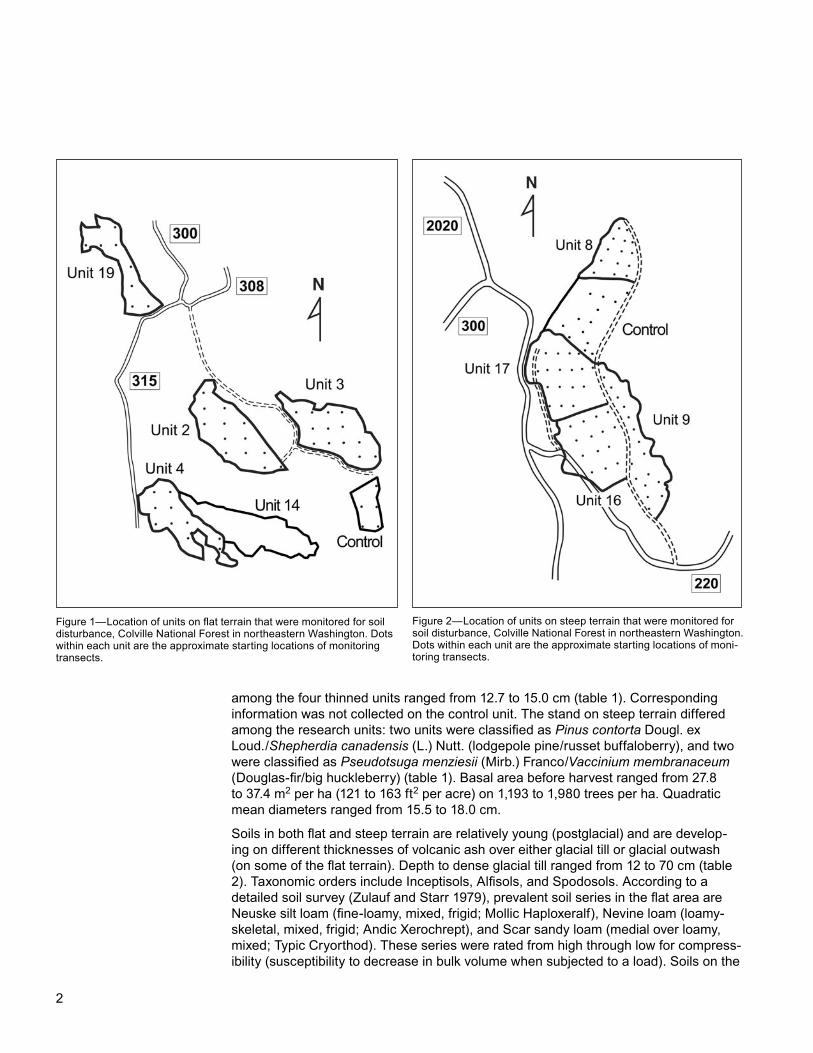
Our research area in northeastern Washington is located on the former Kettle Falls District of the Colville NF in flat and steep terrain of the Fritz Timber Sale. The Fritz Timber Sale lies west of the Columbia River (T. 36 N, R. 35 E, sec. 33 and T. 35 N, R. 35 E, sec. 4 and 5). In both flat and steep terrain, four harvested units and a non-thinned control unit were sampled. Units ranged from 3 to 11 ha. Control units were located adjacent to thinned units (figs. 1 and 2). Average slope, elevation, aspect, and plant association are described for each research unit (table 1).
Most of the flat-area stand and the entire steep-area stand originated as natural re-generation in 1930 or 1931 after the 57 000-ha Dollar Fire, which occurred in 1929. Portions of that burned area were salvage logged; traces of old skid trails remain in some steep units. The preharvest stand in the flat terrain was primarily subalpine fir (Abies lasiocarpa (Hook.) Nutt.) with understory of twinflower (Linnaea borealis L. var. longiflora (Torr.) Hulten) and big huckleberry (Vaccinium membranaceum Dougl. ex Torr.) (table 1). Stand basal area before thinning ranged from 36.7 to 46.6 m2 per ha (160 to 203 ft2 per acre) in 2,170 to 2,719 trees per ha. Quadratic mean diameters
Introduction
Research Site and MethodsResearch Site
2 3
among the four thinned units ranged from 12.7 to 15.0 cm (table 1). Corresponding information was not collected on the control unit. The stand on steep terrain differed among the research units: two units were classified as Pinus contorta Dougl. ex Loud./Shepherdia canadensis (L.) Nutt. (lodgepole pine/russet buffaloberry), and two were classified as Pseudotsuga menziesii (Mirb.) Franco/Vaccinium membranaceum (Douglas-fir/big huckleberry) (table 1). Basal area before harvest ranged from 27.8 to 37.4 m2 per ha (121 to 163 ft2 per acre) on 1,193 to 1,980 trees per ha. Quadratic mean diameters ranged from 15.5 to 18.0 cm.
Soils in both flat and steep terrain are relatively young (postglacial) and are develop-ing on different thicknesses of volcanic ash over either glacial till or glacial outwash (on some of the flat terrain). Depth to dense glacial till ranged from 12 to 70 cm (table 2). Taxonomic orders include Inceptisols, Alfisols, and Spodosols. According to a detailed soil survey (Zulauf and Starr 1979), prevalent soil series in the flat area are Neuske silt loam (fine-loamy, mixed, frigid; Mollic Haploxeralf), Nevine loam (loamy-skeletal, mixed, frigid; Andic Xerochrept), and Scar sandy loam (medial over loamy, mixed; Typic Cryorthod). These series were rated from high through low for compress-ibility (susceptibility to decrease in bulk volume when subjected to a load). Soils on the
Figure 1—Location of units on flat terrain that were monitored for soil disturbance, Colville National Forest in northeastern Washington. Dots within each unit are the approximate starting locations of monitoring transects.
Figure 2—Location of units on steep terrain that were monitored for soil disturbance, Colville National Forest in northeastern Washington. Dots within each unit are the approximate starting locations of moni-toring transects.
2 3
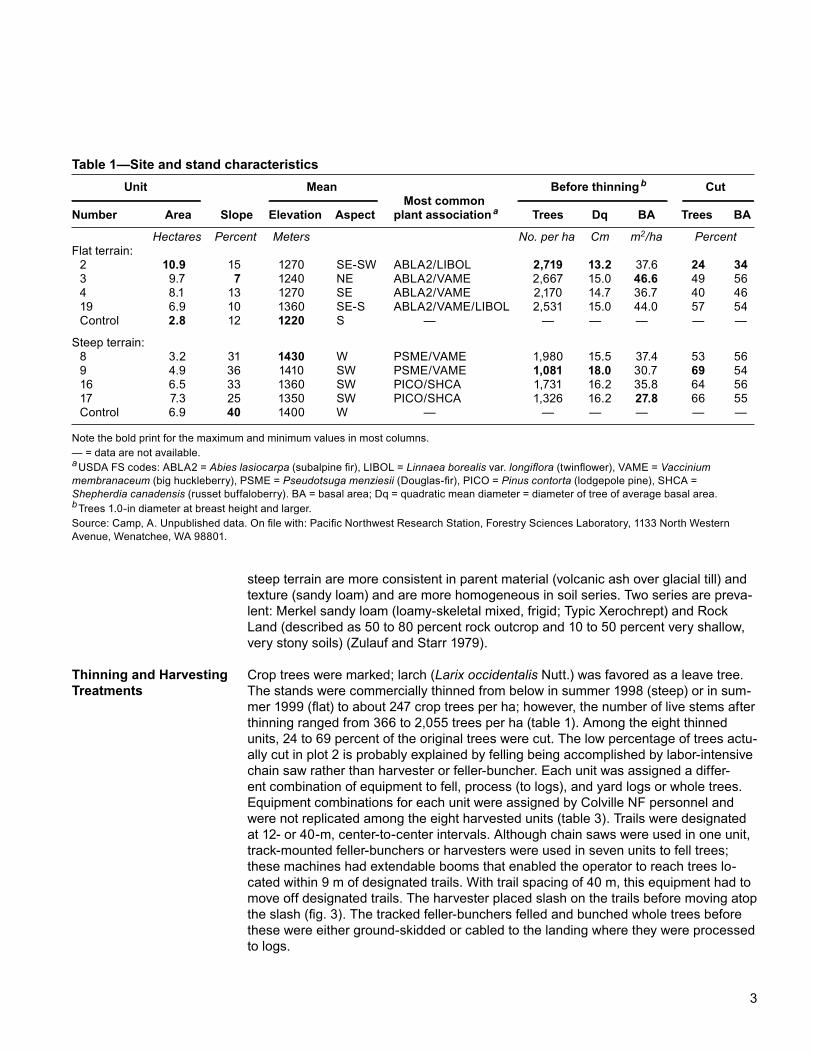
Table 1—Site and stand characteristics Unit Mean Before thinning b Cut Most commonNumber Area Slope Elevation Aspect plant association a Trees Dq BA Trees BA
Hectares Percent Meters No. per ha Cm m2/ha PercentFlat terrain: 2 10.9 15 1270 SE-SW ABLA2/LIBOL 2,719 13.2 37.6 24 34 3 9.7 7 1240 NE ABLA2/VAME 2,667 15.0 46.6 49 56 4 8.1 13 1270 SE ABLA2/VAME 2,170 14.7 36.7 40 46 19 6.9 10 1360 SE-S ABLA2/VAME/LIBOL 2,531 15.0 44.0 57 54 Control 2.8 12 1220 S — — — — — —
Steep terrain: 8 3.2 31 1430 W PSME/VAME 1,980 15.5 37.4 53 56 9 4.9 36 1410 SW PSME/VAME 1,081 18.0 30.7 69 54 16 6.5 33 1360 SW PICO/SHCA 1,731 16.2 35.8 64 56 17 7.3 25 1350 SW PICO/SHCA 1,326 16.2 27.8 66 55 Control 6.9 40 1400 W — — — — — —
Note the bold print for the maximum and minimum values in most columns.— = data are not available.a USDA FS codes: ABLA2 = Abies lasiocarpa (subalpine fir), LIBOL = Linnaea borealis var. longiflora (twinflower), VAME = Vaccinium membranaceum (big huckleberry), PSME = Pseudotsuga menziesii (Douglas-fir), PICO = Pinus contorta (lodgepole pine), SHCA = Shepherdia canadensis (russet buffaloberry). BA = basal area; Dq = quadratic mean diameter = diameter of tree of average basal area.b Trees 1.0-in diameter at breast height and larger.Source: Camp, A. Unpublished data. On file with: Pacific Northwest Research Station, Forestry Sciences Laboratory, 1133 North Western Avenue, Wenatchee, WA 98801.
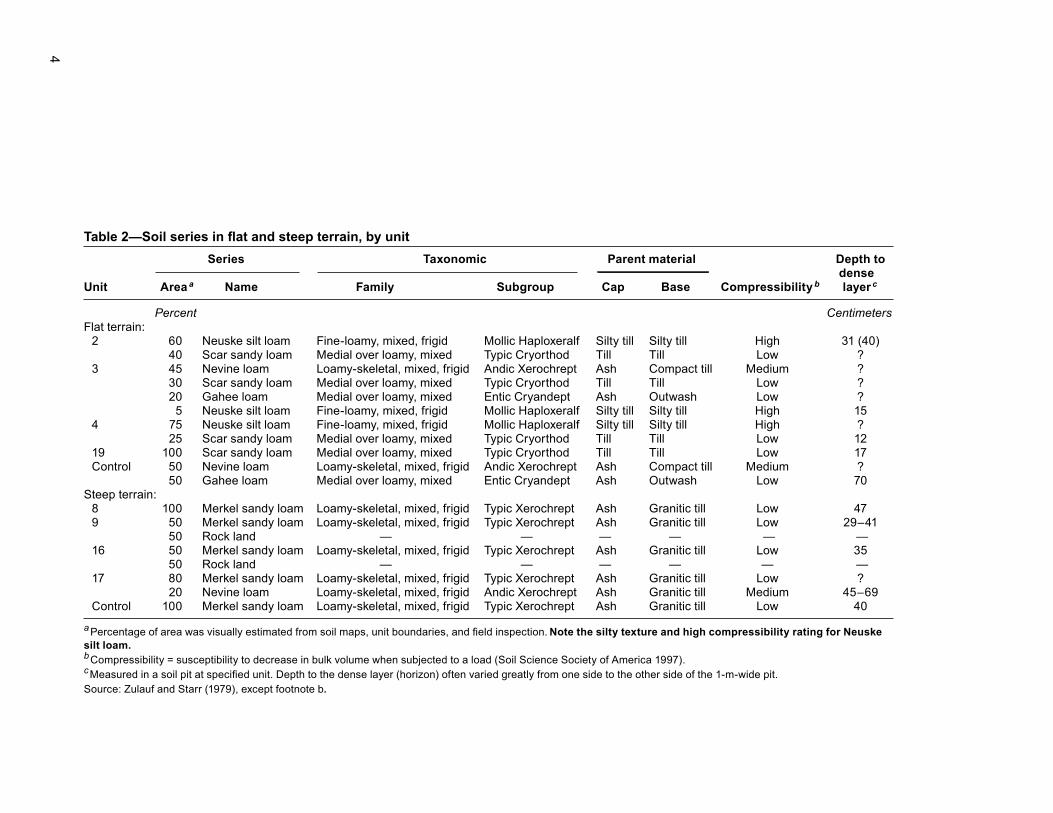
steep terrain are more consistent in parent material (volcanic ash over glacial till) and texture (sandy loam) and are more homogeneous in soil series. Two series are preva-lent: Merkel sandy loam (loamy-skeletal mixed, frigid; Typic Xerochrept) and Rock Land (described as 50 to 80 percent rock outcrop and 10 to 50 percent very shallow, very stony soils) (Zulauf and Starr 1979).
Crop trees were marked; larch (Larix occidentalis Nutt.) was favored as a leave tree. The stands were commercially thinned from below in summer 1998 (steep) or in sum-mer 1999 (flat) to about 247 crop trees per ha; however, the number of live stems after thinning ranged from 366 to 2,055 trees per ha (table 1). Among the eight thinned units, 24 to 69 percent of the original trees were cut. The low percentage of trees actu-ally cut in plot 2 is probably explained by felling being accomplished by labor-intensive chain saw rather than harvester or feller-buncher. Each unit was assigned a differ-ent combination of equipment to fell, process (to logs), and yard logs or whole trees. Equipment combinations for each unit were assigned by Colville NF personnel and were not replicated among the eight harvested units (table 3). Trails were designated at 12- or 40-m, center-to-center intervals. Although chain saws were used in one unit, track-mounted feller-bunchers or harvesters were used in seven units to fell trees; these machines had extendable booms that enabled the operator to reach trees lo-cated within 9 m of designated trails. With trail spacing of 40 m, this equipment had to move off designated trails. The harvester placed slash on the trails before moving atop the slash (fig. 3). The tracked feller-bunchers felled and bunched whole trees before these were either ground-skidded or cabled to the landing where they were processed to logs.
Thinning and Harvesting Treatments
45
Table 2—Soil series in flat and steep terrain, by unit Series Taxonomic Parent material Depth to denseUnit Area a Name Family Subgroup Cap Base Compressibility b layer c
Percent CentimetersFlat terrain: 2 60 Neuske silt loam Fine-loamy, mixed, frigid Mollic Haploxeralf Silty till Silty till High 31 (40) 40 Scar sandy loam Medial over loamy, mixed Typic Cryorthod Till Till Low ? 3 45 Nevine loam Loamy-skeletal, mixed, frigid Andic Xerochrept Ash Compact till Medium ? 30 Scar sandy loam Medial over loamy, mixed Typic Cryorthod Till Till Low ? 20 Gahee loam Medial over loamy, mixed Entic Cryandept Ash Outwash Low ? 5 Neuske silt loam Fine-loamy, mixed, frigid Mollic Haploxeralf Silty till Silty till High 15 4 75 Neuske silt loam Fine-loamy, mixed, frigid Mollic Haploxeralf Silty till Silty till High ? 25 Scar sandy loam Medial over loamy, mixed Typic Cryorthod Till Till Low 12 19 100 Scar sandy loam Medial over loamy, mixed Typic Cryorthod Till Till Low 17 Control 50 Nevine loam Loamy-skeletal, mixed, frigid Andic Xerochrept Ash Compact till Medium ? 50 Gahee loam Medial over loamy, mixed Entic Cryandept Ash Outwash Low 70Steep terrain: 8 100 Merkel sandy loam Loamy-skeletal, mixed, frigid Typic Xerochrept Ash Granitic till Low 47 9 50 Merkel sandy loam Loamy-skeletal, mixed, frigid Typic Xerochrept Ash Granitic till Low 29–41 50 Rock land — — — — — — 16 50 Merkel sandy loam Loamy-skeletal, mixed, frigid Typic Xerochrept Ash Granitic till Low 35 50 Rock land — — — — — — 17 80 Merkel sandy loam Loamy-skeletal, mixed, frigid Typic Xerochrept Ash Granitic till Low ? 20 Nevine loam Loamy-skeletal, mixed, frigid Andic Xerochrept Ash Granitic till Medium 45–69 Control 100 Merkel sandy loam Loamy-skeletal, mixed, frigid Typic Xerochrept Ash Granitic till Low 40
a Percentage of area was visually estimated from soil maps, unit boundaries, and field inspection. Note the silty texture and high compressibility rating for Neuske silt loam. b Compressibility = susceptibility to decrease in bulk volume when subjected to a load (Soil Science Society of America 1997).c Measured in a soil pit at specified unit. Depth to the dense layer (horizon) often varied greatly from one side to the other side of the 1-m-wide pit.Source: Zulauf and Starr (1979), except footnote b.
4 5
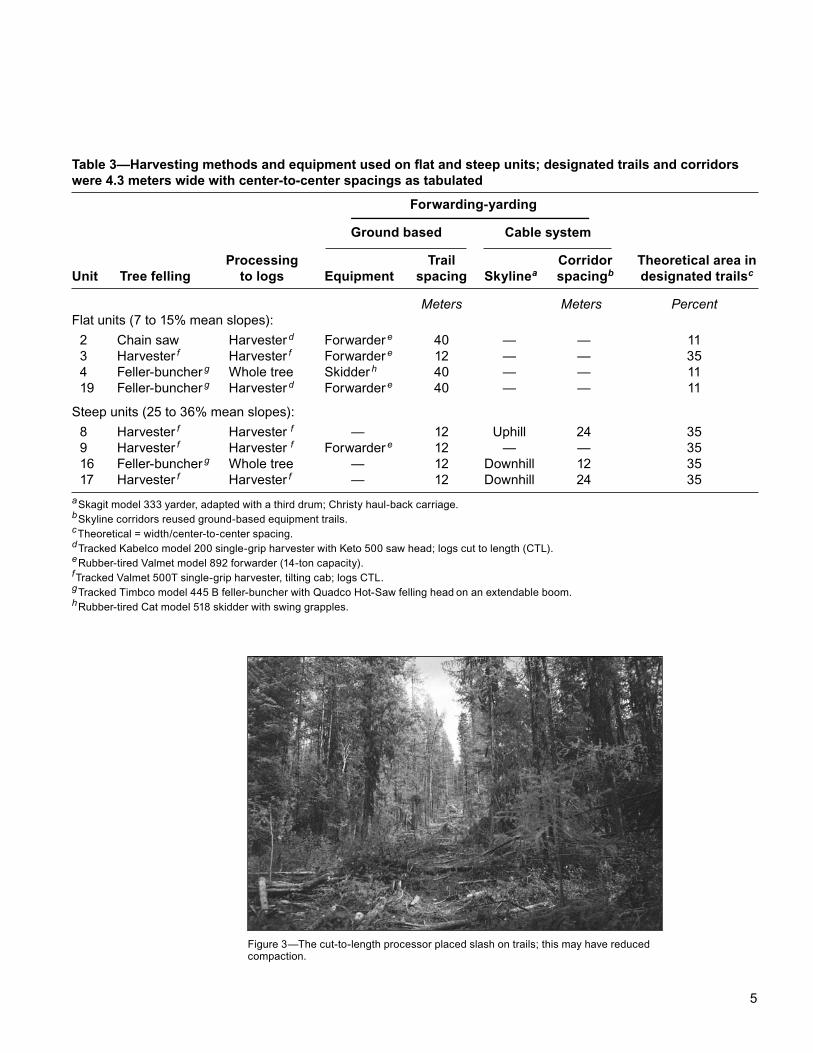
Figure 3—The cut-to-length processor placed slash on trails; this may have reduced compaction.
Table 3—Harvesting methods and equipment used on flat and steep units; designated trails and corridors were 4.3 meters wide with center-to-center spacings as tabulated
Forwarding-yarding
Ground based Cable system
Processing Trail Corridor Theoretical area inUnit Tree felling to logs Equipment spacing Skylinea spacingb designated trailsc
Meters Meters PercentFlat units (7 to 15% mean slopes): 2 Chain saw Harvester d Forwarder e 40 — — 11 3 Harvester f Harvester f Forwarder e 12 — — 35 4 Feller-buncher g Whole tree Skidder h 40 — — 11 19 Feller-buncher g Harvester d Forwarder e 40 — — 11
Steep units (25 to 36% mean slopes): 8 Harvester f Harvester f — 12 Uphill 24 35 9 Harvester f Harvester f Forwarder e 12 — — 35 16 Feller-buncher g Whole tree — 12 Downhill 12 35 17 Harvester f Harvester f — 12 Downhill 24 35a Skagit model 333 yarder, adapted with a third drum; Christy haul-back carriage.b Skyline corridors reused ground-based equipment trails.c Theoretical = width/center-to-center spacing.d Tracked Kabelco model 200 single-grip harvester with Keto 500 saw head; logs cut to length (CTL).e Rubber-tired Valmet model 892 forwarder (14-ton capacity).f Tracked Valmet 500T single-grip harvester, tilting cab; logs CTL.g Tracked Timbco model 445 B feller-buncher with Quadco Hot-Saw felling head on an extendable boom.h Rubber-tired Cat model 518 skidder with swing grapples.
6 7
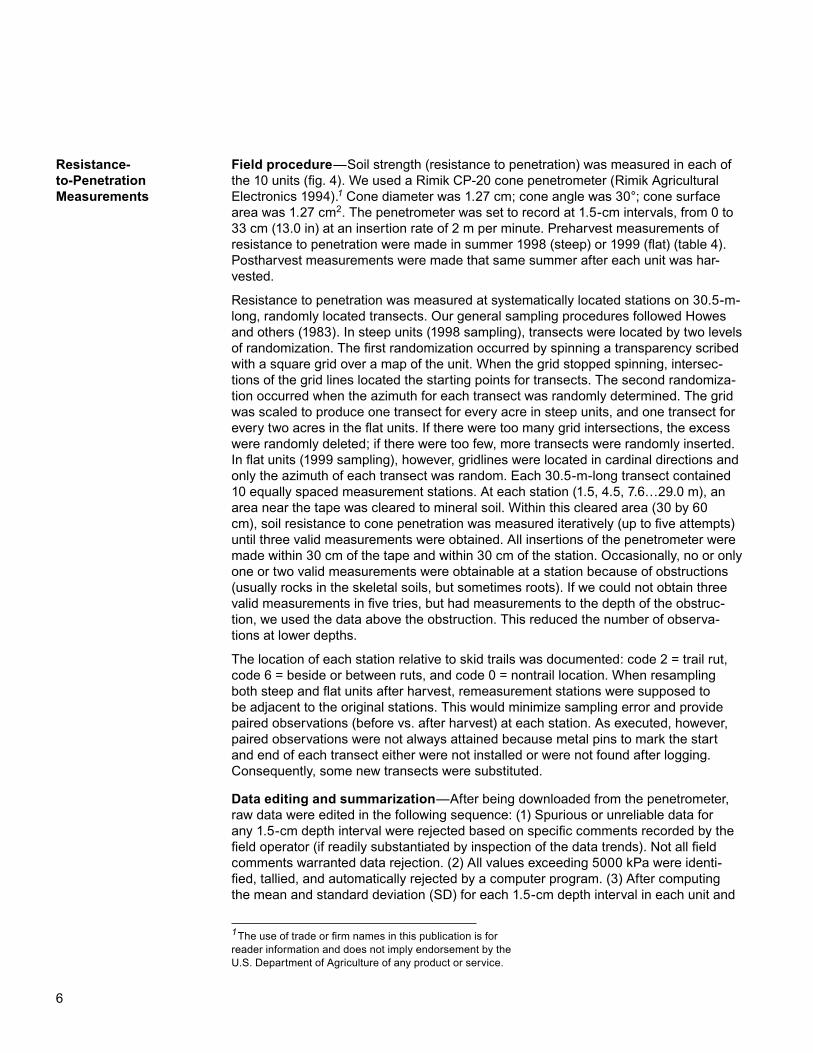
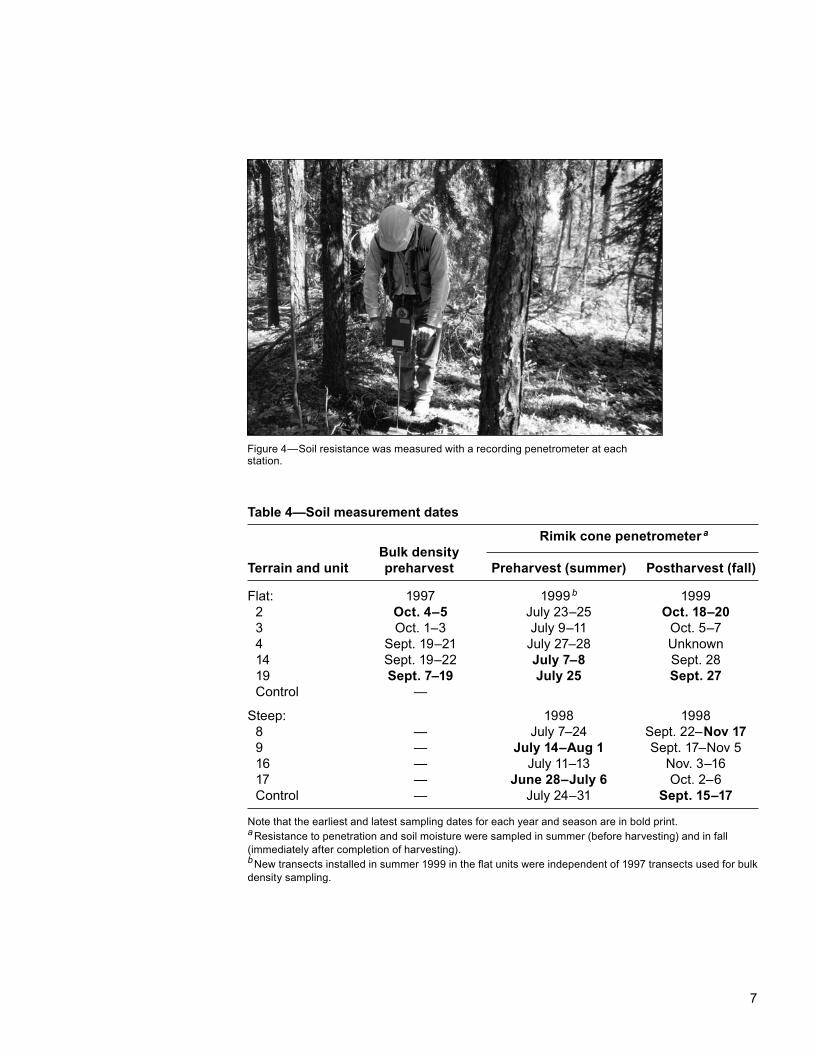
Field procedure—Soil strength (resistance to penetration) was measured in each of the 10 units (fig. 4). We used a Rimik CP-20 cone penetrometer (Rimik Agricultural Electronics 1994).1 Cone diameter was 1.27 cm; cone angle was 30°; cone surface area was 1.27 cm2. The penetrometer was set to record at 1.5-cm intervals, from 0 to 33 cm (13.0 in) at an insertion rate of 2 m per minute. Preharvest measurements of resistance to penetration were made in summer 1998 (steep) or 1999 (flat) (table 4). Postharvest measurements were made that same summer after each unit was har-vested.
Resistance to penetration was measured at systematically located stations on 30.5-m- long, randomly located transects. Our general sampling procedures followed Howes and others (1983). In steep units (1998 sampling), transects were located by two levels of randomization. The first randomization occurred by spinning a transparency scribed with a square grid over a map of the unit. When the grid stopped spinning, intersec-tions of the grid lines located the starting points for transects. The second randomiza-tion occurred when the azimuth for each transect was randomly determined. The grid was scaled to produce one transect for every acre in steep units, and one transect for every two acres in the flat units. If there were too many grid intersections, the excess were randomly deleted; if there were too few, more transects were randomly inserted. In flat units (1999 sampling), however, gridlines were located in cardinal directions and only the azimuth of each transect was random. Each 30.5-m-long transect contained 10 equally spaced measurement stations. At each station (1.5, 4.5, 7.6…29.0 m), an area near the tape was cleared to mineral soil. Within this cleared area (30 by 60 cm), soil resistance to cone penetration was measured iteratively (up to five attempts) until three valid measurements were obtained. All insertions of the penetrometer were made within 30 cm of the tape and within 30 cm of the station. Occasionally, no or only one or two valid measurements were obtainable at a station because of obstructions (usually rocks in the skeletal soils, but sometimes roots). If we could not obtain three valid measurements in five tries, but had measurements to the depth of the obstruc-tion, we used the data above the obstruction. This reduced the number of observa-tions at lower depths.
The location of each station relative to skid trails was documented: code 2 = trail rut, code 6 = beside or between ruts, and code 0 = nontrail location. When resampling both steep and flat units after harvest, remeasurement stations were supposed to be adjacent to the original stations. This would minimize sampling error and provide paired observations (before vs. after harvest) at each station. As executed, however, paired observations were not always attained because metal pins to mark the start and end of each transect either were not installed or were not found after logging. Consequently, some new transects were substituted.
Data editing and summarization—After being downloaded from the penetrometer, raw data were edited in the following sequence: (1) Spurious or unreliable data for any 1.5-cm depth interval were rejected based on specific comments recorded by the field operator (if readily substantiated by inspection of the data trends). Not all field comments warranted data rejection. (2) All values exceeding 5000 kPa were identi-fied, tallied, and automatically rejected by a computer program. (3) After computing the mean and standard deviation (SD) for each 1.5-cm depth interval in each unit and
Resistance-to-Penetration Measurements
1 The use of trade or firm names in this publication is for reader information and does not imply endorsement by the U.S. Department of Agriculture of any product or service.
6 7
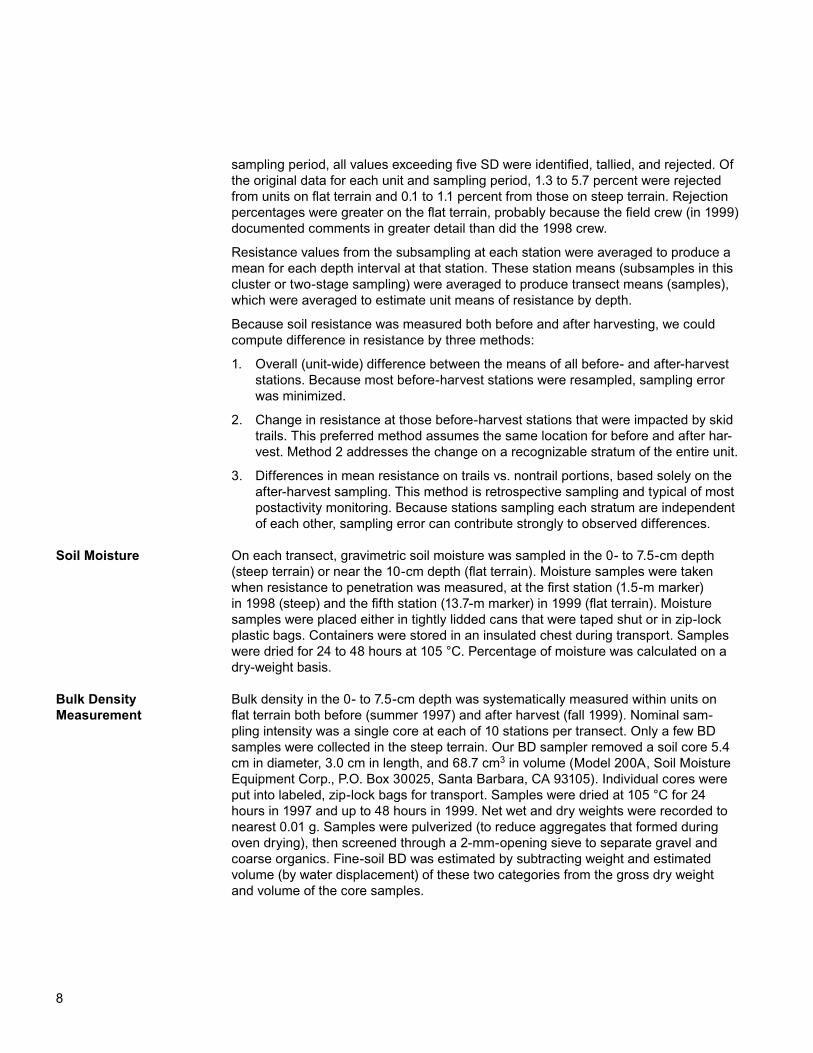
Table 4—Soil measurement dates
Rimik cone penetrometer a Bulk densityTerrain and unit preharvest Preharvest (summer) Postharvest (fall)
Flat: 1997 1999 b 1999 2 Oct. 4–5 July 23–25 Oct. 18–20 3 Oct. 1–3 July 9–11 Oct. 5–7 4 Sept. 19–21 July 27–28 Unknown 14 Sept. 19–22 July 7–8 Sept. 28 19 Sept. 7–19 July 25 Sept. 27 Control —
Steep: 1998 1998 8 — July 7–24 Sept. 22–Nov 17 9 — July 14–Aug 1 Sept. 17–Nov 5 16 — July 11–13 Nov. 3–16 17 — June 28–July 6 Oct. 2–6 Control — July 24–31 Sept. 15–17
Note that the earliest and latest sampling dates for each year and season are in bold print. a Resistance to penetration and soil moisture were sampled in summer (before harvesting) and in fall (immediately after completion of harvesting).b New transects installed in summer 1999 in the flat units were independent of 1997 transects used for bulk density sampling.
Figure 4—Soil resistance was measured with a recording penetrometer at each station.
8 9
sampling period, all values exceeding five SD were identified, tallied, and rejected. Of the original data for each unit and sampling period, 1.3 to 5.7 percent were rejected from units on flat terrain and 0.1 to 1.1 percent from those on steep terrain. Rejection percentages were greater on the flat terrain, probably because the field crew (in 1999) documented comments in greater detail than did the 1998 crew.
Resistance values from the subsampling at each station were averaged to produce a mean for each depth interval at that station. These station means (subsamples in this cluster or two-stage sampling) were averaged to produce transect means (samples), which were averaged to estimate unit means of resistance by depth.
Because soil resistance was measured both before and after harvesting, we could compute difference in resistance by three methods:
1. Overall (unit-wide) difference between the means of all before- and after-harvest stations. Because most before-harvest stations were resampled, sampling error was minimized.
2. Change in resistance at those before-harvest stations that were impacted by skid trails. This preferred method assumes the same location for before and after har-vest. Method 2 addresses the change on a recognizable stratum of the entire unit.
3. Differences in mean resistance on trails vs. nontrail portions, based solely on the after-harvest sampling. This method is retrospective sampling and typical of most postactivity monitoring. Because stations sampling each stratum are independent of each other, sampling error can contribute strongly to observed differences.
On each transect, gravimetric soil moisture was sampled in the 0- to 7.5-cm depth (steep terrain) or near the 10-cm depth (flat terrain). Moisture samples were taken when resistance to penetration was measured, at the first station (1.5-m marker) in 1998 (steep) and the fifth station (13.7-m marker) in 1999 (flat terrain). Moisture samples were placed either in tightly lidded cans that were taped shut or in zip-lock plastic bags. Containers were stored in an insulated chest during transport. Samples were dried for 24 to 48 hours at 105 °C. Percentage of moisture was calculated on a dry-weight basis.
Bulk density in the 0- to 7.5-cm depth was systematically measured within units on flat terrain both before (summer 1997) and after harvest (fall 1999). Nominal sam-pling intensity was a single core at each of 10 stations per transect. Only a few BD samples were collected in the steep terrain. Our BD sampler removed a soil core 5.4 cm in diameter, 3.0 cm in length, and 68.7 cm3 in volume (Model 200A, Soil Moisture Equipment Corp., P.O. Box 30025, Santa Barbara, CA 93105). Individual cores were put into labeled, zip-lock bags for transport. Samples were dried at 105 °C for 24 hours in 1997 and up to 48 hours in 1999. Net wet and dry weights were recorded to nearest 0.01 g. Samples were pulverized (to reduce aggregates that formed during oven drying), then screened through a 2-mm-opening sieve to separate gravel and coarse organics. Fine-soil BD was estimated by subtracting weight and estimated volume (by water displacement) of these two categories from the gross dry weight and volume of the core samples.
Soil Moisture
Bulk Density Measurement
8 9
Recall that harvesting treatments were not replicated; each combination of equipment was used only at one unit. Consequently, results could not be statistically analyzed beyond estimating means and standard errors for each unit.
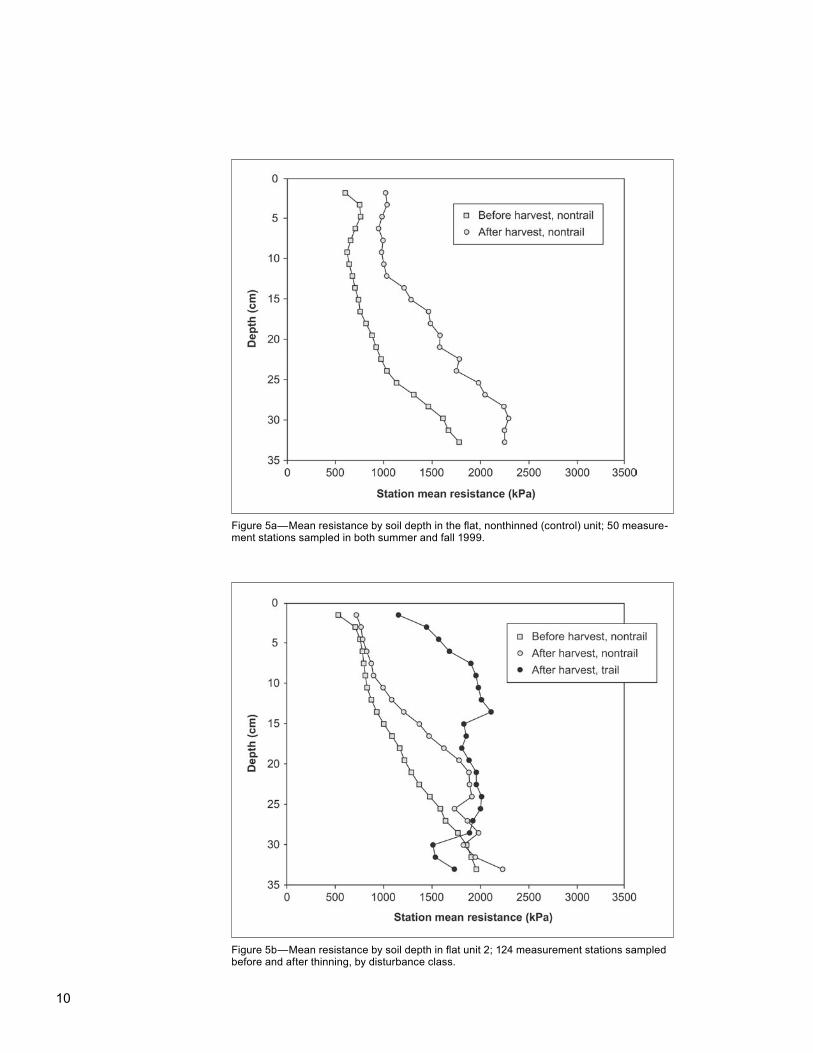
Resistance to penetration was greater at greater soil depth on all units (figs. 5a to 6e). In four steep units with residual skid trails from salvage logging about 70 years earlier, soil resistance on former skid trails averaged more than elsewhere in the units (figs. 6a, 6b, 6c, 6d)
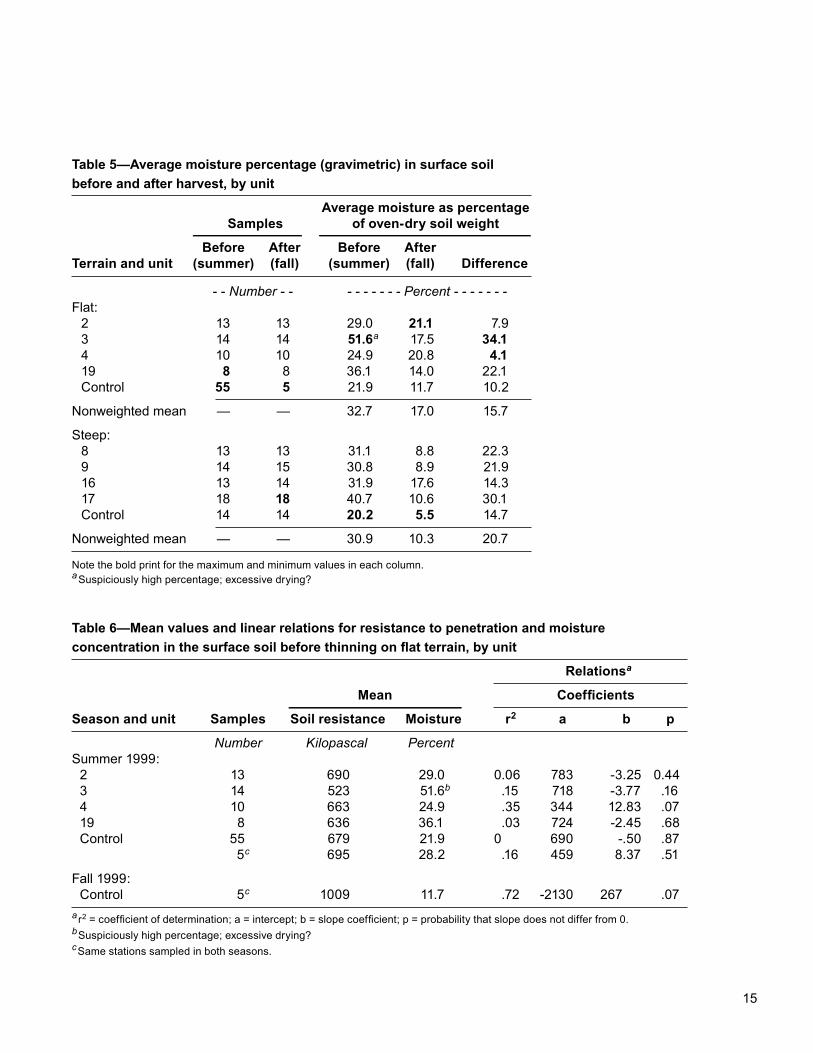
Soil moisture (as a percentage of oven-dry soil mass) in the 0- to 10-cm depth aver-aged greater in midsummer (before harvesting) than in fall (after harvesting) (table 5). Moisture below that depth was not sampled. Among the 10 units, mean soil moisture before harvest ranged from about 20 to 52 percent; after-harvest means ranged from about 6 to 21 percent (table 5). Flat and steep units in summer averaged about the same soil moisture (33 vs. 31 percent, respectively; table 5), although the preharvest soil moisture percentages for flat unit 3 seem suspiciously high. Moisture losses be-tween summer and fall averaged greater on steep units (21 percent) than on flat units (16 percent); the greater loss is consistent with the coarser soil textures in steep units (table 2).
Mean resistance to penetration (unit-wide) increased after harvesting. Because a large increase also was measured in the flat control unit, some of the increase in after-har-vest soil resistance was possibly explained by soil differences in this control unit (table 2) or drier soil conditions in the fall sampling (table 5).
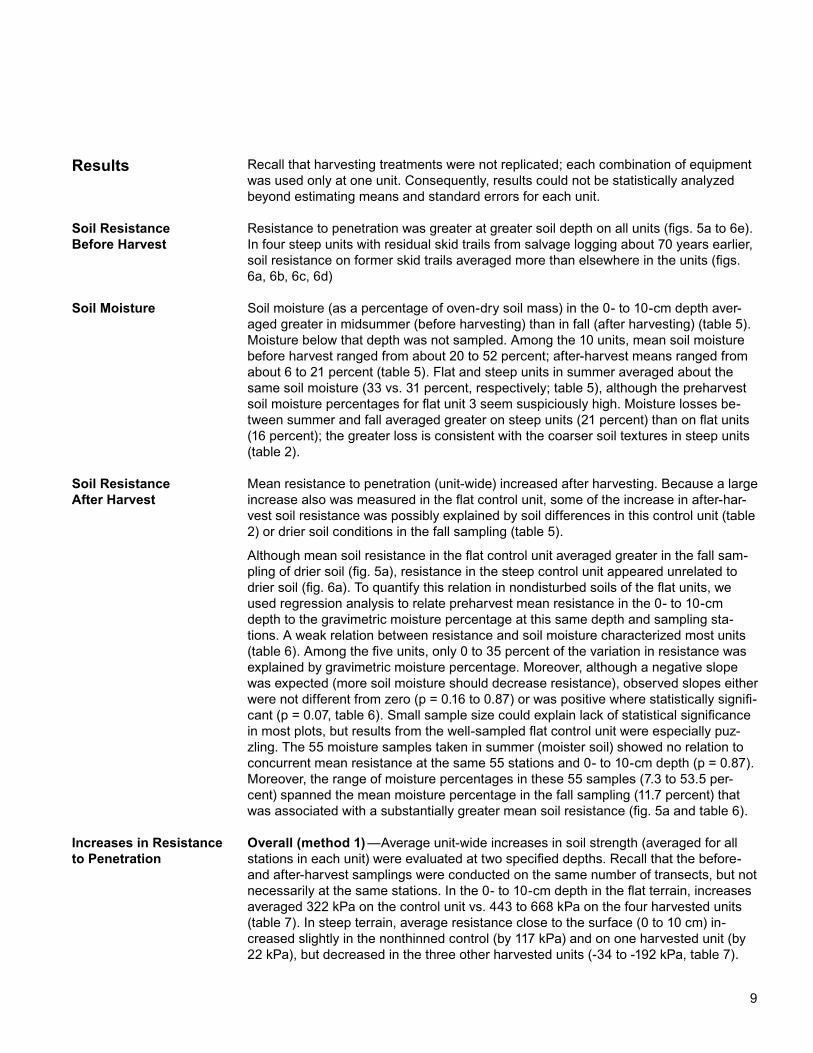
Although mean soil resistance in the flat control unit averaged greater in the fall sam-pling of drier soil (fig. 5a), resistance in the steep control unit appeared unrelated to drier soil (fig. 6a). To quantify this relation in nondisturbed soils of the flat units, we used regression analysis to relate preharvest mean resistance in the 0- to 10-cm depth to the gravimetric moisture percentage at this same depth and sampling sta-tions. A weak relation between resistance and soil moisture characterized most units (table 6). Among the five units, only 0 to 35 percent of the variation in resistance was explained by gravimetric moisture percentage. Moreover, although a negative slope was expected (more soil moisture should decrease resistance), observed slopes either were not different from zero (p = 0.16 to 0.87) or was positive where statistically signifi-cant (p = 0.07, table 6). Small sample size could explain lack of statistical significance in most plots, but results from the well-sampled flat control unit were especially puz-zling. The 55 moisture samples taken in summer (moister soil) showed no relation to concurrent mean resistance at the same 55 stations and 0- to 10-cm depth (p = 0.87). Moreover, the range of moisture percentages in these 55 samples (7.3 to 53.5 per-cent) spanned the mean moisture percentage in the fall sampling (11.7 percent) that was associated with a substantially greater mean soil resistance (fig. 5a and table 6).
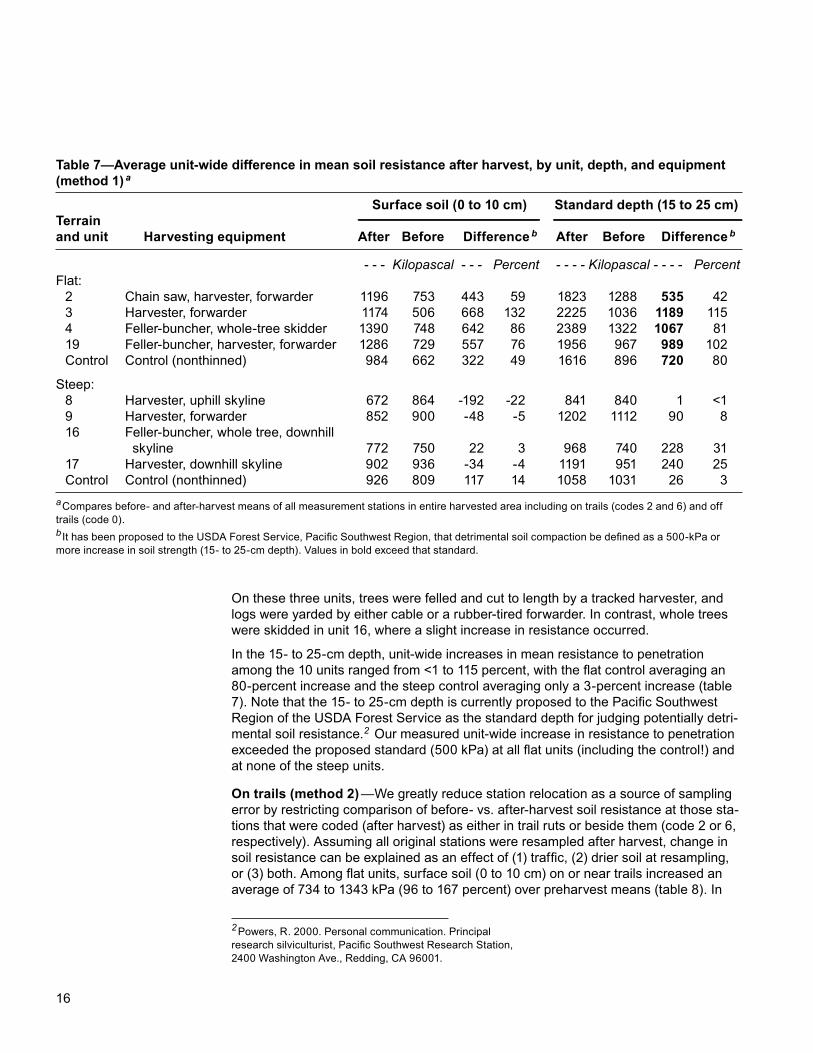
Overall (method 1) —Average unit-wide increases in soil strength (averaged for all stations in each unit) were evaluated at two specified depths. Recall that the before- and after-harvest samplings were conducted on the same number of transects, but not necessarily at the same stations. In the 0- to 10-cm depth in the flat terrain, increases averaged 322 kPa on the control unit vs. 443 to 668 kPa on the four harvested units (table 7). In steep terrain, average resistance close to the surface (0 to 10 cm) in-creased slightly in the nonthinned control (by 117 kPa) and on one harvested unit (by 22 kPa), but decreased in the three other harvested units (-34 to -192 kPa, table 7).
Results
Soil Resistance Before Harvest
Soil Moisture
Soil Resistance After Harvest
Increases in Resistance to Penetration
10 11
Figure 5a—Mean resistance by soil depth in the flat, nonthinned (control) unit; 50 measure-ment stations sampled in both summer and fall 1999.
Figure 5b—Mean resistance by soil depth in flat unit 2; 124 measurement stations sampled before and after thinning, by disturbance class.
10 11
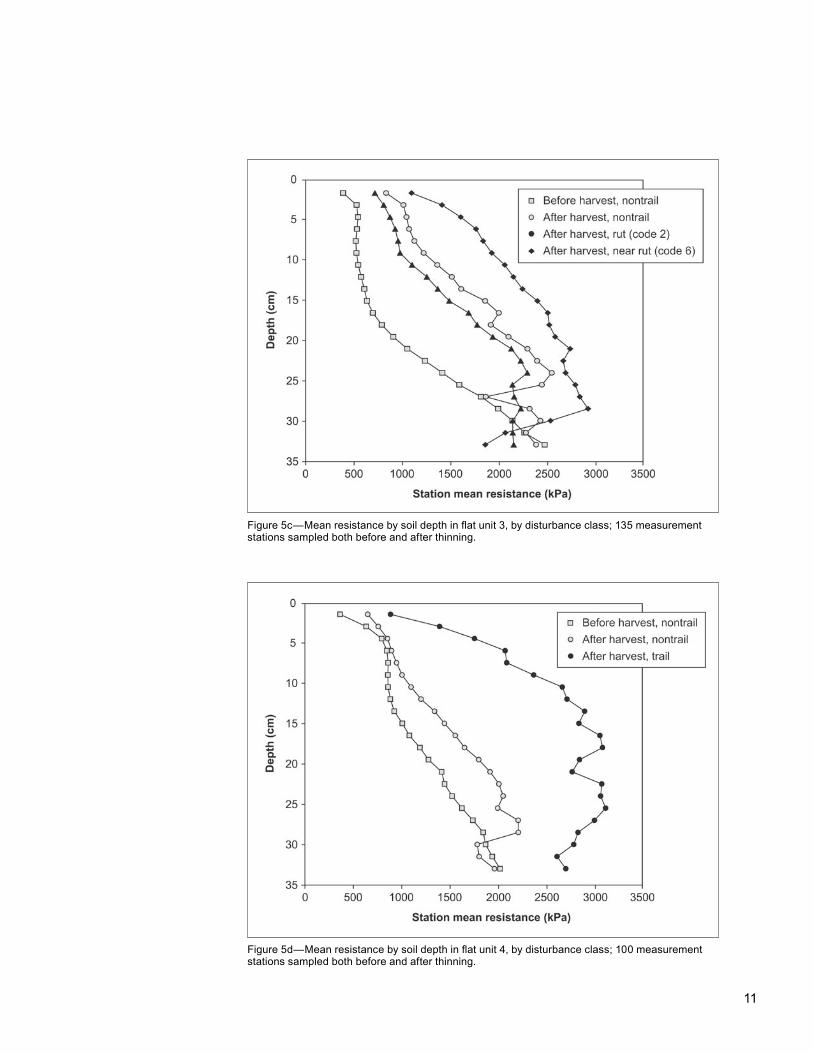
Figure 5c—Mean resistance by soil depth in flat unit 3, by disturbance class; 135 measurement stations sampled both before and after thinning.
Figure 5d—Mean resistance by soil depth in flat unit 4, by disturbance class; 100 measurement stations sampled both before and after thinning.
12 13
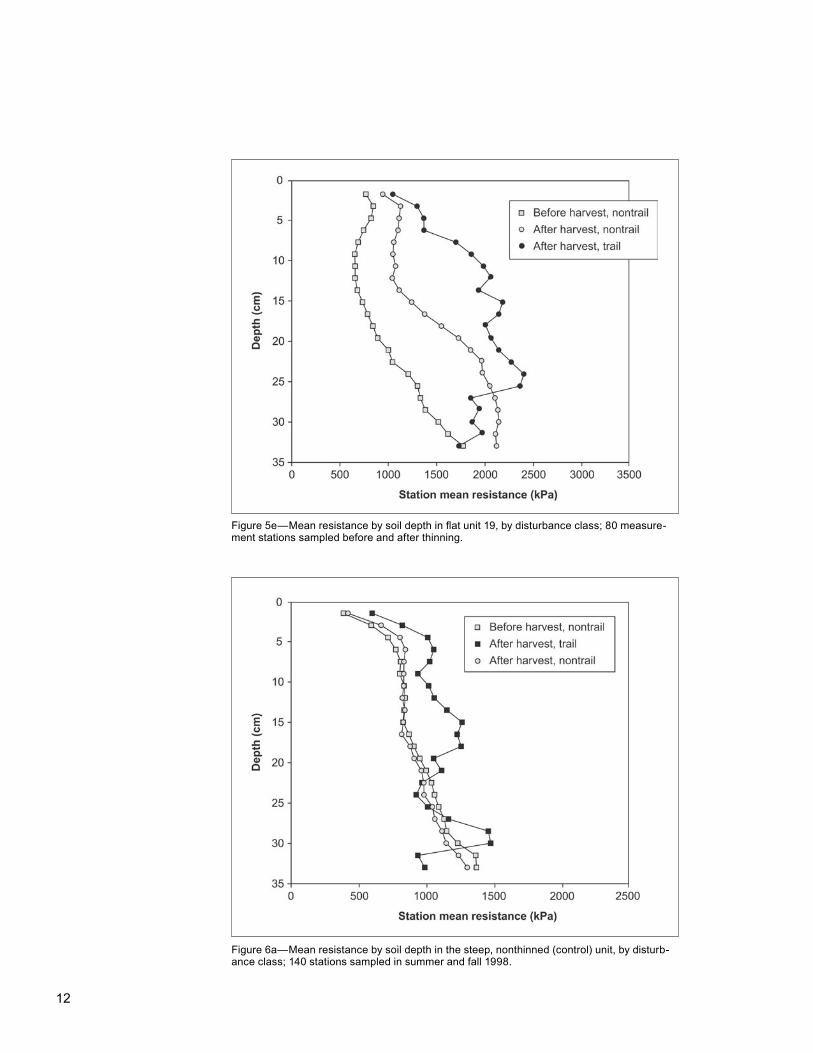
Figure 5e—Mean resistance by soil depth in flat unit 19, by disturbance class; 80 measure-ment stations sampled before and after thinning.
Figure 6a—Mean resistance by soil depth in the steep, nonthinned (control) unit, by disturb-ance class; 140 stations sampled in summer and fall 1998.
12 13
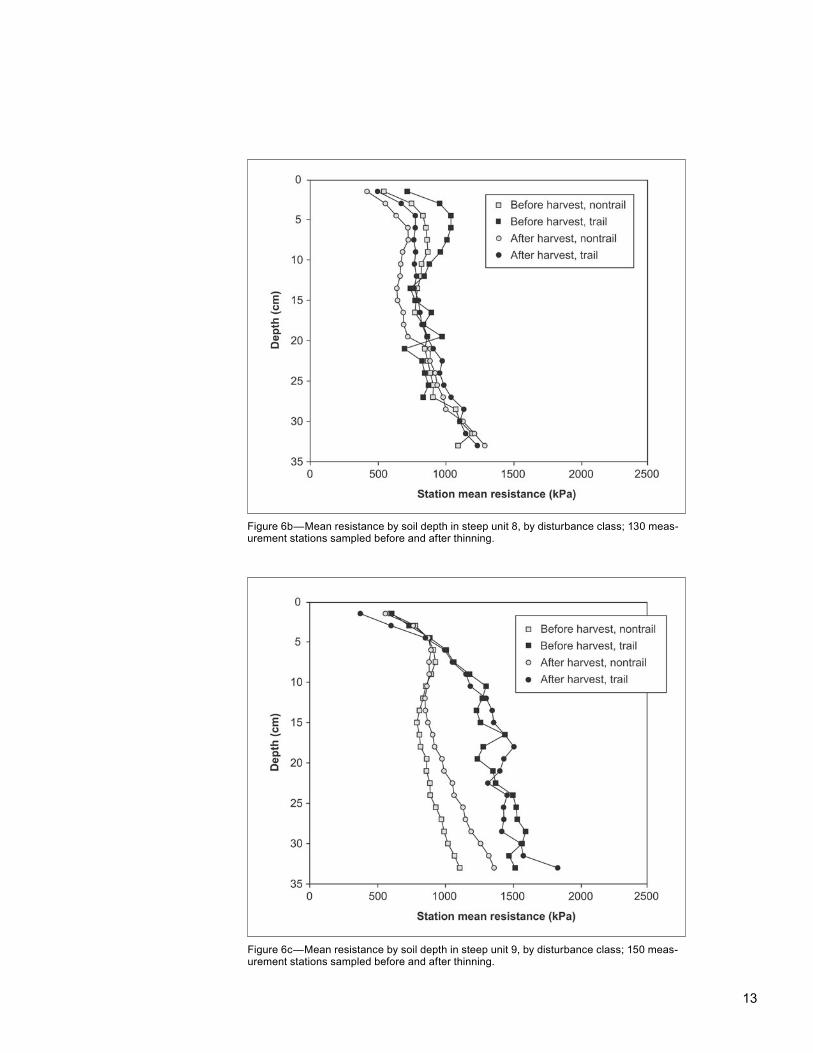
Figure 6b—Mean resistance by soil depth in steep unit 8, by disturbance class; 130 meas-urement stations sampled before and after thinning.
Figure 6c—Mean resistance by soil depth in steep unit 9, by disturbance class; 150 meas-urement stations sampled before and after thinning.
14 15
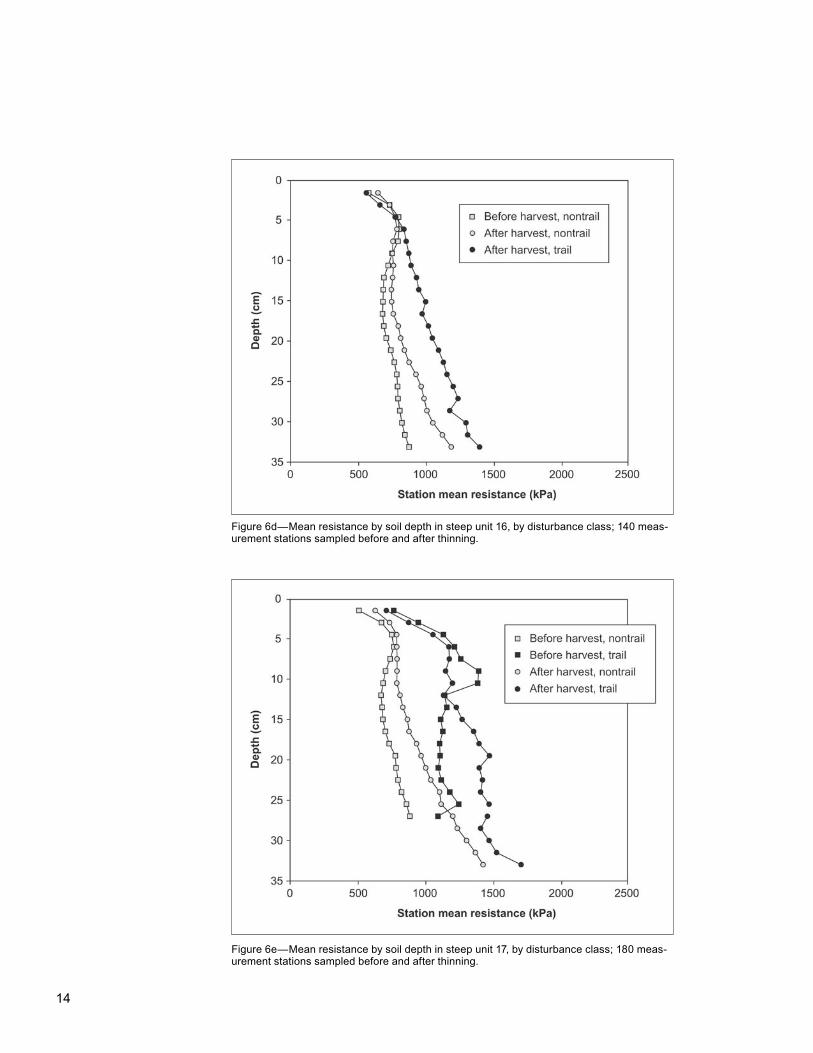
Figure 6d—Mean resistance by soil depth in steep unit 16, by disturbance class; 140 meas-urement stations sampled before and after thinning.
Figure 6e—Mean resistance by soil depth in steep unit 17, by disturbance class; 180 meas-urement stations sampled before and after thinning.
14 15
Table 5—Average moisture percentage (gravimetric) in surface soil before and after harvest, by unit
Average moisture as percentage Samples of oven-dry soil weight
Before After Before AfterTerrain and unit (summer) (fall) (summer) (fall) Difference
- - Number - - - - - - - - - Percent - - - - - - -Flat: 2 13 13 29.0 21.1 7.9 3 14 14 51.6a 17.5 34.1 4 10 10 24.9 20.8 4.1 19 8 8 36.1 14.0 22.1 Control 55 5 21.9 11.7 10.2
Nonweighted mean — — 32.7 17.0 15.7
Steep: 8 13 13 31.1 8.8 22.3 9 14 15 30.8 8.9 21.9 16 13 14 31.9 17.6 14.3 17 18 18 40.7 10.6 30.1 Control 14 14 20.2 5.5 14.7
Nonweighted mean — — 30.9 10.3 20.7
Note the bold print for the maximum and minimum values in each column. a Suspiciously high percentage; excessive drying?
Table 6—Mean values and linear relations for resistance to penetration and moisture concentration in the surface soil before thinning on flat terrain, by unit
Relationsa
Mean Coefficients
Season and unit Samples Soil resistance Moisture r2 a b p
Number Kilopascal PercentSummer 1999: 2 13 690 29.0 0.06 783 -3.25 0.44 3 14 523 51.6b .15 718 -3.77 .16 4 10 663 24.9 .35 344 12.83 .07 19 8 636 36.1 .03 724 -2.45 .68 Control 55 679 21.9 0 690 -.50 .87 5c 695 28.2 .16 459 8.37 .51
Fall 1999: Control 5c 1009 11.7 .72 -2130 267 .07a r2 = coefficient of determination; a = intercept; b = slope coefficient; p = probability that slope does not differ from 0.b Suspiciously high percentage; excessive drying?c Same stations sampled in both seasons.
16 17
Table 7—Average unit-wide difference in mean soil resistance after harvest, by unit, depth, and equipment (method 1) a
Surface soil (0 to 10 cm) Standard depth (15 to 25 cm)Terrainand unit Harvesting equipment After Before Difference b After Before Difference b
- - - Kilopascal - - - Percent - - - - Kilopascal - - - - PercentFlat: 2 Chain saw, harvester, forwarder 1196 753 443 59 1823 1288 535 42 3 Harvester, forwarder 1174 506 668 132 2225 1036 1189 115 4 Feller-buncher, whole-tree skidder 1390 748 642 86 2389 1322 1067 81 19 Feller-buncher, harvester, forwarder 1286 729 557 76 1956 967 989 102 Control Control (nonthinned) 984 662 322 49 1616 896 720 80
Steep: 8 Harvester, uphill skyline 672 864 -192 -22 841 840 1 <1 9 Harvester, forwarder 852 900 -48 -5 1202 1112 90 8 16 Feller-buncher, whole tree, downhill skyline 772 750 22 3 968 740 228 31 17 Harvester, downhill skyline 902 936 -34 -4 1191 951 240 25 Control Control (nonthinned) 926 809 117 14 1058 1031 26 3a Compares before- and after-harvest means of all measurement stations in entire harvested area including on trails (codes 2 and 6) and off trails (code 0).b It has been proposed to the USDA Forest Service, Pacific Southwest Region, that detrimental soil compaction be defined as a 500-kPa or more increase in soil strength (15- to 25-cm depth). Values in bold exceed that standard.
On these three units, trees were felled and cut to length by a tracked harvester, and logs were yarded by either cable or a rubber-tired forwarder. In contrast, whole trees were skidded in unit 16, where a slight increase in resistance occurred.
In the 15- to 25-cm depth, unit-wide increases in mean resistance to penetration among the 10 units ranged from <1 to 115 percent, with the flat control averaging an 80-percent increase and the steep control averaging only a 3-percent increase (table 7). Note that the 15- to 25-cm depth is currently proposed to the Pacific Southwest Region of the USDA Forest Service as the standard depth for judging potentially detri-mental soil resistance.2 Our measured unit-wide increase in resistance to penetration exceeded the proposed standard (500 kPa) at all flat units (including the control!) and at none of the steep units.
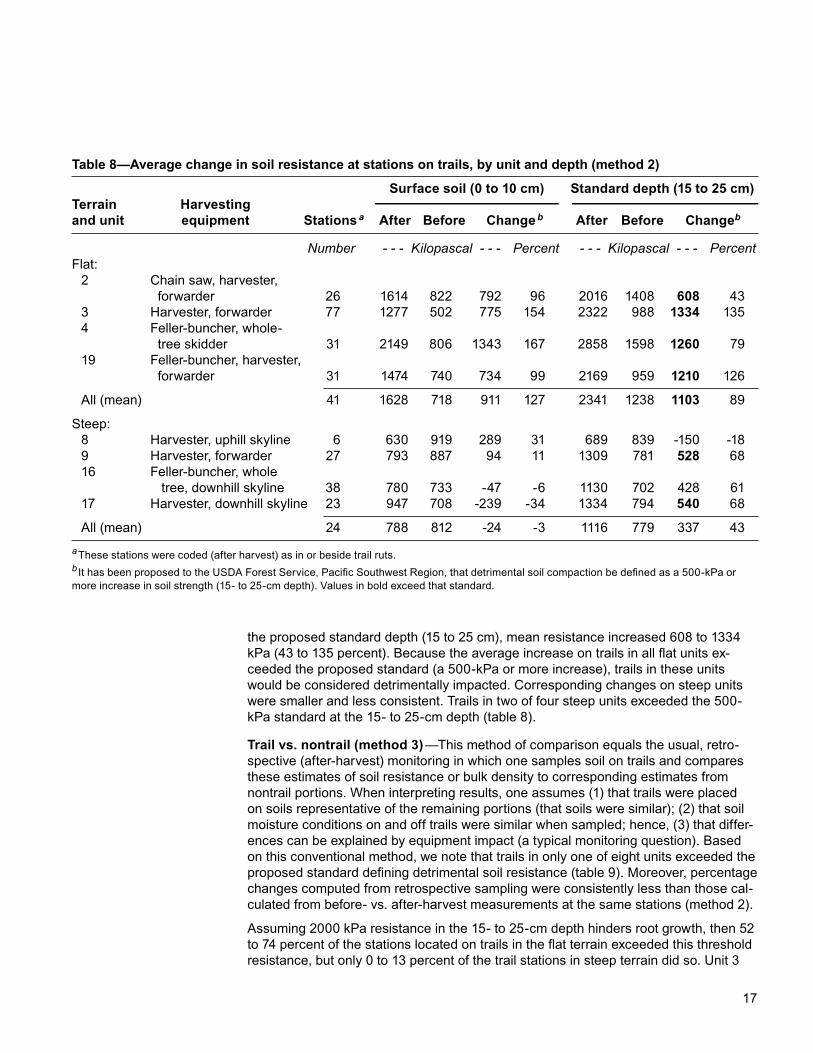
On trails (method 2) —We greatly reduce station relocation as a source of sampling error by restricting comparison of before- vs. after-harvest soil resistance at those sta-tions that were coded (after harvest) as either in trail ruts or beside them (code 2 or 6, respectively). Assuming all original stations were resampled after harvest, change in soil resistance can be explained as an effect of (1) traffic, (2) drier soil at resampling, or (3) both. Among flat units, surface soil (0 to 10 cm) on or near trails increased an average of 734 to 1343 kPa (96 to 167 percent) over preharvest means (table 8). In
2 Powers, R. 2000. Personal communication. Principal research silviculturist, Pacific Southwest Research Station, 2400 Washington Ave., Redding, CA 96001.
16 17
the proposed standard depth (15 to 25 cm), mean resistance increased 608 to 1334 kPa (43 to 135 percent). Because the average increase on trails in all flat units ex-ceeded the proposed standard (a 500-kPa or more increase), trails in these units would be considered detrimentally impacted. Corresponding changes on steep units were smaller and less consistent. Trails in two of four steep units exceeded the 500-kPa standard at the 15- to 25-cm depth (table 8).
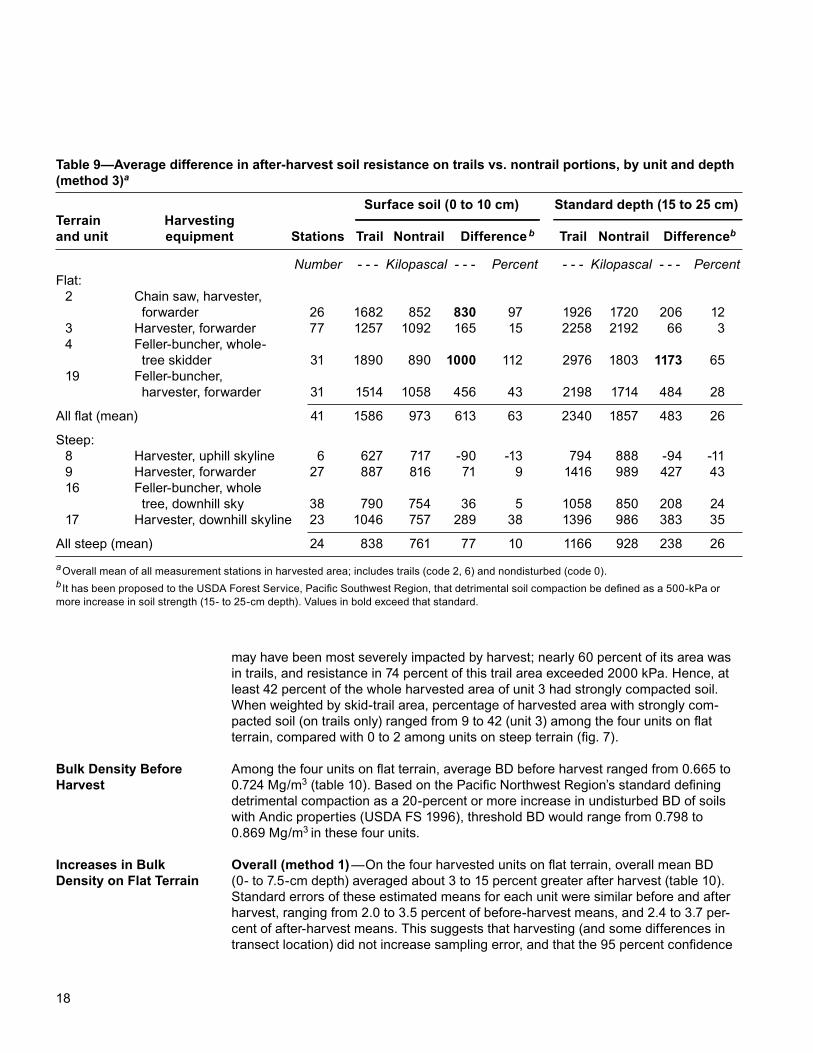
Trail vs. nontrail (method 3) —This method of comparison equals the usual, retro-spective (after-harvest) monitoring in which one samples soil on trails and compares these estimates of soil resistance or bulk density to corresponding estimates from nontrail portions. When interpreting results, one assumes (1) that trails were placed on soils representative of the remaining portions (that soils were similar); (2) that soil moisture conditions on and off trails were similar when sampled; hence, (3) that differ-ences can be explained by equipment impact (a typical monitoring question). Based on this conventional method, we note that trails in only one of eight units exceeded the proposed standard defining detrimental soil resistance (table 9). Moreover, percentage changes computed from retrospective sampling were consistently less than those cal-culated from before- vs. after-harvest measurements at the same stations (method 2).
Assuming 2000 kPa resistance in the 15- to 25-cm depth hinders root growth, then 52 to 74 percent of the stations located on trails in the flat terrain exceeded this threshold resistance, but only 0 to 13 percent of the trail stations in steep terrain did so. Unit 3
Table 8—Average change in soil resistance at stations on trails, by unit and depth (method 2)
Surface soil (0 to 10 cm) Standard depth (15 to 25 cm)Terrain Harvestingand unit equipment Stations a After Before Change b After Before Changeb
Number - - - Kilopascal - - - Percent - - - Kilopascal - - - PercentFlat: 2 Chain saw, harvester, forwarder 26 1614 822 792 96 2016 1408 608 43 3 Harvester, forwarder 77 1277 502 775 154 2322 988 1334 135 4 Feller-buncher, whole- tree skidder 31 2149 806 1343 167 2858 1598 1260 79 19 Feller-buncher, harvester, forwarder 31 1474 740 734 99 2169 959 1210 126
All (mean) 41 1628 718 911 127 2341 1238 1103 89
Steep: 8 Harvester, uphill skyline 6 630 919 289 31 689 839 -150 -18 9 Harvester, forwarder 27 793 887 94 11 1309 781 528 68 16 Feller-buncher, whole tree, downhill skyline 38 780 733 -47 -6 1130 702 428 61 17 Harvester, downhill skyline 23 947 708 -239 -34 1334 794 540 68
All (mean) 24 788 812 -24 -3 1116 779 337 43a These stations were coded (after harvest) as in or beside trail ruts.b It has been proposed to the USDA Forest Service, Pacific Southwest Region, that detrimental soil compaction be defined as a 500-kPa or more increase in soil strength (15- to 25-cm depth). Values in bold exceed that standard.
18 19
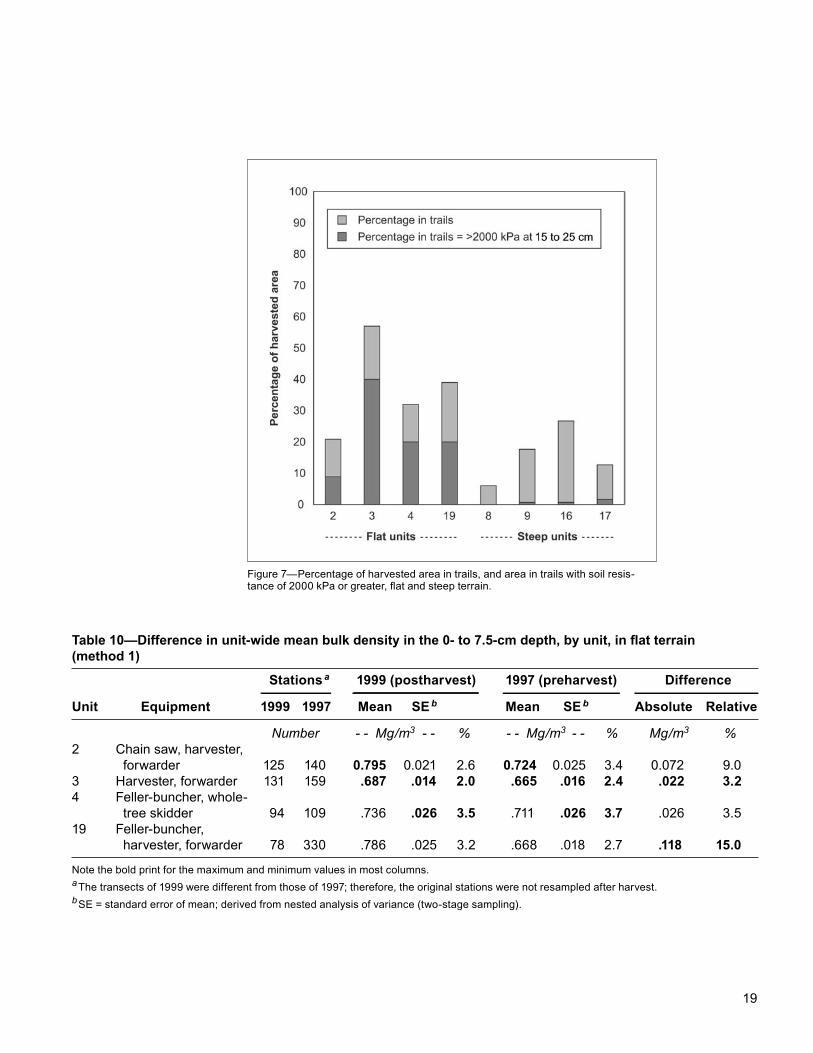
may have been most severely impacted by harvest; nearly 60 percent of its area was in trails, and resistance in 74 percent of this trail area exceeded 2000 kPa. Hence, at least 42 percent of the whole harvested area of unit 3 had strongly compacted soil. When weighted by skid-trail area, percentage of harvested area with strongly com-pacted soil (on trails only) ranged from 9 to 42 (unit 3) among the four units on flat terrain, compared with 0 to 2 among units on steep terrain (fig. 7).
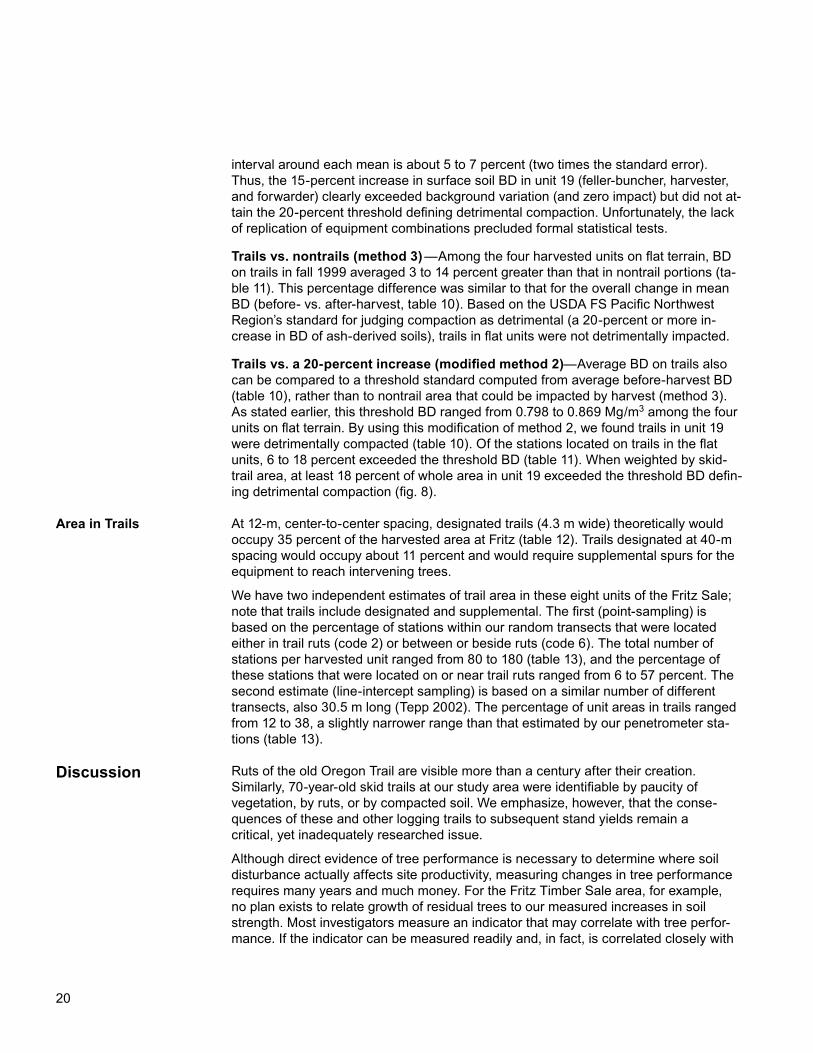
Among the four units on flat terrain, average BD before harvest ranged from 0.665 to 0.724 Mg/m3 (table 10). Based on the Pacific Northwest Region’s standard defining detrimental compaction as a 20-percent or more increase in undisturbed BD of soils with Andic properties (USDA FS 1996), threshold BD would range from 0.798 to 0.869 Mg/m3 in these four units.
Overall (method 1) —On the four harvested units on flat terrain, overall mean BD (0- to 7.5-cm depth) averaged about 3 to 15 percent greater after harvest (table 10). Standard errors of these estimated means for each unit were similar before and after harvest, ranging from 2.0 to 3.5 percent of before-harvest means, and 2.4 to 3.7 per-cent of after-harvest means. This suggests that harvesting (and some differences in transect location) did not increase sampling error, and that the 95 percent confidence
Bulk Density Before Harvest
Increases in Bulk Density on Flat Terrain
Table 9—Average difference in after-harvest soil resistance on trails vs. nontrail portions, by unit and depth (method 3)a
Surface soil (0 to 10 cm) Standard depth (15 to 25 cm)Terrain Harvestingand unit equipment Stations Trail Nontrail Difference b Trail Nontrail Differenceb
Number - - - Kilopascal - - - Percent - - - Kilopascal - - - PercentFlat: 2 Chain saw, harvester, forwarder 26 1682 852 830 97 1926 1720 206 12 3 Harvester, forwarder 77 1257 1092 165 15 2258 2192 66 3 4 Feller-buncher, whole- tree skidder 31 1890 890 1000 112 2976 1803 1173 65 19 Feller-buncher, harvester, forwarder 31 1514 1058 456 43 2198 1714 484 28
All flat (mean) 41 1586 973 613 63 2340 1857 483 26
Steep: 8 Harvester, uphill skyline 6 627 717 -90 -13 794 888 -94 -11 9 Harvester, forwarder 27 887 816 71 9 1416 989 427 43 16 Feller-buncher, whole tree, downhill sky 38 790 754 36 5 1058 850 208 24 17 Harvester, downhill skyline 23 1046 757 289 38 1396 986 383 35
All steep (mean) 24 838 761 77 10 1166 928 238 26a Overall mean of all measurement stations in harvested area; includes trails (code 2, 6) and nondisturbed (code 0).b It has been proposed to the USDA Forest Service, Pacific Southwest Region, that detrimental soil compaction be defined as a 500-kPa or more increase in soil strength (15- to 25-cm depth). Values in bold exceed that standard.
18 19
Figure 7—Percentage of harvested area in trails, and area in trails with soil resis-tance of 2000 kPa or greater, flat and steep terrain.
Table 10—Difference in unit-wide mean bulk density in the 0- to 7.5-cm depth, by unit, in flat terrain (method 1)
Stations a 1999 (postharvest) 1997 (preharvest) Difference
Unit Equipment 1999 1997 Mean SE b Mean SE b Absolute Relative
Number - - Mg/m3 - - % - - Mg/m3 - - % Mg/m3 %2 Chain saw, harvester, forwarder 125 140 0.795 0.021 2.6 0.724 0.025 3.4 0.072 9.03 Harvester, forwarder 131 159 .687 .014 2.0 .665 .016 2.4 .022 3.24 Feller-buncher, whole- tree skidder 94 109 .736 .026 3.5 .711 .026 3.7 .026 3.519 Feller-buncher, harvester, forwarder 78 330 .786 .025 3.2 .668 .018 2.7 .118 15.0
Note the bold print for the maximum and minimum values in most columns. a The transects of 1999 were different from those of 1997; therefore, the original stations were not resampled after harvest. b SE = standard error of mean; derived from nested analysis of variance (two-stage sampling).
20 21
interval around each mean is about 5 to 7 percent (two times the standard error). Thus, the 15-percent increase in surface soil BD in unit 19 (feller-buncher, harvester, and forwarder) clearly exceeded background variation (and zero impact) but did not at-tain the 20-percent threshold defining detrimental compaction. Unfortunately, the lack of replication of equipment combinations precluded formal statistical tests.
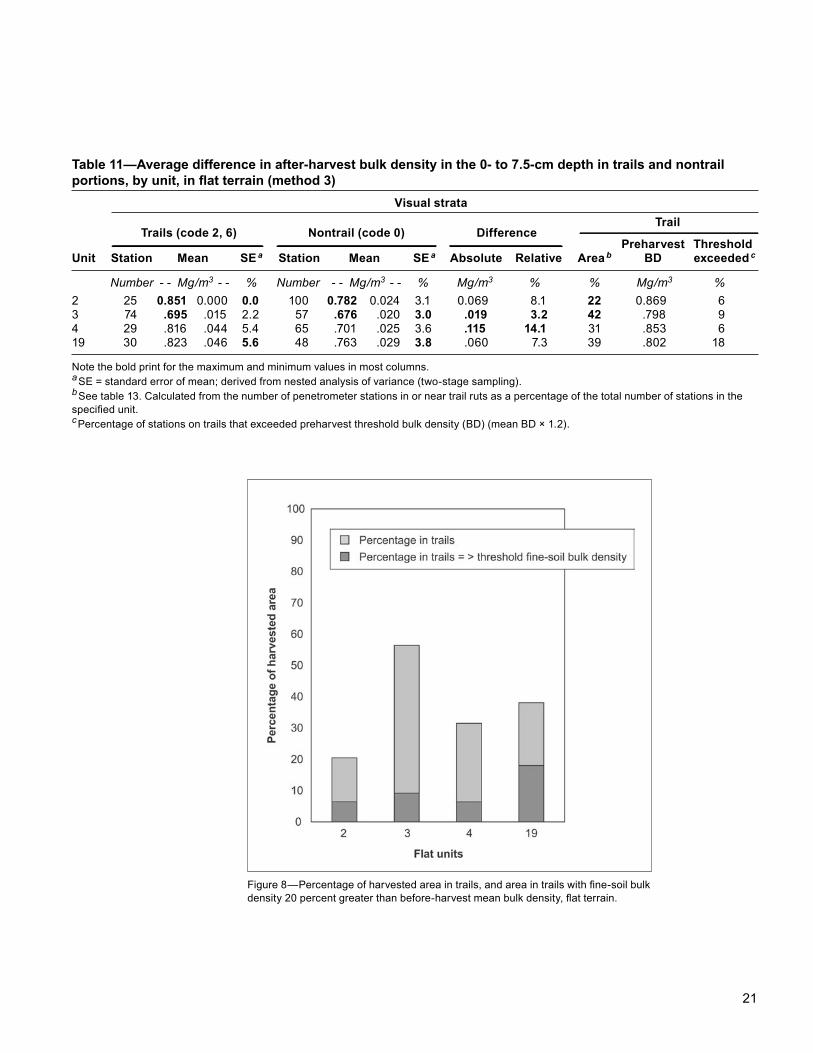
Trails vs. nontrails (method 3) —Among the four harvested units on flat terrain, BD on trails in fall 1999 averaged 3 to 14 percent greater than that in nontrail portions (ta-ble 11). This percentage difference was similar to that for the overall change in mean BD (before- vs. after-harvest, table 10). Based on the USDA FS Pacific Northwest Region’s standard for judging compaction as detrimental (a 20-percent or more in-crease in BD of ash-derived soils), trails in flat units were not detrimentally impacted.
Trails vs. a 20-percent increase (modified method 2)—Average BD on trails also can be compared to a threshold standard computed from average before-harvest BD (table 10), rather than to nontrail area that could be impacted by harvest (method 3). As stated earlier, this threshold BD ranged from 0.798 to 0.869 Mg/m3 among the four units on flat terrain. By using this modification of method 2, we found trails in unit 19 were detrimentally compacted (table 10). Of the stations located on trails in the flat units, 6 to 18 percent exceeded the threshold BD (table 11). When weighted by skid-trail area, at least 18 percent of whole area in unit 19 exceeded the threshold BD defin-ing detrimental compaction (fig. 8).
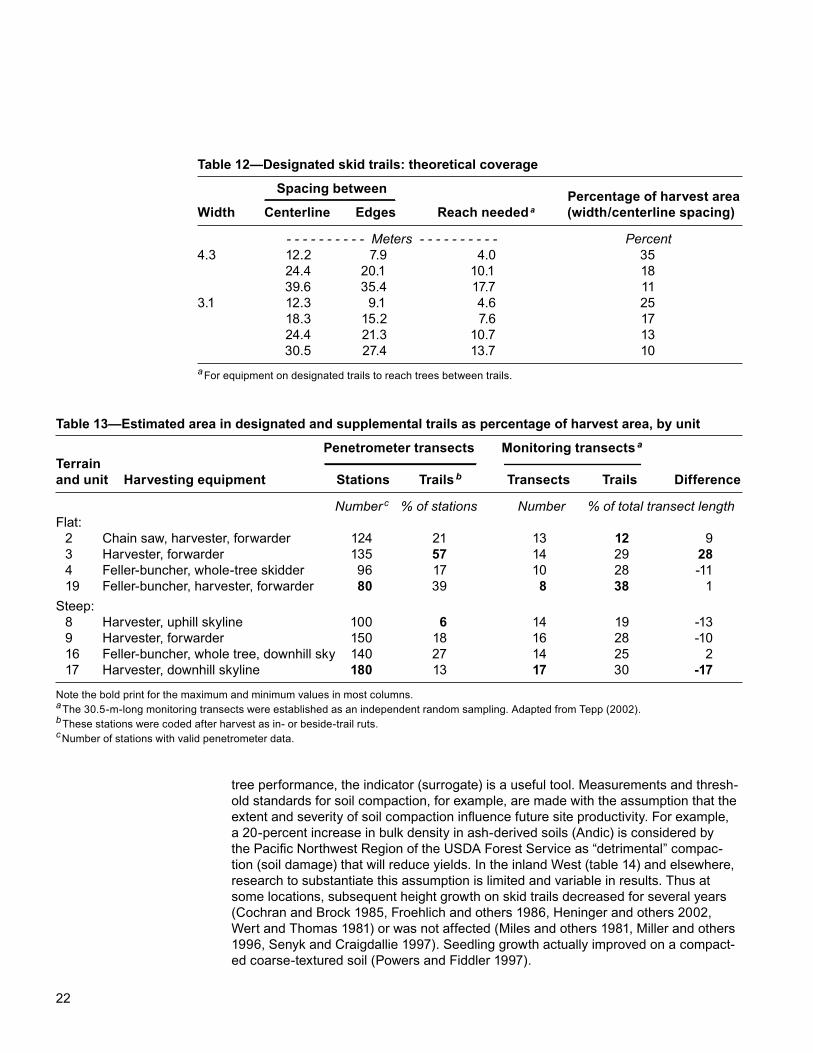
At 12-m, center-to-center spacing, designated trails (4.3 m wide) theoretically would occupy 35 percent of the harvested area at Fritz (table 12). Trails designated at 40-m spacing would occupy about 11 percent and would require supplemental spurs for the equipment to reach intervening trees.
We have two independent estimates of trail area in these eight units of the Fritz Sale; note that trails include designated and supplemental. The first (point-sampling) is based on the percentage of stations within our random transects that were located either in trail ruts (code 2) or between or beside ruts (code 6). The total number of stations per harvested unit ranged from 80 to 180 (table 13), and the percentage of these stations that were located on or near trail ruts ranged from 6 to 57 percent. The second estimate (line-intercept sampling) is based on a similar number of different transects, also 30.5 m long (Tepp 2002). The percentage of unit areas in trails ranged from 12 to 38, a slightly narrower range than that estimated by our penetrometer sta-tions (table 13).
Ruts of the old Oregon Trail are visible more than a century after their creation. Similarly, 70-year-old skid trails at our study area were identifiable by paucity of vegetation, by ruts, or by compacted soil. We emphasize, however, that the conse-quences of these and other logging trails to subsequent stand yields remain a critical, yet inadequately researched issue.
Although direct evidence of tree performance is necessary to determine where soil disturbance actually affects site productivity, measuring changes in tree performance requires many years and much money. For the Fritz Timber Sale area, for example, no plan exists to relate growth of residual trees to our measured increases in soil strength. Most investigators measure an indicator that may correlate with tree perfor-mance. If the indicator can be measured readily and, in fact, is correlated closely with
Area in Trails
Discussion
20 21
Table 11—Average difference in after-harvest bulk density in the 0- to 7.5-cm depth in trails and nontrail portions, by unit, in flat terrain (method 3) Visual strata
Trails (code 2, 6) Nontrail (code 0) Difference Trail
Preharvest ThresholdUnit Station Mean SE a Station Mean SE a Absolute Relative Area b BD exceeded c
Number - - Mg/m3 - - % Number - - Mg/m3 - - % Mg/m3 % % Mg/m3 %2 25 0.851 0.000 0.0 100 0.782 0.024 3.1 0.069 8.1 22 0.869 63 74 .695 .015 2.2 57 .676 .020 3.0 .019 3.2 42 .798 94 29 .816 .044 5.4 65 .701 .025 3.6 .115 14.1 31 .853 619 30 .823 .046 5.6 48 .763 .029 3.8 .060 7.3 39 .802 18
Note the bold print for the maximum and minimum values in most columns. a SE = standard error of mean; derived from nested analysis of variance (two-stage sampling).b See table 13. Calculated from the number of penetrometer stations in or near trail ruts as a percentage of the total number of stations in the specified unit.c Percentage of stations on trails that exceeded preharvest threshold bulk density (BD) (mean BD × 1.2).
Figure 8—Percentage of harvested area in trails, and area in trails with fine-soil bulk density 20 percent greater than before-harvest mean bulk density, flat terrain.
22 23
Table 13—Estimated area in designated and supplemental trails as percentage of harvest area, by unit
Penetrometer transects Monitoring transects aTerrain and unit Harvesting equipment Stations Trails b Transects Trails Difference
Number c % of stations Number % of total transect lengthFlat: 2 Chain saw, harvester, forwarder 124 21 13 12 9 3 Harvester, forwarder 135 57 14 29 28 4 Feller-buncher, whole-tree skidder 96 17 10 28 -11 19 Feller-buncher, harvester, forwarder 80 39 8 38 1Steep: 8 Harvester, uphill skyline 100 6 14 19 -13 9 Harvester, forwarder 150 18 16 28 -10 16 Feller-buncher, whole tree, downhill sky 140 27 14 25 2 17 Harvester, downhill skyline 180 13 17 30 -17
Note the bold print for the maximum and minimum values in most columns. a The 30.5-m-long monitoring transects were established as an independent random sampling. Adapted from Tepp (2002).b These stations were coded after harvest as in- or beside-trail ruts.c Number of stations with valid penetrometer data.
Table 12—Designated skid trails: theoretical coverage
Spacing between Percentage of harvest areaWidth Centerline Edges Reach needed a (width/centerline spacing)
- - - - - - - - - - Meters - - - - - - - - - - Percent4.3 12.2 7.9 4.0 35 24.4 20.1 10.1 18 39.6 35.4 17.7 113.1 12.3 9.1 4.6 25 18.3 15.2 7.6 17 24.4 21.3 10.7 13 30.5 27.4 13.7 10a For equipment on designated trails to reach trees between trails.
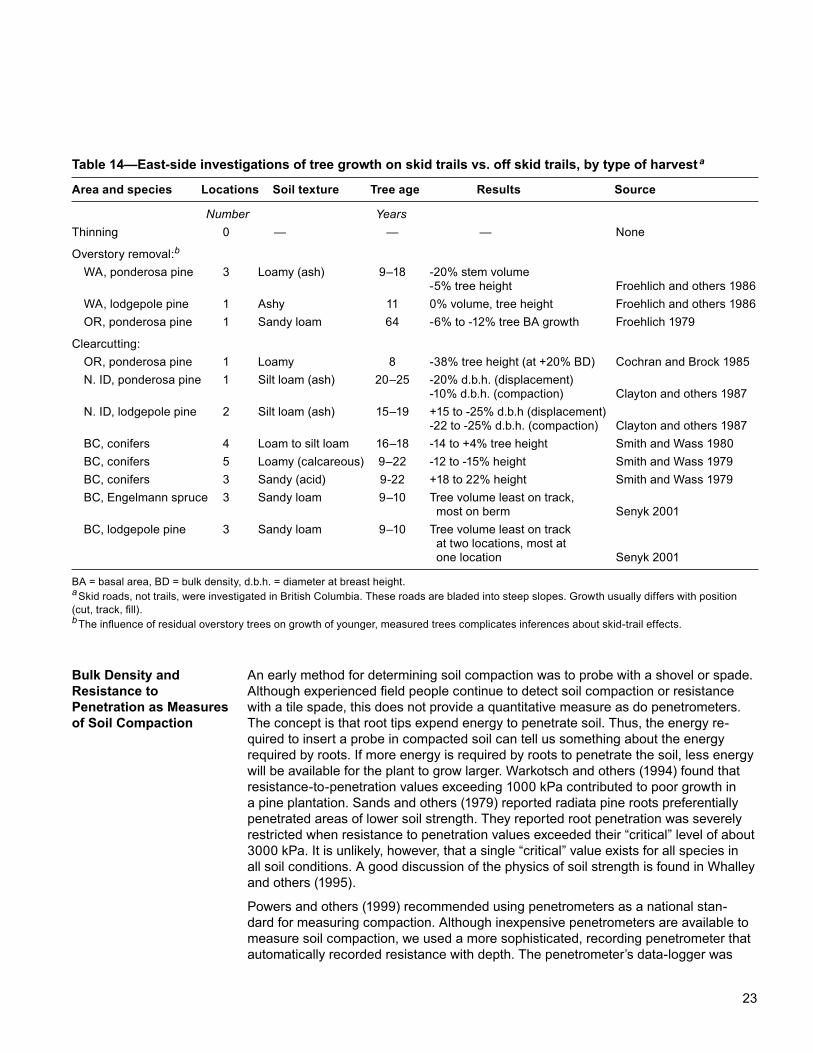
tree performance, the indicator (surrogate) is a useful tool. Measurements and thresh-old standards for soil compaction, for example, are made with the assumption that the extent and severity of soil compaction influence future site productivity. For example, a 20-percent increase in bulk density in ash-derived soils (Andic) is considered by the Pacific Northwest Region of the USDA Forest Service as “detrimental” compac-tion (soil damage) that will reduce yields. In the inland West (table 14) and elsewhere, research to substantiate this assumption is limited and variable in results. Thus at some locations, subsequent height growth on skid trails decreased for several years (Cochran and Brock 1985, Froehlich and others 1986, Heninger and others 2002, Wert and Thomas 1981) or was not affected (Miles and others 1981, Miller and others 1996, Senyk and Craigdallie 1997). Seedling growth actually improved on a compact-ed coarse-textured soil (Powers and Fiddler 1997).
22 23
Table 14—East-side investigations of tree growth on skid trails vs. off skid trails, by type of harvest a
Area and species Locations Soil texture Tree age Results Source
Number YearsThinning 0 — — — None
Overstory removal:b
WA, ponderosa pine 3 Loamy (ash) 9–18 -20% stem volume -5% tree height Froehlich and others 1986 WA, lodgepole pine 1 Ashy 11 0% volume, tree height Froehlich and others 1986 OR, ponderosa pine 1 Sandy loam 64 -6% to -12% tree BA growth Froehlich 1979
Clearcutting: OR, ponderosa pine 1 Loamy 8 -38% tree height (at +20% BD) Cochran and Brock 1985 N. ID, ponderosa pine 1 Silt loam (ash) 20–25 -20% d.b.h. (displacement) -10% d.b.h. (compaction) Clayton and others 1987 N. ID, lodgepole pine 2 Silt loam (ash) 15–19 +15 to -25% d.b.h (displacement) -22 to -25% d.b.h. (compaction) Clayton and others 1987 BC, conifers 4 Loam to silt loam 16–18 -14 to +4% tree height Smith and Wass 1980 BC, conifers 5 Loamy (calcareous) 9–22 -12 to -15% height Smith and Wass 1979 BC, conifers 3 Sandy (acid) 9-22 +18 to 22% height Smith and Wass 1979 BC, Engelmann spruce 3 Sandy loam 9–10 Tree volume least on track, most on berm Senyk 2001 BC, lodgepole pine 3 Sandy loam 9–10 Tree volume least on track at two locations, most at one location Senyk 2001
BA = basal area, BD = bulk density, d.b.h. = diameter at breast height.a Skid roads, not trails, were investigated in British Columbia. These roads are bladed into steep slopes. Growth usually differs with position (cut, track, fill).b The influence of residual overstory trees on growth of younger, measured trees complicates inferences about skid-trail effects.
Bulk Density and Resistance to Penetration as Measures of Soil Compaction
An early method for determining soil compaction was to probe with a shovel or spade. Although experienced field people continue to detect soil compaction or resistance with a tile spade, this does not provide a quantitative measure as do penetrometers. The concept is that root tips expend energy to penetrate soil. Thus, the energy re-quired to insert a probe in compacted soil can tell us something about the energy required by roots. If more energy is required by roots to penetrate the soil, less energy will be available for the plant to grow larger. Warkotsch and others (1994) found that resistance-to-penetration values exceeding 1000 kPa contributed to poor growth in a pine plantation. Sands and others (1979) reported radiata pine roots preferentially penetrated areas of lower soil strength. They reported root penetration was severely restricted when resistance to penetration values exceeded their “critical” level of about 3000 kPa. It is unlikely, however, that a single “critical” value exists for all species in all soil conditions. A good discussion of the physics of soil strength is found in Whalley and others (1995).
Powers and others (1999) recommended using penetrometers as a national stan-dard for measuring compaction. Although inexpensive penetrometers are available to measure soil compaction, we used a more sophisticated, recording penetrometer that automatically recorded resistance with depth. The penetrometer’s data-logger was
24 25
subsequently downloaded to a computer for editing and summarizing. The main draw-back to using all penetrometers, however, is the difficulty of inserting the probe to the desired depth in skeletal or rocky soil. We encountered that problem in subsoils of our study area. Although no threshold standard has been set for increases in soil resis-tance, a standard is being considered by the Pacific Southwest Region of the USDA Forest Service (see footnote 2). This potential standard would define detrimental com-paction as a 500-kPa or more increase in soil resistance in the 15- to 25-cm depth.
Bulk density is another commonly used measure of soil compaction. Expressed as Mg/m3 or g/cm3, bulk density is the ratio of mass of dry solids to bulk volume of the soil (Blake and Hartge 1986). For soils derived from ash or pumice that are common in east-side national forests of the Pacific Northwest Region, an increase of 20 percent in BD is considered the threshold value for detrimental compaction. Although provid-ing a quantitative measure, bulk density measurements are more time-consuming and expensive than penetrometer measurements (Miller and others 2001). This limits their usefulness as an operational monitoring tool. Additionally, the BD value depends on how it is measured and calculated. If measured with a small-diameter corer, some gravel and roots are excluded, and results differ from those that would be obtained with a larger corer. The core diameter must be sufficiently large to capture a represen-tative sample; many commonly used BD samplers do not have a diameter and volume of sufficient size. Further, there are differing opinions on whether BD should be calcu-lated for the soil particles <2 mm (fine-soil BD) as we did or for the entire soil sample, including rocks (Allbrook 1986, Gomez and others 2002). As we expected to find, BD with gravel included invariably is greater than BD that excludes gravel. Consequently, caution is needed when comparing results between reports. Only those BD data that are obtained from the same sampling and calculating methods can be compared with confidence.
Concurrent measurements of BD and resistance to penetration have been compared in a few soils. Resistance to penetration is related positively to soil bulk density by Allbrook (1986), Clayton (1990), and Sands and others (1979). They also reported that compacted soils can show strong increases in soil strength, yet only small increases in bulk density. Similarly, Vazquez and others (1991) found that wheel traffic on a sandy soil increased resistance to penetration more than 35 percent in the upper 25 cm of soil, whereas BD increased less than 3 percent. They interpreted this to mean that soil resistance to penetration was tenfold more sensitive than BD as an indicator of soil compaction. Our results from the four units on flat terrain fit this pattern; percentage increases in resistance were much larger than percentage increases in BD. Thompson and others (1987) reported that root performance is correlated with both penetrom-eter resistance (r2 = 0.73) and bulk density (r2 = 0.81). Ongoing research in the North American Soil Productivity Study (Powers and others 1990) may indicate which is the better surrogate for relating to tree growth.
Soil factors that influence penetration resistance include water content, bulk density, soil compressibility (susceptibility to decrease in bulk volume when subjected to a load), soil strength parameters, and soil structure (Bradford 1986). Soil strength is most easily affected by changes in soil water content and bulk density, although other factors including texture, mineralogy, cementation, cation composition, and organic matter content also affect soil resistance (Soil Science Society of America 1997). On the flat control unit, we noted increases in mean values of both BD and soil strength
Factors Affecting Resistance to Penetration
24 25
between summer and fall samplings. Presumably some of the increase in soil strength in the flat units is explained by concurrent increases in bulk density (compression of solids into smaller volume) and by drier soil (more friction).
Consequently, preharvest differences in any of these soil factors within and among plots will hinder attempts to isolate or estimate the added effects of harvesting on soil resistance. For example, soil maps documented several soil series in our experimental units of the Fritz Timber Sale (Zulauf and Starr 1979). Steep units, consisting mainly of Merkel sandy loam and Rock Land, are relatively homogeneous within each unit. Flat units are composed of several soil series (Neuske silt loam, Scar sandy loam, Nevine loam, and Gahee loam), which occupy different percentages of each unit. More dif-ferences exist among series on the flat units in texture and estimated compressibility (ranges from low to high; table 2) than among the series in the steep units.
Examination of a representative soil pit on each unit revealed two additional soil con-ditions that could have affected our resistance-to-penetration measurements. First, some pits had dense subsoil located at varying depths. Dense subsoil in flat units 3, 4, and 19 were shallow enough (12 to 17 cm) to inflate penetrometer measurements. Unit 9 on the steep terrain had dense soil layers about 30 cm below the surface, which is near the lower limit of our penetrometer measurements. Note that we reduced poten-tial errors from dense subsoil layers and large rocks by editing our data based on field notes and objective (statistical) elimination of likely spurious values. Second, there existed 10- to 20-cm differences in the depth to the dense layer within the same soil pit (units 2 and 17), indicating significant variability of horizon depth within a lateral dis-tance of 0.6 to 0.9 m. This small-scale vertical and lateral variability in depth to dense layers would increase within-unit variance (hence standard errors) among penetrom-eter readings, thus reducing the likelihood of detecting statistically significant differ-ences.
Soil moisture—Wet soils generally are more easily penetrated; conversely, drying in-creases both resistance to penetration in most soils and bulk density in soils with clay types and organic matter, which shrink when dried. Among our research units, mois-ture concentrations in the 0- to 10-cm depth ranged between 20.2 and 51.6 percent before harvest (summer sampling) and between 5.5 and 20.8 percent after harvest (fall sampling). Yet, soils in our two nontrafficked control areas responded differently to drying. In the flat control area (with loamy textured soils), unit-wide, mean resistance-to-penetration increased in fall after drying; however, the steep control unit (sandy loams) showed no or very little increase in strength for drier soil. The lack of change in resistance to penetration under drier soil moisture in the steep control unit reduces concern that soil moisture differences contributed to the after-harvest increases in soil resistance on steep terrain.
The large increase in unit-wide mean soil resistance in the flat control unit (when sampled in fall with drier soil) is consistent with general theory and with the prevalence of finer textured soil series mapped in the flat terrain. Yet our attempts to quantify the relation between resistance and moisture percentage for preharvest samples failed to support this generalization. For numerous stations, we related preharvest mean resistance to concurrent moisture percentage (both variables in the 0- to 10-cm or 0- to 7.5-cm depth). Scattergrams of these paired observations at preharvest stations indicated the suitability of linear regression; however, calculated coefficients of deter-mination (r2) and slopes of the regression were statistically nonsignificant in 9 of 10 units. Moreover, for the one regression with a significant slope (p = 0.07), the slope
26 27
was positive, indicating the unconventional inference that soil resistance increases with increasing gravimetric moisture percentage. Although puzzling, we cannot ex-clude the explanation that inadequate or excessive drying of some samples may have influenced our regression relationships. Our small, nonforced-draft ovens may have been overloaded with samples that were removed too soon for weighing. Alternatively, some samples could have been excessively dried when temperatures greatly exceed-ed the 105 °C setting. In summary, we found independence of cone resistance to soil moisture in most experimental units, but we remain uncertain of its explanation. We advise concurrent and accurate moisture determination unless resistance is shown to be unrelated to moisture content.
Soil depth—Penetration resistance before harvest was greater at greater soil depth. This is expected because some resistance depends on the weight of soil (overburden) above the depth of measurement (Sands and others 1979). Thus, lateral forces on the penetrometer cone increase with increasing depth; therefore, more force is needed for the cone to displace soil. Resistance also can increase with depth because of chang-es in soil texture, gravel content, and structure (relating mostly to geologic deposition at this study area), but also because biological activity in surface soils reduces resis-tance. In some of our study units, firm glacial till also was encountered, but our care-fully edited data reduced this bias. These multiple sources of natural variation must be recognized when attempting to isolate increases in resistance that are due to treat-ment (harvest). Sampling the same microsites before and after treatment (method 2) will ensure valid interpretations.
After harvest, resistance-to-penetration values decreased (or increased the least) closest to the soil surface. Surface soil is most subject to both compression and displacement (mixing and loosening) from passage of logs, whole trees, and machin-ery. A penetrometer measures the net of these opposing effects. Largely to avoid these countereffects in the surface soil, measurements at the 15- to 25-cm depth are proposed to detect changes in soil strength. Warkotsch and others (1994) reported increased soil resistance with depth down to about 40 cm (16 in), and that soil resis-tance increased with each succeeding pass of three different forwarding machines. In contrast, a skyline system for removing the boles caused little increase in soil resis-tance to penetration. We surmise that cable systems can reduce resistence of surface soil when dragged logs displace soil (table 7).
Detecting change differs from detecting difference. Detecting change requires repeat sampling of the same microsites (stations in our investigation) before and after har-vesting. Our method 2 met this requirement at most stations. To minimize sampling error, however, locations of the before- and after-harvesting samples should not be so close as to affect remeasurement. Moreover, sampling moisture concurrently with penetrometer sampling also is desirable to adjust for the possible influence of moisture differences between sampling dates.
Our random transects in these 3- to 11-ha units were designed to sample the entire activity area as prescribed by USDA FS Pacific Northwest Region Guidelines for de-termining the areal extent of specified conditions. Because soil resistance was mea-sured both before and shortly after harvesting, we could compute either change (as-suming the same stations were remeasured) or difference (where new transects were installed after harvest) in resistance in three ways:
Detecting Changes in Soil Resistance or Bulk Density
26 27
Method 1—Overall (unit-wide) difference between the means of all before-harvest vs. all after-harvest stations. Where before-harvest stations were, in fact resampled, sam-pling error was minimized and the measured difference equaled change.
Method 2—Change in resistance at those before-harvest stations that were subse-quently impacted by trails. This preferred method assumes the same stations were resampled; this minimizes the contribution of sampling error (unequal location) to our measure of change. Method 2 addresses the change on a recognizable and repeat-edly trafficked stratum of the unit.
Method 3—Differences in mean resistance on trails vs. nontrail portions, based solely on after-harvest sampling. This method typifies most postactivity monitoring required by adaptive management. Because stations sampling each stratum are independent of each other, sampling error caused by soil variation can contribute strongly to the ob-served difference. Moreover, the number of years between harvest and soil measure-ments can confound comparisons of results among investigations (Davis 1992, Geist and others 1989, Snider and Miller 1985).
According to method 1, mean resistance to penetration at the 15- to 25-cm depth (a proposed standard depth) increased by 535 to 1189 kPa in flat units, but only by 0 to 240 kPa in steep units. The flat control unit also averaged a 720-kPa or 80-percent increase, presumably because the soil was drier at the fall (after-harvest) sampling. We could not support this assumption with a further analysis of our data. Based on the 55 paired samples collected in summer from the 0- to 7.5-cm depth in this unit, soil resistance on this flat control unit was unrelated to gravimetric moisture concentration (7.3 to 53.5 percent) (r2 = 0.00, p = 0.866). This empirical result contradicts theory. We offer two possible explanations: (1) our moisture determinations were unreliable, per-haps because the samples were dried excessively; or (2) other soil characteristics, for example, texture, organic matter, or bulk density, influenced the relation between soil resistance and moisture content.
In steep units, resistance to penetration (15- to 25-cm depth) increased over the entire treatment unit (activity area) by 3 percent in the control unit, by 1 percent in the unit harvested with a cut-to-length (CTL) harvester and uphill skyline system, by 8 percent in the unit harvested with a CTL harvester and forwarder, by 25 percent in the unit harvested with a CTL harvester and downhill skyline system, and by 31 percent in the unit harvested with a feller-buncher and a downhill skyline system. This suggests that downhill skyline yarding impacted the soil on steep terrain more severely than uphill cable yarding and even forwarders. This speculation is consistent with other observa-tions that downhill yarding places logs in contact with the soil surface for the great-est distance and time (Cromack and others 1979). Because our measurements were made after both cutting and yarding, we cannot separate the independent effects of the yarding system from the effects of the cutting method. Moreover, lacking replica-tion, we have no statistical tests to compare the effect of specific equipment combina-tions.
According to method 2, increases of 500 kPa or more (15- to 25-cm depth) occurred on trails of two of four units on steep terrain. Based on proposed standards, soils on designated trails in six of eight units were detrimentally affected (table 8). Among the eight units, trails occurred on 17 to 57 percent of unit area in flat terrain and 6 to 27 percent on steep terrain.
28 29
According to method 3 and a proposed standard for soil resistence, detrimental com-paction occurred on only one unit (table 9), whereas before-harvest vs. after-harvest sampling of method 2 indicated detrimental compaction on six of eight units. With such retrospective sampling, one must decide if a difference between trail and nontrail portions is explained by (1) more machine traffic, (2) originally different soil condition that may have influenced trail routing, (3) deeper sampling in the original soil pro-file on trails because topsoil was displaced (truncated), (4) increased percentage of coarse fragments or moisture caused by machine traffic, or (5) some combination of these. Because of the difficulty of eliminating alternative explanations, we assert that such retrospective monitoring is usually less reliable than before-vs.-after sampling to estimate change. Yet retrospective monitoring costs less because only one sampling period is required, and many of the uncertainties can be evaluated and eliminated by careful site-soil description and interpretation.
With 4.3-m-wide trails, the theoretical area in designated trails is 35 percent with 12-m center-to-center spacing and only 11 percent with 40-m spacing. Among our harvested units, however, the percentage of stations located in trails ranged from 6 to 57 percent. Although all trails in steep units were designated at 12-m center-to-center spacing, the estimated percentage of trail area, including supplemental trails, ranged between 6 and 27, considerably less than the theoretical 35 percent. Although our underestimate could relate to sampling error, deviation from planned spacing is an alternative explanation.
Despite designated trails and cable corridors in the Fritz Timber Sale, percentages of trails and disturbed soil in our study areas generally exceeded those reported for other thinning or partial cutting projects east of the Cascades (table 15). The differ-ence could originate from variations in sampling intensity, definitions of trails and disturbance, terrain, soil moisture conditions at harvesting, and tree size and volume removed. The paucity of study areas and descriptive detail hinders further explanation.
Soil monitoring guidelines for the USDA FS Pacific Northwest Region apply to the Fritz Timber Sale. The intent of this monitoring is to check that soil disturbance in activ-ity areas is being kept within acceptable levels. The Region has soil protection stan-dards that require a minimum of 80 percent of an activity area be left in “a condition of acceptable productivity potential for trees and other managed vegetation following land management activities” (USDA FS 1998). The “activity area” is the total area of ground-impacting activities including permanent roads and temporary roads or land-ings. Therefore, the total acreage of all detrimental soil conditions should not exceed 20 percent of the total acreage within the activity area. Generally, 5 percent of an ac-tivity area is committed to landings and system roads (USDA FS 1996). Thus, assess-ment of detrimental ground-impacting activities has two components: (1) determining the acreage in all system roads, landings, and spur roads, which offer little potential for plant productivity and (2) determining acreage of compaction, puddling, displace-ment, soil erosion, and burned soil that is considered of “detrimental” severity to future productivity. For example, detrimental compaction in soils derived from ash or pumice is defined as an increase in bulk density (after volume and mass of material >2 mm are excluded) of 20 percent or more. No standard for increases in soil resistance is established by this Region. We did not attempt to estimate area of roads and landings (component 1) in this study area because roads and landings were not included in our
Area in Skid Trails
The Extent of Detrimental Soil Disturbance at the Fritz Sale
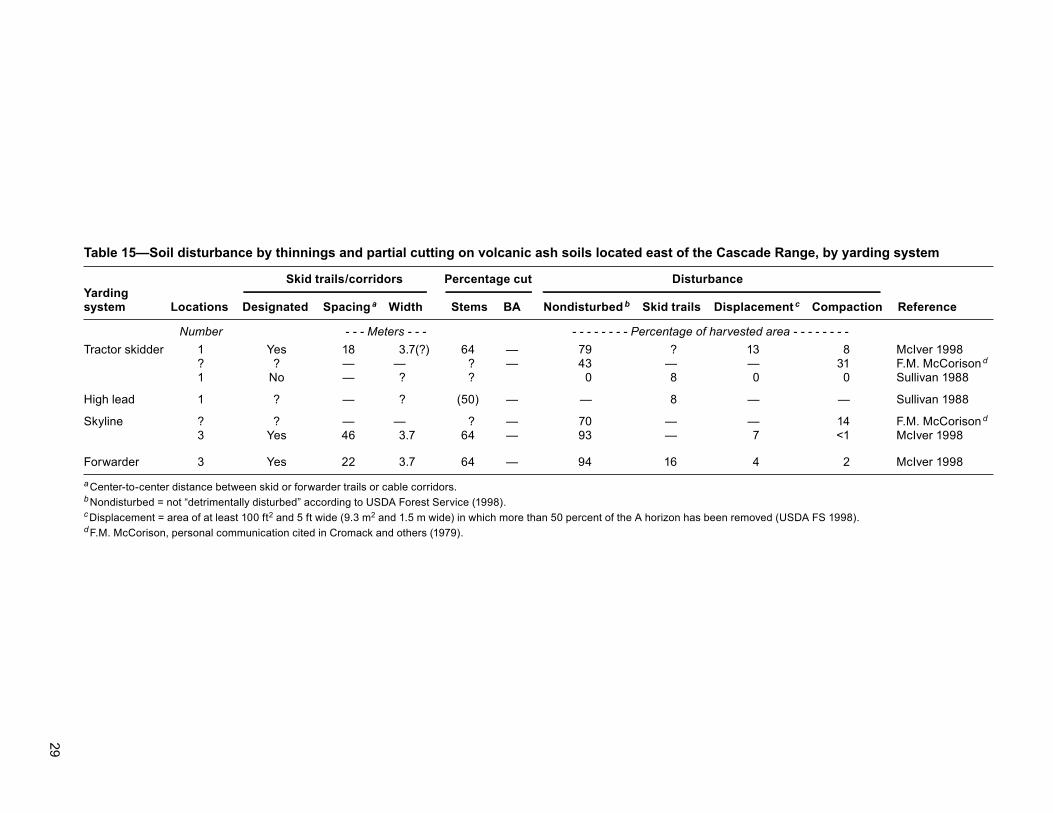
2829
Table 15—Soil disturbance by thinnings and partial cutting on volcanic ash soils located east of the Cascade Range, by yarding system
Skid trails/corridors Percentage cut DisturbanceYardingsystem Locations Designated Spacing a Width Stems BA Nondisturbed b Skid trails Displacement c Compaction Reference
Number - - - Meters - - - - - - - - - - - Percentage of harvested area - - - - - - - -Tractor skidder 1 Yes 18 3.7(?) 64 — 79 ? 13 8 McIver 1998 ? ? — — ? — 43 — — 31 F.M. McCorison d 1 No — ? ? 0 8 0 0 Sullivan 1988
High lead 1 ? — ? (50) — — 8 — — Sullivan 1988
Skyline ? ? — — ? — 70 — — 14 F.M. McCorison d 3 Yes 46 3.7 64 — 93 — 7 <1 McIver 1998
Forwarder 3 Yes 22 3.7 64 — 94 16 4 2 McIver 1998
a Center-to-center distance between skid or forwarder trails or cable corridors.b Nondisturbed = not “detrimentally disturbed” according to USDA Forest Service (1998).c Displacement = area of at least 100 ft2 and 5 ft wide (9.3 m2 and 1.5 m wide) in which more than 50 percent of the A horizon has been removed (USDA FS 1998).d F.M. McCorison, personal communication cited in Cromack and others (1979).
30 31
sampling area. Assuming these areas composed about 5 percent of the sale area, det-rimental soil disturbance should not exceed 15 percent of the area of harvested units in the Fritz Sale.
Trails in the flat units cover 17 to 57 percent of the total sampling area among these four units. On the steep units, trails and cable corridors covered 6 to 27 percent. Although area in trails used by skidders is assumed by the Region standards to be detrimentally damaged, a skidder was used only on unit 4, and whole trees, not logs, were dragged. Compared to nontrail portions, trails in flat units averaged a 3- to 14-percent increase in bulk density, which is less than the Region threshold of 20 per-cent that defines detrimental compaction. Because soil BD also was sampled before harvest, we also could compare BD in trails with the preharvest mean values for each unit. Among the four units on flat terrain, 22 to 42 percent of the total sample stations sampled trails. Of these, 6 to 18 percent exceeded the 20-percent threshold assumed to indicate detrimental compaction. We infer from the data collected on the more vulnerable loamy textures of the flat terrain that (1) the area of designated and supple-mental trails exceeded the Region area standard of 15 percent; (2) BD increases on these trails did not exceed the Region standard of 20 percent for assumed detrimental increase; therefore (3) four units met the Region guidelines. Although insufficient BD samples were collected in the four units on steep terrain, increases in soil resistance to penetration in the sandier soils on these steep units were minimal (and less than on flat units). We infer that these steep units also met Region standards and guidelines.
We also measured increases in soil resistance. Mean absolute change ranged from -150 to 1334 kPa in the 15- to 25-cm depth (method 2) and -94 to 1173 kPa (method 3). According to the proposed standard that a 500-kPa or more increase defines det-rimental disturbance, trails were considered detrimentally damaged in six of the eight units (method 2) vs. one of the eight units (method 3). Because drier soil in the post-harvest sampling on flat terrain could explain the increased resistance calculated by following method 2, we decided that results of method 3 (retrospective sampling) were more reliable in this situation. Therefore, we concluded that trails in only one of eight units were detrimentally compacted.
Our before-harvest sampling in steep units disclosed recognizable skid trails from previous salvage harvest about 70 years earlier. We know of no other entries in this area after the early 1930s. The absence of lateral berms along these former skid trails indicates that little topsoil was displaced to expose denser subsoil. We infer from our resistance measurements that soil compaction endured for at least 70 years in these soils derived from volcanic ash. Although we have no way of knowing the original af-ter-salvage resistance in these trails, residual resistance to penetration on these old trails was similar to that on new trails in the same steep units (figs. 6b, 6c, 6e). Note, however, that the residual resistance was less than 2000 kPa when sampled in moist summer conditions. This resistance is unlikely to be root limiting at this season of year. Persistence of compacted soil and, presumably, long-term consequences of com-paction for tree growth depend on the severity of the initial compaction, the ability of species to cope with compacted soils, and rates of processes that decompact the soil (Cromack and others 1979, Froehlich and McNabb 1984, Froehlich and others 1985). Recovery processes vary greatly with soil texture and clay type, and their interaction with climatic processes such as cycles of freezing-thawing and wetting-drying.
Duration of Compaction
30 31
Conclusions • Before harvesting on these ash-derived soils, resistance to penetration was great-er at greater soil depth on all units. Compaction from earlier fire-salvage harvest-ing lasted for 70 or more years.
• Most trails in recently thinned units were designated, but others were supplemen-tal, especially where trails were designated at 40-m rather than 12-m center-to-center intervals. Percentage of the total thinned area that resulted in trails ranged from 6 to 27 percent on steep terrain and 17 to 57 percent on flat terrain.
• Harvesting increased resistance to penetration and bulk density in trails, but exist-ing standards defining detrimental increases in bulk density were not exceeded. Percentage increase in resistance was greater than percentage increase in bulk density.
• In the 15- to 25-cm depth, resistance to penetration increased by 500 kPa or more on trails in six of the eight units. Drier soil in the postharvest sampling may have contributed to increased soil strength in the flat terrain, but this is less likely in the steep terrain.
• The area and severity of soil compaction were less on the steep terrain than on the flat terrain, probably because soil textures were sandier and cable yarding was used on three of the four units.
• The absence of replication precluded statistical testing for differences among the several combinations of harvesting equipment and trail spacing.
• Whether compaction was sufficiently severe to decrease root penetration or re-duce tree growth is unknown. Additional research is clearly needed in the inland West to quantify the consequences of soil disturbance for tree performance. Existing and proposed (e.g., a 500-kPa increase in soil resistance) standards that define a detrimental soil disturbance should be supported by tree or vegetative performance. Moreover, the influence of soil moisture condition when soils are sampled for resistance or bulk density should be considered.
We are grateful for funding from the CROP project and for the cooperation of many employees in the Colville National Forest Supervisor’s Office, Kettle Falls District, Colville District, and Colville Dispatch Office; they assisted in myriad ways. We thank Karen Hyer, statistician, Pacific Northwest Research Station, Portland, Oregon, for computer support and the following persons for technical review of our draft manu-script: Paul Adams, Charles Bulmer, Richard Cline, Steve Howes, Leonard Johnson, and Robert Powers.
Acknowledgments
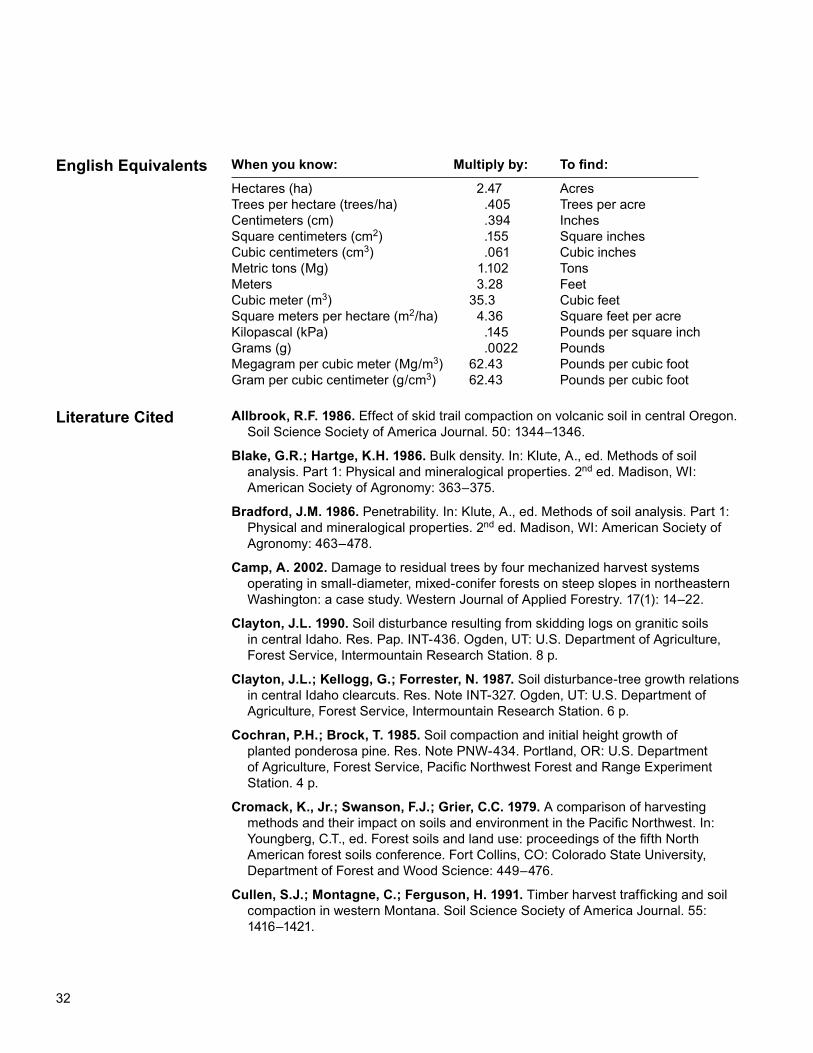
32 33
When you know: Multiply by: To find:
Hectares (ha) 2.47 AcresTrees per hectare (trees/ha) .405 Trees per acreCentimeters (cm) .394 InchesSquare centimeters (cm2) .155 Square inchesCubic centimeters (cm3) .061 Cubic inchesMetric tons (Mg) 1.102 TonsMeters 3.28 FeetCubic meter (m3) 35.3 Cubic feetSquare meters per hectare (m2/ha) 4.36 Square feet per acreKilopascal (kPa) .145 Pounds per square inchGrams (g) .0022 PoundsMegagram per cubic meter (Mg/m3) 62.43 Pounds per cubic footGram per cubic centimeter (g/cm3) 62.43 Pounds per cubic foot
Allbrook, R.F. 1986. Effect of skid trail compaction on volcanic soil in central Oregon. Soil Science Society of America Journal. 50: 1344–1346.
Blake, G.R.; Hartge, K.H. 1986. Bulk density. In: Klute, A., ed. Methods of soil analysis. Part 1: Physical and mineralogical properties. 2nd ed. Madison, WI: American Society of Agronomy: 363–375.
Bradford, J.M. 1986. Penetrability. In: Klute, A., ed. Methods of soil analysis. Part 1: Physical and mineralogical properties. 2nd ed. Madison, WI: American Society of Agronomy: 463–478.
Camp, A. 2002. Damage to residual trees by four mechanized harvest systems operating in small-diameter, mixed-conifer forests on steep slopes in northeastern Washington: a case study. Western Journal of Applied Forestry. 17(1): 14–22.
Clayton, J.L. 1990. Soil disturbance resulting from skidding logs on granitic soils in central Idaho. Res. Pap. INT-436. Ogden, UT: U.S. Department of Agriculture, Forest Service, Intermountain Research Station. 8 p.
Clayton, J.L.; Kellogg, G.; Forrester, N. 1987. Soil disturbance-tree growth relations in central Idaho clearcuts. Res. Note INT-327. Ogden, UT: U.S. Department of Agriculture, Forest Service, Intermountain Research Station. 6 p.
Cochran, P.H.; Brock, T. 1985. Soil compaction and initial height growth of planted ponderosa pine. Res. Note PNW-434. Portland, OR: U.S. Department of Agriculture, Forest Service, Pacific Northwest Forest and Range Experiment Station. 4 p.
Cromack, K., Jr.; Swanson, F.J.; Grier, C.C. 1979. A comparison of harvesting methods and their impact on soils and environment in the Pacific Northwest. In: Youngberg, C.T., ed. Forest soils and land use: proceedings of the fifth North American forest soils conference. Fort Collins, CO: Colorado State University, Department of Forest and Wood Science: 449–476.
Cullen, S.J.; Montagne, C.; Ferguson, H. 1991. Timber harvest trafficking and soil compaction in western Montana. Soil Science Society of America Journal. 55: 1416–1421.
Literature Cited
English Equivalents
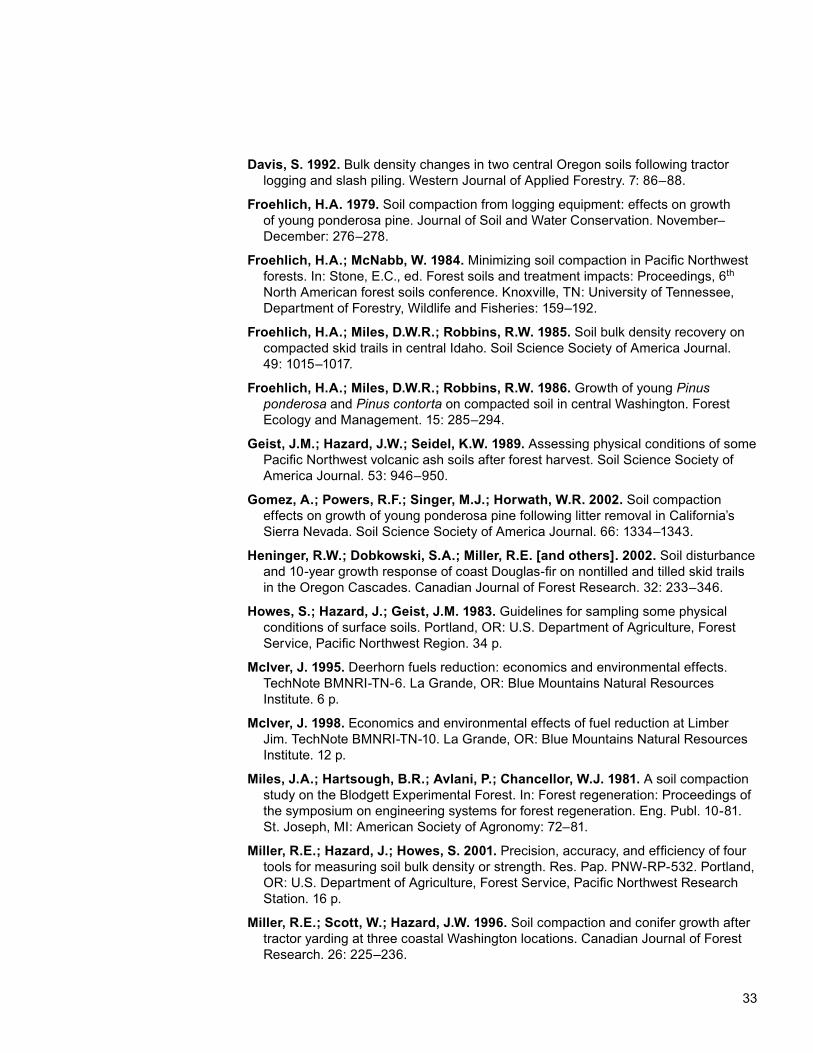
32 33
Davis, S. 1992. Bulk density changes in two central Oregon soils following tractor logging and slash piling. Western Journal of Applied Forestry. 7: 86–88.
Froehlich, H.A. 1979. Soil compaction from logging equipment: effects on growth of young ponderosa pine. Journal of Soil and Water Conservation. November–December: 276–278.
Froehlich, H.A.; McNabb, W. 1984. Minimizing soil compaction in Pacific Northwest forests. In: Stone, E.C., ed. Forest soils and treatment impacts: Proceedings, 6th North American forest soils conference. Knoxville, TN: University of Tennessee, Department of Forestry, Wildlife and Fisheries: 159–192.
Froehlich, H.A.; Miles, D.W.R.; Robbins, R.W. 1985. Soil bulk density recovery on compacted skid trails in central Idaho. Soil Science Society of America Journal. 49: 1015–1017.
Froehlich, H.A.; Miles, D.W.R.; Robbins, R.W. 1986. Growth of young Pinus ponderosa and Pinus contorta on compacted soil in central Washington. Forest Ecology and Management. 15: 285–294.
Geist, J.M.; Hazard, J.W.; Seidel, K.W. 1989. Assessing physical conditions of some Pacific Northwest volcanic ash soils after forest harvest. Soil Science Society of America Journal. 53: 946–950.
Gomez, A.; Powers, R.F.; Singer, M.J.; Horwath, W.R. 2002. Soil compaction effects on growth of young ponderosa pine following litter removal in California’s Sierra Nevada. Soil Science Society of America Journal. 66: 1334–1343.
Heninger, R.W.; Dobkowski, S.A.; Miller, R.E. [and others]. 2002. Soil disturbance and 10-year growth response of coast Douglas-fir on nontilled and tilled skid trails in the Oregon Cascades. Canadian Journal of Forest Research. 32: 233–346.
Howes, S.; Hazard, J.; Geist, J.M. 1983. Guidelines for sampling some physical conditions of surface soils. Portland, OR: U.S. Department of Agriculture, Forest Service, Pacific Northwest Region. 34 p.
McIver, J. 1995. Deerhorn fuels reduction: economics and environmental effects. TechNote BMNRI-TN-6. La Grande, OR: Blue Mountains Natural Resources Institute. 6 p.
Mclver, J. 1998. Economics and environmental effects of fuel reduction at Limber Jim. TechNote BMNRI-TN-10. La Grande, OR: Blue Mountains Natural Resources Institute. 12 p.
Miles, J.A.; Hartsough, B.R.; Avlani, P.; Chancellor, W.J. 1981. A soil compaction study on the Blodgett Experimental Forest. In: Forest regeneration: Proceedings of the symposium on engineering systems for forest regeneration. Eng. Publ. 10-81. St. Joseph, MI: American Society of Agronomy: 72–81.
Miller, R.E.; Hazard, J.; Howes, S. 2001. Precision, accuracy, and efficiency of four tools for measuring soil bulk density or strength. Res. Pap. PNW-RP-532. Portland, OR: U.S. Department of Agriculture, Forest Service, Pacific Northwest Research Station. 16 p.
Miller, R.E.; Scott, W.; Hazard, J.W. 1996. Soil compaction and conifer growth after tractor yarding at three coastal Washington locations. Canadian Journal of Forest Research. 26: 225–236.

34 35
Powers, R.F.; Alban, D.H.; Miller, R.E. [and others]. 1990. Sustaining site productivity in North American forests: problems and prospects. In: Gessel, S.P.; Lacate, D.S.; Wheetman, G.F. [and others], eds. Sustained productivity of forest soils: Proceedings, 7th North American forest soils conference. Vancouver, BC: University of British Columbia, Faculty of Forestry Publications: 49–79.
Powers, R.F.; Fiddler, G.O. 1997. The North American long-term soil productivity study: progress through the first 5 years. In: Proceedings, 18th annual forest vegetation management conference. Redding, CA: Forest Vegetation Management Conference: 88–102.
Powers, R.F.; Tiarks, A.E.; Boyle, J.R. 1999. Assessing soil quality: practicable standards for sustainable forest productivity in the United States. In: Davidson, E., ed. The contribution of soil science to the development of and implementation of criteria and indicators of sustainable forest management. Soil Science Society of America Journal. Special Publ. 53: 53–80.
Rimik Agricultural Electronics. 1994. Rimik CP 20 cone penetrometer, hardware instruction manual. Toowoomba, Queensland, Australia: Agridry Rimick PTY LT. [Not paged].
Sands, R.; Greacen, E.L.; Gerard, C.J. 1979. Compaction of sandy soils in radiata pine forests. I: A penetrometer study. Australian Journal of Soil Research. 17: 101–103.
Senyk, J.P. 2001. Tree growth on displaced and compacted soils. Tech. Transfer Note 26. Victoria, BC: Canadian Forest Service, Pacific Forestry Centre. 6 p.
Senyk, J.P.; Craigdallie, D. 1997. Ground-based wet weather yarding operations in coastal British Columbia: effects on soil properties and seedling growth. Inf. Rep. BC-X-372. Victoria, BC: Canadian Forest Service, Pacific Forestry Centre. 29 p.
Smith, R.B.; Wass, E.F. 1979. Tree growth on and adjacent to contour skidroads in the subalpine zone, southeastern British Columbia. Rep. BC-R-2. Victoria, BC: Canadian Forest Service, Pacific Forestry Research Centre. 26 p.
Smith, R.B.; Wass, E.F. 1980. Tree growth on skidroads on steep slopes logged after wildfires in central and southeastern British Columbia. Inf. Rep. BC-R-6. Victoria, BC: Canadian Forest Service, Pacific Forestry Research Centre. 28 p.
Snider, M.D.; Miller, R.F. 1985. Effects of tractor logging on soils and vegetation in eastern Oregon. Soil Science Society of America Journal. 49: 1280–1282.
Soil Science Society of America. 1997. Glossary of soil science terms. Madison, WI: Soil Science Society of America. 234 p.
Sullivan, T.E. 1988. Monitoring soil physical conditions on a national forest in eastern Oregon: a case study. In: Lawson, T., tech. coord. Proceedings of the Alaska forest soil productivity workshop. Gen. Tech. Rep. PNW-GTR-219. Portland, OR: U.S. Department of Agriculture, Forest Service, Pacific Northwest Research Station: 69–76.
Tepp, J.S. 2002. Assessing visual soil disturbance on eight commercially thinned sites in northeastern Washington. Res. Note PNW-RN-535. Portland, OR: U.S. Department of Agriculture, Forest Service, Pacific Northwest Research Station. 15 p.

34 35
Thompson, P.J.; Jansen, I.J.; Hooks, C.L. 1987. Penetrometer resistance and bulk density as parameters for predicting root system performance in mine soils. Soil Science Society of America. 51: 1288-1293.
U.S. Department of Agriculture, Forest Service. 1996. Forest Service Manual 2520.2-.3, Region 6 Supplement 2500-96-1, effective June 4, 1996. Portland, OR: Pacific Northwest Region. 10 p.
U.S. Department of Agriculture, Forest Service. 1998. Forest Service Manual 2520.2-.3, Region 6 Supplement 2500-96-1, effective August 24, 1998. Portland, OR: Pacific Northwest Region. 6 p.
Vazquez, L.; Myhre, D.L.; Hanlon, E.A.; Gallagher, R.N. 1991. Soil penetrometer resistance and bulk density relationships after long-term no tillage. Communications in Soil Science and Plant Analysis. 22(19, 20): 2101–2117.
Warkotsch, P.W.; van Huyssteen, L.; Olsen, G.J. 1994. Identification and quantification of soil compaction due to various harvesting methods—a case study. Suid-Afrikaanse Bosboutydskrif nr. 170(September): 7–15.
Wert, S.; Thomas, B.R. 1981. Effects of skid roads on diameter, height, and volume growth in Douglas-fir. Soil Science Society of America Journal. 45: 629–632.
Whalley, W.R.; Dumitru, E.; Dexter, A.R. 1995. Biological effects of soil compaction. Soil and Tillage Research. 35: 53–58.
Youngblood, A. 2000. Damage to residual trees and advance regeneration from skyline and forwarder yarding in mixed-conifer stands of northeastern Oregon. Western Journal of Applied Forestry. 15(2): 101–107.
Zulauf, A.; Starr, W.A. 1979. Soil survey of North Ferry area, Washington, parts of Ferry and Stevens Counties. [Place of publication unknown.]: U.S. Department of Agriculture, Soil Conservation Service; Forest Service; Washington Agricultural Experiment Station. 121 p. and 73 maps.

The Forest Service of the U.S. Department of Agriculture is dedicated to the principle of multiple use management of the Nation’s forest resources for sustained yields of wood, water, forage, wildlife, and recreation. Through forestry research, cooperation with the States and private forest owners, and management of the National Forests and National Grasslands, it strives—as directed by Congress—to provide increasingly greater service to a growing Nation.
The U.S. Department of Agriculture (USDA) prohibits discrimination in all its programs and activities on the basis of race, color, national origin, gender, religion, age, disability, political beliefs, sexual orientation, or marital or family status. (Not all prohibited bases apply to all programs.) Persons with disabilities who require alternative means for communication of program information (Braille, large print, audiotape, etc.) should contact USDA’s TARGET Center at (202) 720-2600 (voice and TDD).
To file a complaint of discrimination, write USDA, Director, Office of Civil Rights, Room 326-W, Whitten Building, 14th and Independence Avenue, SW, Washington, DC 20250-9410 or call (202) 720-5964 (voice and TDD). USDA is an equal opportunity provider and employer.
Pacific Northwest Research Station
Web site http://www.fs.fed.us/pnwTelephone (503) 808-2592Publication requests (503) 808-2138FAX (503) 808-2130E-mail [email protected] address Publications Distribution Pacific Northwest Research Station P.O. Box 3890 Portland, OR 97208-3890

U.S. Department of AgriculturePacific Northwest Research Station333 SW First AvenueP.O. Box 3890Portland, OR 97208-3890
Official BusinessPenalty for Private Use, $300