building and calibrating the new bellevue water system · pdf filebuilding and calibrating the...
TRANSCRIPT

Building and Calibrating the New Bellevue Water System Model
Ed Wicklein Carollo Engineers
&C
alib
ratio
n.pp
Ed Wicklein, Carollo EngineersDoug Lane, City of Bellevue
Aurelie Nabonnand Carollo Engineers
vue\
Mod
el_D
evel
opm
ent Aurelie Nabonnand, Carollo Engineers
PNWS - AWWA
PW
:\\C
lient
s\W
A\B
elle
vtx
May 1, 2015

City of Bellevue Service Area
• 2014 population p p140,000+ (~180,000 by 2040)2014 l t• 2014 employment 136,000+ (~214,000 by 2040)
&C
alib
ratio
n.pp
• Bellevue plus portions of 7 other municipalities
vue\
Mod
el_D
evel
opm
ent
• Regional Supply (SPU)
PW
:\\C
lient
s\W
A\B
elle
vtx
2
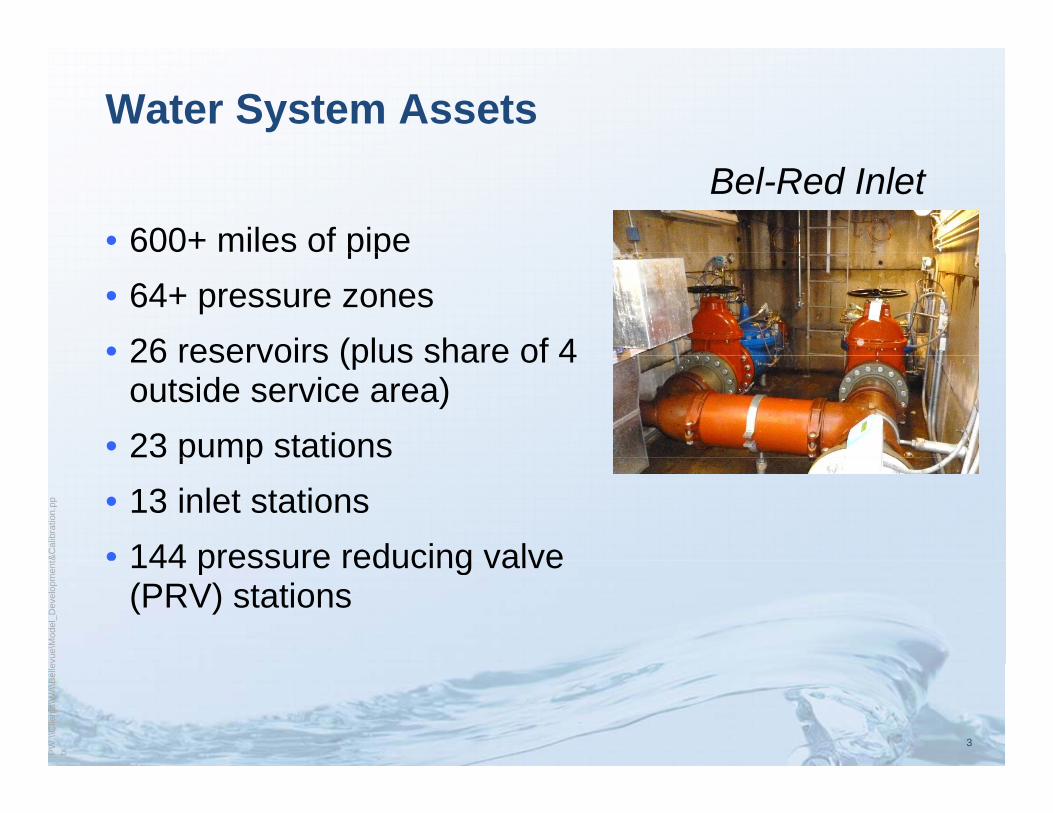
Water System Assets
• 600+ miles of pipe
Bel-Red Inletp p
• 64+ pressure zones• 26 reservoirs (plus share of 426 reservoirs (plus share of 4
outside service area)• 23 pump stations
&C
alib
ratio
n.pp
p p• 13 inlet stations• 144 pressure reducing valve
vue\
Mod
el_D
evel
opm
ent 144 pressure reducing valve
(PRV) stations
PW
:\\C
lient
s\W
A\B
elle
vtx
3

Bellevue Previously Used EPA-NET for Hydraulic AnalysisHydraulic Analysis
• Model results did not• Model results did not match field
• Manual iteration of each fire flow location
• Limited model biliti
&C
alib
ratio
n.pp
capabilities
vue\
Mod
el_D
evel
opm
ent
PW
:\\C
lient
s\W
A\B
elle
vtx
4

The City Needs an Integrated “all-pipe” Model of SystemModel of System
• East model previously p ydeveloped
• New models for West and S thSouth:
– Should be easily maintainable East Op AreaEast Op Area
West Op AreaWest Op Area
&C
alib
ratio
n.pp
– Will be used for the ongoing WSP update
– Will be used to aid in
vue\
Mod
el_D
evel
opm
ent Will be used to aid in
proposed redevelopment
South Op AreaSouth Op Area
PW
:\\C
lient
s\W
A\B
elle
vtx
5
Bellevue Provided Existing Data for Model Development of West and SouthModel Development of West and South Operating Areas• EPA-NET models• GIS data on system parts
– Pipes, hydrants, key infrastructure locations
• Operational data
&C
alib
ratio
n.pp
– Pump controls– PRV, altitude valve, and throttle control valve settings
T k i f ti
vue\
Mod
el_D
evel
opm
ent – Tank information
• Existing demands by customer meter
PW
:\\C
lient
s\W
A\B
elle
vtx
6

Bellevue Collected New Data for Model DevelopmentDevelopment
• Hydrants tests, including PRV conditions for many of y , g ythe tests
• Static long-term pressure fluctuations• The city conducted winter and summer diurnal
pattern studies for 6 customer classes
&C
alib
ratio
n.pp
– Hotels, schools, retail, commercial, single-family residential, multi-family residential
vue\
Mod
el_D
evel
opm
ent
PW
:\\C
lient
s\W
A\B
elle
vtx
7

Custom Diurnal Patterns For Customer ClassesClasses
Single-Family ResidentialSingle-Family Residential Multi-Family ResidentialMulti-Family Residential
Commercial / RetailCommercial / Retail HotelsHotels
&C
alib
ratio
n.pp
vue\
Mod
el_D
evel
opm
ent
SchoolsSchools
PW
:\\C
lient
s\W
A\B
elle
vtx
8
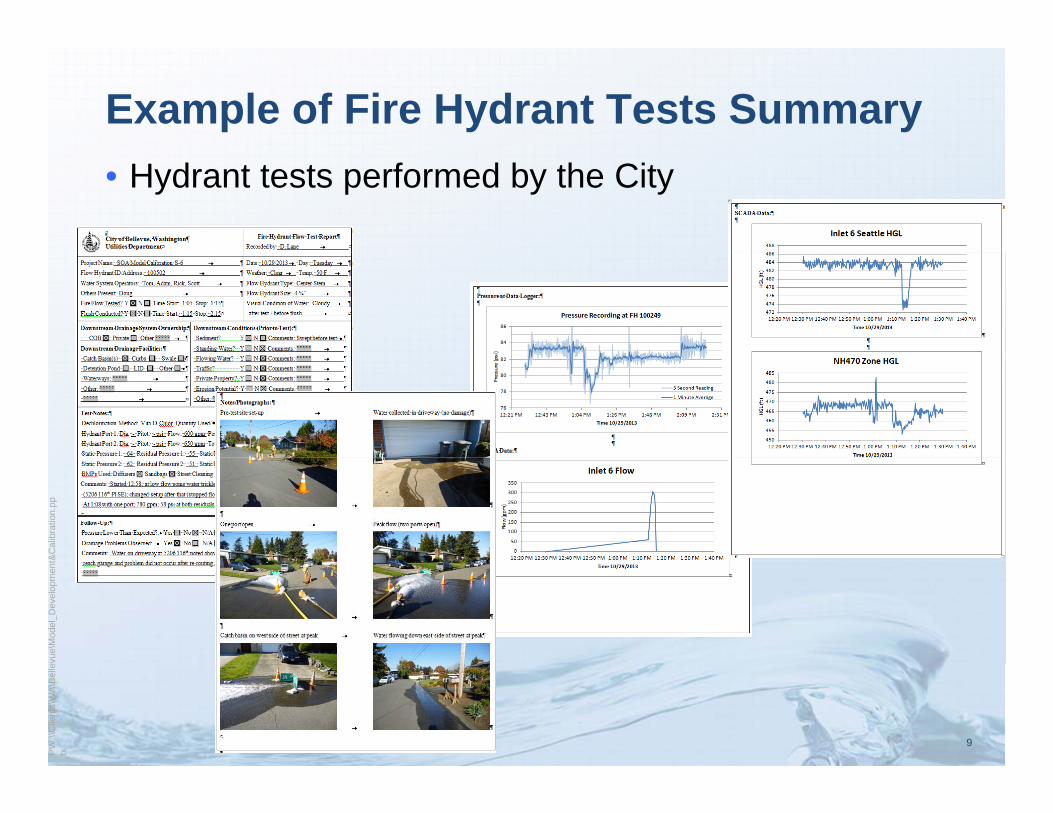
Example of Fire Hydrant Tests Summary• Hydrant tests performed by the City
&C
alib
ratio
n.pp
vue\
Mod
el_D
evel
opm
ent
PW
:\\C
lient
s\W
A\B
elle
vtx
9

GIS Cleaned, Organized and Formatted• Junctions created, elevation from 2-foot contours• Piping connectivity checked
Example of Data compared with as-builts
&C
alib
ratio
n.pp
connectivity issuesp
vue\
Mod
el_D
evel
opm
ent
Initial GIS DataInitial GIS Data
PW
:\\C
lient
s\W
A\B
elle
vtx
10Formatted GIS data imported in InfoWaterFormatted GIS data imported in InfoWater

Site Configurations Added
• Pump stations, reservoirs, inlets, and interties from fsite configuration drawings and as-built drawing
Example: MeydenbauerInitial GIS DataInitial GIS Data
&C
alib
ratio
n.pp
vue\
Mod
el_D
evel
opm
ent
City InputCity Input
PW
:\\C
lient
s\W
A\B
elle
vtx
11Model ConfigurationModel Configuration
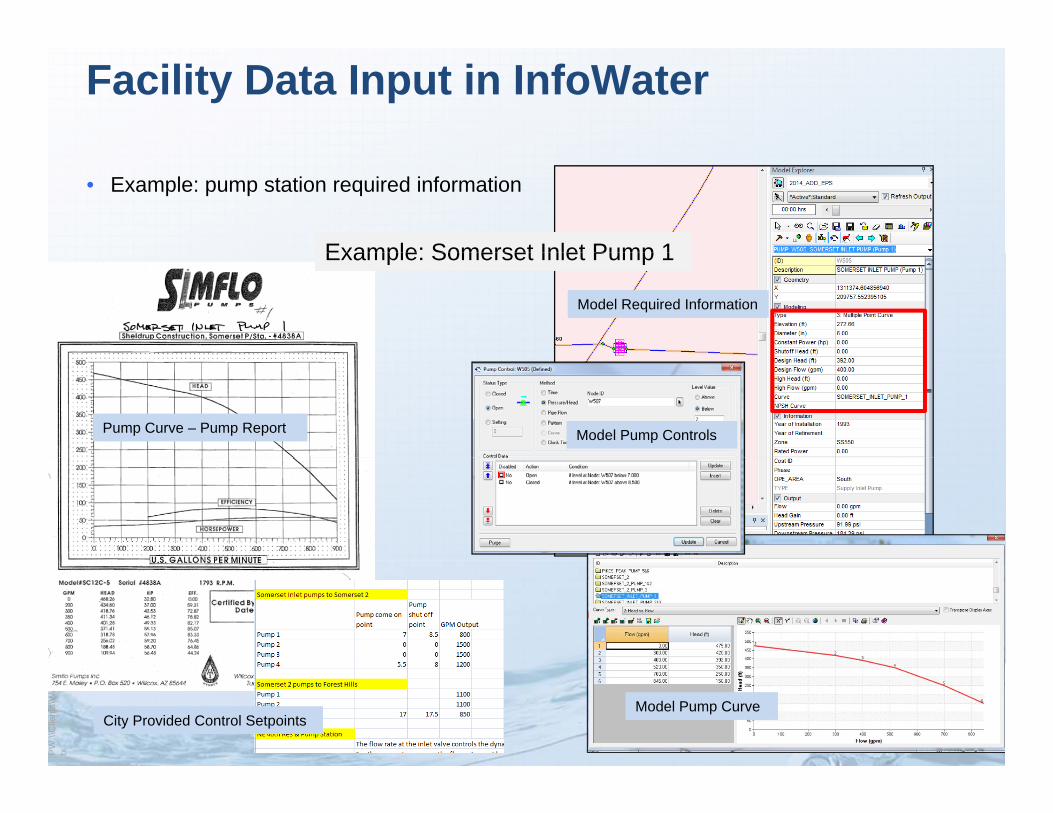
Facility Data Input in InfoWater
• Example: pump station required information
Example: Somerset Inlet Pump 1Example: Somerset Inlet Pump 1Example: Somerset Inlet Pump 1Example: Somerset Inlet Pump 1
Model Required InformationModel Required Information
Pump Curve – Pump Report Pump Curve – Pump Report Model Pump ControlsModel Pump Controls
&C
alib
ratio
n.pp
vue\
Mod
el_D
evel
opm
ent
PW
:\\C
lient
s\W
A\B
elle
vtx
12
City Provided Control SetpointsCity Provided Control SetpointsModel Pump CurveModel Pump Curve

Model LoadingD d di i GIS d ll ti• Demand geocoding in GIS and allocation
• Demands provided by parcel land use type and allocated to the nearest model junction in the appropriate pressure zone
– Demands are actual current demands– City input necessary to determine which zone to allocate the parcel to for
certain areasExample parcel where it is unclear which pressure zone it serves
Example parcel where it is unclear which pressure zone it serves
&C
alib
ratio
n.pp
vue\
Mod
el_D
evel
opm
ent
PW
:\\C
lient
s\W
A\B
elle
vtx
13
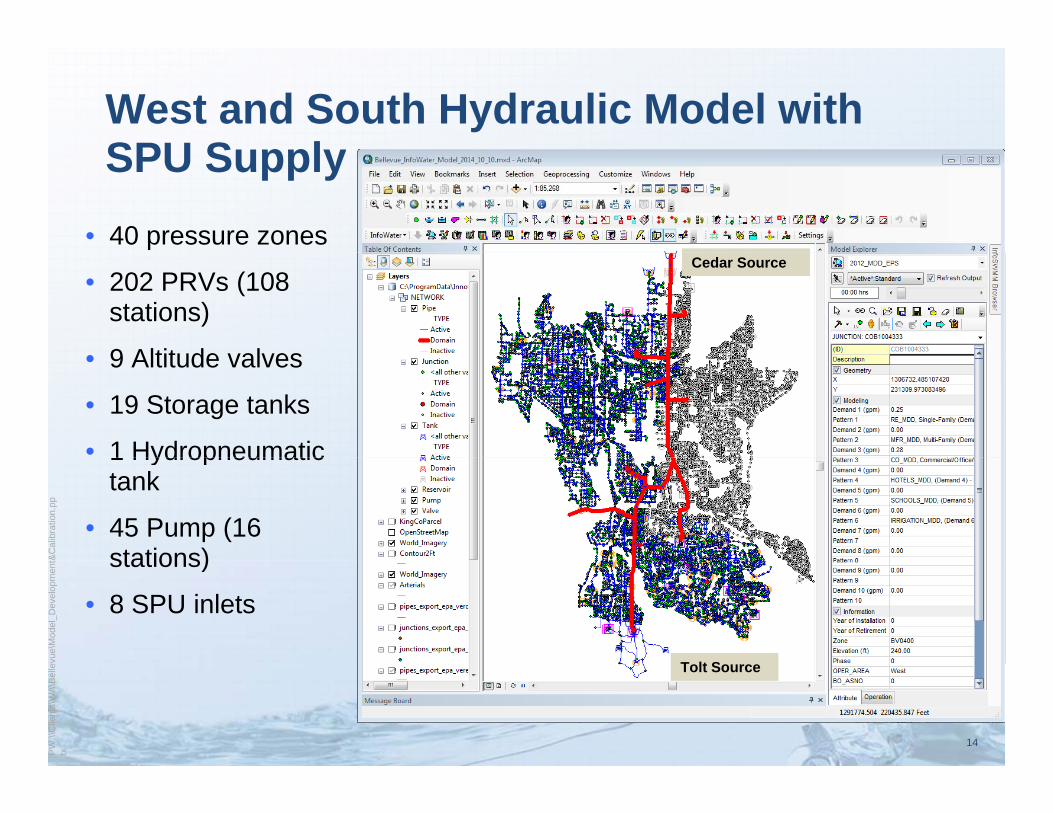
West and South Hydraulic Model with SPU SupplySPU Supply
• 40 pressure zonesCedar SourceCedar Source
• 202 PRVs (108 stations)
• 9 Altitude valves• 9 Altitude valves
• 19 Storage tanks
• 1 Hydropneumatic
&C
alib
ratio
n.pp
1 Hydropneumatictank
• 45 Pump (16 stations)
vue\
Mod
el_D
evel
opm
ent
T lt ST lt S
stations)
• 8 SPU inlets
PW
:\\C
lient
s\W
A\B
elle
vtx
14
Tolt SourceTolt Source

Initial Model Checks
• System pressures comparison used to locate major errors in model creation
• Facility characteristics from pumps, sources, valves were used to identify problems in system operations
&C
alib
ratio
n.pp Model ready
for CalibrationModel ready for Calibration
vue\
Mod
el_D
evel
opm
ent
PW
:\\C
lient
s\W
A\B
elle
vtx
15
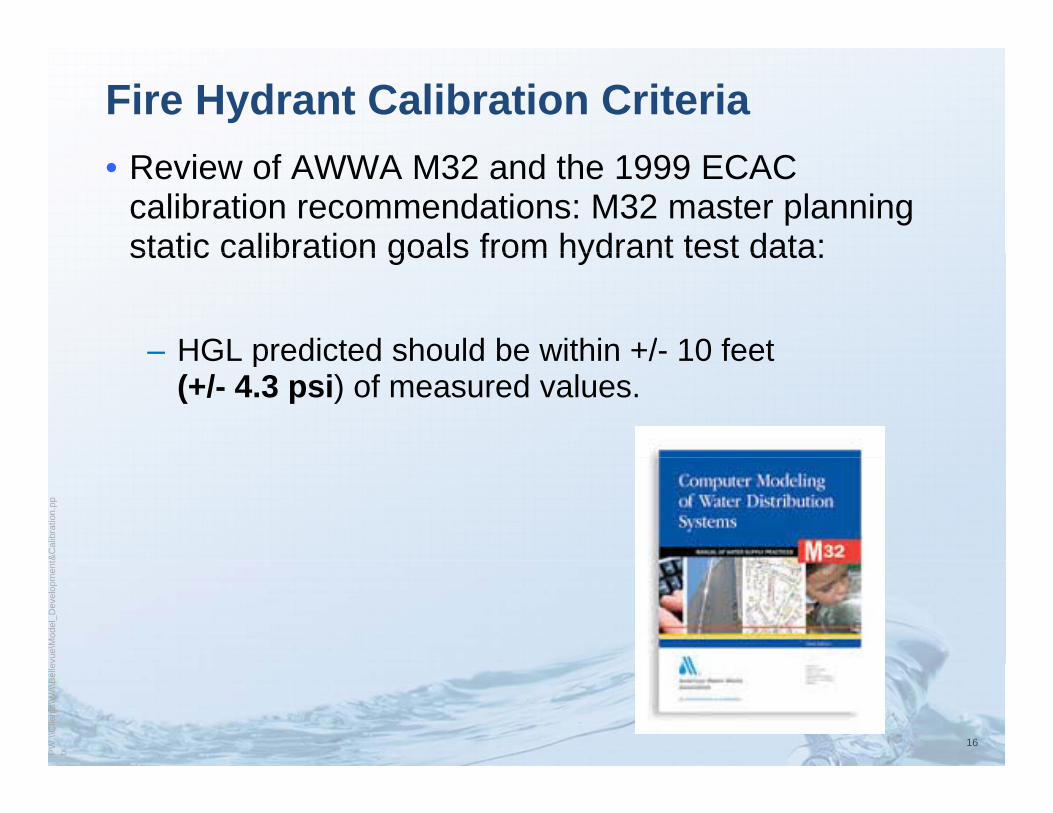
Fire Hydrant Calibration Criteria• Review of AWWA M32 and the 1999 ECAC
calibration recommendations: M32 master planning static calibration goals from hydrant test data:static calibration goals from hydrant test data:
– HGL predicted should be within +/- 10 feetHGL predicted should be within +/ 10 feet (+/- 4.3 psi) of measured values.
&C
alib
ratio
n.pp
vue\
Mod
el_D
evel
opm
ent
PW
:\\C
lient
s\W
A\B
elle
vtx
16

Model Calibration With Field Data
• 70 hydrant testsy• Numerous residual
pressure recorders• SCADA telemetry
&C
alib
ratio
n.pp
vue\
Mod
el_D
evel
opm
ent
PW
:\\C
lient
s\W
A\B
elle
vtx
17
17
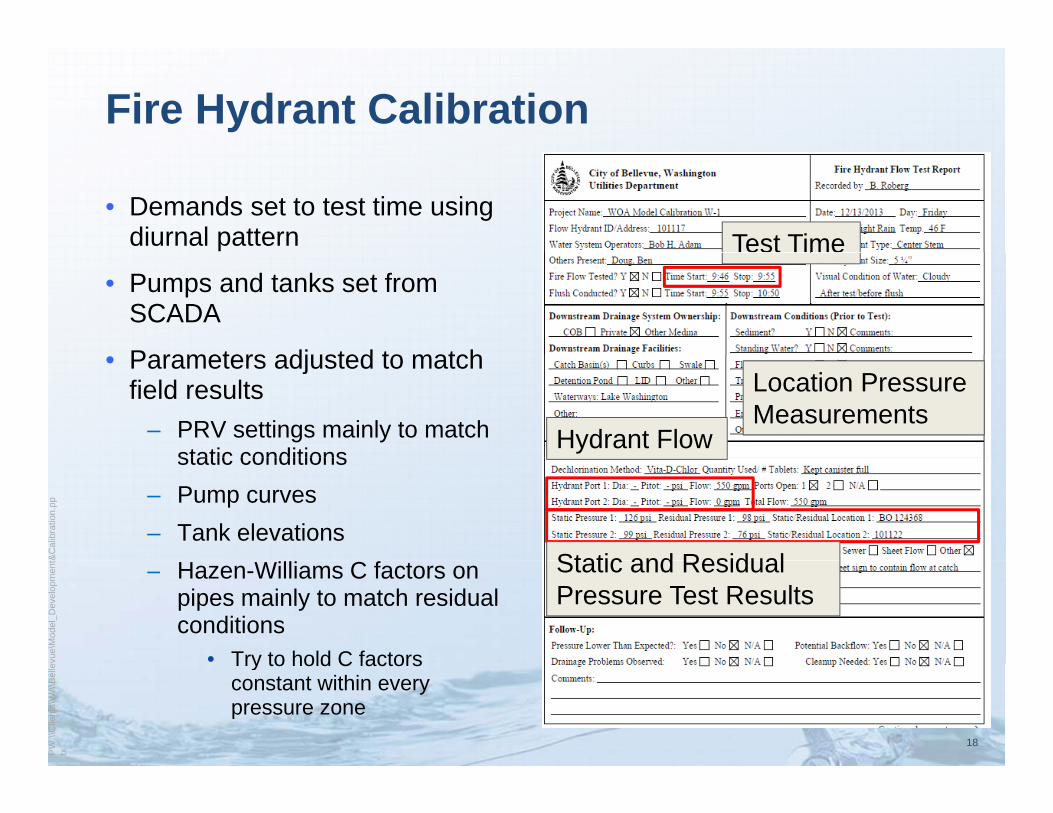
Fire Hydrant Calibration
• Demands set to test time using diurnal pattern Test Time
• Pumps and tanks set from SCADA
Parameters adjusted to match• Parameters adjusted to match field results
– PRV settings mainly to match static conditions
Hydrant Flow
Location Pressure Measurements
&C
alib
ratio
n.pp
static conditions– Pump curves– Tank elevations
Static and Residual
vue\
Mod
el_D
evel
opm
ent – Hazen-Williams C factors on
pipes mainly to match residual conditions
• Try to hold C factors
Static and Residual Pressure Test Results
PW
:\\C
lient
s\W
A\B
elle
vtx
18
Try to hold C factors constant within every pressure zone
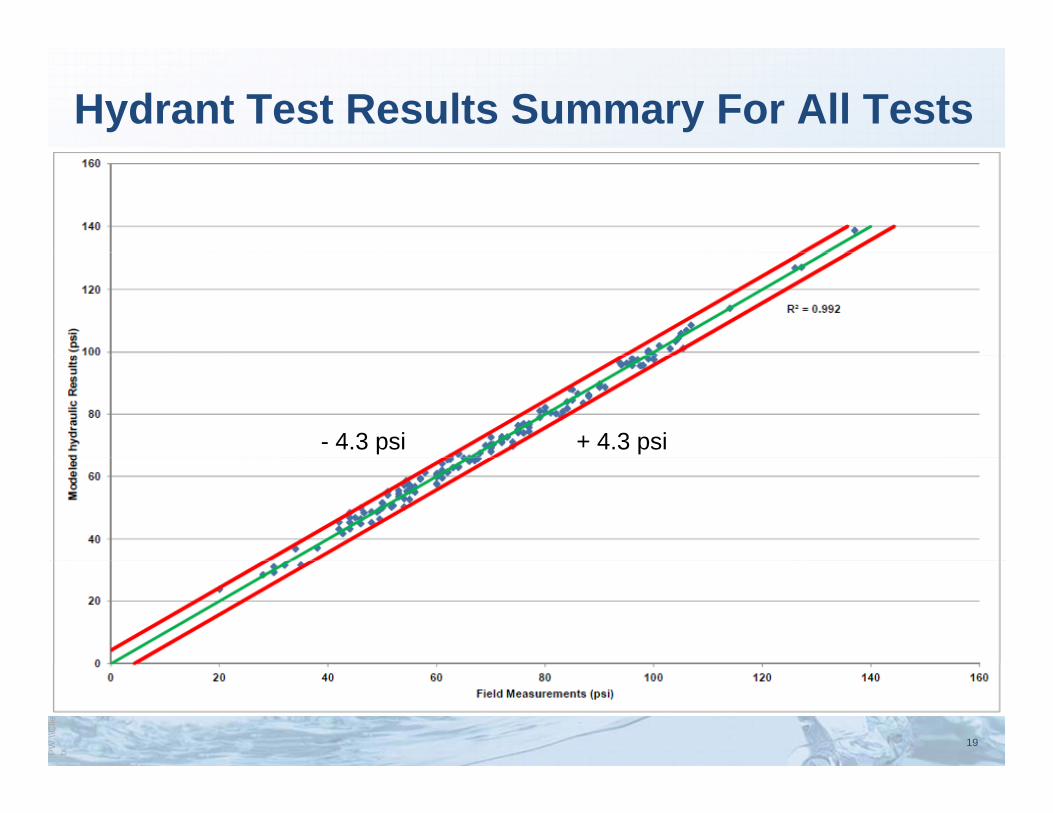
Hydrant Test Results Summary For All Tests
+ 4.3 psi- 4.3 psi
&C
alib
ratio
n.pp
vue\
Mod
el_D
evel
opm
ent
PW
:\\C
lient
s\W
A\B
elle
vtx
19
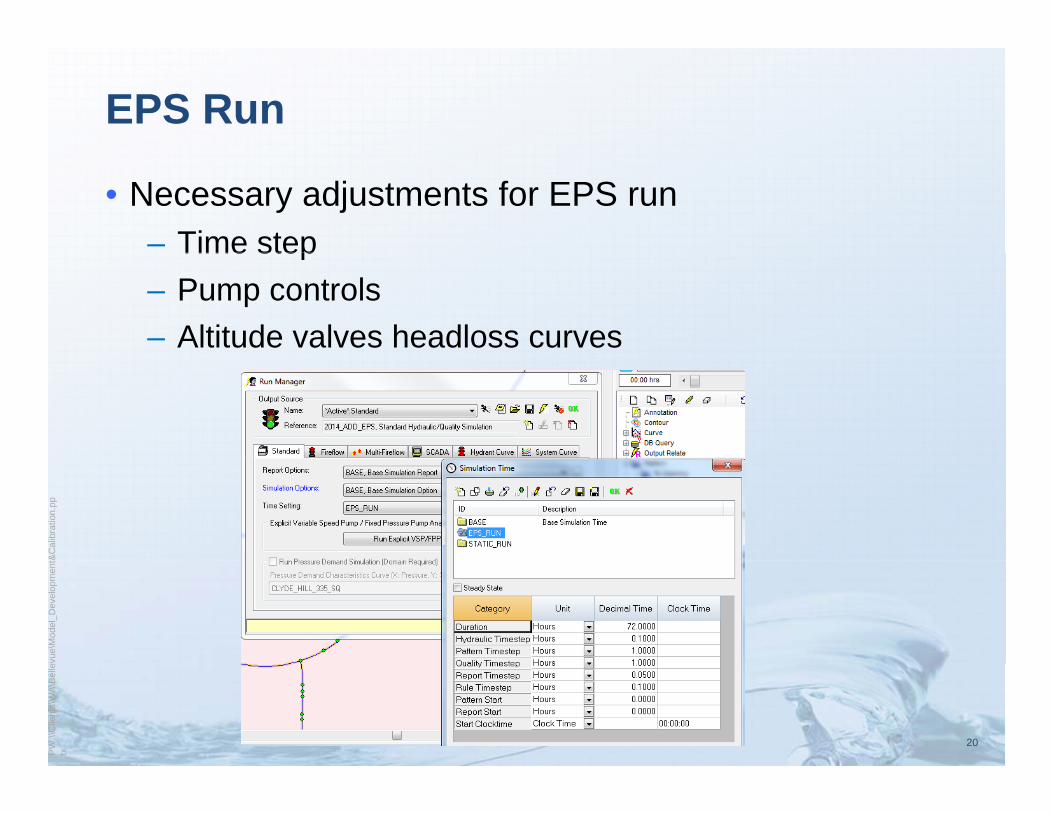
EPS Run
• Necessary adjustments for EPS run– Time stepTime step– Pump controls– Altitude valves headloss curves
&C
alib
ratio
n.pp
vue\
Mod
el_D
evel
opm
ent
PW
:\\C
lient
s\W
A\B
elle
vtx
20
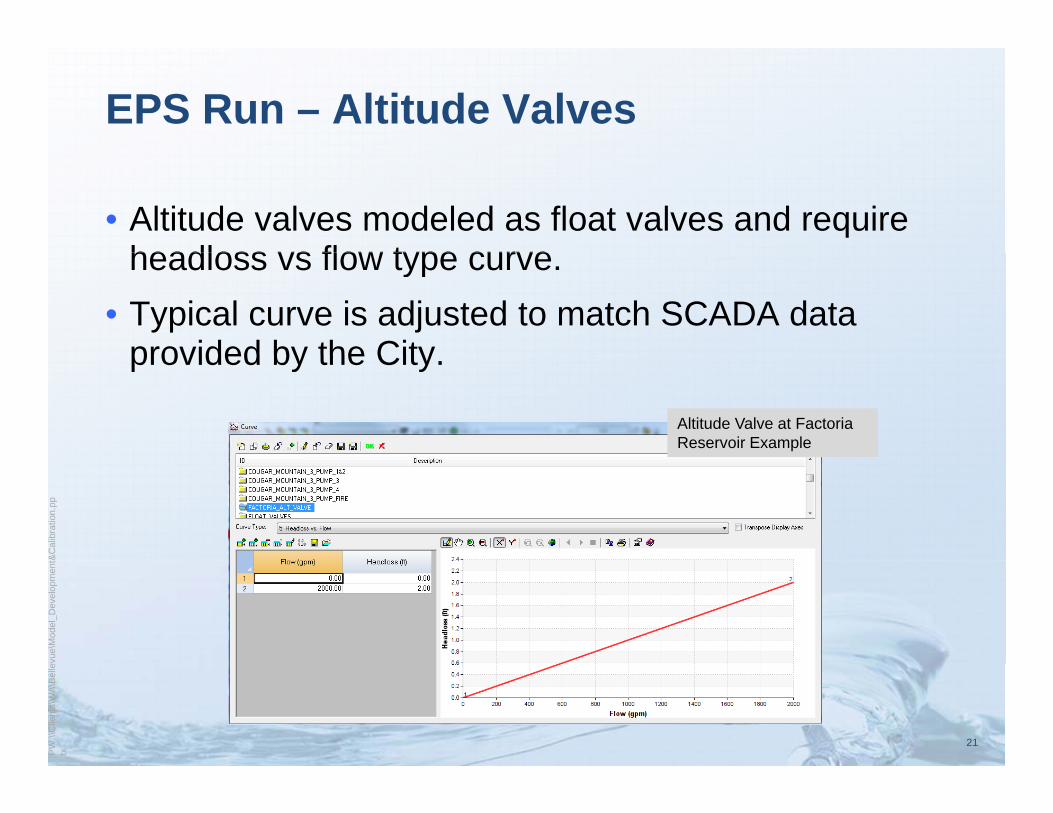
EPS Run – Altitude Valves
• Altitude valves modeled as float valves and require headloss vs flow type curveheadloss vs flow type curve.
• Typical curve is adjusted to match SCADA data provided by the Cityprovided by the City.
Altitude Valve at Factoria Reservoir ExampleAltitude Valve at Factoria Reservoir Example
&C
alib
ratio
n.pp
vue\
Mod
el_D
evel
opm
ent
PW
:\\C
lient
s\W
A\B
elle
vtx
21
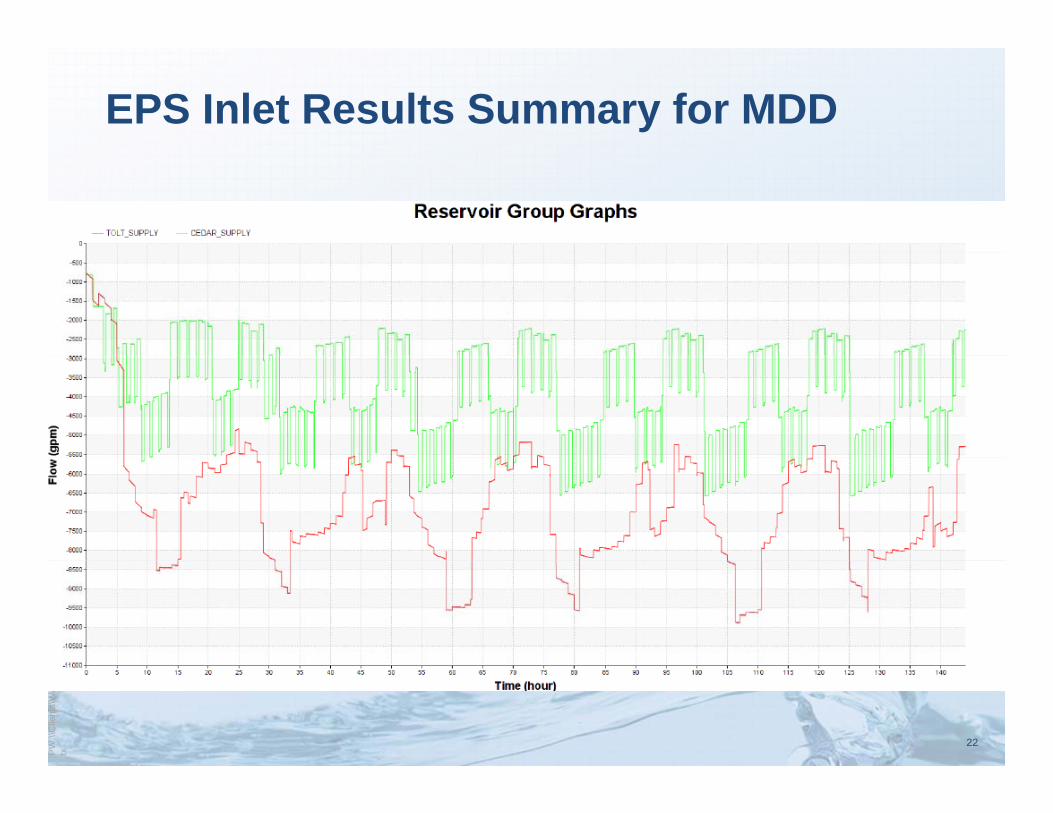
EPS Inlet Results Summary for MDD&
Cal
ibra
tion.
ppvu
e\M
odel
_Dev
elop
men
tP
W:\\
Clie
nts\
WA
\Bel
lev
tx 22

EPS Tank Results Summary for MDD&
Cal
ibra
tion.
ppvu
e\M
odel
_Dev
elop
men
tP
W:\\
Clie
nts\
WA
\Bel
lev
tx 23

Subsequent work by the City
• Continual updatesp• Added East Operating
Area (now entire system)
• Automatic fire flow l i ( ll 6 000
&C
alib
ratio
n.pp
analysis (all 6,000 hydrants at once)
• Water age mapping
vue\
Mod
el_D
evel
opm
ent • Water age mapping
• What-ifs and alternatives analysis S
PW
:\\C
lient
s\W
A\B
elle
vtx
24
alternatives analysis System-Wide Water Age Simulation

Model Development Summary
• A new all pipes integrated model was developed for p p g pBellevue's water service area
• The model is well calibrated for static and EPS making it a good tool for:
– Fire flow analysesS i
&C
alib
ratio
n.pp
– System operations– Future projections
Water quality
vue\
Mod
el_D
evel
opm
ent – Water quality
PW
:\\C
lient
s\W
A\B
elle
vtx
25
Questions on Building and Calibrating the New BellevueCalibrating the New Bellevue
Water System Model
&C
alib
ratio
n.pp
[email protected]@bellevuewa.gov
vue\
Mod
el_D
evel
opm
ent
@ gPNWS - AWWA
May 1 2015
PW
:\\C
lient
s\W
A\B
elle
vtx
May 1, 2015