building an integrated transport network
TRANSCRIPT

BUILDING AN INTEGRATED TRANSPORT NETWORK
ACTIVE TRAVEL

ISBN: 978-1-921117-38-1
© Australian Capital Territory, Canberra 2015
This work is copyright. Apart from any use as permitted under the Copyright Act 1968, no part may be reproduced by any process without written permission from: Director-General, Environment and Planning Directorate, ACT Government, GPO Box 158, Canberra, ACT 2601.
Telephone: 02 6207 1923 Website: www.planning.act.gov.au Printed on recycled paper
ACCESSIBILITY The ACT Government is committed to making its information, services, events and venues as accessible as possible.
If you have difficulty reading a standard printed document and would like to receive this publication in an alternative format, such as large print, please phone Canberra Connect on 13 22 81 or email the Environment and Planning Directorate at [email protected]
If English is not your first language and you require a translating and interpreting service, please phone 13 14 50.
If you are deaf, or have a speech or hearing impairment, and need the teletypewriter service, please phone 13 36 77 and ask for Canberra Connect on 13 22 81.

iii
ACTIVE TRAVEL
Message from the Minister
‘The ACT Government is committed to supporting a healthy, active and productive community. Active travel (walking and cycling) is increasingly recognised as a key feature of the world’s best cities. The exercise from a walk to the shops, the social benefits from meeting people on the streets and the economic benefits from active travel have been demonstrated in other Australian cities.’
ACT Government — Transport for Canberra
With its beautiful vistas, great path network and relatively flat topography, it’s no wonder Canberra has one of the highest participation rates in walking and cycling of the major Australian cities. However, we can do better.
In cities around the world, integrated transport networks shape the way cities grow and prosper, generating economic opportunities and jobs, and providing vibrant and attractive social environments for residents and visitors.
Building an Integrated Transport Network – Active Travel outlines how the government can better integrate planning and delivery of active travel initiatives to further encourage and support walking, cycling and riding as a part of Canberra’s overall urban planning, transport, health, environment and education systems.
Active travel is an important component of developing an Integrated Transport Network for Canberra. This network includes all transport modes (walking, cycling, public transport, roads, freight, vehicles), and is part of delivering on key government policies including Transport for Canberra, the ACT Planning Strategy and Action Plan 2 (ACT Climate Change Strategy), the City Plan and other master plans, and the Healthy Weight Action Plan.
I encourage you to utilise the Active Travel Framework in your work and activities to make it even easier to include active travel in your daily activities. Active travel is walking, cycling or any other mode of ‘human-propelled’ transport. It has multiple benefits for individuals and the environment and cuts across key ACT Government policies to do with health, transport, urban planning and the environment.
Good urban planning shapes our neighbourhoods to encourage people to walk, cycle and ride for recreation and social interaction. It provides options for people to walk, cycle, ride and catch public transport to destinations such as school, work and shops. As we encourage urban renewal and develop new suburbs, we will be able to further embed active living principles into the city and lives of its residents.1
Canberra has one of the best walking and cycling path networks in Australia. With your help, we can improve this network and explore other things that can make active travel appealing, be it traffic changes or better end-of-trip facilities.
We would like Canberra to continue to lead the nation as a place where making healthy lifestyle choices is easier and make Canberra Australia’s cycling capital and most walkable city.
Mick Gentleman MLA Minister for Planning May 2015


v
ACTIVE TRAVEL
Contents
Message from the Minister iiiDefinitions vi
1.Executivesummary 11.1 Our targets for active travel 21.2 Our principles for active travel 2
2.Howarewetravellingnow? 42.1 Walking 42.2 Riding a bicycle 72.3 Mode share comparisons 102.4 Walking or cycling as part of accessing public transport 122.5 Road safety 12
3.Buildinganintegratedtransportnetworkandactivetravel 153.1 National policy setting 153.2 ACT policy setting 163.3 Transport for Canberra 163.4 Health 20
4.Barriersandopportunities 234.1 Barriers to active travel 234.2 Benefits of active travel 244.3 Opportunities 25
5.Principles 295.1 Plan 295.2 Deliver 455.3 Encourage 535.4 Manage 55
6.Implementationandfunding 57
7.Appendices 587.1 Appendix A — Active Travel Framework Implementation Table 587.2 Appendix B — Short term funding commitment to improve Active Travel 647.3 Appendix C — Existing policies and resources 66
8.Endnotes 69

vi
BUILDING AN INTEGRATED TRANSPORT NETWORK
DefinitionsFor the purposes of the Active Travel Framework, the following definitions apply:
Accessibility Ability and ease with which people can access places, and social and economic opportunities, within a reasonable time and cost. Includes physical access to public transport, buildings and facilities.
Activetravel Transport for Canberra adopted the term ‘active travel’, which refers to human powered mobility – such as walking, cycling or riding (see definition below).
The focus of this framework is on the use of active travel to access jobs, education, services and social opportunities, as well as for recreational purposes. A public transport journey (by bus, train or light rail) is generally accompanied by a walk, cycle or ride to and from the transport stop.
Densityandlandusemix The intensity of urban development and the range of different uses (such as residential, commercial, institutional or recreational uses) within a locality.2
Mobility Ease with which people can move around, between or within locations.
ModeShare The percentage of people using a particular mode of transport; the ACT has targets to achieve a mode share of 7% by walking, 7% by cycling and 16% by public transport of all journey to work trips by 2026.
Transportsystemsornetworks Includes physical infrastructure (such as roads, rail, footpaths, bike paths) and services (such as bus, train, light rail) that provide transport connections between different locations and activities.
Trip Travel between two points, from an origin to a destination, which may also be a round trip. A trip can involve multiple modes of travel and short stops along the way (for example, to post a letter, buy groceries or pick up a child).
Walking,cyclingandriding When the terms walking, cycling and riding are used in this framework, they generally refer to any form of human powered mobility: walking; using a wheelchair or other personal mobility device; pushing a pram; wheeling luggage; riding a bicycle, e-bike/pedelec, scooter, skateboard, tricycle or rollerblades. They can also refer to horse riding.
Note, however, that bicycles are defined in the Australian Road Rules as vehicles, whereas most other wheeled mobility devices are defined as pedestrians (including motorised wheelchairs powered up to 10 km/h and wheeled recreational devices).
ACTGovernmentCMA Capital Metro Agency
CMTEDD Chief Minister, Treasury and Economic Development Directorate
EPD Environment and Planning Directorate
ETD Education and Training Directorate
HD Health Directorate
JACSD Justice and Community Safety Directorate
TAMSD Territory and Municipal Services Directorate

1
ACTIVE TRAVEL
1. Executive summary
In cities around the world, integrated transport networks shape the way cities grow and prosper, generating economic opportunities and jobs, and providing vibrant and attractive social environments for residents and visitors.
In 2012 the ACT Government released Transport for Canberra, the strategy for transport planning in the ACT to 2031. Transport for Canberra seeks to make active travel part of Canberrans’ daily lives.
The ACT Government is building an integrated transport network through active travel, which aims to increase the proportion of people walking, cycling, riding and accessing public transport; and to improve the safety and convenience of these travel choices across the ACT.
Building an Integrated Transport Network – Active Travel (Active Travel Framework) is part of delivering on key government policies including Transport for Canberra, the ACT Planning Strategy and Action Plan 2 (ACT Climate Change Strategy), the City Plan and other master plans, and the Healthy Weight Action Plan (Figure 1).
Some of the options for improving Canberra’s urban transport network include:
• increasing the number and rate of short trips involving walking, cycling and riding
• removing barriers and obstacles to walking, cycling and riding
• improving access to public transport stops
• increasing the time people spend walking, cycling and riding for recreation and social purposes.
The framework recognises that walking, cycling and riding are essential parts of Canberra’s transport system, with everyone who catches a bus or drives a car having to walk, cycle or ride at least part of the way.
Modern, sedentary lifestyles have resulted in lower rates of physical activity and higher intake of high energy foods; together, they significantly increase the likelihood of people becoming overweight or obese. Developing and promoting active travel is in line with the ACT Government’s Healthy Weight Action Plan, which is about creating environments where making healthy lifestyle choices is easier.
Many people enjoy walking, cycling or riding to local destinations such as their local shops, cafes, post office or library. Others walk or cycle on a daily basis to work or study. Walking, cycling and riding are very popular forms of recreation; a high proportion of Canberrans walk, cycle or ride as part of their daily fitness and social interaction.
Canberra is designed for walking, cycling and riding. The city is relatively flat and has hundreds of kilometres of cycleways including an extensive network of safe off-road bike paths.
Most people live within walking or easy cycling distance of their local shops and school. Key locations that are going through urban renewal to provide higher density living options and mixed-use development, such as Kingston Foreshore, Braddon, New Acton and our town centres, will enable more people to live within walking and cycling distance of work, study, shops, services and places to socialise.
There is much more we can do to ensure our walking and cycling networks provide safe, coherent and direct connections between people and places.
This framework outlines how the government can better integrate planning and delivery of active travel initiatives to further encourage and support walking, cycling and riding as part of Canberra’s overall urban planning, transport, health, environment and education systems.
Walking, cycling and riding – whether for recreation or transport – provide many benefits for individuals, families, businesses and local communities, including:
• easing congestion on the road network
• improved public health and reduced healthcare costs
• improved community wellbeing and social cohesiveness
• reduced environmental impacts
• increased economic activity in the local area.
This framework outlines how we can further increase the proportion of people walking, cycling and riding for transport and recreation.

2
BUILDING AN INTEGRATED TRANSPORT NETWORK
Our vision for active travel
Making Canberra Australia’s cycling capital and most walkable city.Increasing the proportion of people walking, cycling, riding and accessing public transport and improving the safety and convenience of these travel choices across the ACT.
1.1 Our targets for active travelTransport for Canberra aims to increase the mode share of work trips by cycling and walking to 7% each, and the mode share of public transport to 16% by 2026.
This supports the ACT Government’s health, recreation and active living goals including the:• Healthy Weight Action Plan to keep rates of
overweight and obesity in the ACT at or below their 2012 level
• Active 2020 Strategic Plan to increase participation in active recreation activities,3 and promote the health and wellbeing of the community.
1.2 Our principles for active travelThe list of principles in Table 1 forms a framework for how we can achieve our vision and targets for Active Travel in the ACT. The framework is based on how we can better plan, deliver, encourage and manage our active travel.4
BUILDING
AN INTEGRATED
TRANSPORT
NETWORK
Creatingbetter
parkingsolutions
Improvingbus
services
DeliveringLight Rail
Improvingroads and
freightefficiency
Designing aconnected
city
Buildinga healthy
and activecity
Promoting walking and
cycling
Reducingtransportemissions
Figure 1: BuildinganIntegratedTransportNetwork

3
ACTIVE TRAVEL
Table1:10principlestosupportwalking,cycling,ridingandaccesstopublictransport
Groups Principles
PLAN: Include and prioritise walking, cycling and riding when planning for land use and transport
1. Work within a clear hierarchy of planning » Integrate land use and transport planning and relevant funding decisions. » Identify main walking and cycling routes that are consistent with ACT planning and transport strategies.
2. Design networks of continuous, convenient connections » Enable short walking, cycling and riding trips for transport purposes. » Improve access to and within major centres of employment, education, retail and community
facilities, focusing on ‘20-minute catchments’ (the equivalent of walking 2 kilometres or cycling 5 kilometres).
3. Facilitate active, vibrant communities » Develop places with a range of activities such as cafes, shops and playgrounds that attract people to
visit, play and stay and are connected to surrounding neighbourhoods and paths.
DELIVER: Build appropriate infrastructure for walking and cycling needs
4. Create safe environments for pedestrians and bicycle riders » Separate and prioritise pedestrians and bicycles from each other and from motor vehicles in high-
speed, high-volume traffic. » Allocate or share road space, with appropriate speeds, in lower-traffic environments. » Recognise the vulnerability of bicycles as road vehicles and pedestrians using the transport
infrastructure.
5. Incorporate quality pedestrian and bicycle facilities when building other infrastructure » Secure these facilities as part of development/redevelopment to avoid the need for expensive retrofitting. » Incorporate quality pathways and mid- and end-of-trip facilities as part of project works. » Encourage building owners and operators to provide end-of-trip facilities such as high quality
bicycle parking, change rooms and storage lockers.
6. Increase public transport catchments through better pedestrian and bicycle access » Improve pedestrian and bicycle access within 5–10 minutes of public transport stops, improve
permeability where possible, and remove impediments to safe, convenient access.
7. Improve pathways, intersections and facilities » Seek to prioritise pedestrians, bicycle riders and public transport users at crossings and intersections,
where appropriate. » Provide mid-trip facilities such as water fountains, shade, seating, toilets and way-finding signage
and end-of-trip facilities such as change rooms, bicycle parking and storage facilities.
ENCOURAGE: Enable greater participation in walking, cycling, riding and accessing public transport
8. Programs to encourage walking, cycling, riding and access to public transport » Provide programs and incentives, such as workplace travel plans, to inform people’s choices about
active travel and to encourage higher levels of participation. » Increase employer awareness of active travel and end-of-trip facility benefits. » Improve awareness and skills in the broader population such as driver and cycling skills. » Continue to support students, teachers and school communities to increase active travel to school. » Continue to provide training for network planning and delivery practitioners.
MANAGE: Coordinate across agencies
9. Ensure best practice governance arrangements, monitoring and evaluation » Improve coordination and engagement across directorates to better plan, deliver, encourage,
maintain and evaluate facilities.
10. Partner across directorates, business and community to achieve co-benefits » Partner with agencies and stakeholders to improve safety, encourage behaviour change in support of
increased walking, cycling, riding and use of public transport, and increase use of recreation facilities.

4
BUILDING AN INTEGRATED TRANSPORT NETWORK
2. How are we travelling now?
Canberra has one of the highest participation rates in walking and cycling of the major Australian cities.5
Over the last few years there has been significant growth in walking and cycling.
In the two years to 2014, there was a 46% increase in the number of people walking and cycling into and out of the five major town centres (Civic, Belconnen, Gungahlin, Tuggeranong and Woden). The highest numbers were recorded in Civic, with more than 8,400 counts across a typical weekday. Tuggeranong and Belconnen also saw significant growth, while there was a slight decrease in Woden (Figure 2).
2.1 Walking
Walking to workCanberra has the third highest mode share of walking to work within the major Australian cities, behind Darwin and Hobart.6
More than 8,100 people walk to work every day in the ACT. In the five years to 2011, as shown in Figure 3, there was a 17% increase in the number of women
walking to work and a 5% increase in the number of men walking to work. In total, 4.9% of Canberra’s journey-to-work mode share was by ‘walking only’.7
The map at Figure 4 shows that the highest percentage per suburb population of people walking to work travelled from Campbell, Braddon, Turner, City, Reid, Acton, Kingston-Barton, Forrest, Belconnen, Lyons, Garran, Phillip and Greenway.
0
2,000
4,000
6,000
8,000
10,000
12,000
2012 2013 2014
Civic
Belconnen
Gungahlin
Tuggeranong
Woden
Total
Source: Pedal Power ACT, 2014, Cordon counts of walking and cycling into and out of the five town centres in the ACT, from 2011 to 2014 www.pedalpower.org.au/projects/cordon-counts updated 18/3/14, accessed 19/8/14
Figure 2: Numberofpeoplewalking,cyclingorridingintoandoutofthefivetowncentresintheACT,2012to2014
Figure 3: ACTWalking
17% 5%2011
(3,711)2011
(4,423)
2006 (3,181)
2006 (4,218)
Figure4:PercentagepersuburbpopulationofpeoplewalkingtoworkintheACT,byplaceofusualresidence,2011

5
ACTIVE TRAVEL
walking to work and a 5% increase in the number of men walking to work. In total, 4.9% of Canberra’s journey-to-work mode share was by ‘walking only’.7
The map at Figure 4 shows that the highest percentage per suburb population of people walking to work travelled from Campbell, Braddon, Turner, City, Reid, Acton, Kingston-Barton, Forrest, Belconnen, Lyons, Garran, Phillip and Greenway.
Figure 3: ACTWalking
17% 5%2011
(3,711)2011
(4,423)
2006 (3,181)
2006 (4,218)
Figure4:PercentagepersuburbpopulationofpeoplewalkingtoworkintheACT,byplaceofusualresidence,2011

6
BUILDING AN INTEGRATED TRANSPORT NETWORK
Figure 5 shows that the proportion of people walking to work in Canberra has remained relatively steady over the past 35 years, at around 4–5% of all journeys to work, except for a 3.6% low in 1986. This compares favourably with the national average, which has declined over the same period from around 5.6% to 3.9%.
Walking to school, shops and other placesAround 4.1% of trips to school are made on foot, and another 19.2% by bus. Most bus journeys start and end with a walk to and from the bus stop.8
One survey of ACT residents found that only 2.7% of specific ‘trips to go shopping’ are made on foot.9 Another survey found the most common reason for walking in Canberra was to go shopping (37% of all walking trips).10 Many people carry out incidental shopping while walking to another destination.
A further 29% of walking trips are for recreational and social trips, such as walking for exercise, and another 29% are for commuting to work or education (refer Figure 6).11
3%
37 % Shopping
29%Social/ recreation
15%Commute to work
14%Commute
to education
←1% Employer's business
←1% Other
Source: SKM, 2010, Making Walking Count – Canberra. Report for the ACT Government by the Walk21 organisation,
table 3-5 (n=605)
Personal→ business
Figure5:Walkingtripsasaproportionofalltripstowork,capitalcities(exceptDarwin)1976–2011
0
1
2
3
4
5
6
7
8
1976 1981 1986 1996 20062001 20111991
Source: Australian Government 2013, State of Australian Cities 2013; from Mees P and Groenhart 2012, Transport Policy at the Crossroads: travel to work in Australian capital cities 1976-2011
Hobart
Melbourne
Adelaide
Canberra
Perth
Sydney
Brisbane
Figure 6: Proportionofwalkingtripsforallpurposes,Canberra

7
ACTIVE TRAVEL
2.2 Riding a bicycleThe rate of cycling to work in Canberra has tripled in the past 35 years – from a low of around 0.9% of all journeys to work in 1976, to a high of 2.8% by 2011 (see Figure 7). This represents the highest growth of any major city and is well above the national average growth rate. Canberra now has the second highest mode share of cycling to work in the capital cities after Darwin.12
Figure 8 shows that over the five years to 2011, there were 32% more women and 20% more men riding a bicycle to work in the ACT. In 2011 there were around 4,600 people riding a bicycle to work, which was 2.8% of travel mode share.13
Figure7:Cyclingtripsasaproportionofalltripstowork,capitalcities(exceptDarwin)1976–2011
0
.5
1
1.5
2
2.5
3
1976 1981 1986 1996 20062001 20111991
Source: Australian Government 2013, State of Australian Cities 2013; from Mees P and Groenhart 2012, Transport Policy at the Crossroads: travel to work in Australian capital cities 1976-2011
Hobart
Melbourne
Adelaide
Canberra
Perth
Sydney
Brisbane
Figure8:ACTCycling
32% 20%2011
(1,290)2011
(3,337)
2006 (980)
2006 (2,777)
Northbourne Avenue after school. Image courtesy Sara Stace

8
BUILDING AN INTEGRATED TRANSPORT NETWORK
Mapping of the 2011 Census data about journey to work in the ACT shows that most people riding a bicycle to work, based on percentage per suburb population, live in the inner north particularly in O’Connor, Lyneham, Downer, Dickson, Hackett, Acton, Ainslie, Turner, Braddon and Watson (Figure 9).14 Note that as the Census is taken in August, one of our coldest months, cycling and walking statistics in Canberra may be an under representative of average yearly patterns.
The 2013 National Cycling Participation Survey found that, in the ACT, 24% of all residents ride a bicycle at least once a week, 34% ride at least once a month and 47% ride at least once a year, as shown in Figure 10.15 This is well above the corresponding national averages of 17%, 25% and 37% respectively, as shown in Figure 11. Between 2011 and 2013, overall weekly cycling participation in the ACT grew from 22% to 25% of the population. Over the same time, the national average weekly participation fell from 18% to 17% of the population.16
With funding from Roads ACT, Pedal Power has been carrying out cordon bicycle/pedestrian counts around all major town centres in Canberra— Belconnen, Gungahlin, Tuggeranong, Woden and City. The purpose of this project is to collect pedestrian and cyclist demographic data, and travel patterns to assist in the planning of future walking and cycling facilities.
Figure9:PercentagepersuburbpopulationofpeoplecyclingtoworkintheACT,byplaceofusualresidence,2011 Figure 10: Percentagewhocycledinthepast week/month/year
Figure 11: Percentagewhocycledinthepastweek/month/year
0%
5%
10%
15%
20%
25%
30%
35%
40%
45%
50%
Last week Last month Last year
ACT Australia
Source: Australian Bicycle Council 2013, National Cycling Participation Survey, Austroads

9
ACTIVE TRAVEL
Mapping of the 2011 Census data about journey to work in the ACT shows that most people riding a bicycle to work, based on percentage per suburb population, live in the inner north particularly in O’Connor, Lyneham, Downer, Dickson, Hackett, Acton, Ainslie, Turner, Braddon and Watson (Figure 9).14 Note that as the Census is taken in August, one of our coldest months, cycling and walking statistics in Canberra may be an under representative of average yearly patterns.
The 2013 National Cycling Participation Survey found that, in the ACT, 24% of all residents ride a bicycle at least once a week, 34% ride at least once a month and 47% ride at least once a year, as shown in Figure 10.15 This is well above the corresponding national averages of 17%, 25% and 37% respectively, as shown in Figure 11. Between 2011 and 2013, overall weekly cycling participation in the ACT grew from 22% to 25% of the population. Over the same time, the national average weekly participation fell from 18% to 17% of the population.16
With funding from Roads ACT, Pedal Power has been carrying out cordon bicycle/pedestrian counts around all major town centres in Canberra— Belconnen, Gungahlin, Tuggeranong, Woden and City. The purpose of this project is to collect pedestrian and cyclist demographic data, and travel patterns to assist in the planning of future walking and cycling facilities.
Figure9:PercentagepersuburbpopulationofpeoplecyclingtoworkintheACT,byplaceofusualresidence,2011 Figure 10: Percentagewhocycledinthepast week/month/year
Figure 11: Percentagewhocycledinthepastweek/month/year
0%
5%
10%
15%
20%
25%
30%
35%
40%
45%
50%
Last week Last month Last year
ACT Australia
Source: Australian Bicycle Council 2013, National Cycling Participation Survey, Austroads
Source: Australian Bicycle Council 2013, National Cycling Participation Survey, Austroads
ACT residents ride at least once a year
ACT residents ride at least once a month
ACT residents ride at least once a week

10
BUILDING AN INTEGRATED TRANSPORT NETWORK
Cordon count locations are to be strategically placed in order to allow for:
• directional movement patterns of pedestrians and cyclists
• aggregated distribution of pedestrians and cyclists
• trends to better understand the current mode share, and provide insight on how to accommodate for future mode share targets.
The existing surveys recorded the number of pedestrians and cyclists at different time intervals.
Adult cycling in the ACTA separate survey of ACT households, undertaken in 2011, specifically asked adults about their bicycle riding habits. Around half the adults surveyed said they ride a bicycle at least several times a year, with around one in six (17%) riding at least once a week. Men (65%) were nearly twice as likely to be bicycle riders as women (35%).17 Of those adults, 95% ride for physical fitness and recreation, 24% to shops, 20% to work, 17% to visit nearby friends or relatives, and 9% to education such as university.18
Surprisingly, a quarter of adults in this survey said they ride their bike to go to local shops.19 A separate survey found that only 1.3% of bicycle trips were specifically for shopping purposes.20 This suggests that people are doing local shopping while riding their bicycle to another destination rather than making a specific journey to the shops by bike.
2.3 Mode share comparisons Driving remains the dominant mode of travel in Australia and the ACT. Around 146,000 people travel by car to work in the ACT (81.9% mode share Australia’s hightest) either as drivers or car passengers.21 By contrast, Canberra has one of the lowest rates of public transport usage of the major cities (7.8%), down from a peak in 1991 when it had 9.9% mode share.22
Figure 12 shows the transport mode share for all trip types, reported by ACT households in 2009.23 Active travel mode shares (walking, cycling and bus travel) totalled around 28% of all trips.
10%Bicycle
4%Walk
13% Bus
67% Car (driver, passenger)
Motorbike→ Scooter
←1% Other
4%
Source: 2009, ACT Travel Survey Analysis prepared by Bob Nairn Consultant, June 2012
Figure 12: TravelintheACTbymodeshare,2009householdtravelsurvey
This series of photos, taken in Canberra, shows the same number of people that can fit in one bus, riding bicycles, walking or travelling by car. Courtesy Cycling Promotion Fund, 2013.

11
ACTIVE TRAVEL
Surprisingly, a quarter of adults in this survey said they ride their bike to go to local shops.19 A separate survey found that only 1.3% of bicycle trips were specifically for shopping purposes.20 This suggests that people are doing local shopping while riding their bicycle to another destination rather than making a specific journey to the shops by bike.
2.3 Mode share comparisons Driving remains the dominant mode of travel in Australia and the ACT. Around 146,000 people travel by car to work in the ACT (81.9% mode share Australia’s hightest) either as drivers or car passengers.21 By contrast, Canberra has one of the lowest rates of public transport usage of the major cities (7.8%), down from a peak in 1991 when it had 9.9% mode share.22
Figure 12 shows the transport mode share for all trip types, reported by ACT households in 2009.23 Active travel mode shares (walking, cycling and bus travel) totalled around 28% of all trips.
10%Bicycle
4%Walk
13% Bus
67% Car (driver, passenger)
Motorbike→ Scooter
←1% Other
4%
Source: 2009, ACT Travel Survey Analysis prepared by Bob Nairn Consultant, June 2012
Figure 12: TravelintheACTbymodeshare,2009householdtravelsurvey
This survey asked what the end purpose of each trip was for; whether to go home, to work, to school, shopping or for other purposes.
Figure 13 shows there was a significant difference in choice of mode according to the final destination. Nearly two thirds of all car travel was to go home or to work. By comparison, around 80% of all ‘active travel’ journeys (bicycle trips, walking trips and bus trips) were to home or to work.
A much higher proportion of shopping trips were made by car than any other mode. Nearly 80% of shopping trips were by car, compared to just 7.8% by bus, 2.2% by bicycle and 2.7% walking.
Travelling to school was more evenly spread across the mode types; 13.3% of trips to school were by bicycle, 19.2% by bus, 4.1% on foot and 55.6% by car. However, only 2.5% of car trips were actually reported as going ‘to school’; most likely parents dropped off children on their way to other destinations as their final ‘trip purpose’.24
Figure 13: Averageproportionoftripstohome,work,schoolandshoppingbyactivetravelcomparedtocar
Travelled by car(as passenger or driver)
34%To home
26% Other
Source: 2009, ACT Travel Survey Analysis prepared by Bob Nairn Consultant, June 2012
41%To home
42 %To work
30%To work
↑To
school
To school
←Shopping
7% Shopping
11% Other
4%
3%
2%
Travelled by active transport (bus, bicycle or walk)

12
BUILDING AN INTEGRATED TRANSPORT NETWORK
2.4 Walking or cycling as part of accessing public transportAcross the ACT nearly 11,200 people per day (6.3% of travel to work mode share) caught a bus to work.25 It is likely they walked to and from a bus stop as this figure was reported separately to the 1,500 who travelled by both bus and car (as either a driver or car passenger).
Figure 14 maps where people travel from, as part of their bus journey to work based on percentage per suburb population. It shows most public transport users live near or along the frequent ‘rapid’ bus corridors, in Gungahlin, Palmerston, Franklin, Harrison, Lyneham, Watson, Downer, Dickson, O’Connor, Turner, Braddon, City, Reid, Kingston- Barton, Belconnen, Macquarie, Cook, Bruce, Kaleen, Curtin, Hughes, Lyons, Chifley, Phillip, Mawson and Greenway.
2.5 Road safetyThe ACT has a good road safety record and has consistently maintained a lower per capita rate of deaths than national rates.
In 2013, the ACT recorded a lower number of road fatalities per capita than the national average, with 1.8 fatalities per 100,000 people compared with 5.2 fatalities per 100,000 people nationally. The ACT also recorded a lower rate of deaths per 10,000 registered vehicles and per 100 million vehicle-kilometres travelled than the overall national rate.
However, the increasing rate of crashes involving vulnerable road users is of particular concern. In 2013, three fatalities and 236 injuries involved vulnerable road users – cyclists, pedestrians and motorcyclists. These figures represent 43% of fatalities and 30% of injuries reported in 2013. The government has already introduced new fines and penalties to encourage safer driving behaviour in relation to vulnerable road users. In September 2014, the government released its response to the Assembly Inquiry Into Vulnerable Road Users in the ACT. The government agreed to the majority of recommendations, including a trial of a minimum passing rule for overtaking cyclists (1 metre at 60 kilometres per hour and 1.5 metres greater than 60 kilometres per hour).
Figure14:PercentagepersuburbpopulationofpeoplecatchingpublictransporttoworkintheACT,byplaceofusualresidence,2011
Civic Cycle Loop provides a bicycle lane that is fully separated from both motor vehicles and pedestrians in the inner city of Canberra. Photo courtesy Tony Arnold.

13
ACTIVE TRAVEL
In 2013, the ACT recorded a lower number of road fatalities per capita than the national average, with 1.8 fatalities per 100,000 people compared with 5.2 fatalities per 100,000 people nationally. The ACT also recorded a lower rate of deaths per 10,000 registered vehicles and per 100 million vehicle-kilometres travelled than the overall national rate.
However, the increasing rate of crashes involving vulnerable road users is of particular concern. In 2013, three fatalities and 236 injuries involved vulnerable road users – cyclists, pedestrians and motorcyclists. These figures represent 43% of fatalities and 30% of injuries reported in 2013. The government has already introduced new fines and penalties to encourage safer driving behaviour in relation to vulnerable road users. In September 2014, the government released its response to the Assembly Inquiry Into Vulnerable Road Users in the ACT. The government agreed to the majority of recommendations, including a trial of a minimum passing rule for overtaking cyclists (1 metre at 60 kilometres per hour and 1.5 metres greater than 60 kilometres per hour).
Figure14:PercentagepersuburbpopulationofpeoplecatchingpublictransporttoworkintheACT,byplaceofusualresidence,2011

3. Building an integrated transport network and active travel

15
ACTIVE TRAVEL
3. Building an integrated transport network and active travel
3.1 National policy settingGetting more people regularly walking, cycling, riding, and catching public transport achieves objectives across multiple policy areas at both national and territory level. Relevant national policies include:
National Road Safety StrategyReduceroaddeathsandseriousinjuriesby30%by2020The National Road Safety Strategy 2011–2020 is signed by state, territory and Australian Government road and transport ministers. It adopts the Safe System
approach: safe roads, safe speeds, safe vehicles and safe people.
National Disability Strategy 2010–2020InclusiveandaccessiblecommunitiesSigned by all levels of government, the National Disability Strategy incorporates inclusive and accessible communities to ensure people with disability live in accessible and
well-designed communities with opportunity for full inclusion. It advocates for a public, private and community transport system that is accessible for the whole community.
National Cycling StrategyDoublerateofparticipationincyclingbetween2011and2016The National Cycling Strategy 2011–2016 is signed by state, territory and Australian Government road and transport ministers. A survey of 10,000
households provided the 2011 benchmark for this target.
National Preventative Health StrategyReverseoverweightandobesitytrendsby2018Australia: the healthiest country by 2020 – National Preventative Health Strategy aims to halt and reverse the rise in overweight and obesity through a 15% increase in the
proportion of children and adults meeting national guidelines for physical activity by 2018 and a 3% increase in the proportion of children and adults with a healthy weight by 2018.
AUSTRALIA:THE HEALTHIEST COUNTRY BY 2020
National Preventative Health Strategy – the roadmap for action30 June 2009
prepared by the National Preventative Health Taskforce

16
BUILDING AN INTEGRATED TRANSPORT NETWORK
3.2 ACT policy settingThe ACT Government recognises there are many benefits from increasing participation in walking, cycling and riding on a regular basis. These include transport benefits such as reduced traffic congestion; individual health and wellbeing; neighbourhood interaction and social cohesion; and reduced environmental degradation.
Improving walking and cycling infrastructure in the ACT is part of the Parliamentary Agreement for the 8th Legislative Assembly (2012).
Figure 15 illustrates where the Active Travel Framework will sit within the ACT policy and planning context. The ACT Planning Strategy, Transport for Canberra, Healthy Weight Action Plan and AP2: A New Climate Change Strategy and Action Plan for the ACT, sit at the strategic policy level. The ACT Government Infrastructure Plan, Road Safety Strategy and Active Travel Framework sit at the planning and infrastructure coordination level, cascading down into the Strategic Cycle Network Plan, master plans and, finally, the specific delivery and project plans.
Activ
e Li
ving
Pro
gram
sNational Strategy
Planning Strategy
Transport for
Canberra
Healthy Weight
Action Plan
Climate Change Strategy
Active Travel Framework
Planning / Infrastructure Coordination
Strategic Cycle
Network Plan
Master Plans
Delivery
Activestreets
Strategic Policy
ACT Government
Infrastructure Plan
ACT Road Safety
Strategy
Assembly Inquiry into vulnerable Road Users
Figure15:PolicycontextforActiveTravelintheACT
3.3 Transport for CanberraTransport for Canberra provides the policy framework for transport planning in the ACT from 2012 to 2031. It sits alongside the ACT Planning Strategy, highlighting the important relationship between land use and transport for our city. Figure 16 outlines the ACT policy linkages with Transport for Canberra. A more comprehensive summary of specific policies is provided in Appendix C – Existing policies and resources.
Transport for Canberra includes the following principles to guide new transport policies as shown in Figure 17:
1 Integrated with land use planning
2 Makes active travel like walking and cycling the easy way to get around
3 Provides sustainable travel options and reduces transport emissions
4 Safe for moving people however they get around
5 Accessible for everybody whatever their level of mobility at any time or place
6 Efficient and cost effective, providing value for money for the government, business and the community by managing travel demand across the whole transport system.
Figure 16: TransportforCanberrapolicylinkages
Transport for Canberra
Climate change and environment
Land release and master planning program
Infrastructure and safetyHealth and physical
Accessibility and social inclusion
ACT planning framework
ACT Sustainable Energy Policy
Carbon Neutral ACT Government Framework
AP2 A New Climate Change Strategy and Action Plan for the ACT
Dickson, Kambah, Erindale to
Tuggeranong and more
Molonglo Valley
Eastern Broadacre, Belconnen,Woden and Mawson
ACT Freight Strategy(Under development)
ACT Infrastructure Plan
ACT Road Safety Strategy
Strategy
Strategic Framework 2012-15
ACT Women’s Health Plan
Capital Asset Development Plan
Accessible Public Transport
ACT Aboriginal and Torres Strait
ACT Children’s Plan
ACT Young People’s Plan
ACT Women’s Plan
Canberra Social Plan
Human Rights Act 2004
Strategic Plan for
ACT Planning Strategy
Canberra Plan: Towards
our
Second Century
ACT Healthy Weight Action Plan

17
ACTIVE TRAVEL
More specifically, Transport for Canberra aims to encourage increased active travel by:
• integrating transport and land use planning to develop urban environments that encourage walking and cycling
• encouraging a combination of active travel and public transport trips through bike racks on buses and bike parking at bus stops
• continuing to expand the on- and off-road cycle and pedestrian networks and improve active travel infrastructure like lighting, seating and drinking fountains to make walking easier and safer
Figure17:TransportforCanberrapolicyprinciples
Efficient andcost-effective
Accessible and socially inclusive
Integratedwith land use
planning
Sustainable
Safe
ActiveTRANSPORT
FORCANBERRA
3.3 Transport for CanberraTransport for Canberra provides the policy framework for transport planning in the ACT from 2012 to 2031. It sits alongside the ACT Planning Strategy, highlighting the important relationship between land use and transport for our city. Figure 16 outlines the ACT policy linkages with Transport for Canberra. A more comprehensive summary of specific policies is provided in Appendix C – Existing policies and resources.
Transport for Canberra includes the following principles to guide new transport policies as shown in Figure 17:
1 Integrated with land use planning
2 Makes active travel like walking and cycling the easy way to get around
3 Provides sustainable travel options and reduces transport emissions
4 Safe for moving people however they get around
5 Accessible for everybody whatever their level of mobility at any time or place
6 Efficient and cost effective, providing value for money for the government, business and the community by managing travel demand across the whole transport system.
Figure 16: TransportforCanberrapolicylinkages
Transport for Canberra
Climate change and environment
Land release and master planning program
Infrastructure and safetyHealth and physical
Accessibility and social inclusion
ACT planning framework
ACT Sustainable Energy Policy
Carbon Neutral ACT Government Framework
AP2 A New Climate Change Strategy and Action Plan for the ACT
Dickson, Kambah, Erindale to
Tuggeranong and more
Molonglo Valley
Eastern Broadacre, Belconnen,Woden and Mawson
ACT Freight Strategy(Under development)
ACT Infrastructure Plan
ACT Road Safety Strategy
Strategy
Strategic Framework 2012-15
ACT Women’s Health Plan
Capital Asset Development Plan
Accessible Public Transport
ACT Aboriginal and Torres Strait
ACT Children’s Plan
ACT Young People’s Plan
ACT Women’s Plan
Canberra Social Plan
Human Rights Act 2004
Strategic Plan for
ACT Planning Strategy
Canberra Plan: Towards
our
Second Century
ACT Healthy Weight Action Plan

18
BUILDING AN INTEGRATED TRANSPORT NETWORK
• improving public transport to be more convenient, thereby encouraging people to walk or cycle to it
• encouraging behaviour change, particularly for travel to school, to establish sustainable travel habits for life.
Travel targetsBy 2026, Transport for Canberra aims to increase the mode share of work trips by cycling and walking to 7% each, and mode share of public transport to 16% (Figure 18).
These mode share targets are challenging given the Census occurs in August when the cold Canberra winter affects the number of people choosing to walk, cycle or ride; while the proportion of cycling and walking increased, the actual figures in 2011 fell short of the targets. To achieve its 2016 mode share targets, Canberra will need around 7,000 more public transport users, 7,000 more bicycle riders and 4,000 more people walking to work than in 2011.
The government is continuing to improve its understanding of mode share over time through ongoing improvements to data collection (e.g. cordon counts, travel survey) and research for public transport, walking and cycling.
Improving access to public transportThere is significant opportunity to expand catchments for public transport by improving access to bus stops and future light rail stops. Transport for Canberra outlines steps to achieve the ACT Government’s mode share targets and ensure sustainable mobility for Canberrans in the future by public transport, cycling, walking or combination of all the modes.
Research shows that people will generally walk, cycle or ride for up to 10 minutes to reach a frequent, direct service such as an express bus or light rail service. This is equivalent to an 800-metre walk or a two- to three-kilometre bicycle ride. However, they will consider walking only up to half this distance to a less frequent or indirect local service. A Public Transport User Survey undertaken in South East Queensland in 2010 confirmed that many public transport users are prepared to walk significantly further than 400–800 metres to access high frequency public transport with some users prepared to walk up to 1,300 metres.26
One of the most significant achievements in the ACT has been the increase in the number of people who live within 750 metres, or a 10 minute walk, of a rapid bus route. This has increased from 14.5% to 23.7% since the introduction of Transport for Canberra.27
0%
5%
10%
15%
20%
25%
Public Transport
30%
Cycling Walking Total
2006 actual
2011 actual
2016 target
2026 target
Figure18:ModeshareforjourneystoworkintheACT–actualversustargets,2011to2026

19
ACTIVE TRAVEL
CASE STUDY – Measuring walkability to Canberra’s bus stops
In 2013, the ACT Government commissioned a mapping project to measure the walking distance and travel time to every bus stop in Canberra.
The government is using this information to evaluate where connections should be prioritised, or where bus routes could be re-routed to provide better access for more residents, and to inform the footpath infrastructure program.
The study found that, consistent with the national and international literature, the layout of streets can have a considerable impact on the distance a person has to walk to a bus stop. Streets laid out as grids, with many intersections, provide more walkable options than winding cul-de-sacs. This is apparent when comparing Braddon/Reid (which is laid out more as a grid) and Campbell (which has more winding streets and fewer intersections).
Even with an ‘ideal’ walking network (grid-like, with lots of connections), there is a wide disparity between the walked distance and the straight-line distance. This emphasises the importance of using ‘real world’ distances to determine the performance of the public transport network in achieving accessibility guidelines.
Mapping analyses showed that all urban properties meet the Transport for Canberra target of having 95% of households within 500 –750 metres of bus stops. The median walked distance from residential properties to a bus stop was 260 metres. All of the districts have over 90% of properties within a 7 minute walk from a bus stop.
Parking managementParking is a key tool to influence individuals’ decisions on private vehicle use and can directly influence decisions by motorists as to the time, place and mode of travel. When parking is free or abundant it is not uncommon for public transport to be a more time consuming and expensive option for many users. The planning controls for the supply and distribution of ACT parking are generally set out in the Parking and Vehicular Access General Code under the Territory Plan.
The ACT Government’s Parking Action Plan calls for moving long-term car parking to the edges of commercial areas and places greater emphasis on the movement of people within these centres, particularly between the carparks and the shopping or other areas of demand. There will be increased emphasis on improving the pedestrian infrastructure to facilitate movement between peripheral carparks and employment and commercial centres. Where this crosses busy roads, progressive improvements to pedestrian infrastructure linking parking facilities to major uses will be implemented subject to funding decisions by government.

20
BUILDING AN INTEGRATED TRANSPORT NETWORK
CASE STUDY - Walk21 CharterThe ACT Government is a signatory of the Walk21 International Charter for Walking to create healthy, efficient and sustainable communities where people choose to walk. Through this charter, the government is committed to work with others to help create a culture where people choose to walk by addressing:
1. increased inclusive mobility
2. well designed and managed spaces and places for people
3. improved integration of networks
4. supportive land-use and spatial planning
5. reduced road danger
6. less crime and fear of crime
7. more supportive authorities
8. a culture of walking.
An audit found that 95% of Canberrans think their walking environment is pleasant or very pleasant for walking. Canberrans generally think their neighbourhoods provide good access to local services, green spaces and public transport.28 The most significant motivator for walking in Canberra is for exercise and better health (62%). This is higher than any other city surveyed by Walk21 to date.
Increasing security and lighting, more amenities such as cafes and local shops, a greener environment and more even paths and pavements were key improvements people wanted to see to their walking environments.
3.4 Health
‘Canberra is proud to be a healthy, safe and inclusive city. Its unique environment creates many opportunities for people to be active in their daily lives. Canberra possesses well planned and extensive cycle and walking networks to enable people to ride or walk for transport. Opportunities for active recreation in Canberra are abundant, and include parks and reserves, sporting ovals, mountain biking and BMX tracks.’
ACT Government — Healthy Weight Action Plan
Healthy Weight Action Plan The ACT Government’s Healthy Weight Action Plan is about supporting a healthy, active and productive community. The focus is on creating environments where making healthy lifestyle choices is easier.
People who are overweight and obese have an increased risk of premature cardiovascular disease, stroke, diabetes, arthritis and other conditions which can cost years of healthy life. On top of individual costs, there is added pressure on the health system due to higher rates of major, preventable illness related to being overweight or obese.
The ACT Chief Health Officers Report 2014 states that in 2011-12:29
• 63.6% of the ACT adult population were overweight or obese, with 25.5% being obese
• 26.3% of ACT children aged 5-17 years were overweight or obese.
Modern, sedentary lifestyles have resulted in lower rates of physical activity and higher intake of high energy foods; together, these factors significantly increase the likelihood of people becoming overweight or obese. The burden of disease attributable to physical inactivity was identified as one of the top five leading risk factors in 2010.30
The ACT Chief Health Officer’s Report 2014 states that in 2011-12:31
• 59.6% of adult ACT residents were sufficiently physically active
• 23% of children aged 5-15 years old met physical activity recommendations.

21
ACTIVE TRAVEL
Through the Healthy Weight Action Plan, the ACT Government’s goal is to keep rates of overweight and obese population in the ACT at or below their 2012 level.
The action plan includes a theme for urban planning which recognises that the built environment influences levels of physical activity for transport and recreation.
The actions in the plan were developed through an extensive process carried out by a whole-of-government taskforce that included representatives from ACT Government directorates and non-government and academic organisations with expertise in obesity as a public health issue.
Actions arising from the Healthy Weight Action Plan include commitments to:32
• promote and prioritise active travel through the implementation of the Transport for Canberra policy and master planning processes
• incorporate active living principles into the Territory Plan codes and the Territory and Municipal Services Infrastructure Standards for public realm design and development works
• create new incentives for ACT workers and/or workplaces to participate in physical activity or active travel
• develop and maintain a web-based information resource for workplaces, primary care providers and the community about opportunities to improve physical activity and nutrition levels
• collect and evaluate usage and demand data about walking and cycling infrastructure to guide actions that increase use.
Providing adequate facilities at destinations, such as workplaces and tertiary education institutions, influences people’s likelihood to ride, jog or walk. Under the Healthy Weight Action Plan the ACT Government has committed to investigating opportunities to update requirements for new commercial buildings to contain facilities which encourage physical activity and to improve access to these facilities for existing buildings.
Ageing
‘At any given time, around 30% of pedestrians have impaired mobility. Because of the ageing of the population ... public authorities must prepare for a future where a growing number of highly vulnerable people will be even more dependent on walking and personal mobility devices.’ Organisation for Economic Co-operation and Development
The ACT will experience significant changes in its demographic profile over the next few decades. Between 2010 and 2059 the proportion of persons aged 65 years and over is projected to increase from 11.2% to 21.9% of the population.33 The increasing number of aged people will require better access to public transport options, and improved safety and convenience for seniors.
Age-Friendly active travel upgrades are proposed for Weston and Ainslie—investigations and consultation undertaken in 2014–15, with construction budgeted for in 2015–16.

4. Barriers and opportunities

23
ACTIVE TRAVEL
4. Barriers and opportunities
‘There is strong support for any improvements in the urban planning and transport strategy that will enable safer walking and cycling in Canberra. ’
ACT Government — Transport for Canberra
Around 25,000 people (12.3% of adults travelling) in Canberra travel less than 5 kilometres each way to work or study, and another 37,600 people (18.6%) travel 5–10 kilometres.34 Shifting even a small proportion of these short-distance commuters to walking or cycling would increase the capacity of Canberra’s transport networks in the inner-city areas, and have significant health benefits due to incidental exercise.
4.1 Barriers to active travel
SpecificbarrierstowalkingandcyclingcitedbyCanberra’sresidentsinclude:
• concerns about specific streets and routes that were not serviced with level, well-lit footpaths, resulting in lower safety, particularly for the more vulnerable people in the community, including children and the aged
• having to walk alongside major roads not on footpaths, particularly in areas without services such as well-lit footpaths, bus services and open space
• conflict between cycling and walking on paths
• the need for separated cycle ways on major roads.35
When asked in a survey what would encourage them most to ride a bicycle more often, a quarter of Canberra adults said better off-road paths was of primary importance. A further 15.5% said ‘improved driver awareness of bicycle safety and road sharing’ was their primary concern. ‘Lighting, surveillance, signposting and removal of blockages’ and ‘better on-road cycle paths’ also rated highly. This is illustrated in Figure 19.
SafetySafety concerns are a significant barrier to people cycling and walking. In 2013, the issue of vulnerable road users was referred to the Standing Committee on Planning, Environment and Territory and Municipal Services for inquiry. The committee received 54 submissions including submissions from Pedal Power, Amy Gillett Foundation, Motorcycle Riders Association, NRMA Motoring and Services, ACT Law Society, Australasian New Car Assessment Program and the Council of the Ageing. The committee held seven public hearings and heard from 36 witnesses.
The committee’s report, released on 5 June 2014, contains 28 recommendations aimed at improving road safety for vulnerable road users and addresses specific issues raised during the inquiry. The government supported the inquiry and recognised it was an important opportunity to acknowledge the particular risks for this group of roads users, consider how the ACT can improve road safety outcomes and, in doing so, encourage greater use of sustainable transport modes.
24.2%Better off-road
cycle paths
6.3%Improving community awareness generally
15.5%Improved driver
awareness of bicyclesafety and road sharing
1.8% Parking facilities
8.7% Lighting, surveillance, signposting and removal of blockages on key routes
9.6%Better on-road
cycle paths
4.7% Shower and change facilities
at destination
0.4% More cyclist on road2.6% Better access to cycling information
Source: ACT Government 2011,Telephone Survey About Cycling in Canberra, by Winton Consultants, 21/11/2011. Phone survey of 1000 adults.
Figure19:Primaryreasontostartridingabicycle,orridingmoreoften

24
BUILDING AN INTEGRATED TRANSPORT NETWORK
The government will continue to pursue actions to make our roads safer for the growing number of cyclists and pedestrians. A number of specific actions will be included in the ACT Road Safety Action Plan 2015–2018.
These include public awareness campaigns, lower speed environments, a new minimum passing distance rule when overtaking cyclists, and reforms to driver license tests to emphasise driver’s responsibilities to vulnerable road users.
4.2 Benefits of active travel
Recognisedbenefitsofactivetravelinclude:
• health benefits such as improved mental and physical health
• economic benefits such as reduced healthcare costs, increased property values, increased retail expenditure and reduced construction costs
• environmental benefits such as reduced congestion, air and noise pollution
• social benefits such as improved community wellbeing and social cohesion.
Health benefits Physical inactivity has been identified as the fourth leading risk factor for global mortality. Based on estimates that 60 – 70% of the Australian population is sedentary, or has low levels of physical activity, it is estimated that increasing participation in physical activity by 10% would lead to opportunity cost savings of $258 million, with 37% of savings arising in the health sector.36
A Queensland Department of Transport and Main Roads study from 2011 on the benefits of active travel inclusion in infrastructure projects found that the benefit per kilometre walking or cycled for an average project delivered higher health benefits than any other factor measured.37
Use of active travel can also improve safety, with evidence that countries with high levels of active travel participation generally have lower pedestrian and cyclist fatality rates for children.38 There is widespread recognition across OECD countries that while active travel carries a small risk of serious injury or death, the health and social benefits substantially outweigh the risks.39
Economic benefits Evidence is emerging of the economic significance of cycling and walking to towns and cities, with identified economic benefits including:
• reduced health expenditure due to increased physical activity and reduced transport emissions
• higher levels of retail spend when space is allocated to bicycle parking compared to devoting the same space to car parking40
• increased economic value and activity in the local area, as reflected in the sale price of residential properties and the rental price of retail properties41
• increased retail expenditure for areas where walking and public realm improvements have been made42
• reduced construction costs, as constructing walking and riding infrastructure is relatively inexpensive compared to other transport modes.43
Retailers sometimes oppose non-motorised improvements, such as bike lanes, based on the assumption that motorists are better customers than pedestrians and cyclists.44 Studies show that retailers may overestimate the proportion of customers arriving by car when more people actually walk, cycle or travel by bus to the shops.45 A comparison of spending by transport mode in Australia, Canada and New Zealand also found that pedestrians spent 2–5 times more than people arriving by car.46
Environmental benefits Identified environmental benefits associated with increased active travel include reduced use of cars resulting in reduced road congestion, air and noise pollution.
Transport is the second-largest emitter of greenhouse gas emissions nationally after electricity generation and other fixed sources, with cars contributing about half of the transport emissions. In the ACT the transport sector contributes about 23% of total greenhouse emissions.47
Motor vehicles are also a major source of air pollutants such as hydrocarbons, volatile organic compounds and nitrogen oxides. In comparison, walking and riding emit significantly less or no greenhouse gases and air pollutants than motorised forms of transport and reduce the likelihood of noise pollution.

25
ACTIVE TRAVEL
Social benefits Walking and cycling provide affordable basic transport. Improving active travel can help achieve social equity and access objectives, as physically, economically and socially disadvantaged people often rely on walking, cycling and access to public transport.48
Active travel can also contribute to social benefits; evidence includes:
• walking can contribute to increased social interaction, the development of social capital and increased safety
• those living in walkable neighbourhoods have higher levels of social capital than those living in car-oriented suburbs; residents are more likely to know and trust neighbours and be socially and politically engaged, factors that contribute to a healthy society.49
4.3 Opportunities
Opportunitiestoincreaseactivetraveluptakeincludeimproving:
• the connectivity of walking and cycling networks and integration with public transport hubs
• active travel connections within and through town and group centres
• safety for pedestrians and cyclists
• supportive infrastructure such as lighting, shade, signs, seating and drink fountains.
Tables 2–5 provides a summary of barriers to walking, cycling, riding and accessing public transport, and identifies potential opportunities for consideration.
CASE STUDY – Canberra Centenary TrailThe Centenary Trail is a 145 kilometre walking and cycling journey that visits historic and iconic sites around the ACT. It is a continuous off-road path through a mix of urban and rural environments.
The trail is generally designed for low intensity and is a mix of fire trails, walking tracks and shared paths, integrating a number of local recreational paths. Suggested itineraries are a seven day walk (20 km/day) or a three day cycle (45 km/day).
The trail visits a number of key historic and cultural locations and themes including Ngunnawal Country, our rural past, the northern border, urban forest, new towns and bush capital.
The ACT Government supports events along the Centenary Trail recognising the health and economic benefits of exercise tourism. For example, the inaugural CBR 100 Challenge took place in March 2015. Teams of three will be invited to walk 25 km, 50 km or 100 km along the trail, while solo runners will have the chance to tackle the 50 km or 100 km course.
The Centenary Trail Blaze is an annual event which caters for every level of rider including the 145 km full trail adventure; a 65 km course on the trail’s southern section; and a 35 km course for families. Over 80,000 people used the Centenary Trail in 2014.

26
BUILDING AN INTEGRATED TRANSPORT NETWORK
Table2:Barriersandopportunitiestoplanactivetravel
Barriers OpportunitiesLackofcontinuous,convenientconnections• Short local trips suitable for walking, cycling or
riding may be impeded by poor connectivity• Public transport stops may be difficult to
reach
Plancomprehensivenetworks• Improve connectivity to integrate walking and cycling
networks with public transport hubs• Concentrate convenient networks within activity centre
catchments• Ensure walking and cycling path-of-travel is continuous
Table3:Barriersandopportunitiestodeliveractivetravel
Barriers OpportunitiesLackofphysicalsafety• Inappropriate infrastructure for the speed and
volume of traffic• Paths may not be navigable by wheelchairs,
prams and people with limited mobility• Poorly designed or unmaintained paths and
roads include trip hazards, lack of kerb ramps, inadequate width of paths, excessive poles and street furniture, glass, debri and other hazards
Buildappropriateinfrastructure• Separate pedestrians/bicycles from fast traffic• In high-pedestrian areas, reduce traffic volume and
speed and prioritise pedestrians/bicycles• Ensure pedestrian paths, cycleways, cycle lanes and
shared roads/paths are appropriate for the task, safe for all users and properly maintained
• Comply with standards, including disability access, for infrastructure design and maintenance
Lackofpersonalsafetyandcomfort• Physical barriers can prevent convenient
access across roads or along footpaths• People feel unsafe where there is no ‘passive
surveillance’ from nearby buildings or activities
• Lack of lighting, directional signage, seating, drink fountains, shade, or bicycle parking
• Priority is often given to motor vehicles, even on major pedestrian or bicycle routes
Providemid-tripfacilities• Lighting, behavioural and wayfinding signs, seating,
shade, drink fountains• Provide end-of-trip facilities• Bicycle parking, change facilitiesSafety• Facilitate land uses adjacent to paths provide passive
surveillance • Maintain facilities for attractiveness and amenityPrioritisepedestriansandbicycleswhereappropriate• Type and location of crossings, timing of traffic signals,
width and quality of pathways• Lower speed limits in town centres• Avoid driveway crossings of main routes

27
ACTIVE TRAVEL
Table4:Barriersandopportunitiestoencourageactivetravel
Barriers OpportunitiesLackofawareness• People may not be aware of the range of
transport options, or how to easily walk, cycle, ride and use public transport
• Road users may be unaware of specific road rules, or the rules may be ambiguous
Provideinformation• Websites, trip planners, maps• Real-time information (i.e. NXTBUS)• Social media• Behaviour change programs• Review road rules and/or awareness of rules
Lackofskills• Drivers may not be aware of vulnerable road
users• People may lack bicycle riding or maintenance
skills• Lack of understanding of new network route
planning and facilities by industry practitioners
Provideskillstraining• Driver awareness of vulnerable road users• Bicycle training (e.g. school children, adults)• Increase the understanding of network route planning
and facility design to industry practitioners
Lackofmotivation• Lack of good quality routes discourage active
travel• Perceptions that public transport may be hard
to reach, irregular or unreliable• Easy alternatives may exist for short trips
(e.g. abundant cheap car parking)
Enablegreaterparticipation• Improve convenience of walking/riding for short trips
(i.e. under 20 minutes)• Improve accessibility, frequency and reliability of public
transport• Increase awareness of transport options
Table5:Barriersandopportunitiestomanageactivetravel
Barriers OpportunitiesPoorgovernance• Limited integration and coordination across
agencies and governments• Lack of strategic land use and transport
planning across regions• Failure to implement planning objectives• Failure to monitor performance and adjust
plans
Improvegovernance• Continue to improve integration across agencies
(planning, transport, health, environment, education) and levels of government
• Coordinate land use and transport planning, and delivery of projects
• Monitor and improve to achieve best practice
Source: Adapted from Australian Government, 2013, Walking, Riding and Access to Public Transport: supporting active travel in Australian communities, Department of Infrastructure and Transport, figure 1.1

5. Principles
MORE INFORMATION:Canberra Connect 13 22 81 www.act.gov.au/centenarytrail
Report trail maintenance issues to Canberra Connect 132281. In emergency telephone 000.
MURRUMBIDGEERIVER
LAKE TUGGERANONG
BARTON HWY
NO
RT
HB
OU
RN
E A
VE
LAKE BURLEY GRIFFIN
MOLONGLORIVER
LAKE GINNINDERRA
GUNGAHLINTOWN CENTRE
KA
MBA
H POOL RD
GUNDAROO DR
HO
RS
E P
AR
K D
R
EU
CU
MB
EN
E D
R
HINDMARSH DR
LONG GULLY RD
ISABELLA DR
MU
GG
A L
AN
E
PARLIAMENTHOUSE
NORTHERNBORDER
CAMPSITE & REST AREA
HUGHIE EDWARDS REST AREA
ONE TREE HILL
ENTRANCE
ONE TREE HILL
REST AREA
AMY ACKMAN ST
FORDE
AUSTRALIANWAR
MEMORIAL
SCRIVENER’S CAMP
COOLEMANRIDGE
FRITHROAD
AUSTRALIANINSTITUTE OF SPORT
BELCONNENTOWN
CENTRE
MT MUGGAMUGGA
ISAACSRIDGE
WANNIASSAHILL
GOOROOYAROONATURERESERVE
KAMBAHPOOL
DISCOVERY TRAIL ENTRY
TUGGERANONGTOWN
CENTRE
TUGGERANONGWEIR
ATHLLONDRIVE
URAMBIHILLS
ARANDABUSHLAND
STROMLO FORESTPARK
FADDENPINES
NATIONAL ARBORETUMCANBERRA
JOHN KNIGHT MEMORIAL
PARK MT MAJURALOOKOUT
MULLIGANS FLAT WOODLAND
SANCTUARY
ONE TREE HILL
LOOKOUT
HALL VILLAGE
PARK
MT AINSLIELOOKOUT
RED HILLLOOKOUT
DAIRY FARMERS
HILL LOOKOUT
FEDERAL HIGHWAYWATSON
JACKIEHOWECRES
REMEMBRANCEPARK
MULLIGANS FLAT
MTMAJURA
MTAINSLIE
BLACKMOUNTAIN
BLACKMOUNTAIN
PERCIVALHILL
REDHILL
BULLENRANGE
SECTION 1PARLIAMENT HOUSETO WATSON
SECTION 7TUGGERANONGTOWN CENTRE TO PARLIAMENT HOUSE
SECTION 2WATSON TO NORTHERN BORDER CAMPSITE
SECTION 3NORTHERN BORDER CAMPSITE TO HALL VILLAGE
SECTION 4HALL VILLAGE TO BLACK MOUNTAIN
SECTION 5BLACK MOUNTAIN TO STROMLOFOREST PARK
SECTION 6STROMLO FOREST PARKTO TUGGERANONG TOWN CENTRE
RIDE & WALK TRACK
ALTERNATIVE ROUTE
WALK ONLY DETOURS
NO DOGS In all other reserve areas, dogs must be kept on leads
TRAIL HEAD – MAJOR
TRAIL HEAD – MINOR
MAJOR ATTRACTION / LANDMARK
NATURE RESERVE
LOOKOUT
TOILETS
SHOPS
CAFE/KIOSK
PARKING
NOTE: Check TAMS website for current trail information. Temporary detours may be in place in some locations.
ACT

29
ACTIVE TRAVEL
5. Principles
The Active Travel Framework includes four key principles to plan, deliver, encourage and manage for more active travel and healthier lifestyles.
PLAN:Includewalking,cyclingandridingwhenplanningforlanduseandtransport
DELIVER:Buildappropriateinfrastructureforwalkingandcyclingneeds
ENCOURAGE:Enablegreaterparticipationinwalking,cycling,ridingandaccessingpublictransport
MANAGE:Coordinateacrossagencies
ActivetravelcoordinationacrossACTdirectoratesTransport for Canberra highlights that consideration of active travel issues spans many areas including planning, policy, infrastructure, education/awareness and promotions. This means active travel implementation is covered by seven different directorates:
• Capital Metro Agency
• Chief Minister, Treasury and Economic Development
• Education and Training
• Environment and Planning
• Health
• Justice and Community Safety
• Territory and Municipal Services
Successful implementation relies heavily upon on adopting a collaborative approach across the various responsible directorates and between the network of staff working in the respective areas.
5.1 Plan
PLAN:Includeandprioritisewalking,cyclingandridingwhenplanningforlanduseandtransport
1.Workwithinaclearhierarchyofplanning » Integrate land use and transport planning
and relevant funding decisions.
» Identify main walking and cycling routes that are consistent with ACT planning and transport strategies.
2.Designnetworksofcontinuous,convenientconnections
» Enable short walking, cycling and riding trips for transport purposes.
» Improve access to and within major centres of employment, education, retail and community facilities, focusing on ‘20-minute catchments’ (the equivalent of walking 2 kilometres or cycling 5 kilometres).
3.Facilitateactive,vibrantcommunities » Develop places with a range of activities
such as cafes, shops and playgrounds that attract people to visit, play and stay and are connected to surrounding neighbourhoods and paths.
MORE INFORMATION:Canberra Connect 13 22 81 www.act.gov.au/centenarytrail
Report trail maintenance issues to Canberra Connect 132281. In emergency telephone 000.
MURRUMBIDGEERIVER
LAKE TUGGERANONG
BARTON HWY
NO
RT
HB
OU
RN
E A
VE
LAKE BURLEY GRIFFIN
MOLONGLORIVER
LAKE GINNINDERRA
GUNGAHLINTOWN CENTRE
KA
MBA
H POOL RD
GUNDAROO DR
HO
RS
E P
AR
K D
R
EU
CU
MB
EN
E D
R
HINDMARSH DR
LONG GULLY RD
ISABELLA DR
MU
GG
A L
AN
E
PARLIAMENTHOUSE
NORTHERNBORDER
CAMPSITE & REST AREA
HUGHIE EDWARDS REST AREA
ONE TREE HILL
ENTRANCE
ONE TREE HILL
REST AREA
AMY ACKMAN ST
FORDE
AUSTRALIANWAR
MEMORIAL
SCRIVENER’S CAMP
COOLEMANRIDGE
FRITHROAD
AUSTRALIANINSTITUTE OF SPORT
BELCONNENTOWN
CENTRE
MT MUGGAMUGGA
ISAACSRIDGE
WANNIASSAHILL
GOOROOYAROONATURERESERVE
KAMBAHPOOL
DISCOVERY TRAIL ENTRY
TUGGERANONGTOWN
CENTRE
TUGGERANONGWEIR
ATHLLONDRIVE
URAMBIHILLS
ARANDABUSHLAND
STROMLO FORESTPARK
FADDENPINES
NATIONAL ARBORETUMCANBERRA
JOHN KNIGHT MEMORIAL
PARK MT MAJURALOOKOUT
MULLIGANS FLAT WOODLAND
SANCTUARY
ONE TREE HILL
LOOKOUT
HALL VILLAGE
PARK
MT AINSLIELOOKOUT
RED HILLLOOKOUT
DAIRY FARMERS
HILL LOOKOUT
FEDERAL HIGHWAYWATSON
JACKIEHOWECRES
REMEMBRANCEPARK
MULLIGANS FLAT
MTMAJURA
MTAINSLIE
BLACKMOUNTAIN
BLACKMOUNTAIN
PERCIVALHILL
REDHILL
BULLENRANGE
SECTION 1PARLIAMENT HOUSETO WATSON
SECTION 7TUGGERANONGTOWN CENTRE TO PARLIAMENT HOUSE
SECTION 2WATSON TO NORTHERN BORDER CAMPSITE
SECTION 3NORTHERN BORDER CAMPSITE TO HALL VILLAGE
SECTION 4HALL VILLAGE TO BLACK MOUNTAIN
SECTION 5BLACK MOUNTAIN TO STROMLOFOREST PARK
SECTION 6STROMLO FOREST PARKTO TUGGERANONG TOWN CENTRE
RIDE & WALK TRACK
ALTERNATIVE ROUTE
WALK ONLY DETOURS
NO DOGS In all other reserve areas, dogs must be kept on leads
TRAIL HEAD – MAJOR
TRAIL HEAD – MINOR
MAJOR ATTRACTION / LANDMARK
NATURE RESERVE
LOOKOUT
TOILETS
SHOPS
CAFE/KIOSK
PARKING
NOTE: Check TAMS website for current trail information. Temporary detours may be in place in some locations.
ACT

30
BUILDING AN INTEGRATED TRANSPORT NETWORK
Actions to better plan for active travel include:
• Develop a policy which guides the circumstances where cycling will be explicitly and implicitly provided within the transport infrastructure hierarchy as part of planning, project development, implementation and protection of corridors.
• Continue integration (including improved data collection) of walking and cycling travel modes into the Canberra Strategic Transport Model.
• Audit walking and cycling connections to the public transport network and complete missing connections, subject to funding decisions by government.
• Undertake ongoing data collection to improve monitoring of route usage including the number of users, demographic of users and trip generators.
• Prepare an investment plan for walking and cycling infrastructure.
• Develop a walking and cycling network with high- quality cycling infrastructure that is safe and well signposted, offering direct routes to destinations and integrated with public transport.
• Ensure that Active Living Principles are embedded in planning policy.
• Identify main walking and cycling routes within statutory/strategic planning policy documents (i.e. Territory Plan, National Capital Plan) including a new Cycling and Walking General Code within the Territory Plan.
• Embed walking and cycling network maps and documentation into the planning process.
• Prepare and release Strategic Cycle Network Plan Summary Document.
• Complete the walking and cycling network within and between the town and group centres and major employment areas, subject to funding.
• Identify barriers for access to and within major centres.
• Support mixed land use and the vitality of town and group centres through implementation of master plan recommendations.
• Undertake feasibility studies to inform future government funding decisions.
Changing urban settings and active communitiesThe focus of urban planning in Canberra is now much more responsive to place-specific needs to reinforce the function of streets as valuable and important public places and create a city where everyone can take advantage of its networks of open spaces and distinct neighbourhoods to promote participation in a vibrant civic and cultural life.
It is important to understand the diverse range of people who walk, cycle or ride and to provide routes and facilities that respond to their needs.
By better understanding who uses the network and how, we establish better walking and cycling connections to and within these places. Connectivity and a high level of amenity will make these locations more accessible, lively and enjoyable.
Key locations such as Kingston Foreshore, Braddon, the city, New Acton and the town centres are going through urban renewal to provide higher density living options and mixed-use development. This will enable more people to live closer to the places where they work, study, shop, socialise and access services and encourages active travel options.
Similarly, walking and cycling networks need to integrate at all levels of urban planning and design. This approach has underpinned master planning for all new residential estates. New developments such as Lawson and Bonner have translated this planning approach to the provision of extensive cycling and pedestrian paths that encourage active travel throughout the suburbs, connecting the local shops, school, neighbourhood oval, picnic areas and parks.
Walking and cycling networksThe ACT has extensive walking and cycling networks. All footpaths in the ACT are shared paths between pedestrians and cyclists, unless otherwise marked. Broadly, the walking and cycling network is categorised into off-road community routes that are shared between bicycles and pedestrians and on-road routes that are used by cyclists. Figure 20 provides an indicative diagram of these categories at main, local and access or connector levels.
The Walking and Cycling Network (i.e. the current and future paths and cycle routes) includes four different route types to provide different travel options to cater to people’s different travel needs.
Figure 20: IndicativediagramofcategoriesintheACTwalkingandcyclingnetworks

31
ACTIVE TRAVEL
Local on road cycle lanes
Changing urban settings and active communitiesThe focus of urban planning in Canberra is now much more responsive to place-specific needs to reinforce the function of streets as valuable and important public places and create a city where everyone can take advantage of its networks of open spaces and distinct neighbourhoods to promote participation in a vibrant civic and cultural life.
It is important to understand the diverse range of people who walk, cycle or ride and to provide routes and facilities that respond to their needs.
By better understanding who uses the network and how, we establish better walking and cycling connections to and within these places. Connectivity and a high level of amenity will make these locations more accessible, lively and enjoyable.
Key locations such as Kingston Foreshore, Braddon, the city, New Acton and the town centres are going through urban renewal to provide higher density living options and mixed-use development. This will enable more people to live closer to the places where they work, study, shop, socialise and access services and encourages active travel options.
Similarly, walking and cycling networks need to integrate at all levels of urban planning and design. This approach has underpinned master planning for all new residential estates. New developments such as Lawson and Bonner have translated this planning approach to the provision of extensive cycling and pedestrian paths that encourage active travel throughout the suburbs, connecting the local shops, school, neighbourhood oval, picnic areas and parks.
Walking and cycling networksThe ACT has extensive walking and cycling networks. All footpaths in the ACT are shared paths between pedestrians and cyclists, unless otherwise marked. Broadly, the walking and cycling network is categorised into off-road community routes that are shared between bicycles and pedestrians and on-road routes that are used by cyclists. Figure 20 provides an indicative diagram of these categories at main, local and access or connector levels.
The Walking and Cycling Network (i.e. the current and future paths and cycle routes) includes four different route types to provide different travel options to cater to people’s different travel needs.
Figure 20: IndicativediagramofcategoriesintheACTwalkingandcyclingnetworks
Walking and Cycling Network
Main on road cycle lanesMain community shared paths
Local community shared paths
Access shared paths Connector streets and mixed use
These include Community Routes, On-road Routes, Accessible Pedestrian Routes and Recreational Routes.
Primarily, there are two different but integrated route types:
• Community Routes cater for walking and cycling trips for people of all ages (mainly using off-road paths and some on-street cycling on low speed/ low-volume streets).
• On-road Routes are cycle-only routes, made up of cycling facilities within the roadway that cater mainly to commuter and fitness (training) riders.
Community routes are the backbone of the active travel network. They comprise a three level hierarchy similar to the road system:
• Main community routes connect town and group centres and provide a higher level of amenity such as greater path width, priority at intersections, directional signage and lighting.
• Local community routes connect to the main routes and local centres and major community facilities.
• Access routes represent the ‘last steps’ to connect users directly to their front door.
The other two route types are for special needs and recreation:
• Accessible pedestrian routes at town, group and local centres with treatments to assist visually impaired and disabled people are usually within the community routes network.
• Recreational routes that highlight the overlay of paths and roads are used for recreational walking and cycling.
Recreational routes include:
• Principal recreation trails such as the Centenary Trail, the lake paths and other main trails within open space/parkland. These may include trails for horse riding.
32
BUILDING AN INTEGRATED TRANSPORT NETWORK
• Principal cycle racing/training routes, where cycle racing and training activities are most common on the road network. This informs signage installation and consideration of impacts on these users in the planning for works or development along these routes.
The Walking and Cycling Network provides an important choice in facilities to meet individual user needs. Needs may depend on confidence, time and whether they are travelling to work, school or for recreation.
Route choice in the network must be responsive to an ever-evolving and diverse user profile. An on-road lane may provide a suitable option for a confident rider to get to work and a parallel off-road path creates an opportunity for a less experienced school student to safely ride to school or the local shops.
ACT Strategic Cycle Network PlanThe Strategic Cycle Network Plan (SCN Plan) informs a phased development of the cycle network over the next 10 to 15 years linked with future land development and urban growth. It provides indicative timings of cycling infrastructure delivery in growth corridors, employment areas and growth centres in the ACT.
The SCN Plan is based on a range of quantitative demand drivers for cycling and is underpinned by extensive stakeholder and community consultation with a range of organisations and community groups including Pedal Power, the Heart Foundation and the Bicycle Advisory Group.
The SCN Plan identifies indicative infrastructure projects and non-infrastructure initiatives aimed at increasing cycling for all cyclists in the 8–80 age group for journey-to-work and recreational trips. The document also provides some guidance on considerations to address the needs of pedestrians, primarily within centres.
A range of network strategy options were considered in developing the SCN Plan based on a hierarchical network approach:
1. City centric that focuses on improving connections between the main town centres.
2. Town centre centric that aims to improve connections within the town centre as well as within five kilometres of the town centres.
3. Combination of options 1 and 2 that concentrates on filling the gaps in the network.
4. Complete Strategic Cycle network that connects the city centre to town centres and local routes by filling gaps as well as improving the standard of the whole network.
The Strategic Cycle Network Concept shown in Figure 21, aims to deliver an infrastructure network that supports a mixture of linear travel to the city centre and local town centre/village based trips and builds upon the existing cycling and pedestrian networks by:
• upgrading Primary corridors to access town centres, major growth centres, areas of employment and hubs of activity, and
• improving cycle access within Secondary zones covering a five kilometre radius around town and group centres, areas of employment, major growth centres and hubs of activity.
A potential scenario for the cycle network, representing how the SCN Plan may be delivered, is aimed at increasing cycling in the short, medium and long terms.
• Short-term projects predominantly relate to committed projects and supportive works to improve existing facilities such as signage in the Primary corridors and Secondary zones.
• Medium to long-term projects relate to addressing gaps in the Primary corridors and Secondary zones and improvements to the standard of the infrastructure. This may include:
» widening and segregation of shared paths
» intersection upgrades at key intersections to improve cycling priority and safety
» implementing separated cycle path facilities
» improving connections and integration between on- and off-road paths
» improving line markings and signage of on-road lanes.
The business case of the SCN Plan shows that investment in the proposed cycle network improvements would deliver a strong positive return to the ACT community. The indicative works to complete the network are estimated to cost $84.3 million (2013 prices, with 40% contingency, staged over the next 15 years, excluding GST).
Figure 21: ACTStrategicCycleNetworkPlan:PrimarycorridorsandSecondaryzones (majorgrowthcentresandareasofemployment)
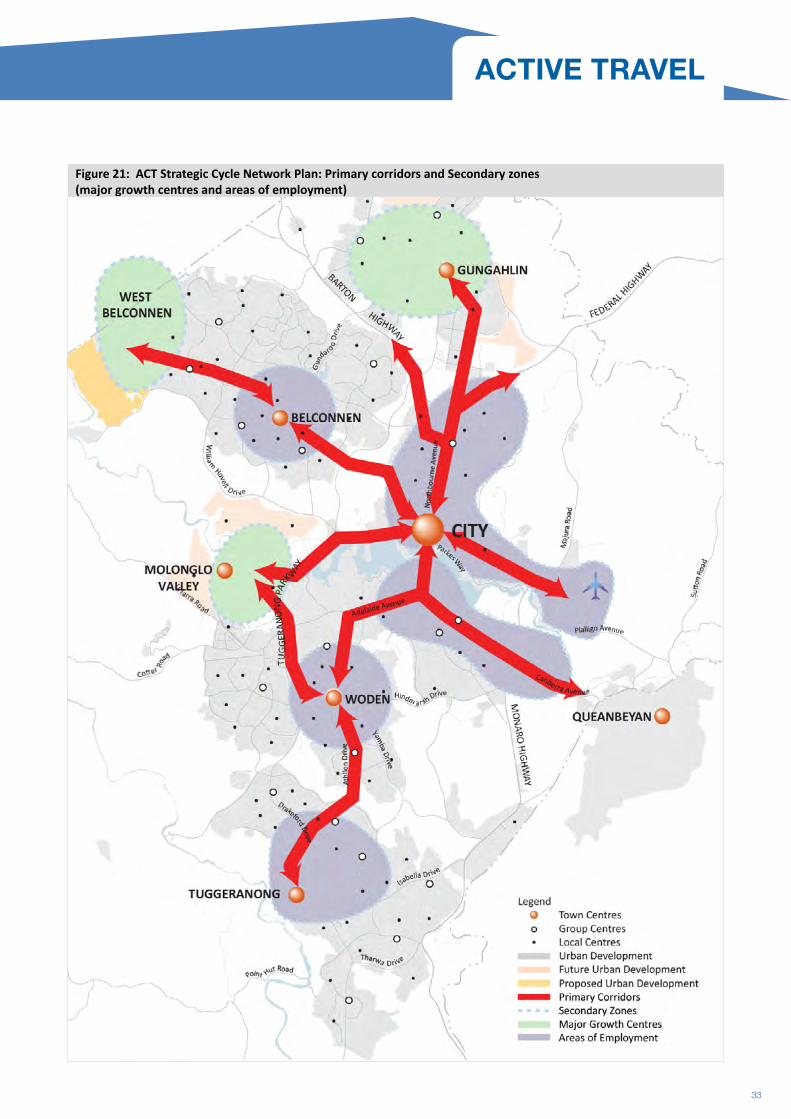
33
ACTIVE TRAVEL
3. Combination of options 1 and 2 that concentrates on filling the gaps in the network.
4. Complete Strategic Cycle network that connects the city centre to town centres and local routes by filling gaps as well as improving the standard of the whole network.
The Strategic Cycle Network Concept shown in Figure 21, aims to deliver an infrastructure network that supports a mixture of linear travel to the city centre and local town centre/village based trips and builds upon the existing cycling and pedestrian networks by:
• upgrading Primary corridors to access town centres, major growth centres, areas of employment and hubs of activity, and
• improving cycle access within Secondary zones covering a five kilometre radius around town and group centres, areas of employment, major growth centres and hubs of activity.
A potential scenario for the cycle network, representing how the SCN Plan may be delivered, is aimed at increasing cycling in the short, medium and long terms.
• Short-term projects predominantly relate to committed projects and supportive works to improve existing facilities such as signage in the Primary corridors and Secondary zones.
• Medium to long-term projects relate to addressing gaps in the Primary corridors and Secondary zones and improvements to the standard of the infrastructure. This may include:
» widening and segregation of shared paths
» intersection upgrades at key intersections to improve cycling priority and safety
» implementing separated cycle path facilities
» improving connections and integration between on- and off-road paths
» improving line markings and signage of on-road lanes.
The business case of the SCN Plan shows that investment in the proposed cycle network improvements would deliver a strong positive return to the ACT community. The indicative works to complete the network are estimated to cost $84.3 million (2013 prices, with 40% contingency, staged over the next 15 years, excluding GST).
Figure 21: ACTStrategicCycleNetworkPlan:PrimarycorridorsandSecondaryzones (majorgrowthcentresandareasofemployment)

34
BUILDING AN INTEGRATED TRANSPORT NETWORK
However, the community benefits over the next 30 years are expected to be almost twice as great as the costs (BCR =1.9). The proposed improvements are estimated to add around 400,000 cycle trips per year by 2031, plus 100,000 extra walking trips, resulting to around 500,000 additional active travel trips by ACT residents. Note that specific projects will be subject to future funding decisions by government.
The expected increase in active travel will deliver a range of benefits including:
• improved health from increased cycling and walking
• improved safety for all cycling
• reduced greenhouse gas emissions (estimated at more than 20,000 tonnes over the next 30 years) equivalent to 76.6 million kilometres per year driven by an average passenger vehicle50
• increased environmental benefits arising from reduced use of cars, resulting in reduced congestion, noise and air pollution.
Feasibility studies for a number of the indicative infrastructure projects identified in the potential cycle network option have already been completed including the Molonglo Valley to City Trunk Cycleway and studies of on-road cycle lanes along Macarthur Avenue, Limestone Avenue and Cooyong Street that are being progressed to design stages.
The SCN Plan also recommends investigating alternative ways of implementing network improvements such as continuing maintenance and upgrade programs and through public asset creation works.
Integrated land use and transport planning
An active travel network must operate and provide for different land uses, user profiles and transport modes. The objective of an active travel network is to provide a consistent and continuous connection between these different environments.
Route choice and the provision of facilities within the active travel network therefore must understand, respond to and integrate with the land use context, the different people within Canberra and how people need to get around.
The diagram at Figure 22 shows a potential road user hierarchy, reproduced from the recent Commonwealth Government ministerial statement, which takes into consideration different road users—pedestrians, bicycles, and motor vehicles. This user hierarchy summarises the priority for transport and land-use decision making, where the needs of active travel users in lower speed and volume environments are considered first.
The Bunda Street shareway is an example of a ‘shared’ street in an urban area. Figure 22 is only indicative and actual circumstances in the ACT may require full separation (i.e. Civic Cycle Loop) and features low traffic volumes, slow speeds and sharing of road space between pedestrians, bicycles and motor vehicles.
At the other end of the spectrum are roads such as the Majura Parkway, with high volumes of fast moving vehicles including freight. To accommodate all bicycle and pedestrian user types, on-road cycle lanes and a fully separated shared path are provided.
A variety of street types lie between these two ends of the spectrum: from 15–40 km/h streets with high pedestrian activity (such as around the city, town and group centres) to residential streets where streets average 50 km/h and urban arterial roads of 60–90 km/h.
Arterial roads with high speed and volume traffic are not suitable environments for inexperienced or less confident bicycle riders. However, the provision of cycling facilities is appropriate in this context for use by faster, more confident riders. The presence of cycling facilities on arterial roads normalises cycling as a form of transport and improves safety for riders choosing the roadway for priority and speed. This is particularly important for commutes longer than 20 minutes.
Figure 22: Potentialurbanroaduserhierarchy

35
ACTIVE TRAVEL
The diagram at Figure 22 shows a potential road user hierarchy, reproduced from the recent Commonwealth Government ministerial statement, which takes into consideration different road users—pedestrians, bicycles, and motor vehicles. This user hierarchy summarises the priority for transport and land-use decision making, where the needs of active travel users in lower speed and volume environments are considered first.
The Bunda Street shareway is an example of a ‘shared’ street in an urban area. Figure 22 is only indicative and actual circumstances in the ACT may require full separation (i.e. Civic Cycle Loop) and features low traffic volumes, slow speeds and sharing of road space between pedestrians, bicycles and motor vehicles.
At the other end of the spectrum are roads such as the Majura Parkway, with high volumes of fast moving vehicles including freight. To accommodate all bicycle and pedestrian user types, on-road cycle lanes and a fully separated shared path are provided.
A variety of street types lie between these two ends of the spectrum: from 15–40 km/h streets with high pedestrian activity (such as around the city, town and group centres) to residential streets where streets average 50 km/h and urban arterial roads of 60–90 km/h.
Arterial roads with high speed and volume traffic are not suitable environments for inexperienced or less confident bicycle riders. However, the provision of cycling facilities is appropriate in this context for use by faster, more confident riders. The presence of cycling facilities on arterial roads normalises cycling as a form of transport and improves safety for riders choosing the roadway for priority and speed. This is particularly important for commutes longer than 20 minutes.
Figure 22: Potentialurbanroaduserhierarchy

36
BUILDING AN INTEGRATED TRANSPORT NETWORK
Incorporating active travel into planning policyActive travel can also be supported by ensuring relevant principles are incorporated into Canberra’s planning and statutory framework. The ACT Government has been working in partnership with the Heart Foundation ACT, under the ACT Active Living Program, to identify where current policies and practices can be enhanced to create a more active built environment for the Canberra community. A key approach is to incorporate active living principles and concepts in the Territory Plan. This would will require a Territory Plan variation which may be commenced in 2015. Other considerations relevant to active travel include local area plans that support the connectivity of active travel networks.
The incorporation of Active Living Principles within planning policy can support an increase in active travel by ensuring new development or redevelopment creates environments that support transport choice; this includes the provision of safe and attractive places (including appropriate lighting, level footpaths) and providing supportive infrastructure such as shade, public seating and other amenities that encourage active travel participation.
Active travel can be supported at a broader strategic level by metropolitan-wide planning principles that relate to the enhancement of the public realm and the connection between employment and housing location and at an individual development scale through the provision of infrastructure that supports safe, efficient and comfortable journeys by foot, bicycle, riding or in accessing public transport. A proposed process in integrating active travel in planning and development is shown in Figure 23.
Walking and Cycling Network implementationAs part of the review and update of the existing design standards, a route network hierarchy context for cycling infrastructure in the ACT has been further developed to articulate the four new route types outlined earlier.
The Walking and Cycling Network (WCN) Practitioners’ Tool, when completed in 2015, will be available to allow for ‘on the ground’ implementation of the Active Travel Framework. This will enable network planners and facility designers to better understand where current routes exist and where new works must connect.
The network is depicted on an electronic ‘map’ that shows the alignments for walking and cycling routes that connect retail, employment and community centres through the existing and future routes through new and future development areas.
The designed route locations consider the purpose of the particular connection, whether it be for transportation, recreation or special needs. Routes for transportation consider the human-powered nature of active travel and follow the most direct and flattest alignments possible. Routes for recreation allow for the type of activity, whether it be relaxed hiking through the bush or cycling at high speed in a group for fitness.
The WCN recognises that walking and cycling routes do not have to be located within road corridors and may instead traverse ‘green’ corridors of connected parks and open space if this can provide a more attractive connection. (e.g. Sullivans Creek).
Figure23:Proposedplanninganddevelopmentprocess

37
ACTIVE TRAVEL
Walking and Cycling Network implementationAs part of the review and update of the existing design standards, a route network hierarchy context for cycling infrastructure in the ACT has been further developed to articulate the four new route types outlined earlier.
The Walking and Cycling Network (WCN) Practitioners’ Tool, when completed in 2015, will be available to allow for ‘on the ground’ implementation of the Active Travel Framework. This will enable network planners and facility designers to better understand where current routes exist and where new works must connect.
The network is depicted on an electronic ‘map’ that shows the alignments for walking and cycling routes that connect retail, employment and community centres through the existing and future routes through new and future development areas.
The designed route locations consider the purpose of the particular connection, whether it be for transportation, recreation or special needs. Routes for transportation consider the human-powered nature of active travel and follow the most direct and flattest alignments possible. Routes for recreation allow for the type of activity, whether it be relaxed hiking through the bush or cycling at high speed in a group for fitness.
The WCN recognises that walking and cycling routes do not have to be located within road corridors and may instead traverse ‘green’ corridors of connected parks and open space if this can provide a more attractive connection. (e.g. Sullivans Creek).
Figure23:Proposedplanninganddevelopmentprocess

38
BUILDING AN INTEGRATED TRANSPORT NETWORK
The WCN complements the SCN Plan. The SCN Concept shows corridors that may have increased commuter cycling demand from expected future growth. The SCN Plan sets the priority corridors and areas where facilities should be improved, including a timeline to meet the predicted future demand with reference to the WCN for the route alignments.
The WCN details the actual route alignments and provides a network of route hierarchies and a context for considering all bicycle rider types and pedestrian and trip purposes as shown in Figure 24.
The four route types are to be identified as part of concept planning for a development and the WCN updated to show the alignments required for the identified routes so the appropriate facilities are delivered during any staged development.
Submissions of development layouts through the planning, design and asset acceptance phases of the development sequence are to be assessed against the WCN to ensure the alignments and facilities meet the user needs and trip purpose of each connection in the network.
An audit of the constructed walking and cycling facilities at the completion of the development sequence is also proposed to ensure that the planning intentions identified at the beginning of the process have been delivered.
Figures 25 and 26 indicate how the Walking and Cycling Network could be applied with the response to different land uses, user profiles and the road network.
Project selection processThe ACT Government has articulated a range of long-term outcomes across different policy areas, such as increasing public transport and active travel mode share; encouraging healthy active lifestyles and reducing obesity and its related illnesses such as diabetes and coronary heart disease.
To ensure these targets are considered and prioritised in improving and expanding the active travel network, it is useful to have a framework that shows a clear link between planning outcomes and priorities, and the selection of projects to achieve these outcomes.
Figure 27 proposes an indicative diagram of how such a process could be adopted to the active travel agenda. It takes into account the auditing of existing networks and current usage patterns; the identification of priorities to achieve outcomes; the identification of gaps and opportunities; and the evaluation and selection of projects based on strategic priority and merit. The process for translation of the network into the investment planning process is depicted in Figure 28.
Figure24:AnExtractfromtheWalkingandCyclingNetwork(WCN)Practitioners’Tool*subjecttocurrentreviewoftheBelconnenTownCentreMasterPlan

39
ACTIVE TRAVEL
The four route types are to be identified as part of concept planning for a development and the WCN updated to show the alignments required for the identified routes so the appropriate facilities are delivered during any staged development.
Submissions of development layouts through the planning, design and asset acceptance phases of the development sequence are to be assessed against the WCN to ensure the alignments and facilities meet the user needs and trip purpose of each connection in the network.
An audit of the constructed walking and cycling facilities at the completion of the development sequence is also proposed to ensure that the planning intentions identified at the beginning of the process have been delivered.
Figures 25 and 26 indicate how the Walking and Cycling Network could be applied with the response to different land uses, user profiles and the road network.
Project selection processThe ACT Government has articulated a range of long-term outcomes across different policy areas, such as increasing public transport and active travel mode share; encouraging healthy active lifestyles and reducing obesity and its related illnesses such as diabetes and coronary heart disease.
To ensure these targets are considered and prioritised in improving and expanding the active travel network, it is useful to have a framework that shows a clear link between planning outcomes and priorities, and the selection of projects to achieve these outcomes.
Figure 27 proposes an indicative diagram of how such a process could be adopted to the active travel agenda. It takes into account the auditing of existing networks and current usage patterns; the identification of priorities to achieve outcomes; the identification of gaps and opportunities; and the evaluation and selection of projects based on strategic priority and merit. The process for translation of the network into the investment planning process is depicted in Figure 28.
Figure24:AnExtractfromtheWalkingandCyclingNetwork(WCN)Practitioners’Tool*subjecttocurrentreviewoftheBelconnenTownCentreMasterPlan

40
BUILDING AN INTEGRATED TRANSPORT NETWORK
MAJ
OR
COLL
ECTO
R
TOW
N
CEN
TRE
urba
n ar
ea
urba
n ar
ea
urban are
a
urban area
GRO
UP
CEN
TRE
MAJ
OR
COLL
ECTO
R
ARTE
RIAL
high
like
lihoo
d of
pel
eton
s if
prin
cipa
l cyc
le tr
aini
ng ro
ute
mai
n on
-roa
d ro
ute
visu
al se
para
tion
mai
n co
mm
unity
rout
eFa
cilit
y to
be
min
imum
3.0m
wid
e
Inte
rcon
nect
ed A
cces
spa
ths a
long
all
stre
ets
grad
e se
para
tion
of
mai
n co
mm
unity
rout
es
is hi
ghly
des
irabl
e
Mob
ility
scoo
ter
<110
kg a
nd <
10km
/h
May
cho
ose
to ri
de
usin
g on
-roa
d fa
ciliti
esde
pend
ing
on tr
affic
cond
ition
s and
trip
pur
pose
Bicy
cle
only
pat
h–su
itabl
e fo
r all
rider
type
s
no p
rope
rty
acce
ss
Mai
n Co
mm
unity
Rou
teFa
ciliti
es in
clud
e sh
ared
and
se
para
ted
path
s
Mai
n O
n-Ro
ad R
oute
Faci
lity
is ge
nera
lly v
isual
ly
sepa
rate
d bi
cycl
e la
nes
Acce
ss P
aths
Faci
lity
wid
th v
arie
s dep
endi
ng o
n an
y ov
erla
y of
pur
pose
ie
. nea
r sch
ools
Prin
cipa
l Cyc
le T
rain
ing
Rout
e
Ride
rs c
omfo
rtab
le tr
avel
ling
near
high
er sp
eed
traffi
c
All r
ider
type
s (8-
80)
WCN
Rou
tes b
etw
een
Tow
n an
d Gr
oup
Cent
res (
Esta
te D
evel
opm
ent s
ites)
Figure25
:Guida
nceon
theprov
isionoffa
ciliti
esin
respon
seto
land
use,u
serp
rofilesand
tran
sportm
odes(b
etwee
ntownan
dgrou
pcentres)

41
ACTIVE TRAVEL
Aged
car
e fa
cilit
y
MIN
OR
COLL
ECTO
R
WCN
Rou
tes b
etw
een
Grou
p an
d Lo
cal C
entr
es (E
stat
e De
velo
pmen
t site
s)LOCA
L AC
CESS
urban area
MAJ
OR
COLL
ECTO
R
5050
LOCA
L AC
CESS
50
5050
Play
grou
ndHi
ghSc
hool
50M
ain
Com
mun
ity R
oute
Faci
lities
incl
ude
shar
ed a
nd
sepa
rate
d pa
ths
Mai
n O
n-Ro
ad R
oute
Faci
lity
is ge
nera
lly v
isual
ly
sepa
rate
d bi
cycl
e la
nes
Loca
l Com
mun
ity R
oute
Faci
lity
min
imum
2m
wid
e pa
th
Acce
ss P
aths
- Fac
ility
wid
th v
arie
sde
pend
ing
on a
ny o
verla
y of
pur
pose
ie
. nea
r sch
ools
Ride
rs c
omfo
rtab
le tr
avel
ling
near
high
er sp
eed
traffi
c
All r
ider
type
s (8-
80)
urban are
a
LOCA
LCE
NTR
E
Hous
ing
fron
ts p
ath
for
pass
ive
surv
eilla
nce
prio
rity
cros
sing
path
s one
side
of r
oad
Spec
ial a
ttenti
on to
pat
hgr
ades
, ker
b ra
mps
and
cr
ossin
g fa
ciliti
es a
roun
dag
ed c
are
faci
lities
rider
s who
are
not
usu
ally
co
mfo
rtab
le o
n th
is ro
adty
pe m
ay u
se a
t tim
es
depe
ndin
g on
traffi
c Acce
ss p
ath
wid
ened
to
2.0m
adj
acen
t to
scho
olan
d on
bot
h sid
es
Loca
l com
mun
ity ro
ute
Faci
lity
to b
e m
inim
um
2.0m
wid
e path
s bot
h sid
es o
f roa
d
path
s bot
h sid
es o
f roa
d
GRO
UP
CEN
TRE
Figure26
:Guida
nceon
theprov
isionoffa
ciliti
esin
respon
seto
land
use,u
serp
rofilesand
tran
sportm
odes(b
etwee
ngrou
pan
dlocalcen
tres)

42
BUILDING AN INTEGRATED TRANSPORT NETWORK
CASE STUDY – New ActonSituated on the corner of Edinburgh Avenue and London Circuit, the New Acton mixed-use precinct incorporates art, retail, offices, hospitality and three apartment complexes surrounded by gardens.
In 2014 the New Acton precinct won the Australia Award for Urban Design for a completed large-scale project. The award recognises and rewards the nation’s highest quality urban design.
New Acton, which was created through private-sector investment, is an exemplar of Canberra’s potential to create attractive, lively precincts that encourage ‘lingering’ and socialising amongst the community. It includes a community vegetable garden, arts program, and Acton Walkways tours to visit over 90 sculptures, 30 heritage sites, national icons, art, music and film venues.
Figure28:investmentPlanningProcess
Figure27:Indicativeprocessdiagramfromauditofcurrentnetworksandusagethroughtoprojectselection
Auditcurrentnetworks:
• Community routes• On-road cycle
routes• Bus routes• Recreation trails
Auditcurrenttravelpatterns:
• Daily travel to work or school
• Regular active travel to other locations and for other purposes
• Popular recreation areas
Identifyprioritiestoachieveoutcomes:
• Increase active travel / public transport mode share
• Shift short-distance car trips to walking + cycling; and mid-distance trips to public transport
• Improve access to: » town centres
(2 km walk, 5 km cycle)
» buses + future light rail (400-800 metres)
» schools, health + tertiary campuses
Identifygaps/opportunities:
• High priority areas with poor quality paths, hazards or blockages
• High pedestrian or cycling activity
• Popular locations, routes + intersections with safety issues
• Link future development + urban renewal areas to the network
Evaluate+selectprojects:
• Prepare options• Evaluate based on
strategic priority + merit
• Select projects for planning + budgeting
• Detailed planning, budget decisions + capital works
• Maintain regularly• Monitor outcomes
Project Selection
Current Networks Current use Priorities
Gaps/ Opportunities

43
ACTIVE TRAVEL
CASE STUDY – New ActonSituated on the corner of Edinburgh Avenue and London Circuit, the New Acton mixed-use precinct incorporates art, retail, offices, hospitality and three apartment complexes surrounded by gardens.
In 2014 the New Acton precinct won the Australia Award for Urban Design for a completed large-scale project. The award recognises and rewards the nation’s highest quality urban design.
New Acton, which was created through private-sector investment, is an exemplar of Canberra’s potential to create attractive, lively precincts that encourage ‘lingering’ and socialising amongst the community. It includes a community vegetable garden, arts program, and Acton Walkways tours to visit over 90 sculptures, 30 heritage sites, national icons, art, music and film venues.
Figure28:investmentPlanningProcess
CASE STUDY – Streets for CommunityThe ACT Government is exploring ways to better design and deliver Canberra’s streets. Streets for Community recognises that successful streets are more than just a conduit for traffic; they are also places to be, walk, and ride.
Streets are considered ‘good’ when they are used by nearby residents and businesses, provide appropriate space and design for a range of activities and feel safe and welcome. Good streets have a local character and sense of place, provide for a mix of development types, integrate service requirements, and encourage people to connect with their community.
Work to improve streets includes providing quality pedestrian and cycle paths that are seamlessly connected to broader walking and cycling networks. Intersections are important to prioritise direct, convenient and safe street crossings.

44
BUILDING AN INTEGRATED TRANSPORT NETWORK
CASE STUDY – The Netherlands Cycling is the highest transport planning priority for cities in The Netherlands, followed by walking, public transport and then vehicles. As a result, more people ride bikes than drive for trips under 4 kilometres and 27% of all urban trips are made by bicycle. People of all backgrounds and ages cycle and most children travel to school by bike.
The Netherlands’ cycling mode share peaked at 85% post World War II but dropped dramatically to 25% by the mid 1970s as cars were prioritised and cycling became increasingly unsafe. A groundswell of protest in the late 1970s resulted in a gradual shift back towards the prioritisation of cycling. Safe and connected cycling networks are now seen as necessary to support cycling trips. The Netherlands’ experience shows that cycling, if prioritised, can be a safe, convenient and viable urban transport option.53
CASE STUDY – San Francisco The city of San Francisco is a national leader in bicycle ridership, innovative cycling infrastructure and active living. In 2010 the City set a goal of 20% mode share for bicycles by 2020 and a 50% mode share by all non-private car modes by 2018.
Through optimising existing capacity, innovative facilities and user-sympathetic design, the city has witnessed an explosion in bicycling. The plan has yielded welcome gains. Apart from obvious public health benefits, between 2006 and 2014 the car to bicycle ratios inversed from 3:1 to 1:3.5, and retail sales growth along the corridors is unparalleled.
The broader outcomes for the city are increased levels of social activity, improved road user safety and a transformed urban setting - all at minimal public expense.54
Photo source: Mr Timothy Papandreou, Strategic Planning and Policy, San Francisco Municipal Transportation Agency.Photo Source: Stephen Hodge, Cycling Promotion Fund

45
ACTIVE TRAVEL
5.2 Deliver
DELIVER:Buildappropriateinfrastructureforwalkingandcyclingneeds
4.Createsafeenvironmentsforpedestriansandbicycleriders
» Separate and prioritise pedestrians and bicycles from each other and from motor vehicles in high-speed, high-volume traffic.
» Allocate or share road space, with appropriate speeds, in lower-traffic environments.
» Recognise the vulnerability of bicycles as road vehicles and pedestrians using the transport infrastructure.
5.Incorporatequalitypedestrianandbicyclefacilitieswhenbuildingotherinfrastructure
» Secure these facilities as part of development/redevelopment to avoid the need for expensive retrofitting.
» Incorporate quality pathways and mid- and end-of-trip facilities as part of project works.
» Encourage building owners and operators to provide end-of-trip facilities such as high-quality bicycle parking, change rooms and storage lockers.
6.Increasepublictransportcatchmentsthroughbetterpedestrianandbicycleaccess
» Improve pedestrian and bicycle access within 5–10 minutes of public transport stops, improve permeability where possible, and remove impediments to safe, convenient access.
7.Improvepathways,intersectionsandfacilities » Seek to prioritise pedestrians, bicycle riders
and public transport users at crossings and intersections, where appropriate.
» Provide mid-trip facilities such as water fountains, shade, seating, toilets and way-finding signage and end-of-trip facilities such as change rooms, bicycle parking, and storage facilities.
Delivery of walking and cycling infrastructure includes a focus on completing active travel networks to ensure that missing connections are completed.
Missing links and public realm improvements that support active travel have been identified through master planning processes for group and town centres.
Incorporating end-of-trip facilities for cyclists and achieving best practice in ACT Government tenanted buildings and facilities is an ongoing focus for delivery. Relevant codes and infrastructure standards will also be amended to support the incorporation of end-of-trip facilities in all new developments.
The ACT Government has allocated more than $4 million over four years from 2010–11 to expand the network of Park and Ride and Bike and Ride facilities, with a focus on the existing ‘rapid’ and ‘frequent’ bus services. This has included the construction of bike cages at important hubs and locations including Belconnen Community Station, Flemington Road at Harrison, Athllon Drive at Mawson and Melrose Drive at Lyons. A Bike and Ride facility has recently been opened at Cotter Road, North Weston; and one at Kippax centre is underway. Additional Bike and Ride facilities are proposed for Gungahlin Town Centre, Wentworth Avenue in Kingston, Canberra Avenue in Narrabundah, Cooleman Court at Weston, Tuggeranong Town Centre and Gundaroo Drive in Crace. Figure 29 shows the bike and ride locations in the ACT.
Actions to deliver better infrastructure to enable active travel include:
• Audit existing on-road cycle path system particularly in high-speed environments (70 km/h plus) to ensure facilities meet national guidelines.
• Amend design guides and standards to ensure they meet national guidelines.
• Review and update design standards to incorporate and align with changes in national guidelines. The update will also consider international planning and design better practice, such as the NACTO design guidelines.
• Implement active and ongoing review and research of improvements to network planning and design of facilities.
• Review and implement changes to planning of routes and facilities to improve consistency in the delivery of active travel facilities across the ACT.

46
BUILDING AN INTEGRATED TRANSPORT NETWORK
• Continue to deliver whole-of-government programs to improve walking and cycling conditions targeted to specific geographies and populations (e.g. Age-Friendly Suburbs and Active Streets pilot programs).
• Investigate opportunities to provide shared spaces, particularly in town or group centres where reduced speed limits have been established.
• Evaluate outcomes of shared space trials.
• Respond to recommendations from the Vulnerable Road User Inquiry through the ACT Road Safety Action Plan 2015–2018.
• Develop a framework to link the provision of active travel infrastructure to the land use planning and development process.
• Improve municipal infrastructure standards to facilitate the development of accessible bicycle and pedestrian focused infrastructure (including mid- and end-of-trip facilities).
• Review the Bicycle Parking General Code to ensure best-practice.
• Encourage building owners to meet best practice voluntary requirements such as Green Star ‘Design for Active Living’ building requirements.
• Investigate opportunities to provide quality end-of-trip facilities for ACT Government tenanted buildings and facilities.
• Expand Bike and Ride facilities at appropriate locations.
• Price parking appropriately to manage demand and encourage active travel modes.
• Continue to provide ‘missing links’ in the Walking and Cycling Network through the Community Path Program.
• Actively pursue opportunities to prioritise active travel at crossings and intersections.
• Audit availability of mid-trip facilities on main community pedestrian and cycling routes.
• Explore opportunities for private sector involvement in the development of public end- of-trip facilities.
• Improve amenity and wayfinding, with facilities along the way such as signage and rest stops.
A number of case studies are described on the following pages.
Design standards reviewAs part of improvements to deliver better facilities Roads ACT have undertaken a full review of the existing Design Standards for Urban Infrastructure (DSUI). The design standards provide the technical detail to deliver facilities against the planning objectives.
The main aim of the review is to provide a design standard to deliver consistent and sustainable facilities for the ACT region that is considerate of future needs, utilising improved practices and technology.
Figure29:Bikeandridemap
BIKE&RIDE MAP
Nor
thbo
urne
A v
e
BIKE&RIDE MAP Taylor
BonnerHorse Park Dr/Newlop Dr Ngunnawal
Hall
Ngunnawal
Gungahlin Marketplace Hibberson StForde Casey
Amaroo Kinlyside GUNGAHLIN
Fraser Crace Gundaroo Dr/Nudurr Dr Gungahlin
Dunlop Spence
Franklin Harrison
Charnwood Harrison Harrison
Flynn Flemington Rd/Nullabor Av Flemington Rd/Mapleton Av
CraceBelconnen Community Bus StationLatham
Macgregor Benjamin Way/Cohen St Kenny
McKellar
Belconnen Cohen St Station Mitchell
Kippax Flemington Rd/Well Station Dr Florey Bruce Holt Radford College
College St
DownerKippax Centre Watson
Hardwick Cres Page Bruce Northbourne Av/Phillip Av DownerCIT
BelconnenHawker Haydon Dr Bike rail Macquarie Bruce Lyneham
Hackett
Dickson Northbourne Av/Antill St
Dickson
BELCONNEN Weetangera O'Connor
Bruce Braddon ArandaCISAC
Ainslie College St Turner CENTRAL
Braddon CANBERRACity City Bus Station Bike locker
Mort St Reid
Acton Campbell Park
MOLONGLO Campbell Kingston Wentworth Av/Giles St
Russell
Parkes Duntroon
Yarralumla Molonglo Bike cageBarton Pialligo
The CausewayNorth Weston
Kirkpatrick St KingstonForrest
Deakin Railway StationCurtin
Manuka
Barton Narrabundah FyshwickLyons Hughes Brisbane Av Holder Melrose Dr
Garran Red Hill
Weston Lyons Woden Bus Station
Bradley St & Footbridge Kingston
Woden Rivett Stirling
Waramanga Symonston Wentworth Av/Dawes St WESTON O'Malley
CREEK WODENChapman
VALLEYPearce Fisher
Mawson Park & Ride Athllon Dr
Torrens Farrer
Kambah
Kambah Athllon Dr/Learmonth Dr Wanniassa
FaddenErindale Hume
Macarthur
Oxley Gowrie Chisholm
Tuggeranong Bus Station Tuggeranong Pitman St
Monash Gilmore
Greenway
Richardson Isabella Plains
Bonython
Calwell
Gordon Theodore
Conder
TUGGERANONG
Banks
13 17 10 action.act.gov.au
Bike rail
Bike locker
Bike cage
13 17 10 action.act.gov.au

47
ACTIVE TRAVEL
• Expand Bike and Ride facilities at appropriate locations.
• Price parking appropriately to manage demand and encourage active travel modes.
• Continue to provide ‘missing links’ in the Walking and Cycling Network through the Community Path Program.
• Actively pursue opportunities to prioritise active travel at crossings and intersections.
• Audit availability of mid-trip facilities on main community pedestrian and cycling routes.
• Explore opportunities for private sector involvement in the development of public end- of-trip facilities.
• Improve amenity and wayfinding, with facilities along the way such as signage and rest stops.
A number of case studies are described on the following pages.
Design standards reviewAs part of improvements to deliver better facilities Roads ACT have undertaken a full review of the existing Design Standards for Urban Infrastructure (DSUI). The design standards provide the technical detail to deliver facilities against the planning objectives.
The main aim of the review is to provide a design standard to deliver consistent and sustainable facilities for the ACT region that is considerate of future needs, utilising improved practices and technology.
Figure29:Bikeandridemap
BIKE&RIDE MAP
Nor
thbo
urne
A v
e
BIKE&RIDE MAP Taylor
BonnerHorse Park Dr/Newlop Dr Ngunnawal
Hall
Ngunnawal
Gungahlin Marketplace Hibberson StForde Casey
Amaroo Kinlyside GUNGAHLIN
Fraser Crace Gundaroo Dr/Nudurr Dr Gungahlin
Dunlop Spence
Franklin Harrison
Charnwood Harrison Harrison
Flynn Flemington Rd/Nullabor Av Flemington Rd/Mapleton Av
CraceBelconnen Community Bus StationLatham
Macgregor Benjamin Way/Cohen St Kenny
McKellar
Belconnen Cohen St Station Mitchell
Kippax Flemington Rd/Well Station Dr Florey Bruce Holt Radford College
College St
DownerKippax Centre Watson
Hardwick Cres Page Bruce Northbourne Av/Phillip Av DownerCIT
BelconnenHawker Haydon Dr Bike rail Macquarie Bruce Lyneham
Hackett
Dickson Northbourne Av/Antill St
Dickson
BELCONNEN Weetangera O'Connor
Bruce Braddon ArandaCISAC
Ainslie College St Turner CENTRAL
Braddon CANBERRACity City Bus Station Bike locker
Mort St Reid
Acton Campbell Park
MOLONGLO Campbell Kingston Wentworth Av/Giles St
Russell
Parkes Duntroon
Yarralumla Molonglo Bike cageBarton Pialligo
The CausewayNorth Weston
Kirkpatrick St KingstonForrest
Deakin Railway StationCurtin
Manuka
Barton Narrabundah FyshwickLyons Hughes Brisbane Av Holder Melrose Dr
Garran Red Hill
Weston Lyons Woden Bus Station
Bradley St & Footbridge Kingston
Woden Rivett Stirling
Waramanga Symonston Wentworth Av/Dawes St WESTON O'Malley
CREEK WODENChapman
VALLEYPearce Fisher
Mawson Park & Ride Athllon Dr
Torrens Farrer
Kambah
Kambah Athllon Dr/Learmonth Dr Wanniassa
FaddenErindale Hume
Macarthur
Oxley Gowrie Chisholm
Tuggeranong Bus Station Tuggeranong Pitman St
Monash Gilmore
Greenway
Richardson Isabella Plains
Bonython
Calwell
Gordon Theodore
Conder
TUGGERANONG
Banks
13 17 10 action.act.gov.au
Bike rail
Bike locker
Bike cage
13 17 10 action.act.gov.au

48
BUILDING AN INTEGRATED TRANSPORT NETWORK
CASE STUDY – Investing in Canberra’s walking and cycling pathsIn 2013–14 over $4.5 million of new walking and cycling programs and infrastructure were delivered by the ACT Government. This constitutes around $11.75 per person in the ACT. Projects included:
• Feasibility studies such as the Molonglo Valley to City Cycleway: $900,000
• Forward design of walking and cycling projects such as the Civic Cycle Loop: $773,000
• Construction of cycle facilities at Yamba Drive Shared Path and Civic Cycle Loop: $1,750,000
• Upgrades to existing walking and cycling infrastructure as part of the capital upgrades program: $1,100,000.
CASE STUDY – Bike racks on busesOver 80% of ACTION buses are fitted with bike racks. It is the most extensive network of bicycle-rack enabled bus routes in Australia. Customers can ride to a bus stop, hop on the bus with their bike, then finish their journey by bicycle. It is also proving useful for customers who only want to ride one way. There is no additional fare for using the bike racks, and NXTBUS real time information system shows which buses have bike racks fitted. The ACT Government has expanded its commitment to bike racks on buses by including them on the higher capacity articulated and higher capacity rigid (14.5 metre ) fleet. It is expected that 98% of the bus fleet will be fitted with bike racks over time.
CASE STUDY – Trial of bicycle lane markers on roadsA range of devices are being trialled with the aim of improving the safety of on-road bicycle lanes by providing some defined separation from other traffic. Four types of devices are being trialled at five on-road sites across Canberra where the separation between bicycles and motor vehicles could be improved. The different devices, ranging from tactile line marking to raised mountable kerbing, will help identify the edge lines of the cycle lane and adjacent motor vehicle traffic. Roads ACT are currently finalising a 12 month trial, with reporting due in July 2015. It is likely that one of the recommendations will be that another device will be trialled separately in the future.

49
ACTIVE TRAVEL
CASE STUDY – Way finding signage
People like to be able to know where they are and where they are going. The ACT Government, through Roads ACT, has been working for many years to design and install signage to help pedestrians and bicycle riders navigate the off-road path system. Since 2008 approximately 170 kilometres of existing Main Community Routes have had $800,000 of wayfinding signage installed. Other improvement works have been undertaken at the same time, such as removing redundant signage and installing line marking and rest rails. Capital upgrade works have been prioritised to improve narrow pathways, lighting and crossings along these routes.
More recently, a revised wayfinding signage system has been developed that includes signage on Local Community Routes as well as an upgrade to the existing Main Community Routes signage system to resolve identified issues and reflect contemporary practices in other jurisdictions.
CASE STUDY – End-of-trip facilities
The Green Building Council of Australia’s Green Star ratings tool, which covers most building types including commercial, retail and educational buildings, gives additional credits for providing quality end-of-trip facilities such as change rooms and showers, bicycle parking and secure lockers.
There are 49 buildings in the ACT with Green Star Ratings certification; eight have full 6 Star Green Star Rating. The Frank Fenner Building, ISIS Group Australia on Marcus Clarke Street and 9/31 City West Offices all gained credits for having many frequent bus routes operating nearby and for installing bicycle facilities such as secure bicycle storage and accessible shower and change facilities. Educational buildings with 6 Star Green Star ratings include Gold Creek Primary School Environment Centre and Canberra Institute of Technology Sustainable Skills Training Hub, both of which have bicycle parking for students and staff, nearby public transport, dedicated pedestrian routes, travel plans with a site-specific transport assessment, and reporting on sustainable transport initiative.55

50
BUILDING AN INTEGRATED TRANSPORT NETWORK
CASE STUDY – Lowering Speed Limits in the ACTCanberra city centre and Tuggeranong and Belconnen town centres now feature a 40 km/h speed limit around much of their high-pedestrian activity areas. A 10 km/h decrease in speed limits, from 50–40 km/h, can reduce the risk of death by 50% for pedestrians and bicycle riders.56
Based on the evaluation of the project, lower speed limits have already contributed to safer environment for walking, cycling and riding around all centres while having little or no impact on vehicle travel times and business in those areas.
• Majority of respondents (88%) supported the 40km/h area boundaries.
• There was general acceptance for the project with 72% support in all three centres.
• Close to half of the respondents (41% and 45%) in all three centres noticed a reduction in travel speeds and the resulting improvement in safety for vulnerable road users.
•

51
ACTIVE TRAVEL
CASE STUDY – Civic Cycle Loop
The 3.2 kilometre Civic Cycle Loop provides a high quality path for bicycle riders travelling in the city centre. The path helps separate bicycle riders from both congested pedestrian footpaths and motor vehicle traffic.
Once complete, the loop will connect Marcus Clarke, Rudd, Bunda and Allara Streets in the city centre. It will also connect to the key routes leading into the city including the Sullivans Creek path from north Canberra and the two overpass crossings of Parkes Way that link to routes servicing southern Canberra and Lake Burley Griffin.
CityHillSix million dollars has been committed for design and construction over a four-year period. The loop is being delivered in four stages; the first two stages were opened in March 2013 at Marcus Clarke and Rudd Streets. Construction of the Allara Street section opened to the public during the Ride to Work Day in mid-October 2014. Construction of the Bunda Street section, which will be a shareway for bicycles, pedestrians and motor vehicles, began in September 2014 and completed in April 2015.
BundaStreetshareway
The Bunda Street shareway will be a 20 km/h zone with minimal use of signage and line marking. All road users – pedestrians, bicycle riders and motor vehicles – will have to actively navigate and share the area, avoiding conflicts with others. The shareway will generally be open to traffic movement, with reduced and more efficient on-street parking and loading zones.
Key elements of the Bunda Street shareway will include:
• a 20 km/h shared zone between Akuna and Mort Streets
• no marked motor vehicle or bicycle lanes
• raised entry thresholds at each end of Bunda Street
• pavement design/messages indicating that it is a special area
• additional vegetation and street trees
• increased vibrancy and community engagement through pop up cafes, festivals, markets and exhibition opportunities.

52
BUILDING AN INTEGRATED TRANSPORT NETWORK
CASE STUDY – Age-friendly neighbourhoods
Canberra is part of the World Health Organisation’s (WHO) Global Network of Age-Friendly Cities – a group of jurisdictions that seek to improve the living experience of its senior residents. WHO’s checklist of essential features of age-friendly cities identifies eight domains: outdoor spaces and buildings, transportation, housing, social participation, respect and social inclusion, civic participation and employment, communication and information, community and health services.
The ACT Strategic Plan for Positive Ageing 2010–2014 recognises the need to better plan for, and accommodate the needs of, the ACT’s growing ageing population.
Recent consultation with older Canberrans has indicated concern about healthy cities, social inclusion and age-friendly suburbs. Older Canberrans advised that infrastructure to support their living experience could include widening of footpaths, providing seats at rest locations between destinations and bus stops, traffic island refuges at un-signalised road crossings and extended timing for signalised pedestrian crossings.
The government has allocated up to $500,000 over 2014–15 and 2015–16 to implement the Age-Friendly Suburbs project as a pilot to demonstrate how targeted infrastructure investment could support environments that promote physical activity and wellbeing for an ageing Canberra population.
Infrastructure that supports age-friendly neighbourhoods includes:
• new footpaths, widening of footpaths, extensions, connections
• traffic islands, refuge spots
• wheelchair ramps/pram ramps
• gradients alterations
• maintenance to existing pavement infrastructure
• community paths (catering for cycling, wheelchair, pedestrian, scooters)
• general ground level infrastructure upgrades
• street lighting and general pedestrian safety
• access to public transport stops and car parks
• car parking ground level modifications, signage and priority parking.

53
ACTIVE TRAVEL
5.3 Encourage
ENCOURAGE:Enablegreaterparticipationinwalking,cycling,ridingandaccessingpublictransport
8.Programstoencouragewalking,cycling,ridingandaccesstopublictransport
» Provide programs and incentives, such as workplace travel plans, to inform people’s choices about active travel and to encourage higher levels of participation.
» Increase employer awareness of active travel and end-of-trip facility benefits.
» Improve awareness and skills in the broader population, such as driver and cycling skills.
» Continue to support students, teachers and school communities to increase active travel to school.
» Continue to provide training for network planning and delivery practitioners..
Education, information and promotional activities have been shown to change travel behaviour where the appropriate facilities and infrastructure are in place to support walking, riding and public transport use. The best results are achieved when planning and infrastructure investments are supported by education and promotional activities.57-58
The actions to encourage active travel support this approach of coordinating behaviour change programs with infrastructure investment. Actions to encourage greater participation in active travel include:
• Support travel behaviour change programs to promote and encourage greater take-up of active travel for the journey to work.
• Investigate bike share opportunities and continue discussion with other parts of government about options for such a scheme in the ACT.
• Continue to promote the benefits of active travel and end-of-trip facility benefits to employers.
• Deliver road safety awareness programs for motorists, motorcyclists, cyclists and pedestrians to reduce crashes and crash rates and engender a culture of sharing the road system with others.
• Undertake workshops to assist the local civil design industry to adapt to the new walking and cycling standards being developed.
• Deliver the Active Travel to School Strategy to increase active travel to school through the Ride or Walk to School program.
• Investigate ways to promote active travel in all ACT schools.
• Build the capacity of ACT teachers to teach safe cycling in schools.
• Develop and implement a campaign to encourage parents of upper-primary school students to support their children to travel independently to school.
• Promote the concept of walking and riding at least part of the way to school.
• Provide training for practitioners on network route planning.
CASE STUDY – Heritage trailsThere are eight heritage trails in the ACT. These marked routes provide unique experiences to explore the wider ACT region. Once at a site, people are encouraged to explore on foot. Cycling is also encouraged around East Basin and West Basin of Lake Burley Griffin, Lake Ginninderra and Yerrabi Ponds to Mulligans Flat. ACT Heritage has partnered with various agencies to enhance the experience for locals and visitors as they engage with stories of our history. This includes the Centenary Trail. Further information is available at www.canberratracks.act.gov.au

54
BUILDING AN INTEGRATED TRANSPORT NETWORK
CASE STUDY – Promoting active travel in schoolsAlmost 50 schools across the ACT are participating in a three-year program to increase the number of students riding and walking to school, and increasing physical activity. The program is part of the ACT Government’s Ride or Walk to School, a game plan to encourage active travel in ACT schools launched in September 2012. Schools receive bikes and helmets, teacher training and curriculum resources as well as BMX and self-defence workshops to build the confidence of students.
Melrose High School was one of the first schools to implement the program and has enhanced its outdoor education mountain biking program to encourage more students to cycle. The enthusiasm of the school community resulted in a dirt bike track, which opened in June 2014. This track is an important part of school life and a valuable asset for the local community as it can be used before and after school and on weekends. The track and landscape were constructed for $105,000 and cater for all skill levels, from little ones learning to ride their first bicycle to the more adventurous.
The Southern Cross Early Childhood School’s Learn to Ride Centre opened in 2014. It is designed to prepare children to use Canberra’s many bike paths and roadways safely and responsibly and to promote physical activity. Bicycles, scooters and helmets are available.
The centre includes a fully-fenced cycle path with working traffic lights, pedestrian crossings and road safety signs. The $122,000 Learn to Ride facility was jointly funded by the school, the Education and Training Directorate, Anglicare, the NRMA and Territory and Municipal Services. It is open for all pre-school to Year 2 students in the Belconnen area.
In September 2014, Franklin Early Childhood School received a Learn to Ride facility that is designed to develop bike riding skills and teach children how to use bike paths typically found across the ACT.

55
ACTIVE TRAVEL
5.4 Manage
MANAGE:Coordinateacrossagencies
9.Ensurebestpracticegovernancearrangements,monitoringandevaluation
» Improve coordination and engagement across directorates to better plan, deliver, encourage maintain and evaluate facilities.
10.Partneracrossdirectorates,businessandcommunitytoachieveco-benefits » Partner with agencies and stakeholders to
improve safety, encourage behaviour change in support of increased walking, cycling, riding and use of public transport, and increase use of recreation facilities.
The coordination of government agencies and communication with stakeholders is essential to managing the delivery of active travel objectives. The importance of coordination is highlighted by the fact that active travel programs run across government directorates and contribute to meeting multiple government objectives including environmental, health and economic goals.
Actions to better manage active travel policies and programs include:
• Formalise the Active Travel Group’s continued role in coordinating cross-directorate programs.
• Collaborate with the Healthy Weight Initiative Steering Committee through the directorates’ existing membership.
• Establish an Active Travel Office including resourcing and appointing an active travel champion.
• Work with the National Capital Authority and regional councils to coordinate and promote the active travel agenda described in this framework cross-border and within the Parliamentary Zone.
• Consideration of a co-ordination framework (similar to the NACTO framework) to provide improved collaboration and knowledge sharing between Australian cities to improve Active Travel initiatives.
CASE STUDY – Capital CyclingOver the past two years, the ACT Government has supported the Canberra cycling community to join forces to share expertise, resources and a common concern to improve cycling in the ACT.
Capital Cycling has been supported through the Territory’s Sport and Recreation Grants Program, initially to seek a review of cycling in the ACT and whether this strategy would be supported. In 2014 initial start-up funding ($64,000) was allocated to bring ‘Capital Cycling’ to life.
Capital Cycling is an entity designed to manage services to the cycling community and promote opportunities in the spirit of coordination and integration, not to govern the individual member organisations. Capital Cycling has created a central home for cycling in the ACT with shared administrative support and office space.
Using these resources, Capital Cycling established Canberra’s Festival of Cycling, held in Spring 2014, which showcased the wide and varied major cycling events during the spring season with something for everyone, from the novice rider through to the challenge cyclist, across all cycling disciplines. This Festival is a key project for Capital Cycling in its first year of operation.
The foundation members are ACT BMX, Cycling ACT, Canberra Off-Road Cyclists (CORC) and Pedal Power ACT. Through these members Capital Cycling also engages key stakeholders such as Cycling Australia, Mountain Bike Inc, BMX Australia, Cycling Promotion Fund, Amy Gillett Foundation, ACT Veterans Association and commercial providers and suppliers.

6. Implementation and funding

57
ACTIVE TRAVEL
6. Implementation and funding
The principles and corresponding actions outlined in the Active Travel Framework are already embedded in a number of active travel initiatives being progressed by the ACT Government. The implementation plan at Appendix A outlines further how the key principles could be delivered or applied in practice, including the responsible directorates and indicative timings. These actions build on the existing actions under Transport for Canberra.
The implementation plan provides a focus for collaborative working amongst responsible agencies and highlights where this could assist implementation.
Some actions identified in the framework are currently underway. However, a number of the actions identified will have financial implications. Budget requirements for currently unfunded actions outlined in the implementation plan would be considered as part of future ACT Government budget processes.

58
BUILDING AN INTEGRATED TRANSPORT NETWORK
7. Appendices
7.1 Appendix A — Active Travel Framework Implementation Table
Key principle — PLAN: Include and prioritise walking, cycling and riding when planning for land use and transport
Sub-Principle Howtoimplementprinciple
Action LeadAgencies
2 yrs
5 yrs
10 yrs
1. Work within a clear hierarchy of planning
1.1 Integrate land use and transport planning and relevant funding decisions
Develop a policy which guides the circumstances where cycling will be explicitly and implicitly provided within the transport infrastructure hierarchy as part of planning, project development, implementation and protection of corridors. Continue integration (including improved data collection) of walking and cycling travel modes into the Canberra Strategic Transport Model.Audit walking and cycling connections to the public transport network and complete missing connections, subject to funding decisions by government.Undertake ongoing data collection to improve monitoring of route usage including number of users, demographic of users and trip generators.Prepare an investment plan for walking and cycling infrastructure.Develop a walking and cycling network with high-quality cycling infrastructure that is safe and well sign posted, offering direct routes to destinations and integrated with public transport.
EPD CMTEDDTAMSD
• • •
Ensure that Active Living Principles are embedded in planning policy.
EPDTAMSD
•
1.2 Identify main walking and cycling routes that are consistent with ACT planning and transport strategies
Identify main walking and cycling routes within statutory/strategic planning policy documents (i.e. Territory Plan, National Capital Plan) including a new Cycling and Walking General Code within the Territory Plan. Embed walking and cycling network maps and documentation into the planning process.
TAMSD EPD
• •
Prepare and release Strategic Cycle Network Plan Summary Document
EPD •

59
ACTIVE TRAVEL
Sub-Principle Howtoimplementprinciple
Action LeadAgencies
2 yrs
5 yrs
10 yrs
2. Design networks of continuous, convenient connections
2.1 Enable short walking, cycling and riding trips for transport purposes
Complete walking and cycling network within and between the town and group centres and major employment areas, subject to funding.
EPDTAMSD
• • •
2.2 Improve access to and within major centres of employment, education, retail and community facilities, focusing on 20-minute catchments (the equivalent of walking 2 kilometres or cycling 5 kilometres)
Identify barriers for access to and within major centres.
EPD • •
3. Facilitate active, vibrant communities
3.1 Develop places with a range of activities such as cafes, shops and playgrounds that attract people to visit, play and stay and are connected to surrounding neighbourhoods and paths.
Support mixed land use and the vitality of town and group centres through implementation of master plan recommendations.Undertake feasibility studies to inform future government funding decisions.
EPDCMTEDDTAMSD
• • •

60
BUILDING AN INTEGRATED TRANSPORT NETWORK
Key principle — DELIVER: Build appropriate infrastructure for walking and cycling needs
Sub-Principle Howtoimplementprinciple
Action LeadAgencies
2 yrs
5yrs
10 yrs
4. Create safe environments for pedestrians and bicycle riders
4.1 Separate and prioritise pedestrians and bicycles from each other and from motor vehicles in high-speed, high-volume traffic.
Audit existing on-road cycle path system particularly in high speed environments (70 km/h plus) to ensure facilities meet national guidelines. Amend design guides and standards to ensure they meet national guidelines.Review and update design standards to incorporate and align with changes in national guidelines. The update will also consider international planning and design better practice, such as the NACTO design guidelines.Implement active and ongoing review and research of improvements to network planning and design of facilities.Review and implement changes to planning of routes and facilities to improve consistency in the delivery of active travel facilities across the ACT.Continue to deliver whole-of-government programs to improve walking and cycling conditions targeted to specific geographies and populations (e.g. Age-Friendly Suburbs and Active Streets pilot programs).
TAMSD • •
4.2 Allocate or share road space, with appropriate speeds, in lower-traffic environments.
Investigate opportunities to provide shared spaces, particularly in town or group centres where reduced speed limits have been established.Evaluate outcomes of shared space trials.
EPDJACSDTAMSD
• •
4.3 Recognise the vulnerability of bicycles as road vehicles and pedestrians using the transport infrastructure.
Respond to recommendations from the Vulnerable Road User Inquiry through the ACT Road Safety Action Plan 2015-2018.
JACSD • •
5. Incorporate quality pedestrian and bicycle facilities when building other infrastructure
5.1 Secure these facilities as part of development /redevelopment to avoid the need for expensive retrofitting.
Develop a framework to link the provision of active travel infrastructure to the land use planning and development process.
EPDTAMSDCMTEDD
• • •
5.2 Incorporate quality pathways and mid- and end-of-trip facilities, as part of project works.
Improve municipal infrastructure standards to facilitate the development of accessible bicycle and pedestrian focused infrastructure (including mid and end-of-trip facilities).
TAMSD •
5.3 Encourage building owners and operators to provide end-of-trip facilities such as high-quality bicycle parking, change rooms and storage lockers.
Review the Bicycle Parking General Code to ensure best-practice.Encourage building owners to meet best practice voluntary requirements such as Green Star ‘Design for Active Living’ building requirements.Investigate opportunities to provide quality end-of-trip facilities for ACT Government tenanted buildings and facilities.
EPDTAMSDCMTEDD
• •

61
ACTIVE TRAVEL
Sub-Principle Howtoimplementprinciple
Action LeadAgencies
2 yrs
5yrs
10 yrs
6. Increase public transport catchments through better pedestrian and bicycle access
6.1 Improve pedestrian and bicycle access within 5-10 minutes of public transport stops, improve permeability where possible and remove impediments to safe, convenient access.
Expand Bike and Ride facilities at appropriate locations.Price parking appropriately to manage demand and encourage active travel modes.Continue to provide ‘missing links’ in Walking and Cycling Network through the Community Path Program.
EPDTAMSD
• • •
7.Improve pathways, intersections and facilities
7.1 Seek to prioritise pedestrians, bicycle riders and public transport users at crossings and intersections, where appropriate.
Actively pursue opportunities to prioritise active travel at crossings and intersections.
EPDJACSDTAMSD
• •
7.2 Provide mid-trip facilities such as water fountains, shade, seating, toilets and way-finding signage and end-of-trip facilities such as change rooms, bicycle parking and storage facilities.
Audit availability of mid-trip facilities on main community pedestrian and cycling routes.Explore opportunities for private sector involvement in the development of public end- of-trip facilities.Improve amenity and wayfinding, with facilities along the way such as signage and rest stops.
TAMSDEPD
• •

62
BUILDING AN INTEGRATED TRANSPORT NETWORK
Key principle — ENCOURAGE: Enable greater participation in walking, cycling, riding and accessing public transport
Sub-Principle Howtoimplementprinciple
Action LeadAgencies
2 yrs
5yrs
10 yrs
8. Programs to encourage walking, cycling, riding and access to public transport
8.1 Provide programs and incentives such as workplace travel plans to inform people’s choices about active travel and to encourage higher levels of participation.
Support travel behaviour change programs to promote and encourage greater take-up of active travel for the journey to work.Investigate bike share opportunities and continue discussion with other parts of government about options for such a scheme in the ACT.
EPD •
8.2 Increase employer awareness of active travel and end-of-trip facility benefits.
Continue to promote the benefits of active travel and end-of-trip facility benefits to employers.
CMTEDDEPD
•
8.3 Improve awareness and skills in the broader population such as driver and cycling skills.
Deliver road safety awareness programs for motorists, motorcyclists, cyclists and pedestrians to reduce crashes and crash rates and engender a culture of sharing the road system with others. Undertake workshops to assist the local civil design industry to adapt to the new walking and cycling standards being developed.
JACSDTAMSDEPD
• •
8.4 Continue to support students, teachers and school communities to increase active travel to school.
Deliver the Active Travel to School Strategy to increase active travel to school through the Ride or Walk to School program. Investigate ways to promote active travel in all ACT schools.Build the capacity of ACT teachers to teach safe cycling in schools.Develop and implement a campaign to encourage parents of upper primary school students to support their children to travel independently to school.Promote the concept of walking and riding part of the way to school
HDETDEPDTAMSD
• •
8.5 Continue to provide training for network planning and delivery practitioners.
Provide training for practitioners on network route planning.
TAMSD • •

63
ACTIVE TRAVEL
Key principle — MANAGE: Coordinate across agencies
Sub-Principle Howtoimplementprinciple
Action LeadAgencies
2 yrs
5yrs
10 yrs
9. Ensure best practice governance arrangements, monitoring and evaluation
9.1 Improve coordination and engagement across directorates to better plan, deliver, encourage, maintain and evaluate facilities.
Formalise the Active Travel Group’s continued role in coordinating cross-directorate programs.Collaborate with the Healthy Weight Initiative Steering Committee through the directorates’ existing membership.
All • • •
Establish an Active Travel Office including resourcing and appointing an active travel champion.
EPD / TAMS
•
10. Partner across directorates, business and community to achieve co-benefits
10.1 Partner with agencies and stakeholders to improve safety, encourage behaviour change in support of increased walking, cycling, riding and use of public transport, and increase use of recreation facilities.
Work with the National Capital Authority and regional councils to coordinate and promote the Active Travel agenda described in this framework cross-border and within the Parliamentary Zone. Consideration of a co-ordination framework (similar to the NACTO framework) to provide improved collaboration and knowledge sharing between Australian cities to improve Active Travel initiatives.
TAMSDEPD
• • •

64
BUILDING AN INTEGRATED TRANSPORT NETWORK
7.2 Appendix B — Short term funding commitment to improve Active Travel
ActiveTravel(New) 2012-13$ 000’s
2013-14$ 000’s
2014-15$ 000’s
2015-16$ 000’s
2016-17$ 000’s
2017-18$ 000’s
2018-19$ 000’s
Total$ 000’s
Majura Parkway Offroad Shared User Path
4,340 1,260 4,400 10,000
Ashley Drive - Stage 2 (cycle network upgrades), Tuggeranong
450 450
‘William Slim/Barton Highway Cyclepath Bridge’
1,000 1,000 2,000
Civic and Braddon public realm improvements
500 1,000 15 1,515
Sullivans Creek cycle path improvements
1,500 15 30 1,545
Bowen Park cycle path 600 6 12 618
Belconnen Town Centre improved cycling connections - Feasibility Study
100 100
Dickson Bus Interchange Design 100 150 250
Corridor Active Travel Improvements
200 1,400 1,600
Gungahlin Bus Interchange Design 100 150 250
Kaleen and Tuggeranong Valley age friendly facilities
250 250 5 505
Kingston Group Centre - Pedestrian and cycling improvements - Feasibility Study
150 150
Molonglo to the City cycle highway - Design
200 200
Tuggeranong Town Centre improved cycling connections - Feasibility
100 100
West Belconnen to the City improved cycling connections - Feasibility study
100 100
Woden Town Centre cycle and pedestrian network improvements - design
250 250
Safety improvements lighting program - CUP
1,200 1,200
Isaacs Ridge Mountain bike trail network upgrade - CUP
185 185
Transport for Canberra (committed projects)
Walking and Cycling Stage 3 Urban Improvement
2,172 2,360 968 5,500
Walking and Cycling Infrastructure - Stage 4 (Feasibility)
900 900
Walking and Cycling Infrastructure - Stage 4 (Design)
761 12 773
Walking and Cycling Infrastructure - Stage 4 (Construction)
2,000 500 2,500

65
ACTIVE TRAVEL
ActiveTravel(New) 2012-13$ 000’s
2013-14$ 000’s
2014-15$ 000’s
2015-16$ 000’s
2016-17$ 000’s
2017-18$ 000’s
2018-19$ 000’s
Total$ 000’s
Community paths - Maintenance 4,625 3,539 3,776 3,870 3,967 19,777
Community Paths - Land Development
7,600 5,300 6,000 6,000 6,000 30,900
Active Travel (New)
Drinking Fountains 100 100
Bike Racks 50 50
Residential street improvements 400 400
ACTION - bike rack upgrades 110 110
ACT Active Living Program 170 170 340
Capital Upgrade Program1,2 1,350 2,333 3,683
Total 14,397 18,550 17,749 23,435 11,837 21 62 86,051Notes : 1. The TAMS Capital Upgrade Program for 2013-14 includes $1.1 million in foot and cycle path upgrades.
In addition there is $0.250 million for infill lighting including pathways.2. The amounts in the above table do not include off-road cycling paths or the significant capital investment and
operating costs of cycling facilities at Stromlo Forest Park.
2013–14 figures represents actual expenditure as per annual report.2014–15 combination of actual and predicted spend. 2015–16 as per budget papers.

66
BUILDING AN INTEGRATED TRANSPORT NETWORK
7.3 Appendix C — Existing policies and resources
DocumentnameandOrganisation Description
NATIONAL
NationalRoadSafetyStrategy2011–2020Department of Infrastructure and Regional Development
The target is to reduce road deaths and serious injuries by 30% by 2020. The strategy is based on Safe System principles with the guiding vision that no person should be killed or seriously injured on Australia’s roads. www.infrastructure.gov.au/roads/safety/national_road_safety_strategy/
NationalCyclingStrategy 2011–2016Australian Bicycle Council
The Australian Bicycle Council publishes a National Cycling Strategy every five years. The purpose is to coordinate the activities of various agencies across federal, state and local levels to deliver agreed-upon goals for cycling in Australia. Aims to double the number of people cycling by 2016.www.bicyclecouncil.com.au/publication/national-cycling-strategy-implementation-report-2013
NationalCyclingStrategy:ImplementationReport2013Australian Bicycle Council
Implementation progress report on the National Cycling Strategy.www.bicyclecouncil.com.au/publication/national-cycling-strategy-implementation-report-2013
NationalCyclingParticipationSurveyAustralian Bicycle Council
Measures cycling participation across Australia about the demographics of bicycle users, bicycle ownership and the amount of riding that is done. The Survey is conducted every two years for 10,000 households covering 25,000 people. The first baseline report was 2011.www.bicyclecouncil.com.au/publication/national-cycling-participation-survey
NationalDisabilityStrategy 2010–2020Department of Social Services
Signed by all three levels of government, the National Disability Strategy incorporates inclusive and accessible communities to ensure that people with disability live in accessible and well-designed communities with opportunity for full inclusion. It advocates for a public, private and community transport system that is accessible for the whole community.www.dss.gov.au/sites/default/files/documents/05_2012/national_disability_strategy_2010_2020.pdf
Walking,RidingandAccesstoPublicTransport:supportingactivetravelinAustraliancommunitiesDepartment of Infrastructure and Regional Development
Supports a number of national strategic plans already in place, provides a framework for improving active travel. https://infrastructure.gov.au/infrastructure/pab/urbanpolicy/active_travel/index.aspx
MoveIt:Australia’sHealthyTransportOptionsHeart Foundation and Cycling Promotion Fund
Ten recommendations to achieve a healthy and active Australia by 2030.www.heartfoundation.org.au/SiteCollectionDocuments/Move-It-Australias-Healthy-Transport-Options.pdf
MovePeople2030:AtransportplanforaproductiveandactiveAustraliaMoving People 2030 Taskforce
By 2030, Australia’s transport system should be a key foundation on which a prosperous, sustainable, liveable and healthy Australia is built. This report outlines how to achieve these outcomes, and what the benefits will be for Australia’s economy.www.heartfoundation.org.au/active-living/Documents/Moving-Australia-2030.pdf
TheBuiltEnvironmentandWalkingHeart Foundation
The Heart Foundation’s position statement on the built environment and walking.www.heartfoundation.org.au/active-living/Documents/Built-environment-position-statement.pdf
BlueprintforanActiveAustraliaHeart Foundation
Key government and community actions required to increase population levels of physical activity in Australia—2010 to 2013www.heartfoundation.org.au/active-living/Documents/Blueprint-for-an-active-Australia.pdf

67
ACTIVE TRAVEL
DocumentnameandOrganisation Description
HealthySpacesandPlacesHeart Foundation, Australian Local Government Association, Planning Institute
A national guide to designing places for healthy living. Web-based resource providing guidelines and advice.www.healthyplaces.org.au www.heartfoundation.org.au/active-living/Documents/HSP-Overview.pdf
CreatingPlacesforPeople:anationalurbandesignprotocolAustralian Sustainable Built Environment Council
The national urban design protocol is championed by 50 organisations including all three levels of government, business and communities. It has 12 principles for best practice urban design outcomes and processes including walkability, connectedness and vibrant places.www.urbandesign.org.au
AUSTRALIAN CAPITAL TERRITORY
TransportforCanberra 2012–2031ACT Government
Complemented by the new ACT Planning Strategy, Transport for Canberra will help the government plan transport and land use together. Walkable and cycleable local communities will be designed with easy access to goods and services.www.transport.act.gov.au/policy_and_projects/transport_for_canberra_policy
TransportforCanberra 2012–2031:ActiveTravelACT Government
Part 3 of Transport for Canberra addresses active travel. www.transport.act.gov.au/__data/assets/pdf_file/0004/397363/Active_Travel_EDS_ACT_Transport_Policy_FA_final_web.pdf
TowardsZeroGrowth:HealthyWeightActionPlanACT Government, Health Directorate
Sets a target of ‘zero growth’ for obesity. Includes a theme for urban planning that recognises that the built environment influences levels of physical activity for transport and recreation. The government will embed active living principles in its transport and urban planning processes.http://health.act.gov.au/c/health?a=dlpubpoldoc&document=2856
ACTRideorWalktoSchoolACT Government, Health Directorate
Aims to increase walking, cycling and use of public transport among school students. Participating schools receive bikes, helmets, maintenance support, personal safety sessions, road safety education, BMX skills development workshops and a range of other activities as part of the initiative.www.paf.org.au/site/rwts_program.phphttp://health.act.gov.au/health-services/population-health/health-improvement/health-promotion/healthy-children-and-young-people/ride-or-walk-to-school
ACTSmartSchoolsACT Government, EPD, Sustainability Policy
ACT Smart Schools is the ACT Government’s implementation of the Australian Sustainable Schools Initiative (AuSSI). The program assists schools to reduce their impact on the environment and spread key sustainability messages throughout the school community. www.actsmart.act.gov.au/your_school/actsmart_schools
ActiveLivingImpactChecklist(ACT)Heart Foundation
A tool for development in the ACT. The checklist prompts design and planning considerations for successful liveable communities in the ACT. Using ACT codes and design standards, the checklist is a valuable tool for those professionals in the ACT concerned with good design.www.heartfoundation.org.au/active-living/Documents/Active-Living-impact-checklist.pdf
RoadSafetyStrategyandActionPlansACT Government, JACS
The strategy provides a framework for addressing ACT road safety concerns over the next 10 years. The Action Plan provides a list of items to be progressed from 2011-14 aligned with the short term initiatives in the National Road Safety Strategy 2011-2020.www.justice.act.gov.au/safety_and_emergency/road_safety/act_road_safety_strategy_and_action_plans
StrategicCycleNetworkPlanACT Government, EPD, Major Projects and Transport
The ACT Strategic Cycle Network Plan examines pedestrian and cycle networks and potential improvements.www.transport.act.gov.au/policy_and_projects/transport_planning_studies/act_strategic_cycle_network_plan

68
BUILDING AN INTEGRATED TRANSPORT NETWORK
DocumentnameandOrganisation Description
CanberraandQueanbeyanCyclingandWalkingMapACT Government, EPD, Major Projects and Transport
The Canberra and Queanbeyan Cycling and Walking Map shows on-road-cycling lanes, shared use paths, unsealed paths, roads and free bicycle parking facilities.http://files.transport.act.gov.au/cyclingmap/index.html
CentenaryTrailACT Government, TAMS, Design and Development
The Centenary Trail is 145 kilometres of trails for walkers and bicycle riders that showcases Canberra and takes users on a journey between urban and rural environments. It is a mix of dirt paths, fire trails and sealed share paths.www.tams.act.gov.au/parks-recreation/recreational_activities/centenary-trail
DesignStandardsforUrbanInfrastructureDS13PedestrianandCyclingFacilitiesTerritory and Municipal Services (TAMS)
Outlines design requirements for walking and cycling infrastructure:DS13 Pedestrian and Cycle FacilitiesDS13 Pedestrian and Cycle Facilities – supplementDS13 Pedestrian and Cycle Facilities – supplementary drawingswww.tams.act.gov.au/__data/assets/pdf_file/0009/396891/DS13_Pedestrian_and_Cycle_Facilities.pdf
MakingWalkingCount–Canberra2010ACT Government
Presents the findings of a survey conducted for the Australian Capital Territory Government by the international organisation Walk21, to understand walkability in Canberra and local attitudes to walking.www.transport.act.gov.au/__data/assets/pdf_file/0008/398438/Making_Walking_Count.pdf
69
ACTIVE TRAVEL
8. Endnotes
1. ACT Government 2012, Towards Zero Growth: Healthy Weight Action Plan, p162. Australian Government 2011, Creating Places for People: an urban design protocol for Australian Cities, p15.3. http://active2020.com.au/4. Adapted, with amendments, from Australian Government (2013) Walking, Riding and Access to Public Transport:
supporting active travel in Australian communities, Department of Infrastructure and Transport, figure 1.45. Department of Infrastructure and Regional Development, 2013, State of Australian Cities 2013, Canberra/Queanbeyan
Factsheet.6. Australian Bureau of Statistics Census 2011, Journey to Work7. Australian Bureau of Statistics, 2006 and 2011 Census data for adult journeys to work. ABS 2011 Census Community
Profile for ACT, working population profile (WPP_8ACTE2011) table W218. Bob Nairn Consultant, June 2012, 2009 ACT Household Travel Survey Analysis, prepared. Survey conducted in 2009, of
1000 households, about all mode shares. It specifically asked about ‘purpose’ as the end destination of the trip.9. ibid.10. SKM, 2010, Making Walking Count – Canberra. Report for ACT Government by Walk21 organisation, table 3-5 (n=605)11. ibid.12. Australian Bureau of Statistics Census 2011, Journey to Work13. ABS 2011 Census Community Profile for ACT, working population profile (WPP_8ACTE2011) table W2114. Charting Transport, 2014, What does the census tell us about cycling to work? http://chartingtransport.
com/2014/01/27/census-cycling-to-work [accessed 26/8/14]15. Australian Bicycle Council 2013, National Cycling Participation Survey, Austroads. Phone survey included 887 households
in the ACT, totalling 2366 people16. Australian Bicycle Council 2011 and 2013, National Cycling Participation Survey, Austroads17. ACT Government 2011, Draft Report on Telephone Survey About Cycling in Canberra, by Winton Sustainable
Consultants, dated 21 Nov 2011. Phone survey of 1000 adults.18. ibid.19. ibid.20. Nairn Consultant, June 2012, op. cit., p. 2221. ABS, 2011 Census Community Profile for ACT, working population profile (WPP_8ACTE2011) table W2122. Mees, Groenhart, 2012, Transport Policy at the Crossroads: travel to work in Australian cities 1976-2011, table 1.723. Nairn Consultant, June 2012, loc. cit.24. ibid.25. ABS 2011 Census Community Profile for ACT, working population profile (WPP_8ACTE2011) table W21. 11,196 people
caught bus as ‘one method of travel’. 26. TMR Queensland, 2010, South East Queensland Public Transport User Survey27. ACT Government, 2014, Transport for Canberra Report Card – Snapshot28. ACT Government, 2010, Making Walking Count, prepared by Walk21 and SKM29. ACT Health 2014, Australian Capital Territory Chief Health Officer’s Report 2014, ACT Government, Canberra, ACT, p28 30. Institute for Health Metrics and Evaluation. The global burden of disease study 2010. BGD Profile: Australia. http://
www. healthdata.org/results/country-profiles. Accessed 1 October 201431. ACT Health 2014, op.cit., p2532. ACT Government 2012, loc.cit.33. ACT Health 2014, op. cit. p1434. ABS 2012, Environmental Issues: Waste Management, Transport and Motor Vehicle Usage, Mar 2012, 4602.0.55.002,
table 2.1 35. ACT Government 2011, loc.cit.36. Australian Medical Association, 2014, Physical Activity Position Statement.37. Queensland Department of Transport and Main Roads 2011, Benefits of inclusion of active transport in infrastructure
projects, prepared by SKM and PWC, table EX.1: benefits summary.38. Garrard, J. 2009, Active transport: children and young people, VicHealth.39. Christie, N, Towner, E, Cairns, S, Ward, H (2004). Children’s road traffic safety: an international survey of policy and
practice. Road Safety Research Report No. 47. London, Department for Transport.40. Lee, A. And March, A. 2010. ‘Recognising the economic role of bikes: sharing parking in Lygon Street, Carlton’
Australian Planner, Vol.47, Issue 2. Pp.85-93.

70
BUILDING AN INTEGRATED TRANSPORT NETWORK
41. Burden & Litman, 2011. America Needs Complete Streets, ITE Journal and Cortright, J. 2009. Walking the Walk: How Walkability Raises Home Values in U.S. Cities, CEOs for Cities.
42. Living Streets 2013, The Pedestrian Pound - Case study evidence suggests that well-planned improvements to public spaces can boost footfall and trading by up to 40%. Investing in better streets and spaces for walking can provide a competitive return compared to other transport projects with walking and cycling projects potentially increasing retail sales by up to 30%.
43. Department of Infrastructure and Transport, 2013. Walking, Riding and Access to Public Transport, Australian Government, Canberra.
44. Litman, T. 2014, Evaluating Active Transport Benefits and Costs, Victoria Transport Policy Institute, Canada.45. Living Streetstman 20134, op. cit.46. Wooller, L., 2010, What are the economic and travel implications of pedestrianising a roadway in Takapuna’s shopping
precinct?, Auckland University of Technology.47. ICRC,2011, ACT Greenhouse Gas Inventory, ACT Government, Canberra.48. Litman 2014 op. cit.49. Active Transport for Healthy Living Coalition, June 2014. The case for action by the Active Transport for Healthy Living
Coalition, United Kingdom50. Active Living Principles for this purpose are identified as Connected Places, Open Space, Mixed Land Use and Density,
Safe and Attractive Places, Supportive Infrastructure and Environments for All.51. This report was undertaken in response to actions identified in the Healthy Weight Initiative under the urban planning
theme.52. U.S. Environmental Protection Agency, Clean Energy, Greenhouse Gas Equivalencies Calculator53. Western Australia Department of Transport 2014, 2014 Netherlands Cycling Study Tour Observations and Reflections
Report, Perth. Prepared for WA Transport by Craig Wooldridge, Director Network Planning Moving People54. San Francisco Municipal Transportation Agency, 2012, ‘2012 San Francisco State of Cycling Report’ retrieved on 22
April 2015 from http://www.smartgrowthamerica.org/documents/cs/impl/ca-sanfrancisco-2012report.pdf Metropolitan Transportation Commission, 2009. ‘Regional Bicycle Plan for the San Francisco Bay Area 2009 update’, prepared by Transportation, Environmental and Urban Planning, retrieved on 22 April 2015 from http://www.pedbikeinfo.org/
55. Green Building Council of Australia, Green Star Project Directory website www.gbca.org.au56. Anderson R, McLean A, Farmer M, Lee B, & Brooks C. (1997), Risk of death to a pedestrian or cyclist as a function of
impact speed57. Australian National Audit Office 2012, Establishment, Implementation and Administration of the Infrastructure
Employment Projects Stream of the Jobs Fund, pp22–23. Available from www.anao.gov.au/Publications/Audit-Reports/2011-2012/Bike-Paths-Component-of-the-Local-JobsStream-of-the-Jobs-Fund
58. Auditor-General of Victoria 2011, Developing Cycling as a Safe and Appealing Mode of Transport – an audit of the 2009 Victorian Cycling Strategy

