building a defensible framework for prioritizing …c.ymcdn.com/sites/ a defensible framework for...
TRANSCRIPT
Building a Defensible Framework for Prioritizing Water Main Rehabilitation and Replacement
March 21, 2012
James Carolan

The Challenge
Challenge - How do you effectively balance infrastructure growth, upgrades and replacement, within your available budget?
Solution - Identify, then upgrade and/or replace highest “risk” assets first, right?
…but it’s not that easy
– How do you know if your strategy is keeping up with the degradation of your assets? • How much is enough?
– How do you assign and prioritize asset risk? • Which pipes are a your riskiest?
– How do you manage the plan long term? • How to integrate capital planning with your enterprise?
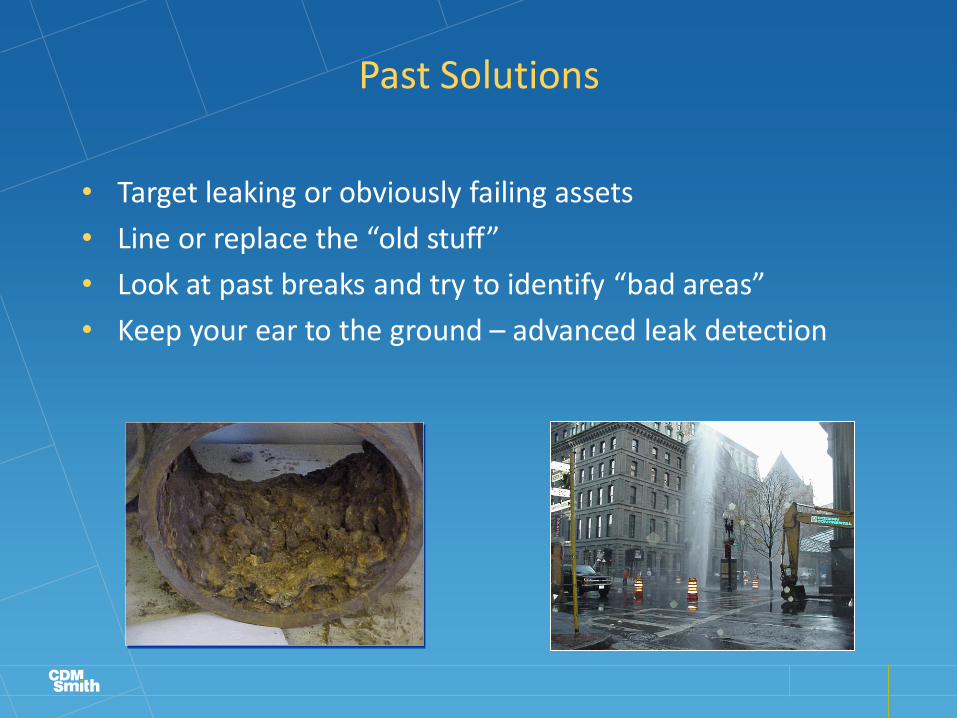
Past Solutions
• Target leaking or obviously failing assets
• Line or replace the “old stuff”
• Look at past breaks and try to identify “bad areas”
• Keep your ear to the ground – advanced leak detection
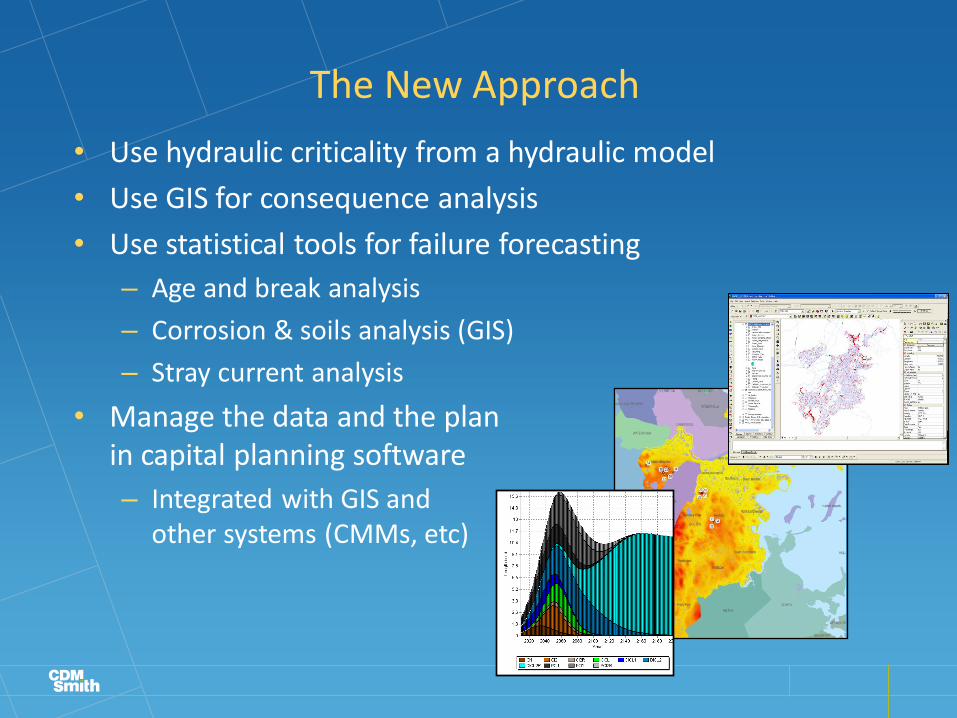
The New Approach
• Use hydraulic criticality from a hydraulic model
• Use GIS for consequence analysis
• Use statistical tools for failure forecasting
– Age and break analysis
– Corrosion & soils analysis (GIS)
– Stray current analysis
• Manage the data and the plan in capital planning software
– Integrated with GIS and other systems (CMMs, etc)
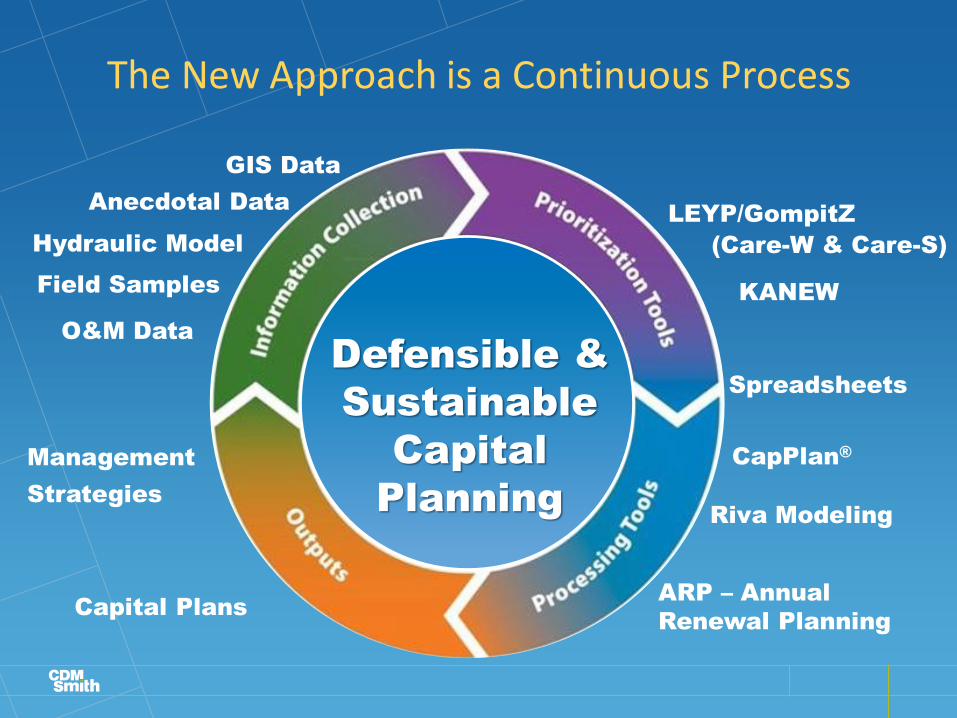
The New Approach is a Continuous Process
Capital Plans
(Care-W & Care-S)
LEYP/GompitZ
KANEW
GIS Data
Hydraulic Model
O&M Data
Field Samples
Anecdotal Data
CapPlan®
ARP – Annual
Renewal Planning
Riva Modeling
Defensible &
Sustainable
Capital
Planning
Spreadsheets
Management
Strategies
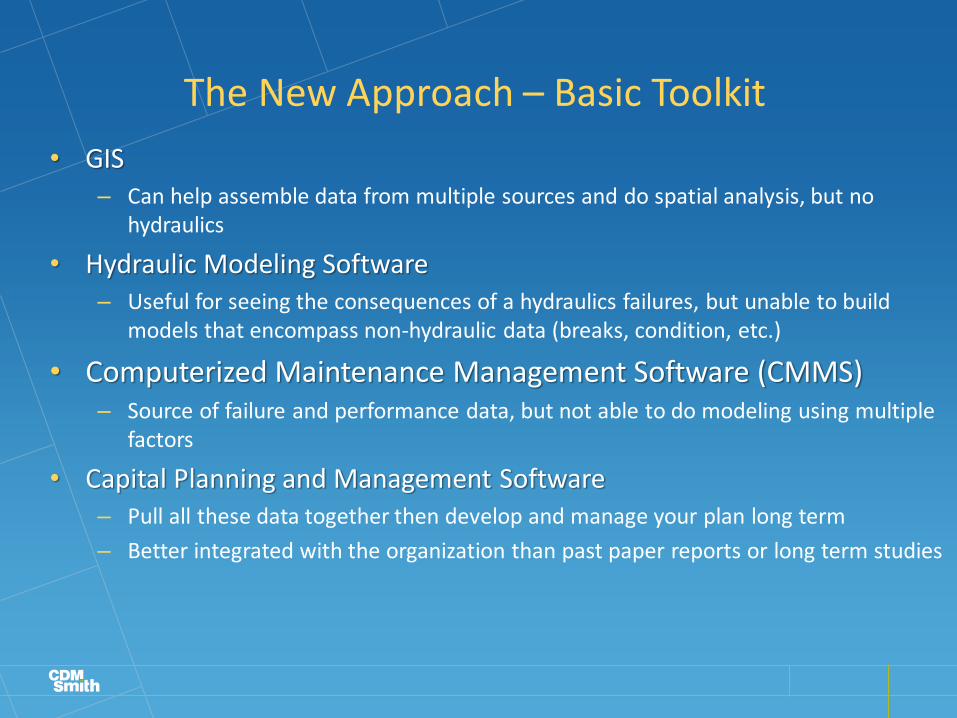
The New Approach – Basic Toolkit
• GIS – Can help assemble data from multiple sources and do spatial analysis, but no
hydraulics
• Hydraulic Modeling Software – Useful for seeing the consequences of a hydraulics failures, but unable to build
models that encompass non-hydraulic data (breaks, condition, etc.)
• Computerized Maintenance Management Software (CMMS) – Source of failure and performance data, but not able to do modeling using multiple
factors
• Capital Planning and Management Software – Pull all these data together then develop and manage your plan long term
– Better integrated with the organization than past paper reports or long term studies
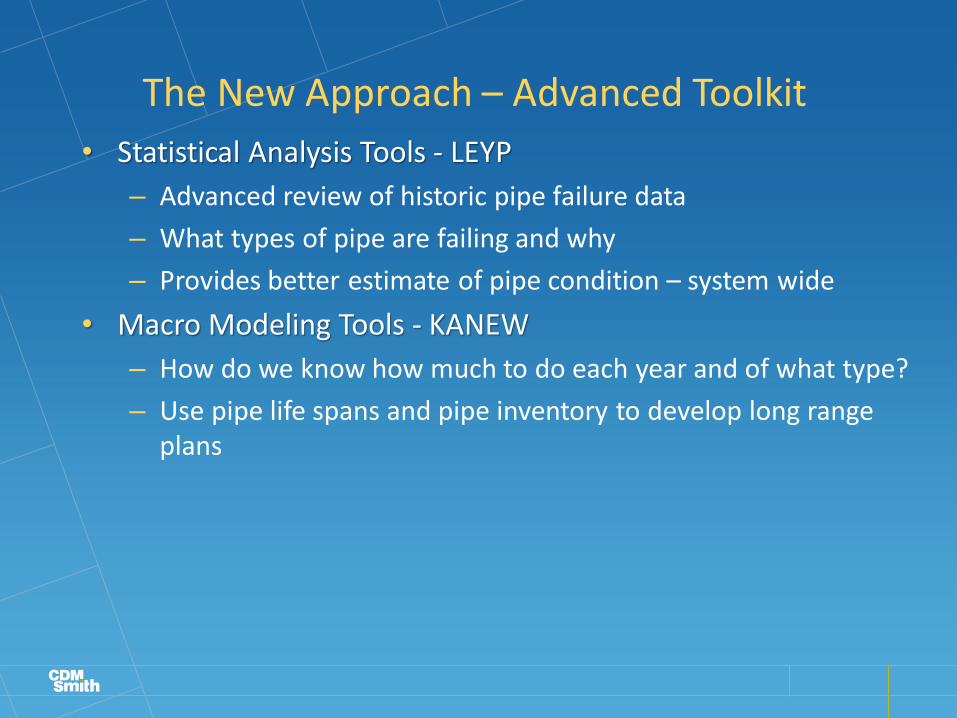
• Statistical Analysis Tools - LEYP
– Advanced review of historic pipe failure data
– What types of pipe are failing and why
– Provides better estimate of pipe condition – system wide
• Macro Modeling Tools - KANEW
– How do we know how much to do each year and of what type?
– Use pipe life spans and pipe inventory to develop long range plans
The New Approach – Advanced Toolkit

Leverage GIS and Hydraulic Model
Historic Shorelines Fluid Age/Chemistry Economic Zones
Critical Users Roads and Tunnels Hydraulic Criticality

GIS - Automated Service Generation
• Automated service placement to nearest main
• Determined demands for water model
• Not 100% perfect, but significantly improves accuracy of demand allocation
• Used in water outage analysis
• Link your customers to your model/GIS

GIS - Soil Data
• Overlay main breaks on
– Fill areas
– Soil types
• Corrosive soils vs Break Locations
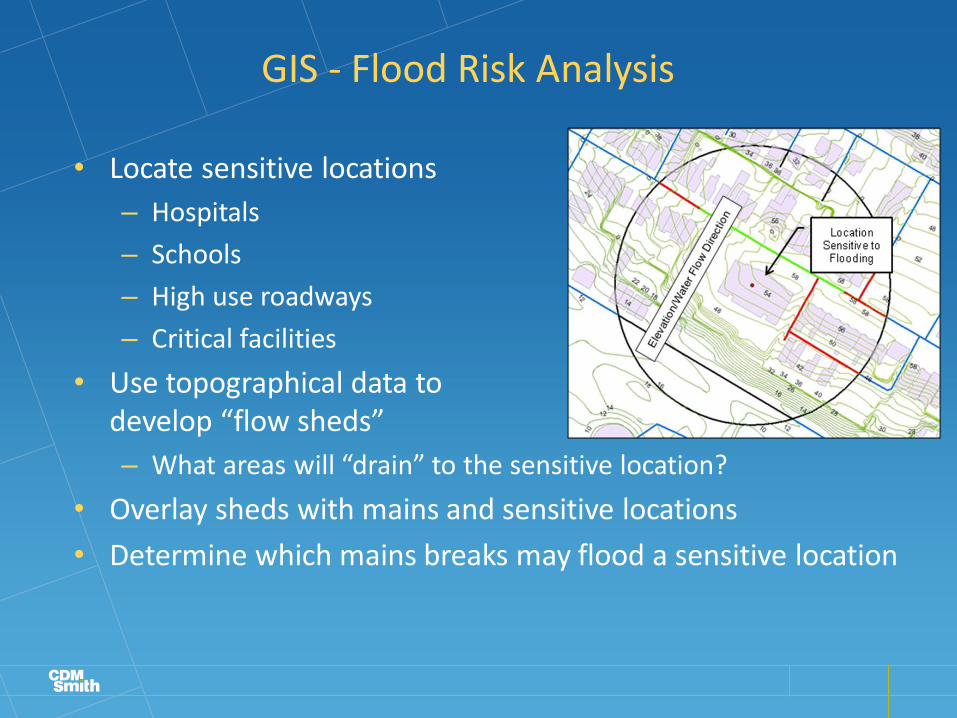
GIS - Flood Risk Analysis
• Locate sensitive locations
– Hospitals
– Schools
– High use roadways
– Critical facilities
• Use topographical data to develop “flow sheds”
– What areas will “drain” to the sensitive location?
• Overlay sheds with mains and sensitive locations
• Determine which mains breaks may flood a sensitive location

HM - Hydraulic Criticality
• Hydraulic model based on GIS can identify problem areas
– Pipes where failure results in loss of service
– Areas that are only served by one pipe
– Extent of outage area resulting from pipe failure
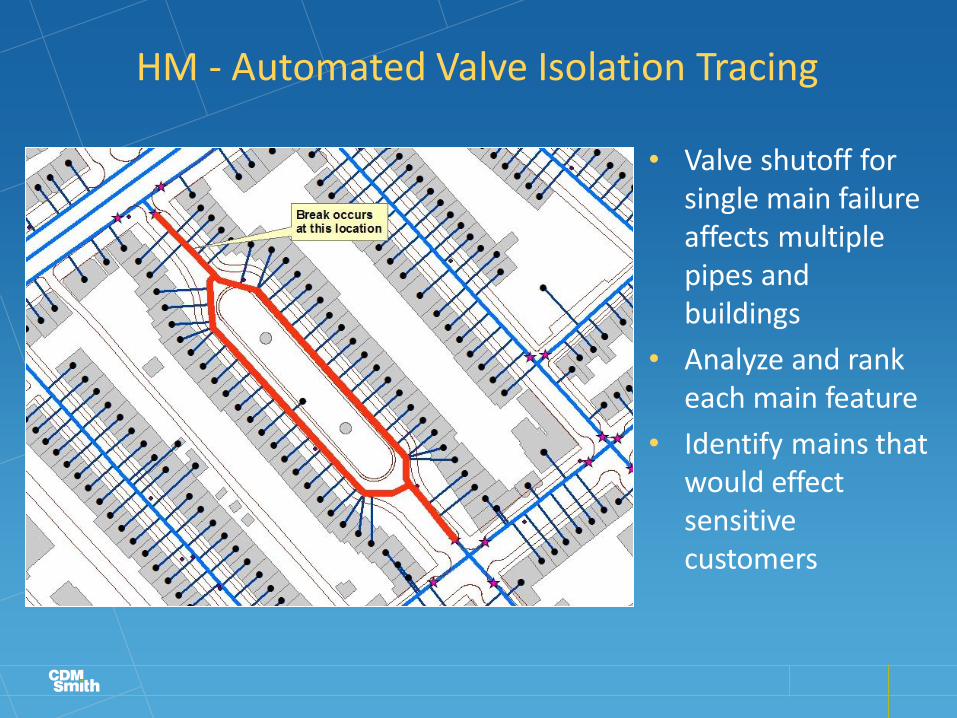
HM - Automated Valve Isolation Tracing
• Valve shutoff for single main failure affects multiple pipes and buildings
• Analyze and rank each main feature
• Identify mains that would effect sensitive customers

HM - Water Age
• Hydraulic model analysis
– Identify areas of
• low flow
• high residency time
– Of those identify
• older pipes
• non-lined pipes
• Query water quality complaints from work orders
• Correlate complaints with hydraulic model results
• Determine if model accurately predicts water age

Example: CapPlan – Bringing it All Together
• Uses existing hydraulic model and GIS
– Innovyze hydraulic models – Esri GIS
• Performs spatial analysis “on the fly”
– Easily builds spatial tests for consequence
• Use hydraulic modeling results
– Pressure
– Water Age
– Hydraulic Criticality
• Manages the plan long term
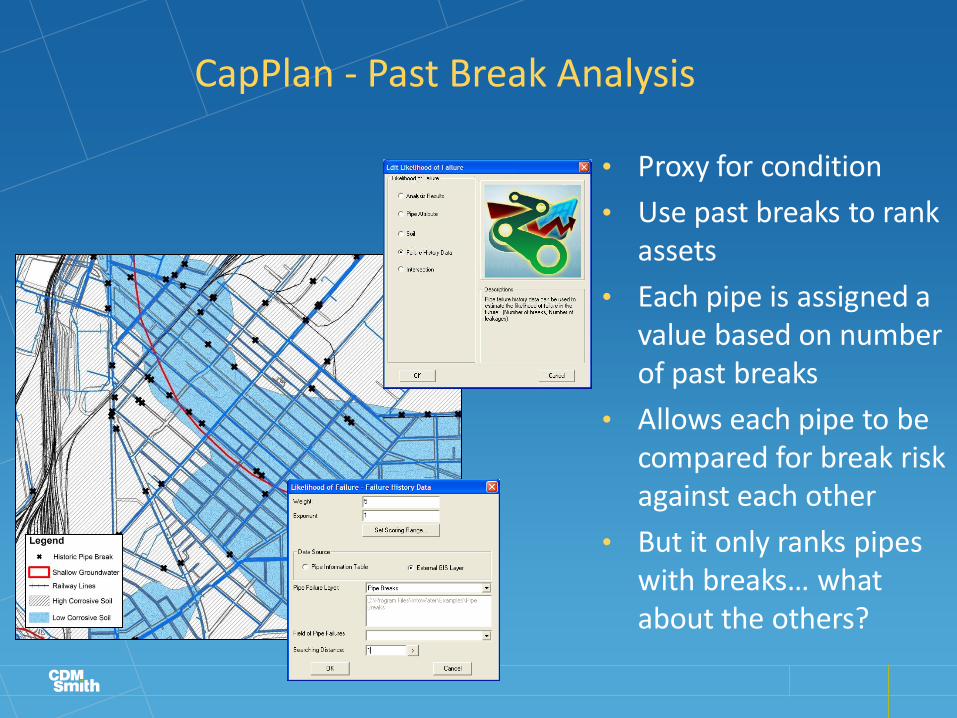
CapPlan - Past Break Analysis
• Proxy for condition
• Use past breaks to rank assets
• Each pipe is assigned a value based on number of past breaks
• Allows each pipe to be compared for break risk against each other
• But it only ranks pipes with breaks… what about the others?

• Statistical Analysis Tools – Casses/LEYP – Allows failure and GIS data to be assessed simultaneously using advanced
statistics
– Great for determining how different variables (material, age, soil type, etc.) impact each other
– Used to determine failure probability of each pipe
• Not just previously failed pipes
• Macro Modeling Tools - KANEW – Looks at pipe renewal rate as a collection over time
– Relies on user setting service lives for each type of pipe
– Budget impacts shown over time
– Does not help decide which specific pipe segments need to be replaced or when
The Advanced Tools – Taking it the Next Step
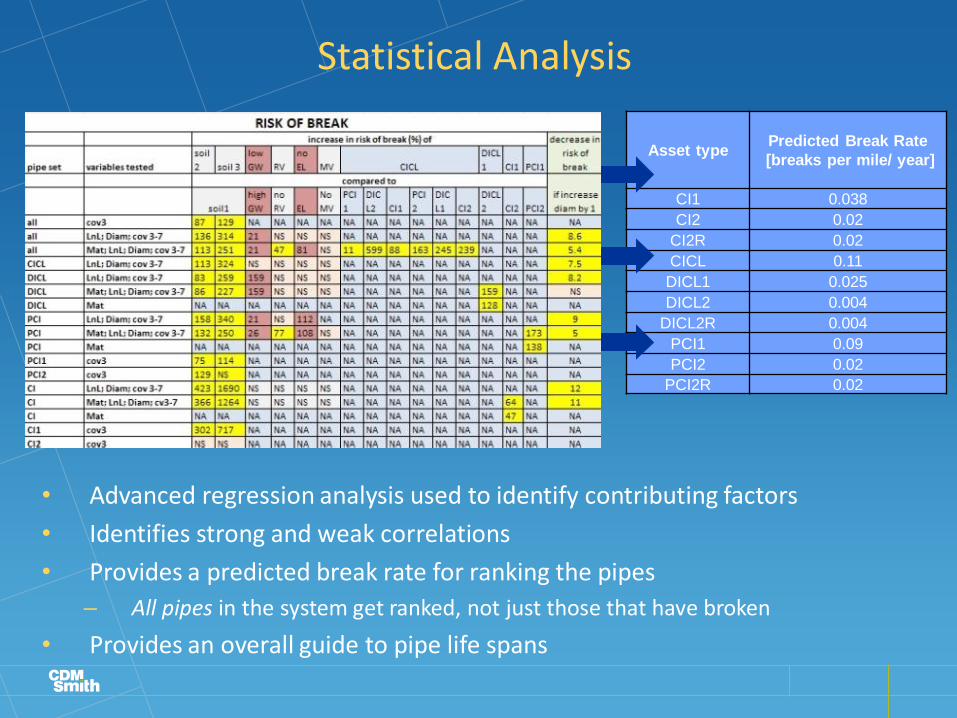
Statistical Analysis
• Advanced regression analysis used to identify contributing factors
• Identifies strong and weak correlations
• Provides a predicted break rate for ranking the pipes
– All pipes in the system get ranked, not just those that have broken
• Provides an overall guide to pipe life spans
Asset type Predicted Break Rate
[breaks per mile/ year]
CI1 0.038
CI2 0.02
CI2R 0.02
CICL 0.11
DICL1 0.025
DICL2 0.004
DICL2R 0.004
PCI1 0.09
PCI2 0.02
PCI2R 0.02

LEYP - Example
Asset Type PCI
Break stats (1976-2007)
Length [ft]: 1,865,451 ft # Breaks, all pipes: 553 breaks
Length [%]: 37 % Break rate, all pipes: 4.89 #/100mi.year
Average age 106 years # Breaks, active pipes: 344 Schäden
100%-Age: 82 years Break rate, active pipes: 3.04 #/100mi.year
50%-Age: 102 years
10%-Age: 127 years Trend:
Replacement stats (1978-2007)
From To not representative
100% 70 100 Replaced length [ft]: 0 ft
50% 115 135 Cumulative replacement rate (x years): 0 %
10% 140 160 Average replacement rate (x years): 0 %
Ageing factor a 48.556 18.361 Average age at time of replacement: 0 years
Renewal factor b 0.087 0.086 Required age at time of replacement: 0 years
Resistance time c 70 100
Inventory (2009)
Ageing parameter
0%
10%
20%
30%
40%
50%
60%
70%
80%
90%
100%
0 20 40 60 80 100 120 140 160 180 200
Age
Survival function
0
10
20
30
40
50
60
70
0
2
4
6
8
10
12
14
16
18
20
0 10 20 30 40 50 60 70 80 90 100 110 120 130 140 150 160
Bre
ak r
ate
(bre
aks/
100m
i/ye
ar)
# b
reak
s
Age (years)
PCI - Breaks and break rate per age
# breaks Break rate (breaks/100mi/year)
• Use past break history to develop survival curves
• Curves provide a guide to when and what percentage of assets will fail over the short and long term
• Important for macro analysis – system wide long term analysis

KANEW – Macro Analysis
• How much should we work on to keep up?
• Which types of pipe will fail first?
• What should our mix of rehabilitation vs replacement be?
• Will rehabilitation help extend our system life?
• Run scenarios and develop long term approaches
The Tools Need Data
• Data quantity can be an issue
– Material and age information
– Joint type and lining information
– How many previous break records exist?
– Is there soils data?
• Data quality can be an issue
– Accurate GIS data – age, material, etc.
– Are the breaks as points on the pipes?
– How spatially accurate and well defined are the soil records?

Developing a System for Your Agency
• Build on a good GIS base
– Good material & age data
• Add asset management & historical data
– Type and number of breaks and leak
– Link between work activity and affected assets
• Identify risk and performance factors
– Where failure will impact service?
– What do you and your customers worry most about?
• Feed back data to asset database (GIS)
– Internal procedures
– Leverage existing and new computer technology
