broadband wireless access providers prepare to soar … · the bwa industry report: 2017. 2 ......
TRANSCRIPT

120
7Ready for Takeoff:Broadband Wireless Access Providers Prepare to Soar with Fixed Wireless THE BWA INDUSTRY REPORT: 2017

2
THE BWA INDUSTRY REPORT: 2017
Broadband Wireless Access Industry Report 2017, The Carmel Group.Copyright 2017, All Rights Reserved. Any unauthorized distribution or use is strictly prohibited.
About This Report 2
Executive Summary 4
What is Broadband Wireless Access? 5
How Does BWA Work? 7
BWA: A Solution to the Broadband Gap 8
International Proof of Concept 8
U.S. BWA Growth Forecast 9
Seven Key Growth Drivers 11
• Fixed wireless costs less • Spectrum trends favor fixed wireless • Video is fueling overall growth in demand for broadband • Standards-based technologies give providers more choices • Capital availability and government support are growing • New entrants are validating the business model • New markets and service categories = more opportunities
Fixed Wireless Versus Other Technologies 17
BWA Providers Face Challenges 19
Conclusion 19
Appendix 20
Table of Contents
FIGURE 1: U.S. Fixed Wireless Broadband Availability 5FIGURE 2: Typical BWA Network Architecture 7FIGURE 3: BWA Industry Revenue Review and Forecast 9FIGURE 4: BWA Customer Growth 10FIGURE 5: BWA Average Monthly Billing Review and Forecast 10FIGURE 6: Consumer Broadband Comparative Economics 12FIGURE 7: Popular BWA Spectrum Bands 13FIGURE 8: Rising Global Internet Traffic 14FIGURE 9: OTT is Driving Internet Growth 14FIGURE 10: BWA Annual Residential Subscriber Growth, 2015 to 2016 20FIGURE 11: BWA Average Subscriber Acquisition Cost (SAC) for Residential Customers 21FIGURE 12: BWA Average Revenue per Unit for Residential Users 21FIGURE 13: BWA Average Monthly Churn 22

2
THE BWA INDUSTRY REPORT: 2017
Broadband Wireless Access Industry Report 2017, The Carmel Group.Copyright 2017, All Rights Reserved. Any unauthorized distribution or use is strictly prohibited.
The purpose of this report is to provide a comprehensive, independent, informational, and analytical resource that describes the Broadband Wireless Access (BWA) industry and provides perspectives on future opportu-nities, threats, and outlooks.
The target audience for this report includes BWA companies, stakeholders, investors, policymakers, strategic advisors, analysts, equipment and software vendors, and any-one with an interest in the fixed wireless and broadband industries. The author’s aim is to provide objective data and insights to help readers make informed business, investment, and policy decisions.
METHODOLOGY
This report is based on independent research conducted in 2016, including interviews with representatives of 30 wireless broadband ser-vice providers, vendors, and thought leaders. The interviews were conducted by The Carmel Group and lasted approximately two hours each. The Wireless Internet Service Providers Association (WISPA) and Wireless Commu-nications Association International (WCAI), as well as several other groups and telecom companies, also provided input. Filings at the U.S. Securities and Exchange Commission by a publicly traded company in the BWA sector were another resource. Other third parties, such as bankers and financiers, were also in-terviewed. Finally, extensive surveys of oper-ators, equipment manufacturers, and vendors were distributed to members of WISPA and WCAI in Q3 of 2016, to gain another critical layer of research and analysis.
The charts and graphs in the Appendix are based on survey results from 169 U.S.-based BWA providers.
THE REPORT SPONSORS
Prominent stakeholders from today’s BWA community and two major trade groups rep-resenting the industry’s interests in Wash-ington, DC – WISPA and WCAI – selected Jimmy Schaeffler of The Carmel Group (www.carmelgroup.com) to conduct this proj-ect based upon his expertise in performing studies on the future of the telecom, media, and entertainment industries.
The Carmel Group prepared this report on be-half of the parties listed below.
• All Points Broadband• Amplex• AtLink Services• Cambium Networks• Comelec Internet Services• Huawei• Hudson Valley Wireless• Mimosa• RFelements• Rise Broadband• Safelink• SpeedConnect• Telrad• TransWorld Network• ViaSat• WCAI• WISPA• Wisper ISP
Unless authorized in writing by The Carmel Group, this report is intended solely for the sponsors’ exclusive use. Any unauthorized distribution or use is strictly prohibited.
About This Report
ZTE•

3
THE BWA INDUSTRY REPORT: 2017
Broadband Wireless Access Industry Report 2017, The Carmel Group.Copyright 2017, All Rights Reserved. Any unauthorized distribution or use is strictly prohibited.
Individuals interested in further information may contact The Carmel Group via telephone at +1-831-622-1111 or email at: [email protected].
ACKNOWLEDGEMENTS
The authors thank the following individuals for their assistance: Stephen Coran, Esq., of Lerman Senter PLLC; Dale Curtis of Dale Curtis Communications; Gerard F. Hallaren, CFA; William Joseph Shepard of The Carmel Group; and Deborah Sauri of iSpy Creative.
CAUTIONARY LANGUAGE CONCERNING FORWARD-LOOKING STATEMENTS AND DISCLAIMER
Information set forth in the following materi-als contains financial estimates and other for-ward-looking statements that are subject to risks and uncertainties, and actual results may differ materially. The Carmel Group disclaims any obligation to update or revise statements contained in this report and any accompany-ing news release based on new information or otherwise. The report is based on information that The Carmel Group believes to be reliable, but no guarantee is made as to its accuracy. Those using this report should verify the data and should not make any business decisions without proper verification and consultation with proper legal and financial advisers. Ad-ditionally, the information in this report is not in any way a recommendation to purchase or sell any security.

4
THE BWA INDUSTRY REPORT: 2017
Broadband Wireless Access Industry Report 2017, The Carmel Group.Copyright 2017, All Rights Reserved. Any unauthorized distribution or use is strictly prohibited.
• The Broadband Wireless Access (BWA) industry is experiencing robust growth in the United States and worldwide, and The Carmel Group expects this growth to continue for at least the next five years.
• There are at least seven key growth drivers lifting the fixed-wireless-based, BWA industry to new heights:
Executive Summary
• Bringing broadband to under-served markets is a difficult challenge. But for the foreseeable future, BWA providers using fixed wireless technologies will offer the most cost-effective solu-tion in vast areas of the United States and the world.
• The existence of large, successful BWA providers in other nations underscores the sector’s potential in the United States. Developing nations that lack wireline infrastructure present rich growth opportunities.
The economics of wireless technology enable network deployments at a frac-tion of the cost of wireline.
The economics of unlicensed spectrum and trends in spectrum regulation are favorable to fixed wireless.
Consumer demands for broadband con-nectivity and associated applications, especially video, are surging at an expo-nential rate.
Global standards-based technologies, such as LTE, and a growing equipment ecosystem are being leveraged for fixed wireless uses.
Industry consolidation and a healthy funding environment from private and government sources are driving invest-ment.
New entrants and hybrid networks are validating the business model.
New markets in urban areas and cate-gories such as home automation, home security, and the Internet of Things (IoT) present further opportunities for fixed wireless growth.
1
2
3
4
5
6
7

5
THE BWA INDUSTRY REPORT: 2017
Broadband Wireless Access Industry Report 2017, The Carmel Group.Copyright 2017, All Rights Reserved. Any unauthorized distribution or use is strictly prohibited.
Broadband Wireless Access (BWA) providers – also known as Wireless Internet Service pro-viders (WISPs), Fixed Wireless Access provid-ers (FWA), Competitive Broadband Providers (CBPs), and/or Wireless Local Loop providers (WLL) – deliver broadband service to con-sumers in fixed locations, primarily via wire-less technology.
Whereas most wireless infrastructure today serves mobile consumers, BWA providers use wireless technology to serve customers in fixed locations such as residences, business-
es, and community anchor institutions.
Services delivered by BWA providers may in-clude data as well as voice, video, security, and ancillary products and services.
BWA providers deliver their services over a combination of licensed spectrum, lightly li-
censed spectrum (or “shared access” spectrum), and unli-censed spectrum. Many also use fiber optics in parts of their infrastructure, creating efficient “hybrid” networks. Typical download speeds are in the range of 5 to 50 Mega-
bits per second (Mbps), a number that is ris-ing as technology improves and equipment costs become more competitive. Fixed wire-less technology can support Gigabit down-load speeds.
What is Broadband Wireless Access?
Whereas most wireless infrastructure today serves mobile consumers, BWA providers use wireless technology to serve customers in fixed locations such as residences, businesses, and community anchor institutions.
FIGURE 1: U.S. Fixed Wireless Broadband Availability
Source: National Broadband Map, FCC https://www.broadbandmap.gov/technology

6
THE BWA INDUSTRY REPORT: 2017
Broadband Wireless Access Industry Report 2017, The Carmel Group.Copyright 2017, All Rights Reserved. Any unauthorized distribution or use is strictly prohibited.
Currently in the United States, more than 2,000 BWA providers deliver service to near-ly 4 million customers. As shown in Figure 1, each state has at least one fixed wireless pro-vider. The largest concentrations of BWA pro-viders are found in the Midwest, Northwest, and Southwest, as well as the central and northern parts of California.
To date, the industry has served mostly rural and suburban markets where fiber and cable deployment is not cost-effective. However, given the favorable economics of fixed wire-less, many BWA providers are expanding into urban markets as well, offering competitive alternatives to customers there.
Most U.S. BWA providers are small and me-dium-sized businesses. Rise Broadband, with nearly 200,000 subscribers, is the larg-est U.S.-based BWA provider. Other large providers include AtLink Services, Comelec Internet Services, Safelink, SpeedConnect, Trans-World Network, and Wisper ISP. How-ever, the American BWA networks serve an average of approximately 1,200 customers. Very small BWA providers, especially those that serve small rural communities, may count customers in the low hundreds.
Many BWA leaders interviewed for this study indicated their “ideal” deployment occurs in residential clusters of 100 to 1,500 locations per square mile, areas that wired technology platforms often ignore because of the high-er per-location cost to deliver service across sparsely populated areas.
Bringing broadband to under-served mar-kets is a difficult challenge. At this time, BWA providers using wireless technologies are the most cost-effective solution in vast areas of the United States and the world.

7
THE BWA INDUSTRY REPORT: 2017
Broadband Wireless Access Industry Report 2017, The Carmel Group.Copyright 2017, All Rights Reserved. Any unauthorized distribution or use is strictly prohibited.
In a typical BWA network, broadband content is received by the BWA provider from an exter-nal distribution point via fiber or microwave connections. From there, signals are delivered to BWA customers via wireless transmitters on towers. The towers are interconnected by licensed or unlicensed spectrum and can car-ry up to 5 to 10 Gigabytes of capacity. Custom-ers receive the signals via antennas that are attached to the subscribers’ premises. This is why the technology is called fixed wireless, as opposed to mobile/cellular wireless.
Within the subscribers’ premises, the signal is most commonly delivered via a Wi-Fi router or ethernet cable to personal computers, TV monitors, and other stationary and mobile de-vices in the home or business.
BWA providers typically employ a variety of licensed and unlicensed spectrum to deliver their services. For last-mile, point-to- multipoint connections, unlicensed spectrum bands such as 900 MHz and 2.4 GHz were
commonly used in the early years of the in-dustry. However, these bands have given way to 5 GHz, 3.65 GHz, and 2.5 GHz to accommo-date increasing speed, coverage, and capacity needs. Unlicensed 5 GHz and licensed 6-24 GHz point-to-point connections are most commonly used to connect towers and serve high-volume enterprise customers, with FCC microwave licenses readily available at nom-inal cost.
Equipment designed for use in unlicensed spectrum bands is limited in power output to reduce interference to other users, as man-dated by the FCC, and is designed to perform well in environments with more potential for interference than equipment designed for use in exclusively licensed bands.
The BWA “sweet spot” – where providers can offer the best service and economics – is often in exurban areas with 100 to 1,500 locations per square mile, such as those shown on the left side of Figure 2.
How Does BWA Work?
FIGURE 2: Typical BWA Network Architecture
Source: The Carmel Group
BWA“SWEET SPOT”
100 - 1,500Locations
per Square Mile

8
THE BWA INDUSTRY REPORT: 2017
Broadband Wireless Access Industry Report 2017, The Carmel Group.Copyright 2017, All Rights Reserved. Any unauthorized distribution or use is strictly prohibited.
BWA: A Solution to the Broadband Gap
America’s broadband performance is mid-dling at best. According to the Organization for Economic Cooperation and Development (OECD), in 2015 the United States was ranked 15th out of 34 member nations in the number of fixed broadband subscriptions per 100 in-habitants.
And according to the FCC’s 2016 Broadband Progress Report:• 10 percent of all Americans (34 million
people) lack access to 25 Mbps/3 Mbps service; and
• 39 percent of rural Americans (23 million people) lack access to 25 Mbps/3 Mbps; but
• Only 4 percent of urban Americans lack access to 25 Mbps/3 Mbps broadband.
The United States faces a variety of chal-lenges that have made it difficult to ensure universal broadband coverage. Chief among them are low population density and rugged
terrain in large portions of rural America. BWA provid-ers using fixed wireless tech-nology can be a large part of the solution, largely because of their favorable economics. (See Figure 6.)
Without BWA providers, America’s broadband gap already would be much larger. The data further suggests that many under-served Americans reside and do business in rural areas where BWA providers are thriving, validating the opportunity for them to become a key part of the solution to America’s broadband gap.
BWA providers are more common in some na-tions than in the United States, in most cases because cable and other broadband infra-structure is non-existent, aging, and/or very expensive to install and upgrade. For example, Australia, Canada, Italy, the Philippines, and Russia all have BWA providers with customer counts in the hundreds of thousands, or in the case of the Philippines, millions. Developing nations present significant growth opportuni-ties for the industry.
Non-U.S. demand for BWA services has pushed the technology forward. Innovators like Cambium Networks, Ericsson, Huawei, Mimosa, Nokia, Ubiquiti, and ZTE are compet-ing in both established and emerging markets around the world.
The notion of “carrier grade” fixed wireless was not widely accepted in the past, but it is now becoming more prevalent in the United States and worldwide.
International Proof of Concept
Bringing broadband to under-served markets is a difficult challenge. At this time, BWA providers using wireless technologies are the most cost-effective solution in vast areas of the United States and the world.

9
THE BWA INDUSTRY REPORT: 2017
Broadband Wireless Access Industry Report 2017, The Carmel Group.Copyright 2017, All Rights Reserved. Any unauthorized distribution or use is strictly prohibited.
The Carmel Group estimates that the current upward trajectory of BWA industry revenues in the United States will continue for at least the next five years. (See Figure 3.) Core BWA industry revenues from provision of service to end-users were estimated conservatively at $2.3 billion in 2016. These are expected to rise to more than $5.2 billion by the end of 2021.
Drivers of growth include explosive consumer demand for broadband services, continuing deployment to unserved and under-served areas, commercial and business demand, improvements in technology at competitive prices (including standards-based LTE equip-ment), and the combination of existing ser-vices with ancillary services that are increas-ing the average revenue per unit (ARPU).
U.S. BWA Growth Forecast
FIGURE 3: U.S. BWA Industry Revenue Review and Forecast
Source: The Carmel GroupCopyright 2017, Property of The Carmel Group. All Rights Reserved.

10
THE BWA INDUSTRY REPORT: 2017
Broadband Wireless Access Industry Report 2017, The Carmel Group.Copyright 2017, All Rights Reserved. Any unauthorized distribution or use is strictly prohibited.
The Carmel Group believes that customer subscriptions will roughly double, from 4.0 million in 2016 to 8.1 million in 2021, as BWA providers expand in under-served areas and
contend effectively in the burgeoning number of areas where they offer superior customer service and a local presence. (See Figure 4.)
The Carmel Group believes that per-customer monthly revenue also will continue to rise, in part because consumers will be willing to pay more for the improved services and speeds
that will flow from network upgrades, stan-dards-based technologies, and ancillary ser-vices. Figure 5 depicts our projections.
FIGURE 4: U.S. BWA Customer Growth
FIGURE 5: U.S. BWA Average Monthly Billing Review and Forecast
Source: The Carmel GroupCopyright 2017, Property of The Carmel Group. All Rights Reserved.
Source: The Carmel GroupCopyright 2017, Property of The Carmel Group. All Rights Reserved.

11
THE BWA INDUSTRY REPORT: 2017
Broadband Wireless Access Industry Report 2017, The Carmel Group.Copyright 2017, All Rights Reserved. Any unauthorized distribution or use is strictly prohibited.
Seven Key Growth Drivers
The BWA industry is experiencing robust growth in the United States and worldwide. The Carmel Group expects this growth to accelerate for at least the next five years, due to seven key growth drivers:
The economics of wireless technology enable network deployments at a fraction of the cost of wireline.
The economics of unlicensed spectrum and trends in spectrum regulation are favorable to fixed wireless.
Consumer demand for broadband connectivity and associated applications, especially video, is surging at an exponential rate.
Global standards-based technologies, such as LTE and 5G, and a growing equipment ecosystem are being leveraged for fixed wireless applications.
Industry consolidation, a healthy funding environment, and greater support from government are driving investment.
New entrants and hybrid networks are validating the business model.
New markets and categories such as home automation, security, and the Internet of Things (IoT) present further opportunities for fixed wireless.
We delve further into each of these drivers below.
1
2
3
4
5
6
7

12
THE BWA INDUSTRY REPORT: 2017
Broadband Wireless Access Industry Report 2017, The Carmel Group.Copyright 2017, All Rights Reserved. Any unauthorized distribution or use is strictly prohibited.
Fixed wireless costs less
The economics of fixed wireless are already very attractive and only becoming more so. For example, it costs nothing to install, maintain, or repair the spectrum resource, and fixed wire-less equipment is inexpensive relative to fiber, coax, and twisted pairs – all of which incur ex-tensive installation, maintenance, and repair costs. (See Figure 6.)
Moreover, upgrading fiber, cable, satellite, or mobile broadband is highly capital intensive. For these technologies, each generation of improvement requires significant network upgrades. In contrast, BWA networks can be scaled incrementally over time.
Advances in radio technology are improving wireless speeds to the point where they are approaching cable and ultimately will catch up to fiber. Industry standards and software- defined radios enable incremental upgrades without leaving past customers behind.
The following figure compares relative capital expenditures per residential subscriber, as well as speed, upgrade costs, average reve-nue per unit (ARPU), and payback times for the five most popular U.S. broadband tech-
nologies. This is a relative presentation com-paring the four other technologies to BWA, which is set to an index value of 10. Fiber costs about 7x BWA costs; Cable is 4.5x more. Satellite costs about the same per sub, but this analysis excludes the cost of satellites because network costs vary greatly. Mobile’s capex per sub is a little more than 2x BWA’s, although it offers mobility. As household density drops, capex for wireline rises but remains relatively constant for wireless.
This analysis suggests that with a payback period of just under one year, BWA offers the most attractive economics of the top U.S. broadband technologies.
The estimates for fiber, cable, and BWA assume the indicated speeds and average network reach. Satellite and mobile data are estimated from national averages. In an effort to present a rational and fair relative cost analysis, The Carmel Group constructed several cost models for each technology. The Relative Capex/Subscriber reflects a blend of these models with some analytical adjustment. Actual results vary.
Sources: Wisper ISP, National Rural Telecommunications Cooperative, and The Carmel Group.Copyright 2017, Property of The Carmel Group. All Rights Reserved.(1) This is a relative presentation comparing all of the technologies to BWA, which is set to an index value of 10. See above for explanation.(2) Does not include the cost of satellites. (3) Max speeds; most service providers are not yet offering max speed. For cable, the DOCSIS 3.0 standard is capable of 1 Gbps. For BWA, point-to-point links and millime-ter-wave, point-to-multipoint connections can provide more than 1 Gbps to end users.(4) Anticipated typical speed.
FIBER CABLE SATELLITE MOBILE BWA
CAPEX/SUB RELATIVE 70 45 10.5 (2) 21 10TO BWA (1)
SPEED (3) 1 Gbps 150 Mbps 12-35 Mbps (4) 10–12 Mbps 100 Mbps
UPGRADE MODEST HIGH LOW/HIGH HIGH MODESTCOSTS Only the Complete Incremental Complete Incremental fiber remains CPE & upgrades device & upgrades in the same network until the network CPE and change satellite fails change network
BROADBAND ARPU $69 $42 $61 $59 $51
PAYBACK PERIOD 60 months 38 months 12 months 21 months 11.5 months
FIGURE 6: Residential Consumer Broadband Comparative Economics
1

13
THE BWA INDUSTRY REPORT: 2017
Broadband Wireless Access Industry Report 2017, The Carmel Group.Copyright 2017, All Rights Reserved. Any unauthorized distribution or use is strictly prohibited.
The BWA industry’s ability to use unli-censed spectrum is another growth driver.
Unlicensed spectrum is free to its users. Licensed spectrum requires capital invest-ments at high prices, which are ultimately passed on to consumers.
Another advantage is rapid deployment. There is no need to go through lengthy regulatory proceedings and auctions to acquire access to the airwaves. In addition, the recent introduction of LTE technology in certain bands opens up an enormous, global-standards-based ecosystem for equipment and carrier-aggregation tech-nology, adding another boost to the speed, capacity, and economics of BWA deploy-ments and upgrades.
The Carmel Group’s extensive survey of BWA operators revealed that relatively few spectrum bands support today’s BWA in-dustry. (See Figure 7.) However, the FCC is
exploring new bands that are expected to be well-suited for BWA networks, including the Citizens Broadband Radio Service band (3550-3700 MHz, called CBRS), TV white spaces, and several extremely-high-fre-quency, millimeter-wave bands. Industry efforts are also underway to expand geo-graphically licensed areas in the LTE-grade 2.5 GHz band.
The growing acceptance of spectrum shar-ing is further increasing availability and ca-pacity for fixed wireless, with greater overall spectral efficiency.
It is important to realize that unlicensed spectrum is not unregulated spectrum. Even in unlicensed bands, the FCC regu-lates acceptable equipment, power limits, frequencies, and interference. BWA pro-viders stay within those limits and use a variety of frequencies and network design features to overcome population density, terrain, and propagation obstacles.
Spectrum trends favor fixed wireless
FREQUENCY 500-700 902-928 2.4 GHz 2.5 GHz 3.55 – 3.7 5.15- 5.85 28 & 39 >40 GHz MHz MHz GHz GHz GHz COMMON White ISM ISM/Wi-Fi EBS/BRS, CBRS, LTE U-NII LMDS, TN MillimeterNAME Space LTE Band 41 Band 42, 5 GHz Wi-Fi Wave 43 & 48 Band 33
LICENSE ASA* EXEMPT EXEMPT LICENSED ASA, PAL EXEMPT LICENSED VARIOUS or GAA
INTERFERENCE Medium High High Low Low, Medium High Low LowRISK
BAND SIZE Varies by 26 MHz 83.5 MHz 194 MHz 150 MHz 580 MHz 1.2 GHz 6.2 GHz Location 1.4 GHz
NLOS ABILITY Excellent Excellent Fair Good Fair Poor Poor Poor
PRIMARY 802.11af Proprietary Wi-Fi LTE Proprietary, Wi-Fi, LTE-U 5G 5GTECHNOLOGY “Super TDD WiMax and Wi-Fi” LTE
FIGURE 7: Spectrum Bands Most Commonly Used by the BWA Industry
* Authorized Shared AccessSource: The Carmel Group
Copyright 2017, Property of The Carmel Group. All Rights Reserved.
2

14
THE BWA INDUSTRY REPORT: 2017
Broadband Wireless Access Industry Report 2017, The Carmel Group.Copyright 2017, All Rights Reserved. Any unauthorized distribution or use is strictly prohibited.
The demand for broadband access to the internet is growing at an exponential rate. Figure 8 presents Cisco’s 2016 assessment and forecast of overall internet traffic mea-
sured in gigabits per second (Gbps). Consum-ers are defining their internet access needs in terms of both speed and throughput.
Video is fueling overall growth in demand for broadband
Video is a major driver of broadband demand. Figure 9 presents Cisco’s 2016 assessment on how video will drive broadband demand in terms of quantity (exabytes) of data moved. Video accounts for a rapidly growing share of internet traffic. Cisco proj-ects a 22% compound annual growth in overall internet traffic between 2015 and 2020, but it expects video traffic alone to grow 31% annually over the same time frame.
The reasons for this are clear. A grow-ing number of consumers are un-bundling from pay TV services and replacing expensive programming bundles with less expensive “over the top” (OTT) access via broadband. BWA providers make this cost-saving option – once available only to urban dwellers – available to rural and exurban customers.
We do not expect this trend will slow. If any-thing, we expect unbundling will accelerate as more consumers embrace Internet-based programming and watch programs on wire-less devices at times of their choosing.
Source: Cisco Visual Networking Index 2016
Source: Cisco Visual Networking Index June 2016
FIGURE 9: OTT is Driving Internet Growth
FIGURE 8: Rising Global Internet Traffic
3

15
THE BWA INDUSTRY REPORT: 2017
Broadband Wireless Access Industry Report 2017, The Carmel Group.Copyright 2017, All Rights Reserved. Any unauthorized distribution or use is strictly prohibited.
Every significant advancement in mobile tech-nology is paying dividends in the fixed wireless arena as well. For example, standards-based LTE technology, which originated in mobile standards bodies, is being deployed in fixed networks to give BWA providers greater speed, capacity, and credibility as service pro-viders.
The benefits of unlicensed spectrum are so powerful that many mobile carriers are plan-ning to augment licensed networks with LTE over unlicensed spectrum.
The WISP industry started with consumer and enterprise-class technology. These tech-nologies were sometimes cumbersome to manage and upgrade. But because of rising world demand, today’s BWA providers have an array of suppliers and technologies. Indeed, carrier-class technology is rapidly gaining share among BWA providers. This competi-tion, together with enhanced global research and development and related investments, is enabling the technologies and services to im-prove more rapidly.
As noted in this report, BWA providers gen-erally do not hold licenses for the spectrum they use. The lack of a tangible medium such as fiber, copper, or licensed spectrum has de-terred financial institutions from investing in BWA providers. Other investor concerns have included low barriers to entry by competitors, signal interference, and alleged “unreliability” of unlicensed spectrum.
However, more than a decade of successful op-erations, validation from new entrants, recent standards-based equipment deployments, and the advance of successful consolidators like Rise Broadband have all improved capital availability. Today, the financial markets are beginning to recognize the favorable econom-ics of fixed wireless and BWA providers. The validity of licensed spectrum at 2.5 GHz is also emerging, as illustrated by larger BWA provid-ers such as Michigan-based SpeedConnect.
Meanwhile, the federal government is consid-ering regulatory changes that could open up more opportunities for BWA providers. For example, the FCC and U.S. Department of Ag-riculture are eyeing plans to make broadband subsidy programs less oriented to incumbent telecom providers, more technology-neutral, and more focused on cost-effectiveness and speed of deployment. Spectrum sharing ini-tiatives are underway to provide additional unlicensed and affordable spectrum licenses to service providers. And the new chairman of the FCC, Ajit Pai — having himself grown up in rural America — has developed a ‘Digital Empowerment Agenda’ to prioritize expanded access to broadband in under-served areas of the United States.
Standards-based technologies give providers more choices
Capital availability and government support are growing
4
5

16
THE BWA INDUSTRY REPORT: 2017
Broadband Wireless Access Industry Report 2017, The Carmel Group.Copyright 2017, All Rights Reserved. Any unauthorized distribution or use is strictly prohibited.
The arrival of major new entrants is signaling a wave of growth in fixed wireless and the BWA sector. Google, AT&T, Verizon, Windstream, and other carriers have recently announced plans to deploy more fixed wireless, generally as an extension of their wired services. Many of these efforts target rural areas and are supported by the federal Connect America Fund. Other efforts target multi-dwelling units
(MDU) and commercial customers in urban and suburban areas.
These new entrants will further validate the business model and lend BWA providers greater credibility in capital markets and the halls of government. Long term, these compa-nies could pose a competitive threat or pres-ent exit opportunities for smaller providers.
New entrants are validating the business model
New markets and service categories = more opportunities
To date, fixed wireless technology has been most successful in rural America, where it offers high-grade service in areas with limited alternatives, locally based customer service, and superior economics compared to other broadband options.
However, BWA providers are beginning to enter higher-density markets due to the new technologies available, the faster deploy-ments possible, and the improving access to capital. For example, industrial parks, residen-tial communities, and government or institu-tional facilities are often found on the fringes of urban areas. Urban enterprise zones often have aging infrastructure and indifferent in-cumbent providers. We see growth in urban deployments utilizing 5G millimeter-wave technologies, which deliver high-capacity, high-speed services, albeit at shorter distanc-es.
For all the reasons described in this report, BWA providers are well positioned to com-pete in these neglected markets as well. The Carmel Group expects these higher-density markets could grow to represent 30 percent or more of industry revenues in the five- to ten-year time horizon.
On another front, the advances in equipment are enabling wireless networks to dramati-cally reduce latency, i.e., the delay between transmitting and receiving data. Broadband applications that depend on speed, reliabil-ity, and low latency – such as gaming, vid-eo-on-demand, the Internet of Things (IoT), and data backup for business and govern-ment – are among the most robust segments in the broadband market.
BWA operators interviewed for this report also noted that home security and automa-tion systems are ancillary services that can be conveniently packaged with fixed wireless broadband.
These growth drivers are not yet factored into our current growth forecast, which means the BWA outlook could have even more upside than that projected here.
6
7

17
THE BWA INDUSTRY REPORT: 2017
Broadband Wireless Access Industry Report 2017, The Carmel Group.Copyright 2017, All Rights Reserved. Any unauthorized distribution or use is strictly prohibited.
Fixed Wireless Versus Other Technologies
The various telecommunications technolo-gies have “pros and cons” that affect their suitability for various market requirements. The gaps in any one technology present clear opportunities for the others. Fixed wireless competes well with many of the alternatives. (See Figure 6.)
VERSUS MOBILE/CELLULAR
Mobile/cellular networks were developed for mobile voice service; data-intensive applica-tions came much later. In the mobile arena, customers typically buy a quantity of data per month and face extra charges or service re-strictions if they exceed data caps.
Mobile carriers typically use licensed spec-trum in the 700 MHz to 2.5 GHz range, which they buy at FCC auctions or on the second-ary market. These costs are passed through to consumers. On top of spectrum costs, the equipment needed to run mobile networks costs substantially more to own and operate than fixed wireless equipment.
In the mobile arena, tiny antennas that fit in-side of a handheld device and transmit signals on-the-go are the norm. Sadly, customers can do little but accept spotty connections and dropped calls caused by poor reception on the handheld device.
Fixed wireless BWA systems do not provide for mobility. However, they can ensure high reliability and efficient carriage of large vol-umes of data for customers in fixed locations through the use of large, outdoor, directional antennas.
The mobile/cellular industry also spreads supply, operations, and maintenance among a dizzying array of consumer electronics com-panies, equipment vendors, and telephone companies.
In contrast, fixed wireless providers typically do it all. They buy, install, and maintain every-thing in their network, from the “backhaul” into the system base, to the towers, to the fiber, to the consumer premises equipment both inside and outside their customers’ buildings.
VERSUS DSL, FIBER, CABLE AND SATELLITE
A remarkable 74% of American households have only one local provider of broadband
connections that can meet the FCC’s broadband speed standard of 25 Mbps down-load and 3 Mbps upload – consistently and at attractive prices. This fact alone indi-cates the need for policies to encourage more investment and competition.
In areas where consumers have two or more options, telco-provided Digital Subscriber Line (DSL) service is often the only competi-tor to fixed wireless. However, DSL is compar-atively slow and costs considerably more to deploy and upgrade than other technologies.
Fixed wireless BWA systems do not provide for mobility. However, they can ensure high reliability and efficient carriage of large volumes of data for customers in fixed locations.

18
THE BWA INDUSTRY REPORT: 2017
Broadband Wireless Access Industry Report 2017, The Carmel Group.Copyright 2017, All Rights Reserved. Any unauthorized distribution or use is strictly prohibited.
Many of the BWA leaders interviewed for this report said fiber-to-the-home (FTTH) tends to be their fiercest rival in those limit-ed areas where FTTH is available. Previous-ly-deployed-but-unused fiber provides good throughput and tends to be cost-competitive to the consumer. The economics of new fiber tend to limit it to higher-density markets and higher-traffic tower links.
Cable tends to be limited to more densely populated areas, and many cable systems still deliver services via aging infrastructure. State-of-the-art cable tends to be limited to the most profitable markets. Thus, BWA pro-viders enjoy several advantages over cable broadband in terms of reaching more far-flung customers with reliable, speed-com-petitive service, even in urban and suburban environments.
The relatively high latency of satellite broad-band limits its use for gaming and other low-latency applications. BWA providers, ca-ble, fiber, and mobile are all better suited for latency-sensitive applications.
Data caps among satellite providers further reflect the relative scarcity of today’s satellite broadband capacity. Conversely, data caps among BWA providers are quite rare.
However, it is worth noting that BWA provid-ers may occasionally team up with satellite broadband providers to offer broadband where typical terrestrial wireless services are not available.

19
THE BWA INDUSTRY REPORT: 2017
Broadband Wireless Access Industry Report 2017, The Carmel Group.Copyright 2017, All Rights Reserved. Any unauthorized distribution or use is strictly prohibited.
• Across the telecommunications and me-dia industries, there are intense competi-tive pressures and aggressive efforts by all kinds of service providers to attract and retain customers.
• Policymakers at all levels are less familiar
with BWA providers and fixed wireless than they are with larger incumbents using tra-ditional technologies. Hence, there tends to be a lack of policy support for BWA pro-viders and, indeed, there are many policies that tend to favor incumbent competitors.
• Detractors raise concerns about the sus-
tainability of unlicensed spectrum and spectrum sharing.
• Several of the largest broadband competi-tors – specifically telcos and cable compa-nies – have acquired significant interests in content companies, giving them the ability to offer consumers attractive ser-vice packages that feature their favorite networks and shows. As mostly small busi-nesses, BWA providers cannot compete with large, vertically integrated companies in this arena.
• The industry’s comparatively small size, especially on an average individual compa-ny basis, together with its lack of scale and consolidation, affect its ability to educate investors, legislators, regulators, media, and the general public.
BWA Providers Face Challenges
The Carmel Group believes that the fixed-wireless-based, Broadband Wireless Access industry will continue to experience robust growth in revenues, subscribers, and invest-ment, as well as increasing recognition in the United States’ telecommunications regulato-ry scheme – all primarily because of the many favorable conditions and trends described above.
Telecommunications industry stakeholders, investors, and policymakers can look forward to exciting days ahead for the BWA industry.
Conclusion
While the outlook for the BWA industry is highly positive, there are a number of challenges:

20
THE BWA INDUSTRY REPORT: 2017
Broadband Wireless Access Industry Report 2017, The Carmel Group.Copyright 2017, All Rights Reserved. Any unauthorized distribution or use is strictly prohibited.
As part of the extensive research conduct-ed for this report, in Q4 of 2016 The Carm-el Group received survey results from 169 Broadband Wireless Access (BWA) operators, who answered 80 questions on a variety of business issues. The response rate was an above-average 30% of the entire survey sam-ple. An additional BWA manufacturer/vendor survey was also completed. Topic areas of the Operator Survey includ-ed current subscribers, future subscribers, customer service, equipment, services, competition and competitive advantages, and business issues. The BWA operators’ answers to four of the 80 survey questions are provided below. These charts show that: Subscribers: Many BWA operators experi-enced robust growth in the number of new
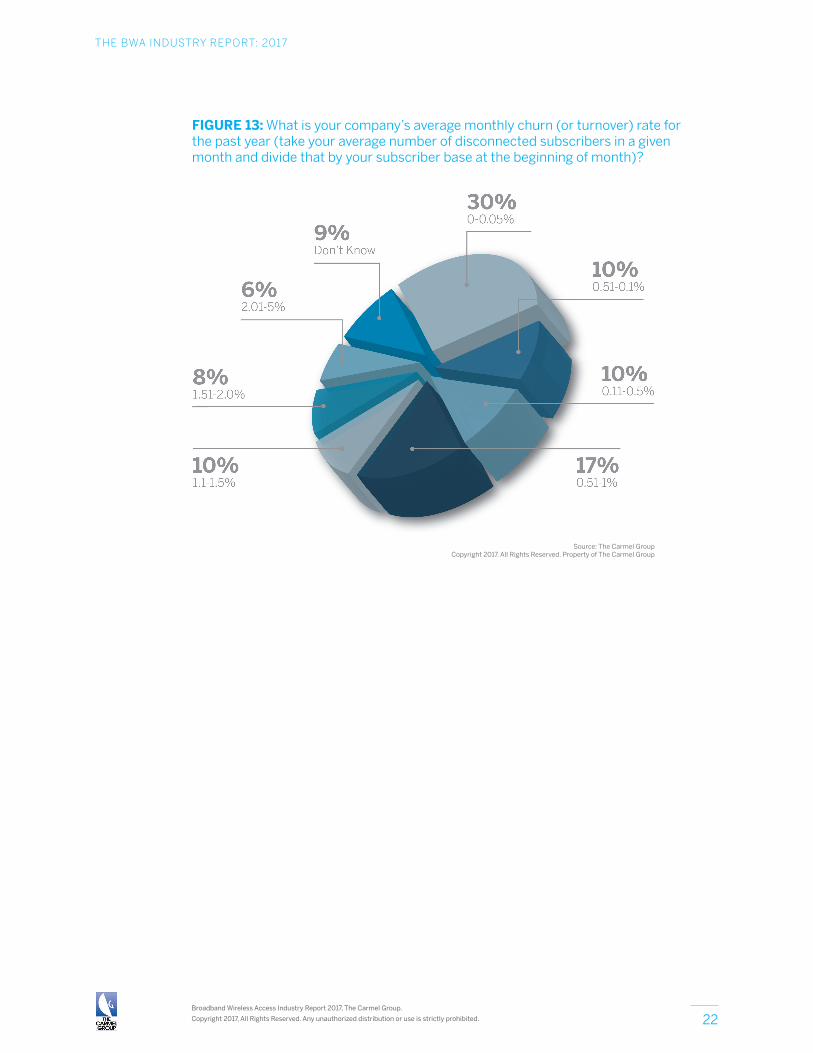
residential subscribers from 2015 to 2016, with roughly half reporting growth of 11% or more. SAC: Most of the respondents reported Sub-scriber Acquisition Costs (SAC) in the range of $200 to $400, which compares quite favor-ably to the SAC reported by cable, telco, and satellite providers for delivery of their video and broadband service. ARPU: Most respondents reported average revenue per unit (ARPU) in the range of $40 to $70, with the highest number of respon-dents having an ARPU in the $51-60 range. Churn: Most responding BWA operators experience low subscriber turnover relative to the competitors mentioned above, suggest-ing that those providers produce and deliver a highly satisfactory broadband product.
Appendix
FIGURE 10: What was your actual or best estimate of the annual residential subscriber growth percentage rate for your company during the past year?
Source: The Carmel GroupCopyright 2017. All Rights Reserved. Property of The Carmel Group

21
THE BWA INDUSTRY REPORT: 2017
Broadband Wireless Access Industry Report 2017, The Carmel Group.Copyright 2017, All Rights Reserved. Any unauthorized distribution or use is strictly prohibited.
FIGURE 11: What is your company’s average Subscriber Acquisition Cost (SAC) for a new residential customer?
FIGURE 12: What is your company’s most recent figure for average revenue per unit/subscriber (ARPU) for only residential users?
Source: The Carmel GroupCopyright 2017. All Rights Reserved. Property of The Carmel Group
Source: The Carmel GroupCopyright 2017. All Rights Reserved. Property of The Carmel Group
22
THE BWA INDUSTRY REPORT: 2017
Broadband Wireless Access Industry Report 2017, The Carmel Group.Copyright 2017, All Rights Reserved. Any unauthorized distribution or use is strictly prohibited.
Source: The Carmel GroupCopyright 2017. All Rights Reserved. Property of The Carmel Group
FIGURE 13: What is your company’s average monthly churn (or turnover) rate for the past year (take your average number of disconnected subscribers in a given month and divide that by your subscriber base at the beginning of month)?