britain’s property system before the industrial …matsumur/bogart.pdf5 empirical results. the...
TRANSCRIPT

We thank Jean-Laurent Rosenthal, Claudia Goldin, Gary Libecap, Lee Alston, Stergios Skaperdas, Linda Cohen, John Wallis, Tim Leunig, Richard Sylla, Mauricio Drelichman, and Joel Mokyr for helpful comments on earlier drafts. We also thank seminar participants at the University of British Columbia, New York University, and Washington Area Economic History Seminar and conference participants at meetings of the Economic History Society, the All-UC Group in Economic History, the International Economic History Association, and DAE Spring Institute at the NBER. We thank Francesca Labordo and Patricia Suzuki for research assistance. We thank the Parliamentary Archives for assistance and advice. We thank the University of California for financial support. Affiliations: Dan Bogart, Department of Economics, University of California at Irvine. Gary Richardson, Department of Economics, University of California at Irvine; National Bureau of Economic Research; and Mercatus Center. Keywords: Property rights; Coase; Industrial Revolution; Parliament; Institutions; Economic Growth JEL Codes: H1, K0, K1, N0, N43, P1, P14, P16, P26, P48
Adaptable Property Rights:
Britain’s Property System Before the Industrial Revolution
Dan Bogart Gary Richardson [email protected] and [email protected]
Around 1700, Britain’s Parliament established a forum
where rights to land and resources could be reorganized. This venue enabled landholders and communities to exploit economic opportunities that could not be accommodated by the inflexible rights regime inherited from the past. In this essay, historical evidence, archival data, and statistical analysis demonstrate that Parliament increased the number of acts reorganizing property rights in response to increases in the demand for such acts. Tests with placebo groups confirm the robustness of our results. This evidence corroborates a cornerstone of our hypothesis, that British property rights became adaptable in the century preceding industrialization.

1
… laws and institutions must go hand in hand with the progress of the human mind. As that becomes more developed, more enlightened, as new discoveries are made, new truths discovered and manners and opinions change, with the change of circumstances, institutions must advance also to keep pace with the times. We might as well require a man to wear still the coat which fitted him when a boy as civilized society to remain ever under the regimen of their barbarous ancestors.
Thomas Jefferson 1
1. Introduction
Secure property rights have been seen as a source of prosperity at least since the writings
of David Hume (1741) and Adam Smith (1776). Advocates of this idea include Ronald Coase,
Douglas North, and Barry Weingast (Coase 1960, North 1981, North and Weingast 1989). Their
conclusions, which have been widely cited, stem from studies of the British economy during the
eighteenth and nineteenth centuries (see, for example, Acemoglu et. al. 2005). Recent scholars
strive to determine additional dimensions of property rights regimes that promote economic
growth (Acemoglu and Johnson 2005, De Soto 2000). This essay advances that line of research
by studying the British property system in the century preceding industrialization. This exercise
reveals a dimension of the property system – adaptability – that was new in the eighteenth
century, unique to Britain at that time, perceived as crucial by contemporaries (see the quote by
Jefferson above), but overlooked by twentieth-century social scientists. Adaptable property rights
came to Britain around 1700, when Parliament created a forum that enabled landholders and
communities to reform rights to particular plots of property.
Before the creation of this Parliamentary process, the property-rights regime inherited
from Britain’s medieval past possessed characteristics common to landholding systems in
developing nations, past and present. A complex spectrum of overlapping rights (common,
1 Thomas Jefferson’s letter to Samuel Kercheval, July 12, 1816. This quote is inscribed on the south-eastern
interior wall of the Jefferson Memorial in Washington, DC.
2
communal, clerical, feudal, familial, statutory, and royal) enforced by an array of courts
(manorial, county, clerical, and royal) pertained to most plots of land. These courts lacked
uniform records and a unified framework for determining ownership, transferring rights, and
adjudicating disputes. The rights of families and ancestors received prominence over the rights of
individuals and descendents. Rights were secure and in many ways marketable. Individuals could
transfer rights to employ land in traditional uses. But, rights were inflexible.
This medieval system posed problems for people trying to reallocate resources towards
more productive uses, particularly opportunities arising from technologies unanticipated in the
distant past. Holders of estates could neither mortgage, nor lease, nor sell much of the land under
their control. Holders under many types of tenures could only transfer property to particular
persons or members of a local community. Residents often had to keep land in traditional uses.
Residents could neither utilize resources in new ways, nor improve infrastructure, nor repackage
rights without reaching agreements with all other parties possessing interests in a parcel, and
such agreements could not, in most cases, be enforced by law, but could, in many instances, be
challenged through courts.
Britain’s antiquated property system also inhibited localities from providing public
goods, particularly those extending beyond the bounds of traditional communities or those
necessitated by the expansion of commerce and cities. Communities lacked mechanisms for
raising revenues and powers of eminent domain. Communities struggled to overcome free-
riding, which inhibited the provision of public goods, and hold-outs, who withheld resources
needed for public projects unless paid exorbitant sums. Market transactions might have
alleviated these inefficiencies, but in most cases, the necessary transfers could not be
3
consummated and the requisite contracts could not be enforced because of the restrictive nature
of the rights regime, which valued tradition and stability above innovation and flexibility.
Inflexibility bedeviled Britain’s landholding system until the end of the seventeenth
century, when Parliament embraced novel ideas concerning property and began processing
petitions from groups hoping to reorganize rights to land and resources. Parliament reviewed
requests from individuals, families, and communities, and after considering the interests of all
concerned and the general public, rewrote rules regarding the use and ownership of property.
Parliament enshrined these accords in three types of acts: estate, statutory authority, and
enclosure. Estate acts altered the rights of individuals and families; eliminated restrictions on the
uses to which property could be put; authorized the sale, mortgage, and leasing of land; and
facilitated the enforcement of contracts. Acts establishing statutory authorities created new
organizations that built, operated, and maintained infrastructure and public services. Statutory
authorities received new rights, such as the authority to collect tolls, levy taxes, issue debt, and
purchase land. These rights superseded traditional rights, such as burgesses’ right to travel
throughout the realm free from tax and toll, enshrined for centuries in town charters and the
Magna Carta. Enclosure acts disbanded collectively-managed common-field villages and
assigned to individuals rights to particular pieces of property. Enclosure acts also shifted
commonly-held agricultural land to new uses, such as the construction of housing and workshops
near growing towns and cities. Acts of all three types embodied the public’s desire to reorganize
rights and to reallocate resources towards more productive uses.
This essay argues that the public approached Parliament and requested to reorganize
rights when economic opportunities made it profitable to do so. Parliament accommodated the
public’s demands. A principal testable implication of this adaptability hypothesis concerns the

4
relationship between economic conditions and the passage of estate, statutory authority, and
enclosure acts. If the adaptability hypothesis is correct, then conditions that increased returns
from reorganizing rights – for example, trade booms that increased returns to investing in
infrastructure or low interest rates that decreased the costs of financing construction – should
have encouraged people to propose and induced Parliament to pass larger numbers of acts.
Conditions that lowered returns from reorganizing rights should have reduced the number of
proposals, and in turn, Parliament should have passed fewer acts.
This essay tests these implications with new data on the number of acts that reorganized
property rights and new methods designed to exploit that information to the fullest possible
extent. Our methods begin with characterizations of the way in which people proposed and
Parliament passed acts. These assumptions yield a model of the Parliamentary process, a series
of reduced-form equations that can be estimated with the data at hand, and a logical way to
interpret these estimates. These methods enable us to account for econometric issues – such as
the non-stationarity and heterogeneity of the statistical series – that complicate the process of
drawing inferences from the data. These methods also enable us to examine placebo groups
consisting of acts similar to estate, statutory authority, and enclosure acts, but which did not alter
rights to land and resources. The placebos eliminate alternative explanations for the correlations
in the data, and thus, yield clear conclusions about the patterns in the evidence.
The rest of this essay carries out this endeavor. The second section reviews the literature
and sets the stage for our analysis. The third section describes estate, statutory authority, and
enclosure acts along with the procedures for passing these acts. The fourth section describes the
archival data that we employ and the new times series that we analyze. The fifth section
introduces our mathematical model and statistical methods. The sixth section describes our

5
empirical results. The concluding section discusses implications for economic growth in the
century preceding the Industrial Revolution and for the developing world today. Adaptability
may be a dimension of property-rights regimes that deserves academic attention.
2: Literature Review
Studies of eighteenth and nineteenth century Britain inspired social scientists’ emphasis
on secure property rights. Leading contributors in this literature are North and Weingast (1989),
who argue the Glorious Revolution of 1688 created a constitutional consensus in which
Parliament prevented the royal government from expropriating citizens’ property. The resulting
protection of private wealth encouraged investment and innovation, initiating Britain’s industrial
expansion. Historians question North and Weingast’s historical narrative. Gregory Clark (1996)
argues that secure property rights existed far into the English past. Expropriation occurred only
in exceptional circumstances, such as when individuals rebelled against the regime. Patrick
O’Brien (1994) argues that the Glorious Revolution weakened property rights. After the Glorious
Revolution, Parliament raised taxes, embarked on foreign wars, and regulated numerous
industries.
Alternative interpretations of Parliament’s impact on the economy abound. Joel Mokyr
(2002, 2003, 2005) argues that Britain experienced an Industrial Enlightenment, which extended
to Parliament’s economic policies. Paul Langford (1991) stresses Parliament’s involvement in
local legislation and argues that after 1688, propertied Englishman used their control of the
political system to benefit themselves and the larger economy. Julian Hoppit (1996, 1997)
documents the rapid expansion of Parliamentary activity after the Glorious Revolution and
argues that Parliament had a capacity to meet private and local demands for legislation. Hoppit’s

6
work builds upon a venerable tradition of categorizing and counting acts. Examples include Tate
(1967 and 1978), Turner (1980 and 1984), Innes (1997), and Wordie (1983).
We build upon this foundation by counting annual numbers of acts that altered property
rights between 1700 and 1830. We compare this count to economic and political variables that
influenced the benefits and costs of reorganizing rights to land. The spirit of this exercise
resembles the work of N.F.R. Crafts (1977) and Clark (2001). Both authors discuss the
correlation between the number of enclosure acts, wheat prices, and interest rates.
This essay extends that line of reasoning in several ways. First, it examines all acts that
altered property rights. Emphasizing this common feature of estate, statutory authority, and
enclosure acts reveals patterns previously obscured. Second, this essay derives statistical tests
from economic models that reveal how to interpret the estimates. Third, this essay emphasizes
statistical inference and identification. Its methods ensure that correlations between property
rights and economic incentives arise for real reasons, rather than statistical complications that
often generate spurious correlations between time-series variables that trend across time. Fourth,
this essay employs placebo groups to check the robustness of results.
This essay extends the law and economics literature by emphasizing the importance of
adaptable institutions. Scholars have examined adaptability in contexts such as the settlement of
the western United States and the Brazilian Amazon (see Libecap 1989, Alston, Libecap, and
Mueller 1999). These studies conceptualize the demand for establishing property rights as a
function of property rights’ economic value. The supply of rights depends upon the costs that
governments (and other entities) incur to establish and enforce rights. This notion of the demand
and supply of property rights forms the foundation for our statistical analysis.
3. Acts that Reorganized Rights to Land and Resources

7
This section describes estate, statutory authority, and enclosures acts, which comprised
over half of all legislation passed between 1700 and 1830. These acts possessed common themes.
All affected individuals’ and organizations’ rights. Some created new rights. Others altered or
annulled old rights. Some created new organizations, such as turnpike trusts. Others disbanded
existing organizations, including ancient entities, such as village councils and manorial courts.
3.1 Estates acts
Estate acts enabled holders of property to take some action prohibited by the rules under
which they had inherited their land. Estate acts were necessary because the inheritance system
limited estate holder’s power over their property, largely in an effort to adhere to the wishes of
the deceased (who bequeathed the property to their descendents as long as the latter fulfilled
conditions set out in the settlement), to protect the interests of dependents and heirs, and to
preserve a family’s estate for future generations (English and Saville, 1983, pp. 19-21). This
system of inheritance, known as strict settlement, solidified during the seventeenth century and
prevailed until the nineteenth century. A settlement was a generic name for a property
transaction and for the documents created in its consummation. While estimates vary, at the
peak, at least one-quarter and as much as three-fourths of land in England was held through strict
settlements (English and Saville, 1983, pp. 11-12, 30). English legal and social historians have
documented the operation of the system of strict settlements. We summarize that extensive
literature’s conclusions here (See for example, English and Saville 1983; Habakkuk 1994).
Three features of settlements generated a need for Parliamentary involvement. First,
without an act of Parliament, holders of settled estates could only change the terms of the
settlement when their heir came of age (i.e. reached the age of 21). Then, the holder and heir
(typically father and son) could join forces and amend the settlement via the process of common

8
recovery. Limited life spans meant that settlements could be changed only infrequently. A family
might wait decades (or generations) for an heir to come of age and for the holder and heir to
reach an agreement about restructuring the estate.
Second, settlements restricted the uses to which land could be put. The reason for these
restrictions was to protect the rights of dependents and future heirs. Holders of a settled estate
(who were just life tenants) could grant neither leases lasting beyond their lives nor leases from
which they benefited at the expense of their heirs (such as leases in which tenants paid lump
sums up front in return for concessions). Holders could seldom sell, swap, or mortgage property
under their control. Holders could not alter property, even if they considered the alterations to be
an improvement, without risking legal suits. The removal of trees, hedges, and buildings; the
mining of minerals, quarries, and peat bogs; and the conversion of arable lands into pasture (or
vice versa) could be considered waste, since these actions converted permanent resources into
current income. All those who benefited from such actions could be liable for damages if
dependents or heirs claimed to be harmed. Courts allowed sales, exchanges, mortgages,
improvements, and long-term leases only if the settlement contained specific clauses authorizing
such actions. Settlements written in the seventeenth and early eighteenth centuries seldom
provided such powers, although as the eighteenth century progressed and as the law concerning
settlements became increasingly sophisticated, settlements tended to provide broader powers.
Three, conducting transactions and enforcing contracts on settled land could be costly,
uncertain, and insecure. Settlements were long, complex documents, often unpunctuated and
repetitious.2 Interpreting settlements required experience, skill, detailed knowledge of the
document, and a large library of property laws, precedents, and legal texts estimated at 674
2 The fact that until the Conveyancing Act of 1881, solicitors were paid for conveyances by the word (1s for every
72 words in 1862), did not encourage conciseness (England and Seville, 1983, p. 18).

9
volumes in 1826 (English and Saville, 1983, p. 18). Settlements were not part of the public
record. Copies of the deeds were usually held by the settlers, trustees, and lawyers. Settlements
had to be consulted before taking out mortgages, drawing up leases, or completing sales, because
if the settlement did not specifically authorize a transaction, the transaction could be voided.
Ambiguities in settlements often deterred individuals from acting for fear that the transactions
would be disputed.
Estate acts solved these problems. As we show in a companion paper (Bogart and
Richardson 2008), estate acts facilitated the enforcement of contracts by clarifying permissible
transactions and the rights of pertinent parties. Estate acts authorized actions previously
prohibited by settlements such as the mortgaging of property, cutting of old-growth timber, and
mining of ores and minerals. Estate acts authorized the sale and leasing of land. The
authorization of sales and leases was one of the most significant economic effects of estate acts,
since large tracts of English land were exposed to market forces.
3.2 Statutory Authority Acts
Statutory authority acts fostered the construction, improvement, and maintenance of
infrastructure and social services. Statutory acts focused on particular topics. Transportation acts
promoted roads, bridges, river navigation, ports, canals, and railways. Urban improvement acts
provided for street paving, gas lighting, garbage collection, sewage extraction, water provision,
and police protection. Government building acts fostered the construction of prisons,
courthouses, and county administrative offices. Poor relief acts provided assistance for the poor
and encouraged the construction of workhouses. Court of small request acts established legal
forums for adjudicating credit contracts valued at less than 40 shillings. Lighthouse acts

10
authorized whomever built lighthouses on particular plots of land to collect tolls from all ships
that passed.
To accomplish these tasks, statutory authority acts created non-profit organizations and
enjoined the trustees of these entities to serve the public interest.3 The trustees tended to be local
landowners and merchants, who served without remuneration. For canals and railways, however,
statutory authority acts established for-profit organizations such as joint-stock companies, whose
directors purchased shares of the organizations and profited from their investments.
Statutory authority acts granted rights to these new organizations. One was the right to
levy user-fees and/or raise revenue through other means. A turnpike act, for example, authorized
a trust operating a turnpike to levy tolls on road-users and claim labor (or the equivalent in taxes)
from inhabitants along the road. The tolls marked a significant departure from the existing
system, in which parishes paid for road improvements with local labor and property taxes, and in
which individuals possessed the right of free passage, enshrined in medieval town charters and
confirmed by the Magna Carta. Trustees also received the right to issue debt and equity. The
bonds were secured by the tolls. If interest payments fell into arrears, bondholders could seize
the toll revenues.
Statutory authority acts gave organizations the right to purchase land along a route’s right
of way and defined procedures for doing so. The act authorized the organization to negotiate
with landowners. If the parties could not agree on the price for a necessary plot of land, the
organization could appeal to a body of commissioners who could compel the landowners to sell.
These procedures provided the legal origin for modern laws concerning eminent domain.
Statutory authority acts limited the powers of trustees. Turnpike acts, for example,
defined maximum tolls. In each act, a schedule distinguished different types of traffic and goods, 3 See Webb and Webb (1963) for a description of the organizations established by statutory authority acts.

11
and for each group, a maximum permissible toll. Similar schedules regulated the issuance of debt
and terms of interest.
Statutory authority acts could be amended by subsequent acts which clarified the rights
and responsibilities of the organization. Canal acts were often amended in order to add branch
lines or to increase the authorized capital. Turnpike acts had to be renewed, since they expired
after 21 years. Renewals often expanded trustees’ authority, by allowing them to manage a larger
road network or altering the schedule of tolls.
3.3 Enclosure Acts
Enclosure acts reorganized rights to property, usually in open-field agricultural villages.
At the beginning of the eighteenth century, approximately one-quarter of the arable land in
England lay in such villages, where residents shared rights to communal assets, such as water,
pasture, and woods. Villagers also shared rights in the large open fields, which served as
common pasture during fallow periods and as cropland during the growing season. The cropland
was divided among the residents, who possessed the right to grow grain on acre-sized plots
scattered throughout the fields and intermingled with those of their neighbors. Villagers managed
these collective assets, such as the open arable fields, through village institutions, including
customary laws and manorial courts.
Enclosure acts replaced collective ownership of common resources with individual
ownership of particular plots of land, and replaced collective management through village
institutions by individual management of personal estates. An enclosure act appointed a
commission to implement the terms of the act.4 The commission employed surveyors to draw a
map of the village with its open fields and strips, tofts and crofts, waste and pasture, and other 4 In 1801, the first General Enclosure Act simplified the administration of enclosure bills by providing guidelines
for those drafting enclosure bills and parameters for permissible outcomes.

12
physical features. The surveyors recorded the holders of rights to all of these assets. At a series
of public meetings, holders of land (and all other rights in the village) advanced claims as to
what they should receive under the new arrangements. The commissioners decided on the
validity of these claims. After they made their decisions, the surveyors created a map of the new
village, displaying the new features, such as fields, roads, fences, and irrigation channels, and the
owners of each.
3.4 The Process of Passing Acts
In the 1690s and early 1700s, Parliament standardized procedures for processing estate,
statutory authority, and enclosure bills. Estate acts began with a petition from an individual or
family desiring to change the rules regarding their estate. The petitioner hired a lawyer
specializing in estate law to prepare their paperwork. A Parliamentary committee investigated
the merits of the petition and issued a report. Petitions deemed beneficial to all interested parties
were written into bills, read to the public three times, passed through both Houses of Parliament,
and then sent to the King for royal assent. Public notice ensured that individuals with interests in
the estate knew about the proposal. Parties could oppose the bill by submitting counter-petitions
to either house of Parliament. Parliamentary committees considered the contending proposals,
and then passed one of the bills, modified the original bill to satisfy the opposition, or rejected
both proposals. The multiple layers for review and numerous opportunities for opposition
ensured that Parliament considered the interests of all concerned before coming to a decision
(English and Saville, 1983, p. 50).
Statutory authority acts began with a petition from a community stating a problem, such
as insufficient road capacity between two places, and proposing a solution, such as the creation
of a turnpike between the cities. Leading members of the community hired lawyers to prepare

13
their petitions. A Parliamentary committee considered the petition and drafted a bill on this issue.
The bill was read publicly three times before both houses of Parliament. The readings allowed
potential opponents to express opinions and propose amendments. Advocates and opponents
typically hired solicitors to present their cases and promote their interests. Like modern-day
lobbyists, these solicitors maintained regular contact with members of the committees working
on these issues.
Enclosure acts went through a similar procedure. Parities interested in an enclosure held a
series of public meetings in their village to discuss the issue, and then drafted a petition signed
by a sufficient group (typically four-fifths) of individuals possessing rights to the land under
consideration. Advocates submitted the petition to Parliament, where the bill was read publicly
three times and considered by both houses.
These procedures provided individuals and communities many avenues for approaching
Parliament. Numerous lawyers and law firms handled petitions concerning property rights.
Lawyers could be hired from local communities or from London. Members of the Parliament
could sponsor bills from any constituency. Members often sponsored local projects, but could
(and did) sponsor bills from anywhere in the realm. Parliamentary committees were large, often
consisting of more than thirty members. Parliamentary procedures invited members of
Parliament from all nearby counties to participate in the meetings. Members of Parliament from
any political party could sponsor bills. Evidence indicates that after 1720, members from the
minority party were as likely to sponsor a bill as members from the majority. These facts indicate
that no group controlled access to acts altering property.
4. Data

14
The Parliamentary Archive is the principal repository for historical information on acts of
Parliament. The Archive maintains a computerized catalogue, Portcullis, which indicates the
clerical title, calendar year, regal year, and parliamentary session for all acts passed since the
sixteenth century.5 Clerks inscribed clerical titles on the exterior of a roll of parchment
containing the full text of an act when Parliament reviewed the original legislation. The clerical
title summarized the act, usually in a concise paragraph containing enough information for the
clerks to identify the act and its principal provisions amidst thousands of similar pieces of
parchment, without opening the rolls to read the full text.
An earlier paper explains our process for converting the clerical title of every act of
Parliament into a vector of variables (Bogart and Richardson, 2007). In this essay, we convert
those vectors of variables into time series suitable for statistical analysis. Tables 1 through 3
describe those series. The top-half of Table 1 describes estate acts. Row (a) refers to the series
indicating the total number of estate acts passed each year. Column (1) indicates that ALL of
these acts altered property rights. Column (2) indicates that SOME of these acts also altered
personal rights. Columns (3) through (6) describe the statistical properties of the series. We refer
to this as the series in “levels”, since it is based on the raw series indicating the annual number
(or level) of acts passed. Column (3) indicates the annual average. Column (4) indicates the
standard deviation. Column (5) indicates the minimum number passed in a single year. Column
(6) indicates the maximum number. Columns (7) through (10) present the same information for
the series in differences (i.e. the change in the number of acts passed from year t-1 to year t).
Row (b) describes a time series indicating the annual number of estate acts that authorized the
sale of property. Row (c) indicates the annual number of estate acts that authorized the leasing of
5 http://www.portcullis.parliament.uk. The clerical titles within Portcullis were first published in two nineteenth
century compilations of Parliamentary legislation, Statutes of the Realm (Great Britain, 1800) and Statutes at Large (Great Britain, 1807), which were computerized during the 1990s.

15
property. Row (d) indicates the annual number of acts that authorized either sales or leases. Our
analysis emphasizes estate acts authorizing sales and leases because these acts placed land long
bound by the fetters of the past onto the market.
The bottom-half of Table 1 describes data that serve as a comparison (or placebo) group
for estate acts. These non-estate private acts dealt with issues of marriage, naturalization, and
appointments to office. These appear in rows (e) through (g) respectively. The sum of these
series appears in row (h). Marriage acts permitted individuals to marry and/or divorce in
contravention of secular and religious statutes. Naturalization acts provided foreign-born
denizens with the rights of native-born citizens. Office acts appointed individuals to positions in
the royal household, courts of law, executive agencies, and other positions that provided
government-funded livings. Important similarities existed between these marriage,
naturalization, and office acts (collectively called non-estate private acts) and the estate acts
examined in the top of the table. When processing all of these acts, Parliament followed common
procedures. Similarities also existed in the clientele that requested these acts, the demographic
and social forces that generated demand for these acts, and the political factors that influenced
the supply of these acts. A key feature, however, distinguishes estate and non-estate private acts.
The value of estate acts varied with economic conditions that influenced the costs and benefits of
reorganizing rights to land. The value of marriage, naturalization, and office acts did not.
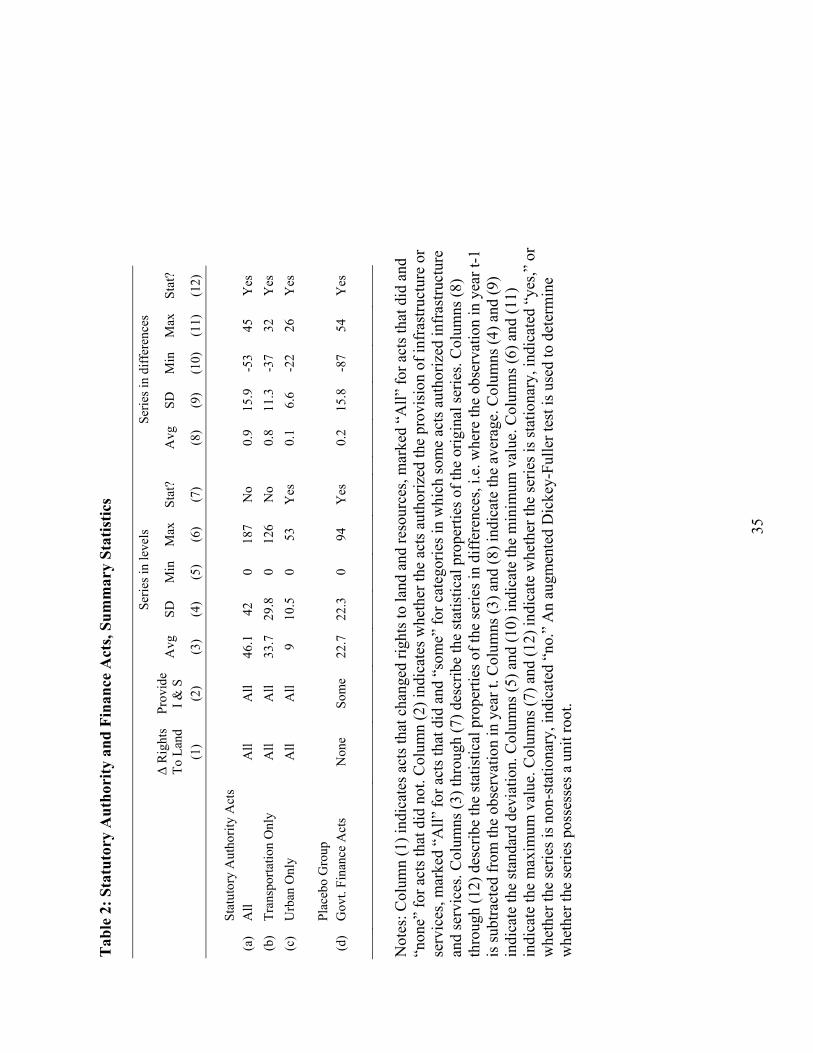
The top-half of Table 2 describes statutory authority acts. Row (a) indicates the annual
number of statutory authority acts passed each year. Row (b) indicates the annual number of acts
pertaining to transportation, principally roads, canals, harbors, rivers, bridges, and railways. Row
(c) indicates the annual number of acts pertaining to urban improvements, principally the
provision of water, sewers, market infrastructure, public buildings, gas lighting, garbage

16
collection, church maintenance, courts of small request, poor relief, prison construction, and
police protection. Column (1) indicates whether these acts reorganized rights to land and
resources. Column (2) indicates whether these acts facilitated or financed the improvement of
infrastructure (I) or the provision of public services (S). The definitions of the columns (3)
through (6) and (8) through (11) are identical to the definitions of the corresponding columns in
Table 1. Columns (7) and (12) indicate whether the series are stationary, as determined by an
Augmented Dickey-Fuller Test. While several series are non-stationary in levels, all of the series
are stationary in differences.
The bottom-portion of Table 2 describes statutory authority acts’ placebo group:
government finance acts. These acts dealt with national government expenditure and taxation.
Most pertained to excise, customs, and land taxes; purchasing ships; provisioning of military
forces, and constructing military fortifications. Like statutory authorities, these acts financed the
provision of public goods, and their passage through Parliament required balancing local and
broader interests. Unlike statutory authority acts, however, demand for these acts depended
largely on the dictates of foreign affairs, and little on the costs and benefits of reorganizing rights
to land and resources.
Table 3 describes enclosure acts. The last row of the table describes the placebo group,
amendments to enclosure acts. Amendments serve as an illuminating comparison because their
passage followed procedures identical to initial enclosure acts, but demand for amendments
arose primarily after random instances when errors crept into original legislation during the long
process of passing Parliament.6
6 The accuracy of the data depicted in Tables 1 through 3 depends upon our ability to accurately determine the
date on which acts passed. For most of our sample period, a convention dated all acts passed by a session of Parliament as if they passed on the opening day of the session. This convention lingered from an earlier period when Parliament met infrequently at royal request and handled a limited volume of business in a short time

17
Table 4 lists the explanatory variables. Rows (a) and (b) refer to two variables, the real
interest rate and the volume of foreign trade, which influenced the demand for estate, enclosure,
and statutory authority acts. The real interest rate determined the cost of investment and rate of
intertemporal exchange, which were principal factors determining the returns from reorganizing
property rights.7 The volume of foreign trade was linked to aggregate economic activity, which
was a principal determinant of revenues earned from improving infrastructure and reallocating
resources towards new and more productive uses. The volume of trade also measured the health
of the industrial and mercantile sectors relative to the agricultural economy.8
Rows (c), (d), and (e) refer to variables that influenced the political process for passing
acts. These variables – years when the monarch died, years when a new prime minister assumed
office, and years when Parliamentary elections occurred – influenced the number of days that
Parliament sat in session, legislators’ incentives for passing local legislation, and other factors
generating annual variation in Parliamentary productivity.9 Additional explanatory variables,
listed in Rows (f) through (j), include indicators for years when Britain was at war, when Britain
suffered disease epidemics, and when Britain changed the structure of its land tax system. The
period. In the eighteenth century, Parliament met annually. Sessions began in the fall, usually in the months of October, November, or December; lasted throughout the winter; and adjourned in the spring. Complications arose, however, in the winters of 1714-1715, 1751-1752, and 1760-1761, when the monarch died, and/or Parliament opened late. In 1714, for example, Queen Anne died. George I assumed the throne. His ascension delayed the opening of Parliament until January of 1715. This parliament adjourned in the spring and another opened on schedule during the next fall. So, in the year 1715, the conventional dating method assigned the acts passed in two Parliamentary sessions – the winters 1714-15 and 1715-16 – to one calendar year, 1715. We correct for this confusion in two ways. First, we run regressions with the raw data, while assigning dummy variables to the years in which Parliament did not meet and the years in which Parliament met twice. Second, we drop the period of problematic dating from our sample, and run regressions for the years 1763 through 1830, when all acts are precisely dated. The two methods yield similar results.
7 Our real interest rate is the nominal interest rate, measured as the yield on long-term government bonds, known as 2 ½ % consols from Neal (1990), minus inflation, measured as a three-year moving average of the percentage change in Clark’s (2001) consumer price index.
8 Our measure of the volume of foreign trade, like most scholars, is the sum of the official value of imports plus exports (Mitchell, 1988). The official values reflect changes in the quantity of imports and exports weighted by a particular set of prices fixed at the outset of the eighteenth century.
9 We take these variables from histories of England and its government by Holmes (1993), Holmes and Szechi (1993), and Evans (2001).

18
set of explanatory variables also includes the land tax rate in shillings per acre and an index of
climatic conditions, based on tree ring measurements, which reflects exogenous factors affecting
agricultural productivity.
5. Methods
This section establishes a framework for analyzing data described in the preceding
section. The objective is to organize our thoughts and to elucidate reasonable ways in which to
interpret patterns in the evidence. The exercise begins with intuition standard among social
scientists. Private parties desired Parliament to pass acts. Their desires fluctuated as the value of
acts fluctuated. Economic conditions which altered the net benefits of reorganizing rights
propagated those fluctuations. Economists summarize such relationships with an inverse demand
function.
(1) ( )XqFp dd ,=
In this equation, pd indicates the maximum amount that the public would expend to secure the
passage of a certain quantity of legislation, qd. X indicates the array of economic factors that
influenced the net benefits of legislation. X ={x1, x2, …, xI}, where xi represents the ith factor. To
keep the notation clear, assume ∞<∂∂< ixF0 Ii ,...,1=∀ . Since F represents demand,
0<∂∂ qF .
The number of acts depended upon the time, effort, and resources that the legislature and
bureaucracy expended in the approval process as well as factors that influenced legislative
productivity, such as elections, changes in governments, monarchial mortality, and the need to
devote time to alternative matters, such as discussing military and international affairs. The
number of acts passed also depended upon the lawyers, lobbyists, and peripheral personnel that
supplicants employed to prepare and advance their petitions as well as the procedures, campaign

19
contributions, and side payments – both in London and the local community – that lubricated
lawmaking in London.
Petitioners had numerous routes for bringing bills before the Houses of Lords and
Commons. Petitioners could choose among many lawyers that prepared petitions and approach
almost any member of Parliament. As a first-order approximation, we summarize this process
with a supply function.
(2) ( )ZqGp ss ,=
ps indicates the costs of passing a quantity of legislation, qs, during a particular year. Z indicates
the array of factors influencing the supply of legislation during that year. Symbolically, Z ={z1,
z2, …, zJ}, where zi represents the jth factor. To keep the notation clear, assume
JjzG j ,...,10 =∀>∂∂ . In the short run, increasing the quantity of acts required more
intensive employment of factors with diminishing returns and rising costs. So, 0≥∂∂ qG .
The interaction of supply and demand determines the quantity of acts that Parliament
passes. This equilibrium occurs when the demand price, pd, equals the supply price, ps, plus some
markup, m.
(3) mpp sd +=
If the markup exceeds zero, then someone in the act-passing process (either lobbyists, opponents
of the legislation, or members of Parliament) were able to extract some of the surplus generated
by the legislation, and the equilibrium occurs at the intersection of the supply and marginal
revenue curves. If the markup equals zero, then the act-passing process was completely
competitive, and the equilibrium occurs at the intersection of the demand and supply curves.
Substituting Equations (1) and (2) into Equation (3) reveals the number of acts passed in
equilibrium.

20
(4) ( ) ( ) mZqGXqF =− ** *,*,
Here, the asterisk superscript indicates quantities of variables in equilibrium. Rewriting the
equilibrium condition emphasizes the implicit relationship between the equilibrium values of the
variables.
(5) ( ) ( ) ( ) mZqGXqFZXqH =−≡ **** *,*,,*,
The implicit function theorem describes the relationship between the function, H, the equilibrium
level of quantity demanded, q*, and the variables that shift supply and demand, X and Z.
(6) ( )**,* ZXQq =
(6’) ( )( )
( )( ) ( ) */*,*/*,
/*,/,*,/,*,)1(*
**
*
***
**
qZqGqXqFxXqF
qZXqHxZXqH
xq ii
i ∂−∂∂∂∂∂−=
∂∂∂∂−=
∂∂
(6’’) ( )( )
( )( ) ( ) */*,*/*,
/*,*/,*,
/,*,)1(***
*
**
**
qZqGqXqFzZqG
qZXqHzZXqH
zq ii
i ∂−∂∂∂∂∂−=
∂∂∂∂−=
∂∂
The total differential of (6) provides a linear approximation of the relationship in the
neighborhood of the equilibrium.
(7) ( ) j
J
j ji
I
i i
dzzqdx
xqZXDQDq ∑∑
== ∂∂+
∂∂==
11
** **,*
This relationship can be estimated with the data described in the preceding section. The change
in the quantity of acts, Dq*, is the change in the number of acts passed from year t-1 to year t.
The changes in the independent variables, dxi and dzj, are changes in variables that influence
demand and supply from year to year. The estimating equation is
(8) ttj
J
jjti
I
iit zxA εβα +∆+∆=∆ −
=−
=∑∑ 1,
11,
1
where ∆At is the change in the number of acts from t-1 to t. ∆xi,t-1 is the change in the ith demand
shift variable from t-2 to t-1. αi is an estimate of ixq ∂∂ * . ∆zj,t-1 is the change in the jth supply

21
shift variable from t-2 to t-1. βj is an estimate of jzq ∂∂ * . εt is an error term. Explanatory
variables are lagged one-year to capture the time necessary to respond to changing
circumstances, prepare petitions, approach Parliament, and request acts.10
Our estimates of ixq ∂∂ * and jzq ∂∂ * do not allow us to recover the parameters of the
underlying supply and demand curves, F and G. However, our estimates do enable us to
characterize the shapes of those curves. Propositions 1 and 2 indicate how.
Proposition 1. If 0* ≠∂∂ ixq for some i, then ( ) ∞<∂∂ *** /, qZqG . Proof. This is a proof by contraposition. Assume ( ) ∞=∂∂ *** /, qZqG . Then,
( )( ) 0
/,/,
***
*** =∞−∂∂
∂∂−=∂∂
qXqFxXqF
xq i
i
Ii ,...,1=∀ because ( ) qXqF ∂∂ /, ** < 0 and
( ) ∞<∂∂ ixXqF /, ** . In prose, Proposition 1 indicates that if the quantity of acts fluctuated in response to fluctuations
of one (or more) of the factors that influenced the demand for acts, then the supply curve for acts
was not perfectly inelastic.
Proposition 2. If 0* ≠∂∂ jzq for some j, then ( ) −∞>∂∂ *** /, qXqF . Proof. This is a proof by contraposition. Assume ( ) −∞=∂∂ *** /, qXqF . Then,
( )( ) 0
/,/,
***
*** =∂∂−∞−
∂∂−=
∂∂
qZqGzZqG
zq j
j
Jj ,...,1=∀ because by definition ( ) *** /, qZqG ∂∂ ≥
0 and ( ) ∞<∂∂ jzZqG /, ** .
In prose, Proposition 2 states that if the quantity of acts fluctuated in response to fluctuations of
one (or more) of the factors that influenced the supply for acts, then the demand curve for acts
was not perfectly inelastic.11
10 A one-year lag seems to be the most sensible specification, given the nature of the decision-making and
Parliamentary process. Our regression’s lag structure is robust to reasonable permutations. Regressions using contemporaneous changes or lags distributed over spans up to five years yield qualitatively identical results.

22
In cases where economic theory or external evidence indicate that a variable shifts only
demand (or only supply), then our estimates reveal more about the shape of the demand (or
supply) functions. For example, standard investment theories and previous historical studies
indicate that the real interest rate influenced the demand for investing in infrastructure, and thus,
the demand for acts of Parliament reorganizing rights to enable investment in infrastructure. If
the estimated coefficient on the real interest rate is large, then either the interest rate had a large
effect upon the demand for acts, or the supply of acts was highly elastic, or both. Similar
arguments hold true for variables that shifted the supply of acts. In cases of variables that shifted
both the supply and demand, our estimates reveal the net effects.
Our placebo groups ensure that our assumptions about whether variables shifted demand
or supply are accurate. Our placebo groups also reinforce our results in other ways. It possible
that our regressions do not control for an unobserved factor correlated with both an independent
variable (such as the real interest rate) and the number of acts reorganizing rights to land and
resources (our dependent variable). The exclusion of this unobserved variable might make it
appear as if the real interest rate influenced the demand for acts, when in actuality, the excluded
variable was the source of the correlation. Placebo groups indicate whether correlations existed
between our independent variables (such as the real interest rate) and acts that did not reorganize
rights to land and resources. If such correlations existed, then our regressions may reveal
spurious, rather than real, relationships.
11 Determining whether αi, our estimate of ixq ∂∂ * , and βj, our estimate of jzq ∂∂ * , differ from zero involves
hypothesis tests. For the null hypothesis αi = 0, the alterative hypothesis is αi ≠ 0. For the null hypothesis βj = 0, the alterative hypothesis is βj ≠ 0. The test statistic has a t-distribution.

23
6. Results
Table 5 presents results of this exercise for estate acts.12 Column (1) regresses the year-
to-year change in the annual number of estate acts on year-to-year changes in the variable that
should have influenced the demand for estate acts: the real interest rate. The regression spans the
124 years for which we have data suitable for statistical analysis. The initial year, 1705, lies
close to the point where Parliament formalized procedures for processing acts regarding property
rights. The final year, 1830, lies close to the nationwide reform of Parliamentary elections and
procedures enshrined in the Great Reform Act of 1832. The regression reveals a correlation
between changes in the number of estate acts and changes in the real interest rate. When the
interest rate rose and the cost of investing increased, the number of estate acts fell, as our
hypothesis predicts. The correlation is significant in statistical terms and substantial in
magnitude. Column (2) adds year-to-year changes in three explanatory variables that influenced
the productivity of parliament: election years, changes of the prime minister, and the death of a
monarch. In this specification, as in all others, the coefficient on the real interest rate remains
statistically and economically significant. Column (3) adds additional explanatory variables,
including year-to-year changes in the real land tax rate, years where the tax code changed,
changes in climate (derived from tree-ring data), changes in the disease environment (as
measured by the onset and end of epidemics), and changes in belligerent status. The real interest
12 While some of the series, At, xi,t-1, and zj,t-1, exhibit trends and are non-stationary, the differences of those series,
∆At ∆xi,t-1 ∆zj,t-1, which enter the estimating equation, are stationary. For some of the differenced series, the error term, εt, is auto correlated and heteroskedastic. Therefore, the Newey-West procedure for estimating a heteroskedastic and autocorrelation consistent covariance matrix is an appropriate method for calculating the standard errors of our estimates (Newey and West 1987).

24
rate remains significant. An array of robustness checks demonstrates that these regressions are
robust to a wide range of alternative specifications.13
Columns (4) through (6) perform the same exercise for a placebo group: marriage,
naturalization, and office acts. These non-estate private acts resembled estate acts in many
dimensions but the value of placebo acts did not depend upon returns from reorganizing rights to
land and resources. The coefficients are insignificant, indicating that excluded variables which
influenced private acts’ passage through Parliament did not drive the results of specifications (1)
through (3). The insignificant coefficient also corroborates our conclusion that changes in the
real interest rate altered the demand for acts reorganizing property rights, since if interest rates
influenced the way in which Parliament supplied acts, then changes in interest rates should be
correlated with changes in all types of acts, including non-estate private acts.
Columns (7) and (8) reinforce this result. Column (7) employs non-estate private acts as
an explanatory variable. Column (8) employs the residual from a regression of all non-estate
private acts on the explanatory variables in columns (4) through (6). The results of these
regressions indicate that non-estate private acts were correlated neither with the real interest rate
nor with acts that reorganized property rights.
Table 6 replicates these results for the years 1763 to 1830, which span the generations
during which the Industrial Revolution began, spread, and accelerated. The years also span the
period for which all acts are accurately dated and other statistical series pose the fewest
problems. Columns (1) through (3) and (6) through (10) demonstrate that the relationship
between real interest rates and the number of acts reorganizing rights to land holds for this key
13 Neither the signs nor the significance levels of the coefficients change when the endpoints of the analysis change
by up to two decades. The signs and significance levels are also invariant to the inclusion of additional explanatory variables such as year-to-year changes in the level of population, industrial production, and Parliamentary majorities.

25
period and for the cleanest data. Column (4) shows that these results hold when the dependent
variable is limited to acts that authorized sales of strictly-settled land. Column (5) shows that
these results hold when the dependent variable is limited to acts that authorized the lease of
strictly-settled lands. Overall, Tables 5 and 6 indicate that changes in the interest rate coincided
with changes in the number of acts authorizing the sale, lease, and reorganization of land.
Table 7 presents the results for statutory authorities. Column (1) regresses the change in
the number of statutory authority acts on the variables that influence the demand: the change in
the real interest rate and the change in the level of trade. Column (2) adds to the regression
variables that shift the supply curve including years of elections, changes in the prime minister
(and thus, the coalition controlling Parliament), and the death of the monarch. Column (3) adds
to the regression our vector of control variables. Column (4) regresses the same variables for the
years 1763 to 1830, for which the dating of acts poses no problems. Column (5) regresses
changes in the number of transportation acts on the full spectrum of independent variables
introduced in the previous column. Column (6) regresses changes in the number of acts
pertaining to urban services and infrastructure on the full spectrum of independent variables.
The result reveals a strong statistical correlation between economic conditions that
influenced the value of statutory authorities and the number of statutory authorities passed by
Parliament. The magnitude of the coefficients on our demand shift variables averages a little less
than -1.0 for the change in the real interest rate and a little below 1.0 for the change in trade. The
standard errors on those variables average about 0.30 and 0.28 respectively. The small size of the
standard errors relative to the magnitudes indicates that the coefficients are measured precisely.
The null hypothesis that the coefficients equal zero is rejected at the 1% significance level. This

26
result holds for all specifications, including numerous permutations which we examined to
determine the robustness of our result, but which to save space, have not included in this essay.14
How responsive was Parliament to changes in the demand for acts reorganizing rights? A
few calculations reveal the answer to this inquiry. The standard deviation of the change in the
real interest rate is 4.90. The average of coefficient on the real interest rate in columns (1)
through (3) is -1.04. Multiplying those numbers indicates that a one standard deviation decline in
the real interest rate coincided with an increase of 5.05 in the number of statutory authority acts.
The standard deviation of the change in the number of statutory authority acts is 16.84. Thus, a
one standard deviation decline in interest rates explains approximately 30% (~5.05/16.84) of a
standard deviation change in the number of statutory authority acts. Similarly, the standard
deviation of the change in trade is 4.66. The average of the coefficient on trade in columns (1)
through (3) is 1.02. The product of those numbers is 4.8. Thus, a one standard deviation change
in the volume of trade explains 29% of a standard deviation change in the number of statutory
authority acts. Parliamentary accommodation of the public’s demands, in other words, explains
the majority of the annual fluctuation in statutory authority acts.
Columns (4) and (5) indicate that this finding holds for subcategories of statutory
authorities associated with the modernization of the English economy: transportation
improvements and urban expansion. Multiplying the standard deviation of the real rate with the
coefficient in Column (5) and dividing by the standard deviation of transportation acts (11.9)
14 Neither the signs nor the significance levels of the coefficients change when the endpoints of the analysis change
by a decade or more. Regressions employing data only for the period for which we can date acts precisely (1764 to 1830) yield coefficients nearly identical to those for the full sample. The estimates are also unaffected by the inclusion of additional explanatory variables. When the change in industrial production appears as an explanatory variable, the results remain the same, and industrial production is insignificant, unless trade is excluded. In the latter case, the coefficient on industrial production becomes statistically and substantively significant and explains about as much of the variation in the dependent variable as had trade. Adding indictors for the onset and cessation of military hostilities does not alter the results. Interacting years of military conflict with the principal explanatory variables strengthens the results.

27
indicates that fluctuations in the real rate explain 23% of the fluctuation in transportation acts.
Similar calculations indicate that fluctuations in the real rate explain 21% of the fluctuation in
acts for improving infrastructure and public services in urban communities. Fluctuations in trade
explain 23% of the variation in transportation acts and 23% of the variation in urban acts.
Columns (7) and (8) examine the placebo group: changes in the number of government
finance acts. These acts are uncorrelated with changes in interest rates and changes in the volume
of trade. Adding them as an explanatory variable alters neither the signs nor the magnitudes of
the other explanatory variables.
Table 8 examines enclosure acts. Columns (1) through (3) show the number of enclosures
increased when interest rates fell, and the number of enclosures fell when interest rates rose. This
result reinforces the findings of previous studies showing an inverse correlation between interest
rates and enclosures (Crafts 1977 and Clark 2001). We show that this relationship exists even
after controlling for confounding variables and autocorrelation. We also show that the
relationship between enclosures and interest rates resembles the relationship between statutory
authorities and interest rates in quantitative terms. A one-percent decline in real interest rates, for
example, increased the number of enclosures by roughly one-half of an act and increased the
number of transportation acts by the same amount. Column (4) shows that there is no correlation
between enclosure amendments and interest rates, which suggests that the variation in the
number of enclosure acts was not driven by changes in unobserved factors correlated with our
explanatory variables (i.e. factors that altered the costs or benefits of creating acts).
Together, Tables 5 through 8 illuminate two important patterns. First, the equilibrium
number of acts reorganizing property rights changed in response to changes in the interest rate
and volume of trade, two of the principal factors influencing the returns from reorganizing

28
property rights. Our demand-and-supply framework reveals one way to interpret this result. The
supply curve for acts of Parliament was not inelastic. The political process, in other words,
responded flexibly to demands to reorganize property rights.
Second, the equilibrium number of acts reorganizing property rights also changed in
response to political factors. In most specifications of our regressions, for example, the number
of acts declined in the year after an election. The decline was often sizeable. On average in years
after elections, Parliament passed seven fewer statutory authorities, six fewer enclosures, and
three fewer estate acts.15 Elections might have influenced the passage of legislation in many
ways. Elections altered the length of time that Parliament sat in session, legislators’ incentives
for passing local legislation, the stability of political coalitions, the composition of committee
membership, and the experience level of persons sitting in Parliament.
Our demand-and-supply framework reveals an interpretation of this result. Since supply
factors influenced the number of acts passed by Parliament, the demand curve for acts sloped
downwards. In other words, when the price of obtaining acts reorganizing property rights
increased (or decreased), the number of acts that the public desired decreased (or increased).
7. Discussion
At the opening of the eighteenth century, Parliament established a forum for reorganizing
rights to land and resources. This venue enabled individuals, families, and communities to
exploit opportunities that could not be accommodated by the inflexible rights regime inherited
from England’s past. The previous sections of this paper showed that Parliament responded to
the public’s desire to adapt property rights to changing conditions. Property rights became
15 In some specifications of our regressions, the number of acts changed in the year after a new prime minister
assumed office or the monarch died, although the sign and significance of these coefficients varied across specifications.
29
adaptable, in other words, in the century preceding industrialization. Did adaptability make a
difference? This section addresses that question.
Evidence from an array of sources indicates that acts reorganizing property rights
encouraged economic development. Statutory authorities facilitated the urbanization and
commercialization of the English economy. Statutory authorities provided fresh water, removed
garbage, aided the indigent, operated forums for dispute resolution, and financed police forces.
These services were essential for enabling large populations to live in small areas. Statutory
authorities established a high-volume, long-distance transportation network. Canal companies
enabled coal to reach emerging manufacturing centers. Harbor-improvements increased the
number and draft of ships which could load and unload, facilitating the expansion of maritime
commerce. Turnpikes reduced freight charges and travel times by widening, resurfacing, and
maintaining thoroughfares (Bogart, 2005).
Enclosures served as a catalyst for increasing agricultural productivity (Richardson,
2001). Enclosures enabled farmers to introduce new crops, improve livestock, reduce overuse of
common resources, and react to market opportunities.16 Enclosures had additional effects that
scholars have yet to study but that appear often in our database. Enclosures authorized the
recovery of wastelands, the drainage of fens, and the construction of irrigation channels.
Enclosures transferred agricultural land to urban and industrial uses, particularly near expanding
towns and cities.
Estate acts – particularly those authorizing the sale and lease of land – exposed land to
the invisible hand. Freeing resources from the shackles of the past loosened constraints on
landowners, facilitated the reallocation of physical and financial assets to new and lucrative uses,
16 Robert Allen (1992) and Clark (1998) find these factors’ impact on the productivity of arable land to be positive,
but limited.

30
and enabled the exploitation of opportunities arising in a dynamic economy. The lowering of
transaction costs enhanced efficiency and encouraged investment. The lowering of such barriers
has long been considered a principal force propelling European economic progress (North,
1981).
The benefits of estate acts extended beyond the persons and property involved. Estate
acts established precedents. Knowledge of what Parliament would decide when confronted with
a case helped to resolve disputes within families, to safeguard the interests of investors, to
determine the distribution of rents within ongoing business arrangements, and to prevent the
holding-up of new projects by those seeking an inordinate share of the profits. The development
of institutions solving such problems has long been considered to be one of the principal
institutional innovations underlying modern capitalist economies (Williamson, 1985).
Britain’s system for reorganizing property rights was unique among European nations. In
most countries, the transition from medieval to modern landholding systems involved spasms of
reform and rebellion. In France after 1789 and Russia after 1917, for example, revolutionaries
annulled laws binding land and labor to traditional tasks; voided privileges possessed by nobles,
clergy, and corporations; redistributed political power; and restructured anachronistic property-
rights regimes.
Before these revolutions, inflexible property-rights regimes prevented entrepreneurs from
exploiting emerging opportunities. In France, for example, the sclerotic landholding system
impeded the construction of infrastructure, such as canals, even when returns from their
operation would have substantially exceeded construction costs (Rosenthal, 1992). The problem
involved establishing rights of way. Local groups who opposed projects (or hoped for a larger
share of the profits) could perpetually delay construction by repeatedly suing in slow and

31
inefficient courts. Only after its revolution did France simplify procedures for establishing rights
of way.17
Britain established procedures for establishing rights of way more than a century before
France and other countries on the continent. Britain created these procedures at the time that
Parliament established procedures for passing estate, statutory authority, and enclosure acts. Why
did Parliament change the way it regulated property at that time? The immediate factors were the
political changes in the late seventeenth and early eighteenth centuries. After the Glorious
Revolution of 1688, Britain became a constitutional monarchy. The Bill of Rights of 1689
encouraged the expansion of legislative activity. Parliament began meeting on a predictable,
annual schedule and setting its own agenda. Parliament established a permanent bureaucracy and
streamlined procedures for processing petitions. These streamlined procedures reduced the cost
of submitting bills and increased the predictability of passage. A cadre of professional solicitors
and clerks emerged to help petitions through the Parliamentary process. By the 1720s, capacity
expanded to the point where the legislative process could effectively accommodate almost any
demand for legislation reorganizing property rights.18
Parliament often amended ancient economic rights, if amending rights allowed resources
to be put to more productive uses. Parliament felt free to change rules regarding how land could
be used. Parliament also felt free to change the legal owners of land. But, Parliament protected
incomes derived from rights to land. Parliament ensured individuals received compensation for
the rights that they lost. Parliament, in other words, provided security for income derived from
rights to property, but not security for ownership of particular pieces of property or rules binding
17 Evidence also indicates that during the eighteenth century, French cultivation continued as it had in the Middle
Ages. In England, however, “agriculture entered a dynamic period of rapid and far reaching change (Sexauer 1976).”
18 There is a large literature describing the improvement of private bill procedures in the early 18th century. See Clifford (1885), Williams (1948), Thomas (1971), and Hoppit (1996).

32
land to traditional uses. In sum, adaptable rights to land use coexisted with secure rights to
income from land.
The seminal studies of Ronald Coase (1960, 1974) illuminate the importance of Britain’s
adaptable property-rights regime. Coase argues that in the presence of transaction costs, attaining
economic efficiency requires the proper definition and allocation of property rights. In “The
Problem of Social Cost (1960)” Coase argues that nineteenth-century British common and
statutory law recognized these principles, and that Britain’s courts and Parliament reallocated
property rights to encourage economic efficiency. In “The Lighthouse in Economics,” Coase
(1974) argues that in the nineteenth century, Parliament’s creation of statutory authorities
encouraged the provision of public goods and services. Coase illuminates his assertion with an
example. Parliament assigned ‘lighthouse rights’ to certain plots of land. Lighthouse rights
allowed anyone operating a lighthouse to collect tolls from passing vessels. These new rights
superseded ancient rights guaranteeing vessels transit free from tax or toll. Our research suggests
that Parliament began to operate in the way that Coase described soon after the Glorious
Revolution, more than one-hundred and thirty years before the period that Coase studied, and
that Parliament’s efforts to reorganize rights extended across the entire economy.19
What are the broader lessons from Britain’s property rights revolution? Adaptable
property-rights may be as important as secure property-rights. Both may be necessary for
economic development. One way to create adaptable property-rights is to establish political
procedures that generate consent for change and ensure that vested interests do not oppose
19 Previous scholars emphasized the first half of Coase’s essay, “The Problem of Social Costs (1960),” which
models a world without transaction costs in which any assignment of secure property rights results in an efficient outcome. We emphasize the second section of Coase’s essay, which models a world with transaction costs. In such a world, some distribution of property rights lead to efficient outcomes, while others trap people in poverty. The market alone may not alleviate this affliction. Some institution, such as Parliament, must lower transaction costs and/or reassign rights in order for efficiency to arise.

33
development. Piecemeal actions that address specific problems facing individuals and
communities may be easier to implement than widespread reforms that address general
problems. The political procedures developed in eighteenth century Britain may have useful
applications in developing nations today.

34
Tab
le 1
: Est
ate
and
Oth
er P
riva
te A
cts,
Sum
mar
y St
atis
tics
∆ R
ight
s Se
ries i
n le
vels
Serie
s in
diff
eren
ces
Land
Pe
rson
al
A
vg
SD
Min
M
ax
A
vg
SD
Min
M
ax
T
ype
of A
cts
(1)
(2)
(3
) (4
) (5
) (6
)
(7)
(8)
(9)
(10)
Es
tate
Act
s
(a)
All
Esta
tes
All
Som
e
22.7
11
.1
0 66
0.2
13.0
-5
5 65
(b
) Es
tate
s tha
t aut
horiz
es sa
les
All
Som
e
11.1
6.
3 0
34
0.
1 7.
0 -3
4 26
(c
) Es
tate
s tha
t aut
horiz
es le
ases
A
ll So
me
3.
5 3.
1 0
24
0.
1 3.
0 -1
2 16
(d
) Es
tate
s tha
t aut
horiz
es sa
les o
r lea
ses
All
Som
e
14.5
7.
9 0
41
0.
1 8.
7 -4
1 33
Pl
aceb
o G
roup
N
on-E
stat
e Pr
ivat
e A
cts
(e)
Mar
riage
N
o A
ll
1.6
2.0
0 10
0.1
2.2
-9
7 (f
) N
atur
aliz
atio
n N
o A
ll
7.2
6.3
0 36
0.0
7.2
-29
22
(g)
Off
ice
No
All
0.
4 0.
9 0
7
0.0
1.2
-6
7 (h
) Su
m (M
arria
ge, N
atur
aliz
atio
n, O
ffic
e)
No
All
9.
1 7.
6 0
46
0.
1 8.
7 -3
4 25
Not
es: C
olum
n (1
) ind
icat
es a
cts t
hat c
hang
ed ri
ghts
to la
nd a
nd re
sour
ces,
mar
ked
“yes
” fo
r act
s tha
t did
and
“no
” fo
r ac
ts th
at d
id n
ot. C
olum
n (2
) ind
icat
es a
cts t
hat a
ltere
d pe
rson
al ri
ghts
, mar
ked
“yes
” fo
r act
s tha
t did
, and
“so
me”
if th
e ac
t som
etim
es a
ffec
ted
pers
onal
righ
ts. C
olum
ns (3
) thr
ough
(6) d
escr
ibe
the
stat
istic
al p
rope
rties
of t
he o
rigin
al se
ries.
Col
umns
(7) t
hrou
gh (1
0) d
escr
ibe
the
stat
istic
al p
rope
rties
of t
he se
ries i
n di
ffer
ence
s, i.e
. whe
re th
e ob
serv
atio
n in
yea
r t-1
is su
btra
cted
from
the
obse
rvat
ion
in y
ear t
. Col
umns
(3) a
nd (7
) ind
icat
e th
e av
erag
e. C
olum
ns (4
) and
(8) i
ndic
ate
the
stan
dard
dev
iatio
n. C
olum
ns (5
) and
(9) i
ndic
ate
the
min
imum
val
ue. C
olum
ns (6
) and
(10)
indi
cate
the
max
imum
va
lue.
35
Tab
le 2
: Sta
tuto
ry A
utho
rity
and
Fin
ance
Act
s, Su
mm
ary
Stat
istic
s
Se
ries i
n le
vels
Se
ries i
n di
ffer
ence
s
∆ R
ight
s To
Lan
d Pr
ovid
e I &
S
Avg
SD
M
in
Max
St
at?
A
vg
SD
Min
M
ax
Stat
?
(1)
(2)
(3)
(4)
(5)
(6)
(7)
(8
) (9
) (1
0)
(11)
(1
2)
St
atut
ory
Aut
horit
y A
cts
(a)
All
All
All
46.1
42
0
187
No
0.
9 15
.9
-53
45
Yes
(b
) Tr
ansp
orta
tion
Onl
y A
ll A
ll 33
.7
29.8
0
126
No
0.
8 11
.3
-37
32
Yes
(c
) U
rban
Onl
y A
ll A
ll 9
10.5
0
53
Yes
0.1
6.6
-22
26
Yes
Plac
ebo
Gro
up
(d
) G
ovt.
Fina
nce
Act
s N
one
Som
e 22
.7
22.3
0
94
Yes
0.2
15.8
-8
7 54
Y
es
N
otes
: Col
umn
(1) i
ndic
ates
act
s tha
t cha
nged
righ
ts to
land
and
reso
urce
s, m
arke
d “A
ll” fo
r act
s tha
t did
and
“n
one”
for a
cts t
hat d
id n
ot. C
olum
n (2
) ind
icat
es w
heth
er th
e ac
ts a
utho
rized
the
prov
isio
n of
infr
astru
ctur
e or
se
rvic
es, m
arke
d “A
ll” fo
r act
s tha
t did
and
“so
me”
for c
ateg
orie
s in
whi
ch so
me
acts
aut
horiz
ed in
fras
truct
ure
and
serv
ices
. Col
umns
(3) t
hrou
gh (7
) des
crib
e th
e st
atis
tical
pro
perti
es o
f the
orig
inal
serie
s. C
olum
ns (8
) th
roug
h (1
2) d
escr
ibe
the
stat
istic
al p
rope
rties
of t
he se
ries i
n di
ffer
ence
s, i.e
. whe
re th
e ob
serv
atio
n in
yea
r t-1
is
subt
ract
ed fr
om th
e ob
serv
atio
n in
yea
r t. C
olum
ns (3
) and
(8) i
ndic
ate
the
aver
age.
Col
umns
(4) a
nd (9
) in
dica
te th
e st
anda
rd d
evia
tion.
Col
umns
(5) a
nd (1
0) in
dica
te th
e m
inim
um v
alue
. Col
umns
(6) a
nd (1
1)
indi
cate
the
max
imum
val
ue. C
olum
ns (7
) and
(12)
indi
cate
whe
ther
the
serie
s is s
tatio
nary
, ind
icat
ed “
yes,”
or
whe
ther
the
serie
s is n
on-s
tatio
nary
, ind
icat
ed “
no.”
An
augm
ente
d D
icke
y-Fu
ller t
est i
s use
d to
det
erm
ine
whe
ther
the
serie
s pos
sess
es a
uni
t roo
t.

36
Tab
le 3
: Enc
losu
re A
cts a
nd A
men
dmen
ts, S
umm
ary
Stat
istic
s
Se
ries i
n le
vels
Se
ries i
n di
ffer
ence
s
∆ R
ight
s To
Lan
d C
orre
ct
Erro
r A
vg
SD
Min
M
ax
Stat
?
Avg
SD
M
in
Max
St
at?
(1)
(2)
(3)
(4)
(5)
(6)
(7)
(8
) (9
) (1
0)
(11)
(1
2)
(a
) En
clos
ure
Act
s A
ll N
one
27.4
35
.7
0 13
5 N
o
0.6
12.7
-5
0 37
Y
es
(b)
Encl
osur
e A
men
dmen
ts
Som
e A
ll 0.
2 0.
7 0
5 Y
es
0
0.7
-3
5 Y
es
N
otes
: Col
umn
(1) i
ndic
ates
act
s tha
t cha
nged
righ
ts to
land
and
reso
urce
s, m
arke
d “a
ll” fo
r act
s tha
t did
and
“so
me”
fo
r cat
egor
ies i
n w
hich
som
e ac
ts c
hang
ed ri
ghts
to la
nd a
nd re
sour
ces w
hile
oth
er a
cts d
id n
ot. C
olum
n (2
) ind
icat
es
whe
ther
the
acts
am
ende
d or
cor
rect
ed e
arlie
r act
s cha
ngin
g rig
hts t
o la
nd a
nd re
sour
ces,
mar
ked
“all”
for a
cts t
hat
did
and
“non
e” fo
r act
s tha
t did
not
. Col
umns
(3) t
hrou
gh (7
) des
crib
e th
e st
atis
tical
pro
perti
es o
f the
orig
inal
serie
s. C
olum
ns (8
) thr
ough
(12)
des
crib
e th
e st
atis
tical
pro
perti
es o
f the
serie
s in
diff
eren
ces,
i.e. w
here
the
obse
rvat
ion
in
year
t-1
is su
btra
cted
from
the
obse
rvat
ion
in y
ear t
. Col
umns
(3) a
nd (8
) ind
icat
e th
e av
erag
e. C
olum
ns (4
) and
(9)
indi
cate
the
stan
dard
dev
iatio
n. C
olum
ns (5
) and
(10)
indi
cate
the
min
imum
val
ue. C
olum
ns (6
) and
(11)
indi
cate
the
max
imum
val
ue. C
olum
ns (7
) and
(12)
indi
cate
whe
ther
the
serie
s is s
tatio
nary
, ind
icat
ed “
yes,”
or w
heth
er th
e se
ries
is n
on-s
tatio
nary
, ind
icat
ed “
no.”
An
augm
ente
d D
icke
y-Fu
ller t
est i
s use
d to
det
erm
ine
whe
ther
the
serie
s pos
sess
es
a un
it ro
ot.

37
Tab
le 4
: Eco
nom
ic a
nd P
oliti
cal E
xpla
nato
ry V
aria
bles
, Sum
mar
y St
atis
tics
Se
ries i
n D
iffer
ence
s
A
vg
SD
Min
M
ax
D
escr
iptio
n So
urce
s
(1)
(2)
(3)
(4)
(5
) (6
)
(a
) In
tere
st R
ate,
Rea
l
-0.1
4.
9 -1
5.1
12.9
Yie
ld o
n 2½
% c
onso
ls m
inus
infla
tion.
N
eal (
1990
) and
Cla
rk (2
001)
(b
) Fo
reig
n Tr
ade,
Vol
ume
0.
7 4.
5 -2
4.2
18.3
Sum
exp
orts
plu
s im
ports
at o
ffic
ial p
rices
. M
itche
ll (1
988)
(c
) El
ectio
n Y
ear
0
0.6
-1
1
Indi
cato
r for
yea
rs w
ith e
lect
ions
. H
.HS
(199
3) a
nd E
vans
(200
1)
(d)
Mon
arch
Die
s
0 0.
3 -1
1
In
dica
tor f
or y
ears
in w
hich
mon
arch
die
s. H
.HS
(199
3) a
nd E
vans
(200
1)
(e)
Prim
e M
inis
ter C
hang
es
0
0.5
-1
1
Indi
cato
r for
yea
rs in
whi
ch P
M c
hang
es.
H.H
S (1
993)
and
Eva
ns (2
001)
(f
) Ep
idem
ic M
orta
lity
0
0.3
-1
1
Indi
cato
r for
yea
rs w
ith e
pide
mic
mor
talit
y.
H.H
S (1
993)
and
Eva
ns (2
001)
(g
) La
nd T
ax R
ate,
Rea
l
0 0.
6 -2
4
Ta
x ra
te in
shill
ings
per
acr
e.
H.H
S (1
993)
and
Eva
ns (2
001)
(h
) Ta
x C
ode
Cha
nge
0
0.1
-1
1
Indi
cato
r for
yea
r whe
n ta
x co
de c
hang
es.
H.H
S (1
993)
and
Eva
ns (2
001)
(i)
Tr
ee R
ing
Gro
wth
3.3
178.
5 -4
68
496
In
dex.
0 e
qual
s no
grow
th. 1
000
is a
vera
ge.
Bai
llie
(198
6)
(j)
War
Yea
rs
0
0.3
-1
1
Indi
cato
r for
yea
rs w
hen
Brit
ain
fight
s war
s. R
odge
r (20
04),
H.H
S (1
993)
, an
d Ev
ans (
2001
)
N
otes
: Def
initi
ons f
or C
olum
ns (1
) thr
ough
(4) i
dent
ical
to d
efin
ition
s for
Col
umns
(8) t
hrou
gh (1
1) in
Tab
le 3
. All
of th
ese
diff
eren
ced
serie
s are
stat
iona
ry. H
.HS
(199
3) re
fers
to th
e te
xts b
y H
olm
es (1
993)
and
Hol
mes
and
Sze
chi (
1993
).

38
Tab
le 5
: Est
ate
Act
s, 17
05-1
830,
Reg
ress
ion
Res
ults
∆ Es
tate
Act
s ∆
Non
-Est
ate
Priv
ate
Act
s ∆
Esta
te A
cts
Sa
les+
Le
ases
Sa
les+
Le
ases
Sa
les+
Le
ases
M
arria
ge
Nat
ural
ize
Off
ice
Sale
s+
Leas
es
Sale
s+
Leas
es
Var
iabl
e
(1)
(2)
(3)
(4)
(5)
(6)
(7)
(8)
∆ R
eal i
nter
est r
ate
-0.2
2 -0
.24
-0.2
4 -0
.02
-0.1
2 0.
01
-0.2
2 -0
.24
[0.1
0]
[0.1
1]
[0.1
1]
[0.0
7]
[0.2
3]
[0.0
1]
[0.1
0]
[0.1
0]
∆ Tr
ade
-0
.06
-0.1
4 -0
.15
0.02
0.
01
0.02
-0
.14
-0.1
4
[0
.12]
[0
.13]
[0
.13]
[0
.03]
[0
.12]
[0
.01]
[0
.13]
[0
.13]
∆
Elec
tion
-0.7
6 -0
.77
-0.5
7 -1
.00
0.07
-0
.57
-0.7
7
[1.7
4]
[1.9
0]
[0.4
6]
[1.3
5]
[0.1
4]
[1.9
2]
[1.9
2]
∆ N
ew P
rime
Min
iste
r
-1.7
9 -1
.80
0.74
1.
25
0.37
-2
.02
-1.8
0
[1.4
2]
[1.4
6]
[0.4
7]
[1.7
4]
[0.2
7]
[1.4
4]
[1.4
9]
∆ M
onar
ch D
ies
-2.8
9 -3
.14
-0.9
0 2.
50
0.85
-3
.22
-3.1
4
[2.0
2]
[2.3
8]
[0.4
8]
[1.8
8]
[0.5
5]
[2.2
6]
[2.2
7]
∆ N
on-E
stat
e Pr
ivat
e A
cts
0.
12
[0
.08]
Res
idua
ls fr
om E
stim
ated
∆ N
on-E
stat
e Pr
ivat
e A
cts
0.12
[0.0
8]
Add
ition
al C
ontro
ls ?
N
o N
o Y
es
Yes
Y
es
Yes
Y
es
Yes
#
Obs
erva
tions
124
124
124
124
124
124
124
124
F-te
st (d
eg. f
reed
om)
(2
,113
) (5
,110
) (1
0,10
5)
(10,
105)
(1
0,10
5)
(10,
105)
(1
1,10
4)
(11,
104)
F-
test
stat
istic
209
965
6604
46
37
18
82
2333
30
22
Bol
d fa
ce in
dica
tes s
igni
fican
t at t
he 5
% le
vel.
Italic
indi
cate
s sig
nific
ance
at t
he 1
0% le
vel.
Stan
dard
er
rors
cal
cula
ted
usin
g th
e N
ewey
-Wes
t pro
cedu
re w
ith 4
lags
.

39
Tab
le 6
: Est
ate
Act
s, 17
65-1
830,
Reg
ress
ion
Res
ults
∆
Esta
te A
cts
∆ N
on-E
stat
e Pr
ivat
e A
cts
∆ Es
tate
Act
s
Sale
s+
Leas
es
Sale
s+
Leas
es
Sale
s+
Leas
es
Sale
s Le
ases
M
arria
ge
Nat
ural
ize
Off
ice
Sale
s+
Leas
es
Sale
s+
Leas
es
Var
iabl
e
(1)
(2)
(3)
(4)
(5)
(6)
(7)
(8)
(9)
(10)
∆
Rea
l int
eres
t rat
e -0
.33
-0.3
9 -0
.35
-0.1
5 -0
.24
-0.1
0 -0
.29
-0.0
0 -0
.35
-0.3
8
[0
.14]
[0
.13]
[0
.15]
[0
.09]
[0
.11]
[0
.09]
[0
.25]
[0
.01]
[0
.12]
[0
.12]
∆
Trad
e
-0.0
5 -0
.18
-0.1
7 -0
.04
-0.1
4 0.
04
0.03
0.
015
-0.1
8 -0
.18
[0.1
2]
[0.1
4]
[0.1
5]
[0.1
1]
[0.0
6]
[0.0
4]
[0.1
5]
[0.0
1]
[0.1
3]
[0.1
3]
∆ El
ectio
n
-3
.46
-3.4
5 -2
.49
-0.9
7 -0
.97
-0.1
7 -0
.10
-3.2
6 -3
.46
[1
.65]
[1
.80]
[1
.10]
[0
.80]
[0
.65]
[2
.11]
[0
.09]
[1
.67]
[1
.70]
∆
New
Prim
e M
inis
ter
-3
.14
-3.0
4 -0
.96
-2.1
9 -0
.82
1.67
0.
49
-3.4
0 -3
.14
[1
.42]
[1
.72]
[1
.47]
[0
.55]
[0
.69]
[2
.70]
[0
.24]
[1
.43]
[1
.49]
∆
Mon
arch
Die
s
1.
80
2.44
2.
10
-0.2
9 -0
.32
3.99
0.
27
1.46
1.
81
[2
.08]
[2
.46]
[1
.25]
[1
.32]
[0
.80]
[3
.02]
[0
.15]
[1
.94]
[2
.04]
∆
Non
-Est
ate
Priv
ate
Act
s
0.08
[0.0
5]
R
esid
uals
from
Est
imat
ed ∆
Non
-Est
ate
Priv
ate
Act
s
0.08
[0.0
5]
Add
ition
al C
ontro
ls?
No
No
Yes
N
o N
o N
o N
o N
o N
o N
o
#
Obs
erva
tions
66
66
66
66
66
66
66
66
66
66
F-te
st (d
eg. f
reed
om)
(2
,64)
(5
,61)
(1
0,56
) (5
,61)
(5
,61)
(5
,61)
(5
,61)
(5
,61)
(6
,60)
(6
,60)
F-
test
stat
istic
3 5
3 2
6 5
1 1
5 5
Bol
d fa
ce in
dica
tes s
igni
fican
t at t
he 5
% le
vel.
Italic
indi
cate
s sig
nific
ance
at t
he 1
0% le
vel.
Stan
dard
err
ors c
alcu
late
d us
ing
the
New
ey-W
est p
roce
dure
with
3 la
gs.

40
Tab
le 7
: St
atut
ory
Aut
hori
ty A
cts,
Reg
ress
ion
Res
ult
∆ St
atut
ory
Aut
horit
ies
∆
Fina
nce
A
ll A
ll A
ll A
ll Tr
ansp
ort
Urb
an
All
Var
iabl
e
(1)
(2)
(3)
(4)
(5)
(6)
(7)
(8
)
∆
Rea
l int
eres
t rat
e
-1.0
0 -1
.05
-1.0
6 -1
.14
-0.5
6 -0
.30
-0.9
1
0.00
[0
.33]
[0
.32]
[0
.34]
[0
.59]
[0
.21]
[0
.15]
[0
.30]
[0.3
5]
∆
Trad
e
1.03
1.
03
1.00
0.
97
0.58
0.
34
0.94
0.63
[0
.36]
[0
.32]
[0
.33]
[0
.36]
[0
.25]
[0
.12]
[0
.42]
[0.7
0]
∆
Elec
tion
-7.0
3 -7
.09
-8.9
3 -6
.06
-3.4
5 -6
.07
-2
.49
[3
.14]
[3
.14]
[4
.94]
[2
.02]
[1
.21]
[3
.08]
[3.2
4]
∆
New
Prim
e M
inis
ter
5.82
5.
65
6.88
5.
60
0.51
6.
25
4.
32
[3
.27]
[3
.33]
[4
.89]
[2
.29]
[1
.71]
[3
.84]
[3.9
9]
∆
Mon
arch
Die
s
-6
.17
-6.1
2 -9
.87
-5.3
0 -4
.39
-6.7
6
2.54
[5.1
0]
[5.0
0]
[7.5
8]
[3.7
2]
[2.6
2]
[5.4
3]
[6
.05]
∆
Fina
nce
acts
0.17
[0.1
5]
A
dditi
onal
Con
trols
?
No
No
Yes
Y
es
Yes
Y
es
Yes
Yes
#
Obs
erva
tions
124
124
124
66
124
124
119
11
9 F-
test
(deg
free
dom
)
(2,1
13)
(5,1
10)
(8,1
07)
(8,5
8)
(8, 1
07)
(8, 1
07)
(9,1
02)
(8
, 103
) F-
test
stat
istic
13
43
12
12
2284
17
7 6
2
Bol
d fa
ce in
dica
tes s
igni
fican
t at t
he 5
% le
vel.
Italic
indi
cate
s sig
nific
ance
at t
he 1
0% le
vel.
Stan
dard
err
ors c
alcu
late
d us
ing
the
New
ey-W
est p
roce
dure
with
4 la
gs.

41
Tab
le 8
: Enc
losu
re A
cts
Bol
d fa
ce in
dica
tes s
igni
fican
t at t
he 5
% le
vel.
Italic
indi
cate
s si
gnifi
canc
e at
the
10%
leve
l. St
anda
rd e
rror
s cal
cula
ted
usin
g th
e N
ewey
-Wes
t pro
cedu
re w
ith 3
lags
.
∆ En
clos
ure
Act
s
∆ En
clos
ure
Am
endm
ents
Var
iabl
e (1
) (2
) (3
)
(4)
∆ R
eal i
nter
est r
ate
- 0.9
9 -0
.67
-0.6
9
0.03
[0.2
3]
[0.3
7]
[0.3
7]
[0
.03]
∆
Trad
e 0.
50
0.68
0.
71
-0
.05
[0
.31]
[0
.37]
[0
.40]
[0.0
4]
∆ El
ectio
n
-6.0
5 -6
.21
0.
27
[2.4
4]
[2.5
2]
[0
.45]
∆
New
Prim
e M
inis
ter
3.88
3.
83
0.
08
[4.7
0]
[4.7
7]
[0
.28]
∆
Mon
arch
Die
s
14.7
0 16
.40
-2
.88
[5.0
3]
[7.0
4]
[0
.74]
∆
Land
Tax
Rat
e
-10.
97
-10.
59
-0
.66
[6.7
7]
[6.8
2]
[0
.48]
∆
Encl
osur
e A
men
dmen
ts
0.
59
[1
.14]
A
dditi
onal
Con
trols
? N
o N
o N
o
No
# O
bser
vatio
ns
66
66
66
66
F-
test
(deg
free
dom
) (2
,64)
(6
,60)
(7
,59)
(6,6
0)
F-te
st st
atis
tic
11
6 6
3

42
References Acemoglu, Daron, Simon Johnson and James A. Robinson. “Institutions as a Fundamental
Cause of Long-Run Growth.” In Philippe Aghion and Steven N. Durlauf (eds) Handbook of Economic Growth. New York: Elsevier, 2005.
Acemoglu, Daron, Simon Johnson. “Unbundling Institutions.” Journal of Political Economy, 113 (2005), pp. 949-995. Alston, Lee and Bernado Mueller. “Property Rights and the State,” in Menard, Claude and Mary
M. Shirley (eds) Handbook for New Institutional Economics. Kluwer, 2004. Alston, Lee, Gary Libecap, and Bernardo Mueller. Titles, Conflict, and Land Use: The
Development of Property Rights and Land Reform on the Brazilian Amazon Frontier. Michigan, 1999.
Allen, Robert. Enclosure and the Yeoman. New York, 1992. Baillie, Michael L.. European Oak Tree Ring Series from Lockwood, Britain, 1652-1975. QUSP
- ITRDB BRIT008, World Data Center for Paleoclimatology Data Contribution Series. NOAA/NCDC Paleoclimatology Program, Boulder, Colorado, USA. 1986.
Bogart, Dan. “Did Turnpike Trusts Increase Transport Investment in Eighteenth Century
England,” Journal of Economic History, 65 (June 2005), pp. 439-468. ----- “Turnpike Trusts and the Transport Revolution in Eighteenth Century England,”
Explorations in Economic History, 42 (October 2005), pp. 479-508. Bogart, Dan and Gary Richardson. “Parliament, Property Rights, and Public Goods,” Working
paper, 2007. Bogart, Dan and Gary Richardson. “The Reorganization of Rights to Real Estates in Britain,
1600-1830,” Working paper, 2008. Clark, Gregory. “The Political Foundations of Modern Economic Growth: England, 1540-1800.”
Journal of Interdisciplinary History, 26 (1996), pp. 563-588. ----- “Common Sense: Common Property Rights, Efficiency, and Institutional Change.” Journal
of Economic History, 58 (March 1998), pp. 73-102. ----- “The Enclosure of English Common Lands, 1475-1839,” Journal of Economic History,
61 (December 2001), pp. 1009-1036. ----- “Farm Wages and Living Standards in the Industrial Revolution: England, 1670-1850,”
Economic History Review, 54 (August 2001), pp. 477-505.
43
Clifford, Frederick. A History of Private Bill Legislation. Butterworths, 1885. Coase, Ronald. “The Problem of Social Cost,” Journal of Law and Economics, 3 (October 1960):
pp. 1-44. ----- “The Lighthouse in Economics,” Journal of Law and Economics, 17 (October 1974), pp.
357-76. Crafts, N.F.R. “Determinants of the Rate of Parliamentary Enclosure,” Explorations in Economic
History, 14 (1977), pp. 227-249. De Soto, Hernandez. The Mystery of Capital: Why Capitalism Triumphs in the West and Fails
Everywhere Else. New York: Basic Books, 2000. English B, and Saville, J. Strict Settlement: a Guide for Historians. Hull, 1983. Evans, Eric. The Forging of the Modern State: Early Industrial Britain, 1783-1870. Longman,
2001. Great Britain. Statutes of the Realm, 1225 to 1713. London: Dawsons of Pall Mall, 1807. ----- Statutes at Large, 1223 to 1806. London: Mark Baskett, Robert Baskett, Henry Woodfall,
and William Strahan, 1800. Habakkuk, John. Marriage, Debt, and the Estates System. Oxford, 1994. Holmes, Geoffrey. The Making of a Great Power: Late Stuart and Early Georgian Britain.
1660-1722. Longman, 1993. Holmes, Geoffrey and D. Szechi. The Age of Oligarchy: Pre-industrial Britain, 1722-83.
Longman, 1993. Hoppit, Julian. “Patterns of Parliamentary Legislation, 1660-1800.” The Historical Journal, 39
(March 1996), pp. 109-131. ----- Failed Legislation, 1660—1800. London: Hambledon Press, 1997. Hume, David. “Essays, Moral and Political” in Of the First Principles of Government, Vol 1,
London, 1741. Innes, Joanna. “The Local Acts of a National Parliament: Parliament’s Role in Sanctioning Local
Action in Eighteenth-Century Britain.” pp. 23-47 in Parliament and Locality,1660-1939, edited by David Dean and Clyve Jones. Edinburgh University Press, 1998
Langford, Paul. Public Life and the Propertied Englishman. Oxford, 1991.

44
La Porta, R. F. Lopez-de-Silanes, A. Shleifer, and R. Vishney. The Quality of Government,” Journal of Law, Economics, and Organization 15 (1998), pp. 222-279.
Libecap, Gary. Contracting for Property Rights. Cambridge, 1989.
Mitchell, Brian. British Historical Statistics. Cambridge, 1988. Mokyr, Joel. Gifts of Athena: Historical Origins of the Knowledge Economy. Princeton:
Princeton University Press, 2002. ---- “Mercantilism, the Enlightenment, and the Industrial Revolution.” Presented tot eh
Conference in Honors of Eli F. Heckscher, Stockholm, May 2003. Ronald Findlay, Rolf Henriksson, Hokan Lindgren, and Mats Lundahl (eds), Eli F. Heckscher (1879-1952): A Celebratory Symposium. Cambridge, MA: MIT Press. 2005.
----- “The Intellectual Origins of Modern Economic Growth.” Journal of Economic History,
Vo. 65, No. 2 (June) 2005, pp. 285-351. ----- “The Great Synergy: The European Enlightenment as a Factor in Modern Economic
Growth.” Mimeo, April 2005. Neal, Larry. The Rise of Financial Capitalism. Cambridge: Cambridge University Press, 1990 Newey, Whitney K. and Kenneth D. West. “A simple, Positive Semi-Definite,
Heteroskedasticity and Autocorrelation Consistent Covariance Matrix.” Econometrica 55 (May 1987), pp. 703-708.
North, Douglass C. Structure and Change in Economic History. London: W. W. Norton and
Company, 1981. North, Douglass C. and Barry R. Weingast. “Constitutions and Commitment: The Evolution of
Institutions Governing Public Choice in Seventeenth-Century England.” Journal of Economic History, 49 (December 1989), pp. 803-832.
O’Brien, Patrick. “Central Government and the Economy, 1688-1815.” In Floud and
McCloskey, The Cambridge Economic History of Britain since 1700, I, 2nd Edition. Cambridge: Cambridge University Press, 1994.
Richardson, Gary. “The Prudent Village: Risk Pooling Institutions in Medieval English
Agriculture,” Journal of Economic History, Volume 65, Number 2, (June 2005), pp. 386–413.
Rodger, N. A. M. The Command of the Ocean: A Naval History of Britain, 1649-1815. New
York: W. W. Norton and Company, 2004.

45
Rosenthal, Jean-Laurent. Fruits of the Revolution: Property Rights, Litigation, and French Agriculture, 1700-1860. Cambridge: Cambridge University Press, 1992.
Sexauer, Benjamin. “English and French Agriculture in the Late Eighteenth Century.”
Agricultural History, Volume 50. No. 3. (July 1976), pp. 491-505. Smith, Adam. The Wealth of Nations. Modern Library: New York, 1976. Tate, William Edward. A Domesday of English Enclosure Acts and Awards. Reading: University
of Reading, 1978. ----- The Enclosure Movement. New York: Walker, 1967. Thomas, Peter David. The House of Commons in the Eighteenth Century. Clarendon, 1971 Turner, Michael. English Parliamentary Enclosure: Its Historical Geography and Economic
History. Folkestone: Dawson-Archon Books, 1980. ----- Enclosures in Britain: 1750 to 1830. London, 1984 Webb, Sidney, and Beatrice Webb. Statutory Authorities for Special Purposes, with a summary
of the development of local government Structure. Hambden, 1963. Williams, O. Cyprian. Historical Development of Private Bill Procedure and Standing Orders in
the House of Commons. H.M. Stationary, 1948. Williamson, Oliver. The Economics Institutions of Capitalism: Firms, Markets, and Relational
Contracting. New York: Macmillan Free Press, 1983. Wordie, J. R. “The Chronology of English Enclosure, 1500-1914.” The Economic History
Review, New Series, Vol. 36, No. 4, (Nov. 1983) pp. 483-505.