briefing paving over the tracks -...
TRANSCRIPT

PAVING OVER THE TRACKS…a better use of Britain’s railways?
Briefi ng 15:01
Paul Withrington and Richard WellingsFebruary 2015
Institute ofEconomic A airs


As with all IEA publications, the views expressed are those of the authors and not those of the Institute (which has no corporate view), its managing trustees, Academic Advisory Council or senior staff.
About 2020 Vision
2020 Vision focuses on the future of the UK economy and identifies the key economic issues likely to face the next UK government.

Contents
About the authors 06
Summary 08
Market freedom versus government control 10
Capacity and overcrowding 15
Journey times 17
Fares and costs 19
Technical issues 26
Liberating the transport sector 32
Conclusion 34
References 36
Acknowledgement 40

6
About the authors
6

7
About the authors
7
Paul Withrington graduated in Civil Engineering from Bristol University in 1962. In 1966/7 he took an MSc in Transport Planning under the aegis of the Greater London Council, where he worked for two years followed by a period as a lecturer at Portsmouth. He joined Northamptonshire County Council in 1975 as Project Manager, Transport Planning. Since 1994 he has directed Transport Watch, appearing at public inquires and undertaking policy analysis. In 2000/01 he appeared as the Strategic Objector at the public inquiry into Railtrack’s West Coast Main Line modernisation programme.
Dr Richard Wellings is Deputy Editorial Director at the Institute of Economic Affairs and Director of IEA Transport. He was educated at Oxford and the London School of Economics, completing a PhD on transport policy at the latter in 2004. Richard is the author, co-author or editor of several papers, books and reports, including Towards Better Transport (Policy Exchange, 2008), High Speed 2: The Next Government Project Disaster? (IEA, 2011), Which Road Ahead – Government or Market? (IEA, 2012) and The High-Speed Gravy Train: Special Interests, Transport Policy and Government Spending (IEA, 2013). He is a senior fellow of the Cobden Centre and the Economic Policy Centre.

8
Summary
● The politicisation of the transport sector has stifled the market processes that reallocate infrastructure to higher value uses. As a consequence, government transport spending is misallocated on a grand scale. This is particularly apparent on the rail network, where high levels of taxpayer subsidy are combined with poor levels of service.
● Commuter trains are often expensive and overcrowded, while government plans to increase capacity will take decades to implement and will impose further costs on both taxpayers and passengers. A combination of rigid state control and powerful vested interests means there is little consideration of alternative ways of transporting large volumes of commuters.
● There is strong evidence that allowing some commuter railways to be converted into busways would provide higher capacity at lower cost, reduce fares for passengers and cut subsidies from taxpayers. A related policy of phasing out government support for the railways could save around £6 billion a year.
● It is estimated that busway fares would be at least 40 per cent cheaper than current rail fares, while on longer journeys all passengers could expect to be seated.
● In combination with the existing road network, busways would facilitate fast and direct services into city centres from suburbs and villages not currently linked by rail, increasing the choice of routes and reducing overall journey times for many commuters. Express coaches on congestion-free infrastructure could match the train for speed except on the longest journeys, and would also deliver much more frequent services.

9
● For a given traffic volume, busways would typically require far less land than rail, both at terminals and along routes. The sale of surplus land would further enhance the commercial case for conversion.
● The environmental gains could be substantial. High-volume bus/coach transport would appear to be more energy efficient than rail when the full impact of operating the networks is compared. Lower fares and a greater number of direct routes could also reduce car use. In some locations, spare busway capacity could be sold to other road users, diverting traffic from congested urban streets and delivering further environmental benefits.
● There are few technical obstacles to conversion. On most of the commuter-rail network, track beds are wide enough and bridges high enough to accommodate two-way bus traffic. On the approaches to Central London there is often sufficient width for several lanes in each direction.
● The deregulation of infrastructure use should form part of a wider policy to liberalise the transport sector and reduce harmful government intervention. Key reforms include harmonising the tax treatment of different modes, phasing out state subsidies, and removing barriers to entrepreneurship and innovation.

10
Market freedom versus government control
The relatively unhindered transport markets of the 18th and 19th centuries1 exhibited a high degree of evolutionary change. First an extensive network of toll roads was developed, followed by canals and then railways (Starkie 2013: 17). A process of ‘creative destruction’ revolutionised the structure of the sector, destroying established patterns and replacing them with new technologies and forms of organisation (see Schumpeter 1942: 83-84). Thus large parts of the canal and toll road networks were rendered obsolete by the growth of the railways, which offered faster and cheaper services. Indeed, many canal firms were bought out by railway companies and in some cases the channel was subsequently filled in and the route converted to a railway line (Hadfield 1969). Transport corridors were thereby reallocated to more valuable uses.
Yet as the role of government in the transport sector grew in the late 19th and early 20th centuries this process of evolution became increasingly constrained. The shift to more efficient technologies and organisational structures was actively resisted by the state.
This is well illustrated by the development of motorised road transport. The door-to-door convenience of road journeys - in contrast to the (at least) three stages involved in rail travel - offered substantial time/cost savings to a high proportion of travellers and freight operators. Motor roads also allowed economic activity to spread out geographically by transforming
1 According to Starkie (2013: 13), ‘the State had virtually no role in planning or constructing transport infrastructure. In the 18th and 19th centuries the role of the State was to enable infrastructure to be both planned and developed largely by private interests.’
11
the connectivity of areas that were uneconomic to serve by public transport. But when, in the early 1920s, several private consortia proposed a series of new profit-making toll motorways from London to the major cities, Maybury, the Minister of Transport, objected on principle to ‘the placing of very important road traffic arteries in the hands of private capitalist enterprise, to be operated for profit’ (Plowden 1971: 193). Successive governments also sought to slow down the growth in road traffic by the imposition of punitive taxes and costly vehicle regulations (ibid.).
The politicisation of the transport sector in the 20th century meant that entrepreneurship and innovation were stifled. The process by which new market structures displaced old ones was severely hampered. This partly reflected the disproportionate influence of embedded special interests, which engaged in ‘rent seeking’2 activity to protect particular industries from market competition via the political process. As a consequence, transport expenditure has been misallocated on a grand scale, reflecting political priorities rather than economic logic. ‘Lame-duck’ industries have been artificially supported while more efficient alternatives have been deliberately suppressed.
The rail sector
The rail sector arguably represents one of the most harmful examples of such ‘government failure’. Since World War II, vast subsidies have funded loss-making railways that under commercial criteria would have been closed down. This support continued even after the Beeching cuts of the 1960s (Withrington 2013) and grew substantially after the pseudo privatisation of the mid-1990s (Wellings 2014). Government subsidies for heavy rail are now estimated at approximately £6 billion per annum3, representing roughly 40 per cent of total heavy rail spending.4 The full cost to the economy is of course far higher if the indirect costs of the tax
2 ‘Rent seeking’ may involve lobbying policymakers for special privileges that benefit the interest group at the expense of other groups such as taxpayers or consumers. For more explanation see Butler (2012).
3 This estimate includes non-Network Rail spending on the heavy-rail network, including Transport for London spending on the Crossrail project and London Overground. It does not include London Underground, other subway systems or light rail/tram systems. An official figure for 2013-14 is provided here: http://orr.gov.uk/news-and-media/email-alerts/2014/regulator-publishes-new-data-on-government-financial-support-to-rail-industry
4 Depending on assumptions about the repayment of Network Rail debt.

12
funding are included (see, for example, Feldstein 1995). Network Rail debt, guaranteed by the government, has risen from £9.7 billion in 2003 to £33 billion in 2014, and is forecast to reach £50 billion in 2019.5
This level of support may be contrasted to funding for the road network. While state funding for rail is roughly 30 per cent lower6 than funding for roads, the railways carry less than 10 per cent of passenger and freight traffic, compared with the 90 per cent of passenger traffic and 70 per cent of freight traffic carried by the roads (DFT 2013).7 Moreover, road users contribute about £35 billion a year in motoring taxes to the Treasury8, whereas rail passengers do not even pay VAT (Wellings 2012). Even if externalities arguments are used to justify the former, the latter represents an inconsistency, given that rail travel is also responsible for significant negative effects on third parties. There are also hidden ‘subsidies’ in the form of planning policies that direct economic development towards rail hubs, effectively creating artificial demand for train journeys (see DCLG 2012: 9-11).
It is not clear that passengers have been the primary beneficiaries of the lavish government support for the railways. Arguably the industry itself has profited most. Rail fares per passenger-kilometre are on average around 30 per cent higher in Britain than in comparable Western European countries (McNulty 2011: 10).9 And many commuters endure severe peak-time overcrowding, partly as a result of government fare regulation and other market distortions. On many routes the quality of service appears to be declining, for example with a reduction in seating and more passengers standing during their journeys (Starkie 2013).
5 http://www.theguardian.com/business/2014/aug/28/network-rail-piublic-sector-dont-call-it-nationalisation
6 Like-for-like comparisons are problematic, since a significant proportion of road budgets is now spent on anti-motoring measures such as traffic calming and capacity reductions.
7 See also: http://www.transport-watch.co.uk/topic-33-freight-great-britain-%E2%80%93-modal-split
8 Fuel duty (including the VAT charged on the duty) and road tax.9 In some European countries lower fares may partly reflect higher levels of taxpayer
subsidy.
13
These entrenched problems make rail highly suitable as a case study on the effects of adopting a more flexible, market-led approach to the use of infrastructure. Such an approach would allow railways to be re-allocated to higher value uses, in a similar way that some stretches of canal were converted into railways in the 19th century. Indeed a body of economic literature argues that the conversion of commuter railways into high-capacity busways would deliver particularly large benefits for travellers and taxpayers, making this an appropriate illustration of the potential for substantial economic returns from liberalisation.10
This paper is not an exercise in ‘picking winners’, however, and it should not be read as an endorsement of a particular transport mode. Rather, it considers the general case for infrastructure owners11 to be free to change the modal use of transport routes without hindrance from government intervention, illustrating the possible benefits with a particular example.
The remainder of the paper therefore critically examines the case for allowing the conversion of commuter railways into busways. In suitable locations, this would involve owners removing the current rail infrastructure and replacing it with dedicated highway using the same transport corridor. Importantly, it is envisaged that the new busways would typically be separated from the existing road network and managed to avoid congestion.12 The infrastructure owners would be free to charge tolls for buses and express coaches using the converted routes and also to operate vehicles themselves.13
The next section analyses the potential impact of railway conversion on capacity, journey times, fares and subsidies together with the economic and technical objections to such a reform. The final part then discusses the policy changes that would be necessary to allow the reallocation of
10 There are also practical engineering reasons to consider rail rather than other modes. In physical terms, rail is relatively inflexible, requiring fairly straight paths with shallow gradients. This means that converting road to rail would generally involve considerable difficulties and high costs.
11 In theory a wide variety of ownership structures would be compatible with such an approach, although the financial incentives for dynamic entrepreneurial activity are likely to be stronger under private ownership (see Knipping and Wellings 2012).
12 Pricing is one mechanism that could be used to prevent congestion, depending on the business model chosen (ibid.). There are also various technical means of ensuring free flowing traffic.
13 The degree of ‘vertical integration’ should ideally be a commercial decision. The costs and benefits of different business models will vary according to market conditions in different locations.

14
infrastructure to different uses and to address harmful government-imposed distortions to the transport market. It is concluded that such liberalisation has the potential to deliver substantial efficiency gains, while significantly reducing the burden on the taxpayer. This illustrates the general point that such reallocations of resources are an essential aspect of a dynamic and thriving market for mobility that delivers improved services to consumers.
15
Capacity and overcrowding
Overcrowding on commuter trains is a key concern of transport policymakers.14 In this context, it is often claimed that rail has a far higher capacity than roads. In evidence to the Transport Select Committee, representatives of train manufacturer Bombardier stated that ‘to carry 50,000 people per hour in one direction we would need: a 175-metre road used by cars, or a 35-metre road used by buses, or a 9-metre bed for a metro or commuter railway’.15 On the same theme, the Secretary of State for Transport recently claimed that the High Speed 2 (HS2) railway would offer the same capacity as a new 12-lane motorway.16 HS2 Ltd claims it will run up to 18 1,100-seat trains per hour, providing 20,000 seats per track.17
In fact, it is well established that a single lane of a motor road, free of junctions, may carry up to 1,000 express coaches per hour.18 If they were travelling at 100 kph (60 mph) the headways would be 100 metres, leaving gaps between the vehicles greater than the minimum distances recommended for motorways and substantially greater than often observed in practice on the road network. If those vehicles had 75 seats apiece, the capacity would be 75,000 seated per hour. Accordingly, Donald Morin, Head of Public Transport at US Department of Transport in the 1970s, concluded that there is no movement corridor in the world where demand cannot be satisfied by a motor road dedicated to express coaches (Morin 1970).
14 See for example ‘Train operators urged to tackle overcrowding’, DFT press release, 10 September 2014, train-operators-urged-to-tackle-overcrowding
15 Transport Committee’s inquiry enquiry into the Future of the Railway, 2003-2004, Bombardier, at Ev, 479: http://www.publications.parliament.uk/pa/cm200304/cmselect/cmtran/145/145ii.pdf
16 See: https://www.gov.uk/government/speeches/hs2-engine-for-growth17 http://www.hs2.org.uk/about-hs2/facts-figures/route-trains-cost18 Perhaps more in the future, if driverless technology is deployed and headways
shortened (see KPMG/CAR 2012).
16
Real-world examples confirm the high capacity potential of buses and express coaches using dedicated infrastructure. The contra flow lane serving the Port Authority Bus Terminal in New York is only 11 feet wide (3.3m). It is separated from on-coming traffic by plastic poles inserted into holes every morning. Yet despite the low-grade nature of this arrangement, it carries close to 700 45-seat express coaches in the busiest hour, offering around 30,000 seats.19
The bus rapid transit systems of the developing world also illustrate the potential, even though such systems are typically constrained by stops every few hundred metres and various bottlenecks. Bogota’s TransMilenio system, for example, has a capacity of up to 56,000 passengers per hour in each direction, split into two lanes, one for express and one for stopping services (Velez et al. 2014). Istanbul’s Metrobus system has an estimated peak ridership of 35,000 passengers per hour in a single lane (Buran 2013).
This may be contrasted with the performance of the railway lines serving central London. Approximately 250,000 passengers enter London’s rail terminals in the morning peak hour (DFT 2014a). There are at least 33 inbound tracks close to the terminals but that reduces to around 25 further out. Dividing the 250,000 by 25 yields just 10,000 passengers per inbound track.20 And, as mentioned above, a significant proportion of these rail travellers must stand. The 10,000 could be carried in 150, 75-seat coaches, sufficient to occupy around one-seventh of the capacity of one lane of a busway of similar width as required by a train.
There is therefore strong evidence that the conversion of commuter railways into busways could increase substantially the capacity of routes. (And the introduction of driverless technology will eventually raise capacity further still (see KPMG/CAR 2012)). Furthermore, whereas a high proportion of rail passengers now stand during peak hours, busways could potentially offer seating for all. These benefits would appear to make conversion a particularly appealing option for the most overcrowded routes.
19 For details see http://www.panynj.gov/bridges-tunnels/lincoln-tunnel-xbl.html20 For maps and illustrations see: http://www.transport-watch.co.uk/topic-15-london-
waste-battersea-and-north-marylebone

17
Journey times
Trains typically offer higher top speeds than buses and coaches. Accordingly, it might be assumed that railway conversion would lead to a significant and undesirable increase in journey times. Even if this were the case, a significant proportion of passengers might prefer to trade-off slower journeys for much lower fares (see below).21 Nevertheless, the objection does not appear to hold for the vast majority of commuter trips.
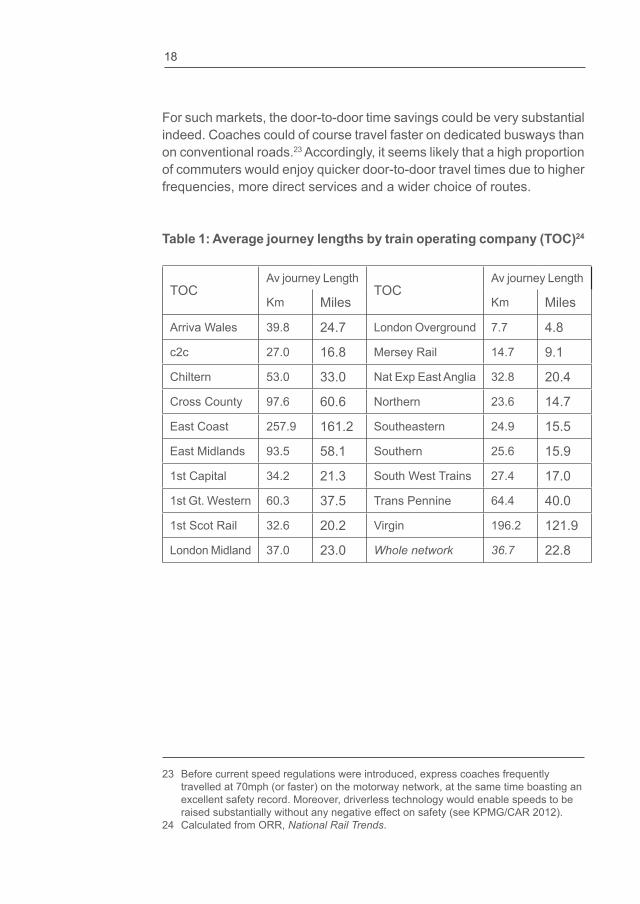
Table 1 provides average journey lengths by train operating company. National Travel Survey data show that approximately half of all passenger rail journeys are less than 20 miles long, while 90 per cent are less than 80 miles long (DFT 2014b). For shorter trips, an express coach operating on an uncongested railway alignment could deliver similar speeds to trains whilst offering a far higher service frequency. In addition, on many routes, particularly at peak times, the greater flexibility associated with using a higher number of independent vehicles would allow coaches to offer non-stop journeys that could be faster than the stopping rail services they replaced.
Furthermore, express coaches and buses could feed-in from the road network, offering direct services to main termini from towns, villages and suburbs currently not served by the rail network.22
21 As shown by the market for commuter coaches in the South East of England (see Starkie 2013).
22 Though in some locations the number of interfaces with the road network might be limited due to their possible impact on capacity. Once again, this trade-off would be best determined through a market discovery process.
18
For such markets, the door-to-door time savings could be very substantial indeed. Coaches could of course travel faster on dedicated busways than on conventional roads.23 Accordingly, it seems likely that a high proportion of commuters would enjoy quicker door-to-door travel times due to higher frequencies, more direct services and a wider choice of routes.
Table 1: Average journey lengths by train operating company (TOC)24
TOCAv journey Length
TOCAv journey Length
Km Miles Km Miles
Arriva Wales 39.8 24.7 London Overground 7.7 4.8
c2c 27.0 16.8 Mersey Rail 14.7 9.1
Chiltern 53.0 33.0 Nat Exp East Anglia 32.8 20.4
Cross County 97.6 60.6 Northern 23.6 14.7
East Coast 257.9 161.2 Southeastern 24.9 15.5
East Midlands 93.5 58.1 Southern 25.6 15.9
1st Capital 34.2 21.3 South West Trains 27.4 17.0
1st Gt. Western 60.3 37.5 Trans Pennine 64.4 40.0
1st Scot Rail 32.6 20.2 Virgin 196.2 121.9
London Midland 37.0 23.0 Whole network 36.7 22.8
23 Before current speed regulations were introduced, express coaches frequently travelled at 70mph (or faster) on the motorway network, at the same time boasting an excellent safety record. Moreover, driverless technology would enable speeds to be raised substantially without any negative effect on safety (see KPMG/CAR 2012).
24 Calculated from ORR, National Rail Trends.
19
Fares and costs
It is difficult to estimate in advance the fare levels that might be charged by bus/coach operators on the converted routes. The setting of fares should ideally be a market process and entrepreneurs would have strong incentives to offer different trade-offs between price and quality to appeal to different segments of the transport market. For example, coach services into the City of London from wealthy villages in the ‘stockbroker belt’ might offer a premium service with larger seats, wireless internet and ample space to work during the journey. Indeed the potential for a much higher degree of consumer choice (i.e. market segmentation), compared with rail, is a significant argument in favour of conversion.
Notwithstanding the problems of predicting the pricing behaviour of future markets, data from existing commuter coach services suggest that fares are approximately 40 per cent cheaper than those on parallel rail routes (Starkie 2013: 52).25 Coach firms charge lower fares despite not receiving direct subsidies from government. Moreover, their costs are increased substantially by congestion and delays on the existing road network – these particular costs would not be an issue on segregated former rail routes managed to avoid hold ups.
The following analysis also suggests that overall costs could be far lower than for comparable rail services. Given a process of market competition26 this would not only enable government subsidies to be phased out; it would also tend to be reflected in lower passenger fares.
25 For an indicative comparison, see also: http://www.chalkwell.co.uk/commuters/maidstone-commuters/price-comparison-coach-versus-train/
26 The contestability of transport markets and possible industry structures have been discussed elsewhere (e.g. Knipping and Wellings 2012).
20
Labour costs
Labour represents one of the largest costs for public transport operators. According to one estimate, direct staff costs average 34 per cent of turnover for train operating companies (DFT/ORR 2011: 72). Busways are often criticised on productivity grounds because a ten-carriage train typically requires just one driver compared with approximately ten for replacement express coaches (see, for example, Vuchic 2007). However, such analyses ignore the large number of people required to maintain and manage the infrastructure and vehicles etc. Indeed, one historic study estimated that, when all the support staff were included, a typical train in 1960 required 49 people to run it rather than just the driver (RCL 1965). Productivity has subsequently improved, but even today train drivers are thought to account for roughly 10-15 per cent of the labour employed by the heavy rail industry (including subcontractors etc.), giving some indication of the high number of other employees required to operate the network.27
During the 2010 public inquiry into Chiltern Railways’ proposal to add a track to the line between Oxford and Bicester it transpired that the organisation had around 170 passenger carrying vehicles and 740 employees, suggesting approximately four per railway carriage – and that is before considering the Network Rail staff dedicated to maintaining and improving the track.28
Given the generally lower maintenance costs of highways compared to railways (see below), and the automation of online booking systems and so on, it seems highly unlikely that staff costs per passenger mile on converted busways would exceed those on the rail routes they replaced. Three further considerations should be noted. Firstly, the wages of bus/coach drivers are generally much lower than those of train drivers.29 Secondly, drivers of peak-hour commuter coaches could perhaps engage
27 DFT/ORR (2011) provides estimates of the number of employees of Network Rail and the train operating companies and various umbrella bodies, but this does not represent the full number of workers in the industry, given the role of subcontractors etc. For an estimate of the number of train drivers see: http://www.aslef.org.uk/information/100011/about_us/
28 For supporting data, see: http://www.chilternrailways.co.uk/about-us/our-train-fleet and http://www2.passengerfocus.org.uk/Board_papers/1103/March%2011%20BM%2011.3a%29%20Supporting%20papers%20-%20Chiltern%20Railways.pdf
29 For comparison, see: https://nationalcareersservice.direct.gov.uk/advice/planning/jobprofiles/Pages/traindriver.aspx and https://nationalcareersservice.direct.gov.uk/advice/planning/jobprofiles/Pages/busorcoachdriver.aspx

21
in some other job during the day, further lowering labour costs.30 Finally, the introduction of driverless technology would reduce or eliminate any driver-productivity advantage of rail.
Fuel costs
There are obvious difficulties in comparing fuel/energy costs. Results partly depend on load factors, i.e. the number of passengers per vehicle on the new services. Nevertheless, buses and coaches with the high load factors that would be expected on commuter services are clearly very fuel efficient compared with competing modes. A typical express coach on a segregated highway would currently achieve approximately 12 miles per gallon of diesel, equating to 600 passenger miles per gallon with a load of 50 commuters and 300 passenger miles per gallon with a load of 25. While suitably disaggregated data are unavailable for the railways, passenger train services across the whole network achieve the equivalent of approximately 150 passenger miles per gallon31, suggesting that direct fuel costs for commuter coaches are likely to be broadly comparable with the busier peak-time rail commuter services.
However, the greater flexibility of buses and coaches gives them an advantage over trains in terms of matching vehicle capacity to consumer demand, i.e. in the sense that excess capacity can be more easily withdrawn during quieter periods. Moreover, in making comparisons it is important to consider full energy costs over a whole life cycle, including that required to fuel support activities such as infrastructure maintenance. Chester and Horvath (2009) estimate that in the US, total life-cycle energy inputs contribute an additional 63 per cent for road transport, 31 per cent for air and 155 per cent for rail, compared with ‘vehicle tailpipe operation’. By contrast, many UK analyses simplistically compare the energy consumed in operating the vehicles, while ignoring the wider energy costs.
30 This possibility partly reflects the lower cost and greater flexibility of the ‘rolling stock’.31 Estimates vary, but indicative data are provided in ATOC (2007). Electricity
consumption must be converted into its diesel equivalent. Withrington has estimated the rail figure at 113 passenger miles per gallon: http://www.transport-watch.co.uk/facts-sheet-5-fuel-and-emissions-trains-compared-replacement-express-coaches-and-lorries-november-20
22
Environmental costs
The above analysis suggests that conversion would be unlikely to increase significantly emissions of greenhouse gases, and could actually reduce them if the full energy consumption involved in operating railways is considered. Moreover, the ability to run bus and express coach services from stops closer to people’s homes has the potential to eliminate a large number of car journeys to and from railway stations. It should also be pointed out that the UK’s participation in the EU Emissions Trading System effectively puts a cap on overall greenhouse-gas output in any case (Niemietz 2012).
Urban air pollution may be a more challenging issue. Although the supporting evidence is questionable (Schwartz 2003), the European Union imposes strict emissions targets for pollutants such as particulates and nitrous oxide. Electric trains have the advantage of releasing their emissions at power stations which may be a long distance from the cities in which they operate. The precise implications of conversion for urban air pollution are likely to vary considerably by location32, but if the UK remains signed up to the EU targets, potential solutions include restricting use of converted routes to newer vehicles that meet certain EU regulations on exhaust emissions. The costs of such restrictions may well outweigh the benefits, but in a highly politicised transport market this could be a necessary evil in the largest cities. The extra costs would be relatively small compared with the likely fare revenues. While use of electric vehicles would reduce pollution in the immediate locality, this would typically come at the cost of higher overall environmental damage, given current technology (Withrington 2011).
The issue of traffic noise would also appear to be relatively easily addressed. The intermittent but very noisy passage of trains would typically be replaced by the much quieter but more constant hum of buses and coaches.33 Of course, where traffic was diverted from existing roads, which often pass just a few feet from residential properties, there could be large overall falls in noise pollution levels, particularly since there would be a markedly reduced need for acceleration and braking. Nonetheless, concerns from residents along the converted routes themselves could, if necessary, be
32 One issue is to what extent road journeys would divert from existing, often congested roads.
33 For indicative comparisons between modes, see Frost and Ison (2007).

23
addressed through restrictions on the noisiest vehicles or the installation of quiet road surfaces and noise barriers.
Local pollution issues, including noise, also raise the question of compensation for nearby property owners, as is payable when new roads are constructed. The situation is clearly very different when an existing transport route is converted to a different mode with many environmental advantages and thus it is likely to be inappropriate to apply the existing framework to converted routes.
Maintenance
Indicative data also suggest that the converted routes would compare favourably with rail in terms of maintenance costs, although like-for-like comparisons are problematic. Network Rail spends approximately £5 billion per year on maintenance and renewals on Britain’s 10,000-mile rail network – a similar sum to the total spent on maintenance and renewals by the Highways Agency, regional agencies and local authorities on the 245,000-mile road network (DFT 2013). The 4000-mile strategic road network carries roughly three times more passenger traffic and four times more freight traffic than the entire rail network, yet its annual maintenance and renewal costs are approximately £1 billion in total.34 Thus the comparative data provide some tentative evidence that the busways would enjoy substantially lower maintenance costs than the railways they replaced, although the precise outcomes would vary by location and by traffic mix.
Rolling stock
It also seems probable that significant savings would also be obtained in rolling stock costs: on a per-seat basis, buses and motor coaches are generally far cheaper than railway vehicles, a brand new 50-seater coach costing approximately £200,000 compared with roughly £1.5 million per carriage for a train. Even when the shorter working life of coaches is taken into account, as well as vehicle maintenance, it is estimated that comparative rolling stock costs would be roughly a quarter of those on the railways.35
34 A precise figure is not given due to the difficulty in disaggregating PFI payments – see Highways Agency (2012).
35 See, for example: http://www.transport-watch.co.uk/facts-sheet-9-rail-versus-road-passenger-rolling-stock-costs. Similar conclusions were drawn by Serpell (1983).

24
Conversion costs
While the likely operating costs of converted routes would appear to be significantly lower than those on the railways they replaced, substantial costs would inevitably be incurred during the conversion process. Nevertheless, expenditure would typically be very much lower than building an equivalent new road from scratch, since much of the planning, initial land purchases and engineering work would not be necessary.
The disruption to travellers during the conversion process would also have to be considered, although this could be mitigated by undertaking the work in a series of stages designed to minimise the inconvenience caused. Railways are subject to periodic renewals and upgrades in any case, often resulting in very severe disruption to users’ journeys.36
Several studies have examined the likely costs and have also provided indicative estimates for a hypothetical case in which the whole of the rail network was converted.37 Estimates can also be derived from several case studies where relatively short sections of railway have been converted into highways.38 Such an analysis implies costs of approximately £120 per square metre, or a hypothetical £20 billion for the entire rail network, if a generous mean busway width of 10 metres is assumed. This is broadly in line with current road construction costs shorn of the unnecessary components.39
Which routes to convert?
In light of these costs, the decision whether to convert should ideally be a commercial one for the infrastructure owners. There are good reasons to expect, at least initially, economic returns to be concentrated in the busy commuter routes into major cities. By contrast, the incentives for
36 Note, for example, the frequent closures and bus replacement services required during the 1998-2008 upgrade and renewal of the West Coast Main Line.
37 Brigadier Lloyd (1955), for example, estimated the cost at less than £600 million, equivalent to roughly £12 billion at 2014 prices.
38 For case studies, see: http://www.transport-watch.co.uk/topic-16-railway-conversions-costs-and-illustations
39 For indicative road construction costs, see Archer and Graham (2006).

25
conversion are likely to be relatively low in those rural areas where good quality roads with spare capacity already run in parallel to the railways.40 Moreover, whatever the costs and benefits, there are likely to be significant political obstacles to converting railways that carry long-distance inter-city services, with fears that travel times would increase. Accordingly, if owners chose to convert only a selection of commuter routes into large cities the total costs would be a small fraction of the hypothetical estimates for the whole rail network and also low in comparison to ongoing rail subsidies, which have exceeded £50 billion in the last decade.41
Ridership figures suggest these infrastructure costs could be recouped from fare revenues without the need for taxpayer support, even before considering the prospect of increased passenger numbers, the sale of surplus land and property, and various other potential sources of revenue. For example, there are over 500 million heavy-rail trips per year to and from Central London rail termini (ORR 2013), suggesting that only a small proportion of fare income would be required to make a commercial return from converting some of the busiest urban commuter routes.
Indeed, previous studies suggest high economic returns from such projects.42 However, critics have also raised a number of technical objections to conversion. In particular they have claimed that the widths and heights of railway paths are insufficient to accommodate buses and coaches. Moreover, they are sceptical that the space available in the main railway stations would be sufficient for the large number of vehicles likely to utilise them.
40 Although in some rural locations railways offer superior routes, in terms of directness and gradients, to nearby roads, meaning conversion should not be ruled out as an option.
41 In current prices. See, for example, McNulty (2011: 23) and http://orr.gov.uk/news-and-media/email-alerts/2014/regulator-publishes-new-data-on-government-financial-support-to-rail-industry
42 Examples include Lloyd (1958); RCL (1965); Hall and Smith (1976); Smith (1978); RCL (1984); Dalgleish (1993).

26
Technical issues
Widths and headroom
Whilst the width between the rails is just 4 feet 8.5 inches43, bridge abutments, tunnels and viaducts on double-track railways offer a clear width seldom less than 24 feet (7.3m), the same as required for the carriageway of a two-way trunk road. Single-track railways offer 13 feet (4m) between bridge abutments but many were built on double track formations. Hence most railway rights of way are wide enough for conversion to roads provided the verges, which form part of the design standard for green-field construction, are forgone. Effective verges are generally absent on most ordinary roads and would serve little or no purpose on railway alignments. Many existing A-roads, upon which buses and coaches operate without difficulty, offer widths down to as little as 20 feet (6m). Similarly, the typical headroom in tunnels and bridges on the rail network is sufficient to accommodate even double-decker buses.44
Against that background the notion that railways in general are ‘too narrow’, or lack adequate headroom, should be dismissed. A feasible option for conversion would be 3.5 metre lanes and 4.5 metres of headroom. Marginal strips could flank the carriageways where existing widths enabled that. Departures from such standards (e.g. a reduction in lane width to 3 metres) could be adopted where the full specification would impose unacceptable costs. On the approaches to towns and cities the widths are often vast.
43 The vast majority of rail paths in Britain pre-date metrication, so imperial units were used.
44 Note that the surface of the busway would typically be c. 300mm below rail top. Further technical details, illustrations and references are provided here: http://www.transport-watch.co.uk/facts-sheet-3-widths-and-headroom-are-they-too-narrow
27
Terminal size
The possible objection that the space provided by existing rail terminals would be inadequate to accommodate the buses and coaches using a converted route can also be challenged. Major railway stations, such as the London termini, cover several hectares. Platforms have substantial widths and lengths may be in excess of 200 metres. Moreover, when a train arrives it remains in place, sterilising the use of the entire platform until the scheduled return trip. By contrast, frequent peak-time buses/coaches could quickly move off after depositing passengers. Indeed, a proportion of services could join the conventional road network in order to deliver passengers to a range of city-centre destinations, thus either bypassing the termini completely or quickly vacating terminal space. The benefits to passengers of such flexibility, both in terms of fare costs and journey times, could be very substantial indeed.
It would also be relatively straightforward to accommodate parking bays on several vertical levels by using ramps, as demonstrated at the Port Authority Bus Terminal (PABT) in New York. Indeed, although it suffers many disadvantages compared with a terminal in a former railway station with wide, segregated access, the PABT handles roughly two-thirds the number of weekday passengers using London Waterloo on a site approximately one fifth the size.45 Accordingly, it seems likely that converted routes would require significantly less space than railways for a given amount of passenger traffic.
This raises the possibility that redundant portions of termini could be redeveloped, with potentially large profits in locations with high land prices such as Central London. In addition, there might be extensive redevelopment opportunities in the vast areas taken up by sidings and depots in the suburbs. Such land is often sterilised by lack of good road access. Thus the returns from redevelopment would partly depend on decisions about the type and volume of traffic that used the former railway alignment. Some different options are outlined briefly below.
45 This comparison is indicative rather than definitive given the different traffic and conditions at the two sites. See: http://www.panynj.gov/bus-terminals/pabt-history.html and https://www.networkrail.co.uk/london-waterloo-station/history/

28
Guided buses
Where busways have been developed by government, there has been a tendency to favour schemes with restrictive, bespoke infrastructure, such as guided bus schemes and bus rapid transit. In the case of guided buses, a major rationale is that it allows relatively high-speed operation in a narrow space.
The recently opened Cambridgeshire Guided Busway is the longest such scheme in the world with 16 miles of guided route. It was converted from the disused track beds of the Cambridge and Huntingdon Railway, and the Varsity Line which linked Cambridge to Oxford. The new link is 6 metres wide, with two lanes 2.6 metres in width and an 80cm central reservation. The guideway track is made up of two concrete beams with kerbs. Guide wheels on the bus connect with the kerb and steer the vehicle while it passes through the guided section – the driver does not need to hold the steering wheel.46
Despite the stated rationale for guided busways, approximately 4 miles of the Cambridgeshire project is on a railway embankment 8.5 metres wide at the top, while elsewhere on the route widths of over 10 metres are common – broader than many A-roads with 60 mph limits (currently the busway speed limit is 55 mph).
The Achilles heel of such guided systems is arguably their lack of flexibility in terms of the type of traffic accommodated. Only specially equipped vehicles can use the infrastructure. The Cambridgeshire scheme once again illustrates the problem. The usage of this valuable right-of-way is trivial compared with what could be achieved if the facility were a conventional conversion. On average, it carries approximately 10,000 trips per day, with around 15 buses heading into Cambridge in the peak morning hour, a flow so trivial it would barely be noticeable on an ordinary road.47
While guided busways may have advantages compared with rail options, their cost is typically several times higher than conversion into a conventional highway. The Cambridgeshire scheme ended up costing at least £150 million, roughly double the cost of a brand new, high-quality single
46 http://www.thebusway.info/aboutus.aspx47 ‘Cambridge busway still leading the way’, Transport Xtra, 5 September 2013,
http://www.transportxtra.com/magazines/local_transport_today/news/?ID=35634
29
carriageway trunk road of a similar length, and perhaps as much as six times the cost of a simple conversion scheme (see above).
In this particular instance, a conventional toll road, priced and managed to avoid congestion, would almost certainly have delivered far greater economic benefits from converting the old rail beds. Such a solution would have provided ample capacity for bus services while at the same time offering substantial time savings for other road users, in the process offering an alternative local route to the A14, one of the worst bottlenecks on the UK’s strategic road network. If a wide range of vehicles had been allowed to use the infrastructure, much greater capacity utilisation would have been achieved. It may also have been possible to fund such scheme without recourse to government subsidies.48
Bus rapid transit (BRT)
Bus rapid transit schemes have been developed in around 200 cities across the world, with a particular concentration in Latin America.49 City authorities have typically viewed them as a way of developing high-capacity transport infrastructure at a small fraction of the cost of subway systems or light rail. The capital costs have been estimated at roughly one third those of tram schemes (GAO 2001).
As would be possible on converted railways, BRT networks segregate the busways from other traffic, with the lanes often taking up the central section of major urban roads. In some cities, they operate essentially like above-ground tube trains, using long, articulated buses capable of carrying up to 250 people per vehicle (mostly standing). These longer buses limit the number of vehicles per hour on a single lane to around 360, or one every ten seconds, giving a maximum theoretical capacity of around 90,000 passengers per hour. In practice, however, bottlenecks caused by interfaces with the road network and operational inefficiencies have reduced throughput. Rail-style raised platforms have been adopted on some systems in order to reduce boarding times by eliminating steps, though with the disadvantage that specially designed equipment is required. The distance between stops is typically somewhat intermediate between local
48 The commercial case is complicated by market distortions, such as the existence of parallel roads that are free at the point of use, and the imposition of high rates of fuel duty on private road users.
49 http://www.brtdata.org/#/location

30
bus services and subway systems. For example, in the pioneering system in Curitiba, Brazil, stops are spaced at intervals of about 500 metres (TRB 2001).
High-capacity BRT-type systems could be appropriate commercial options for former railways in the major cities. For example, wide commuter-rail paths in London could be divided into four lanes, the inner lanes allocated to express, often non-stop coaches coming in from the outer suburbs and satellite towns, and the outer lanes to BRT-style stopping services primarily serving the high-density, inner-city zones. Needless to say, segregated former rail routes with wide station approaches would eliminate the bottlenecks experienced on current road-based BRT networks, allowing actual capacity to approach the theoretical maximum.
The market discovery process
While BRT systems demonstrate the potential - in terms of capacity and so on – of converted routes, it is important that the precise technologies to be deployed are not restricted in advance by government regulation. Such a policy could lead to sub-optimal utilisation of the infrastructure by undermining entrepreneurship, innovation and the role of market pricing in efficient resource allocation (Hayek 1945). Ideally the use of the routes should be subject to a market discovery process, by which owners would be able to try out new combinations of services in order to better serve passengers, attract new customers and increase returns.50 The precise mix of vehicles using a particular route might therefore vary significantly by location.
In very large cities such as London, high-capacity buses might predominate, particularly during the morning and evening peaks. However, in smaller cities a mixture of traffic might be preferred in order to make use of spare capacity. Conversion into mixed toll roads could have enormous advantages in terms of decongesting the existing road network and reducing travel times. For example, heavy goods vehicles could be diverted from unsuitable
50 Although there is an argument, in the context of pervasive state intervention in land-use planning, that regulation should ensure that land already committed to transport should be retained in transport use, except in exceptional circumstances. Other examples of relatively ‘light-touch’ regulation might include basic safety standards for track and vehicles (though buses and coaches are extremely safe modes in any case).
31
urban streets. Clearly new technology has the potential to affect these kinds of commercial decisions, with the ‘platooning’ of driverless vehicles perhaps extending the possibility of mixed traffic to even the busiest locations. The impact of disruptive technology provides a further powerful argument against continuing to fossilise the use of transport infrastructure.
32
Liberating the transport sector
The above analysis suggests there may be a strong economic case for allowing transport infrastructure to be redeployed to different modes. However, there are major fiscal and regulatory obstacles to the development of a dynamic and efficient transport market that would enable this process to operate effectively.
Firstly, there is the issue of pricing. The vast majority of the road network is not priced at the point of use, leading to congestion and other inefficiencies, while similar problems have developed on parts of the rail network as a result of fare regulation. There is clearly a danger that such conditions would artificially reduce demand on newly converted routes, particularly where alternative transport options run in parallel. (A comparable illustration is the way M6Toll revenue has been undermined by the original M6 through Birmingham, which is free at the point of use).
Secondly, different transport modes are not treated neutrally by the tax system and subsidy levels also vary markedly. As noted above, many road users face heavy taxation through fuel duty, while rail travel is zero-rated for VAT and the industry receives generous government support. Such distortions could reduce the returns from conversion, for example by facilitating unfair competition and artificially increasing operating costs.
There are considerable political obstacles to the removal of these and other interventions. In the rail sector, a combination of high government subsidies and extensive politicisation has created powerful special interests dependent on ongoing state support (Wellings 2006). Clearly these groups could seek to sabotage any policy that allowed infrastructure to be reallocated to higher value uses. And if some conversion projects did go ahead, a powerful rail lobby could potentially engage in ‘rent seeking’ behaviour to undermine the returns to owners. Possible strategies would
33
include lobbying policymakers to impose heavy fiscal and regulatory costs on converted routes in order to reduce their viability.
Accordingly there is a strong case for reforming transport policy more generally as part of a policy process that liberalises the sector to allow modal conversion. Taxes would be stripped of modal bias and subsidies phased out. And market pricing would be introduced through the removal of rail-fare regulations and the roll-out of road-user charging in suitable locations, ideally with infrastructure transferred out of state ownership to incentivise innovation and entrepreneurship (see Knipping and Wellings 2012).
A combination of subsidy cuts and institutional reform would depoliticise the transport sector by undermining the special interest groups that currently influence policy for their own financial benefit. At the same time, it would strengthen the commercial incentives for transport entrepreneurs to increase their returns by converting often loss-making infrastructure into profitable, higher-value uses.
But even in the absence of reform, there is still a strong case for government to consider a policy of conversion. The potential for higher capacity at much lower cost also makes it an attractive option under a state-directed system - and detailed analyses of particular schemes suggest that conversion projects would produce high rates of return as measured by cost-benefit analysis.51
51 For example, Hall and Smith (1978); RCL (1984). Within this framework, decisions should of course be based on an unbiased economic assessment rather than attempts to ‘pick winners’ by politicians (see Burton 1983).
34
Conclusion
In dynamic market economies, resources are constantly being reallocated in response to changing conditions and new entrepreneurial opportunities. Agricultural land is developed as housing and former warehouses are converted into offices. Workers are moved to higher value activities, both within firms and across the wider economy, and factories are retooled to produce different goods. Such reallocations are essential for increasing productivity, exploiting new technologies, creating wealth and improving living standards, yet in the case of transport infrastructure the process is severely restricted by government.
The evidence examined in this paper makes a compelling case for liberalisation. Allowing infrastructure to be used according to market forces has the potential to bring very substantial economic benefits. In the case of commuter railways in appropriate locations, it could facilitate a major increase in capacity, as well as reducing fare levels and enabling government subsidies to be phased out.
Ideally such a transformation would take place in the context of wider market reforms of the transport sector that removed distortions and gave infrastructure owners the freedom to choose better ways of using railways and other routes. But a more flexible approach could also deliver large gains even within the current framework of pervasive government intervention. Accordingly, it is recommended that bodies such as the Department for Transport and Transport for London seriously consider conversion options when assessing how to increase the capacity of commuter routes. Pilot schemes, perhaps on commuter railways with relatively limited interaction with the rest of the network, would improve policymakers’ understanding of costs, benefits and operational issues.
35
The government should also take steps to address the disproportionate influence of the rail lobby over transport policy. This is not just an obstacle to the more efficient use of infrastructure, but also to the liberalisation of the transport sector more generally. Without reform, commuters will face more expensive fares and worse overcrowding, while taxpayers will be forced to pay an even higher bill to subsidise new rail infrastructure.

36
References
Archer, C. and Glaister, S. (2006) Investing in Roads: Pricing Costs and New Capacity, London: Imperial College.
ATOC (2007) Baseline energy statement – energy consumption and carbon dioxide emissions on the railway. London: ATOC. http://www.atoc.org/clientfiles/files/publicationsdocuments/npsB3A7_tmp.pdf Buran, B. (2013) Istanbul Metrobus System. International Journal of Business Tourism Applied Sciences, http://www.ijbts-journal.com/images/main_1366796758/0015-B__ra.pdf
Burton, J. (1983) Picking Losers...? The Political Economy of Industrial Policy. London: Institute of Economic Affairs.
Butler, E. (2012) Public Choice – A Primer. London: Institute of Economic Affairs.
Chester, M. V. and Horvath, A. (2009) Environmental assessment of passenger transportation should include infrastructure and supply chains. Environmental Research Letters 4(2).
Dalgleish, A. (1993) The Truth About Transport. Chertsey: Railway Conversion League.
DCLG (2012) National Planning Policy Framework. London: DCLG.
DFT (2013) Transport Statistics Great Britain, 2013. London: DFT.
37
DFT (2014a) Rail passenger numbers and crowding on weekdays in major cities in England and Wales: 2013. London: DFT.
DFT (2014b) National Travel Survey: England 2013. London: DFT.
DFT/ORR (2011) Achieving Value for Money from People in the GB Rail Industry – Theme H Benchmarking. London: DFT/ORR.
Feldstein, M. (1995) Tax Avoidance and the Deadweight Loss of the Income Tax. Working Paper No. 5055, Cambridge, MA: National Bureau of Economic Research.
Frost, M. W. and Ison, S. G. (2007) Comparison of noise impacts from urban transport. Proceedings of the Institution of Civil Engineers, Transport 160(4): 165-172.
GAO (2001) Bus Rapid Transit Shows Promise. Washington DC: United States General Accounting Office.
Hadfield, C. (1969) The Canals of South and South-East England. Newton Abbot: David and Charles.
Hall, P. and Smith, E. (1976) Better Use of Rail Ways. Department of Geography, University of Reading.
Hayek, F. A. (1945) The Use of Knowledge in Society. American Economic Review 35(4): 519-530.
Highways Agency (2012) Highways Agency Business Plan 2012-13. London: Highways Agency, https://www.gov.uk/government/uploads/system/uploads/attachment_data/file/322615/Business_Plan_2012-13_Final.pdf
Knipping, O.and Wellings, R. (2012) Which Road Ahead: Government or Market? London: Institute of Economic Affairs.
KPMG/CAR (2012) Self-driving cars: The next revolution. Chicago: KPMG; Ann Arbor, MI: Centre for Automotive Research.
Lloyd, Brigadier T. I. (1955) Potentialities of the British Railways’ System as a Reserved Roadway System. London: Institution of Civil Engineers.

38
Lloyd, Brigadier T. I. (1958) Twilight of the Railways – What roads they’ll make! London: Forster Groom.
McNulty, R. (2011) Realising the Potential of GB Rail: Report of the Rail Value for Money Study. London: DfT/ORR.
Morin, D. (1970) The Hidden Potential in Freeways. Highway Progress, August 1970: 6-10.
Niemietz (2012) Redefining the Poverty Debate. London: Institute of Economic Affairs.
Plowden, W. (1971) The Motor Car and Politics, 1896-1970. London: Bodley Head.
ORR (2013) Estimates of station usage. http://orr.gov.uk/statistics/published-stats/station-usage-estimates
RCL (Railway Conversion League) (1965) No Alternative! The Case for Transforming Britain’s Railways into Motor Roads. London: Railway Conversion League.
RCL (Railway Conversion League) (1984) A Report on the Potential for Conversion of Some Railway Routes in London into Roads. Chertsey: Railway Conversion League.
Schumpeter, J. (1942) Capitalism, Socialism and Democracy. New York: Harper and Brothers.
Schwartz, J. (2003) Particulate Air Pollution: Weighing the Risks. Washington DC: Competitive Enterprise Institute.
Serpell, D. (1983) Railway Finances: Report of a committee chaired by Sir David Serpell. London: HMSO.
Smith, E. (ed.) (1978) Better Use of Rail Ways: Comments and Rejoinders. Department of Geography, University of Reading.
Starkie, D. (2013) Transport Infrastructure: Adding Value. London: Institute of Economic Affairs.

39
TRB (Transportation Research Board) (2001) Curitiba, Brazil: A BRT Case Study, http://onlinepubs.trb.org/onlinepubs/tcrp/tcrp90v1_cs/Curitiba.pdf Velez, J-P., Leonardo, C. R. and Scorcia, H. (2014) Bogota: TransMilenio’s overcrowing problem and a professor’s solution. Washington DC: World Bank.
Vuchic, V. (2007) Urban Transit: Systems and Technology. Hoboken, NJ: Wiley.
Wellings, R. (2006) Environmentalism, Public Choice and the Railways. In Hibbs, J., Knipping, O., Merket, R., Nash, C., Roy, R., Tyrrall, D. and Wellings, R., The Railways, the Market and the Government. London: Institute of Economic Affairs.
Wellings, R. (2012) Time to Excise Fuel Duty? London: Institute of Economic Affairs.
Wellings, R. (2014) The Privatisation of the UK Railway Industry: An Experiment in Railway Structure. Economic Affairs 34(2): 255-266.
Withrington, P. (2011) Electric Cars: Extended Note. Northampton: Transport Watch, http://www.transport-watch.co.uk/electric-cars-extended-note-27th-april-2011
Withrington, P. (2013) Don’t blame Beeching for loss-making railways. IEA Blog, 29 March, http://www.iea.org.uk/blog/dont-blame-beeching-for-loss-making-railways

40
Acknowledgement
This publication has been made possible by the support of the Nigel Vinson Charitable Trust. The directors and trustees of the IEA thank the Rt. Hon. Lord Vinson of Roddam Dene, LVO, for both his intellectual and financial input.

41

42


44
Institute ofEconomic A�airs
The Institute of Economic Affairs2 Lord North StreetLondon SW1P 3LBTel 020 7799 8900 email [email protected]