briefing on munitions management technologiese2s2.ndia.org/schedule/documents/2012...
TRANSCRIPT

Tim A. Hansen, P.E. Southern Research Institute NDIA E2S2– May 2012

Lead Organization: Southern Research Institute
Co-Performers: U.S. EPA’s Environmental Technology Verification
(ETV) Program FlexEnergy (Microturbine Supplier) Vanir Energy (Solar Chiller System Supplier) Power Partners (Adsorption Chiller Supplier)
Host Sites: Fort Benning, GA – 1st Division Road Landfill MCRD Parris Island, SC – Mess Hall
Funding & Support: ESTCP – Projects EW-0823 and EW-0928

Installation Energy Test Bed Initiative Prove out innovative systems via in field
demonstration and validation: System Performance
Economics
Environmental
Operability (install, operate, maintain)
Regulatory, permitting, approvals Encourages adoption and more rapid
commercialization and installation http://www.serdp-estcp.org/Featured-
Initiatives/Installation-Energy.

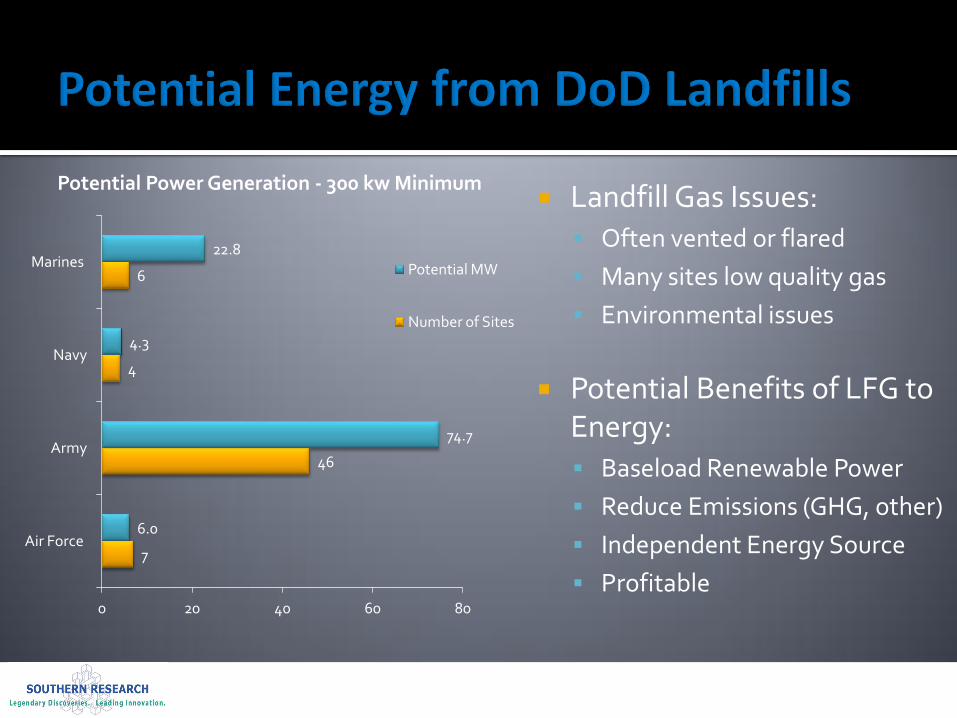
Landfill Gas Issues: Often vented or flared
Many sites low quality gas
Environmental issues
Potential Benefits of LFG to Energy: Baseload Renewable Power
Reduce Emissions (GHG, other)
Independent Energy Source
Profitable
7
46
4
6
6.0
74.7
4.3
22.8
Air Force
Army
Navy
Marines
0 20 40 60 80
Potential Power Generation - 300 kw Minimum
Potential MW
Number of Sites
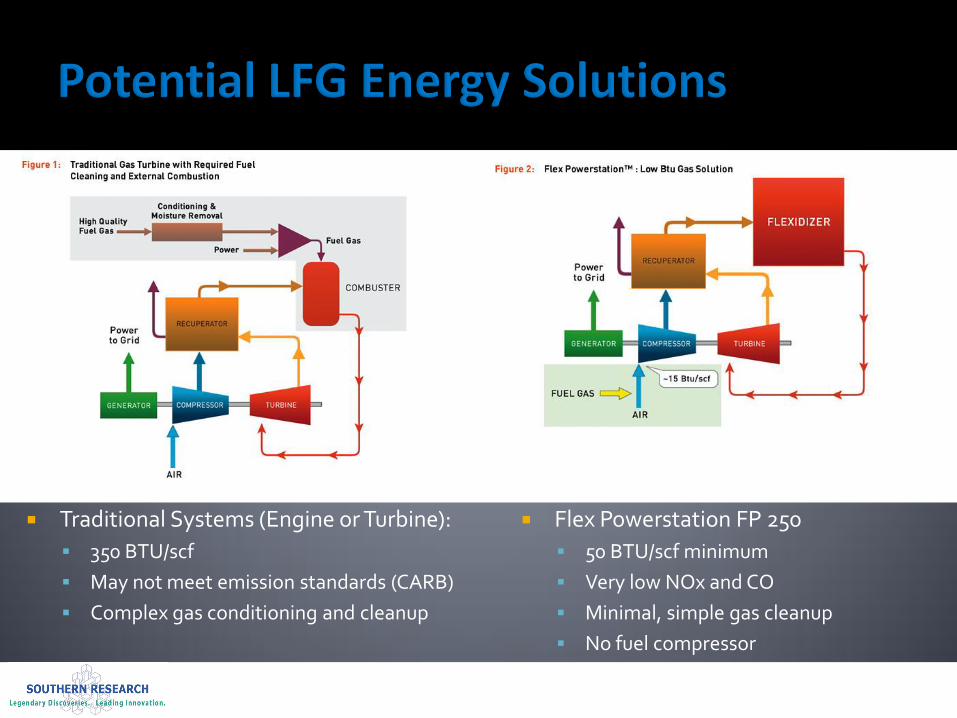
Traditional Systems (Engine or Turbine):
350 BTU/scf
May not meet emission standards (CARB)
Complex gas conditioning and cleanup
Flex Powerstation FP 250
50 BTU/scf minimum
Very low NOx and CO
Minimal, simple gas cleanup
No fuel compressor
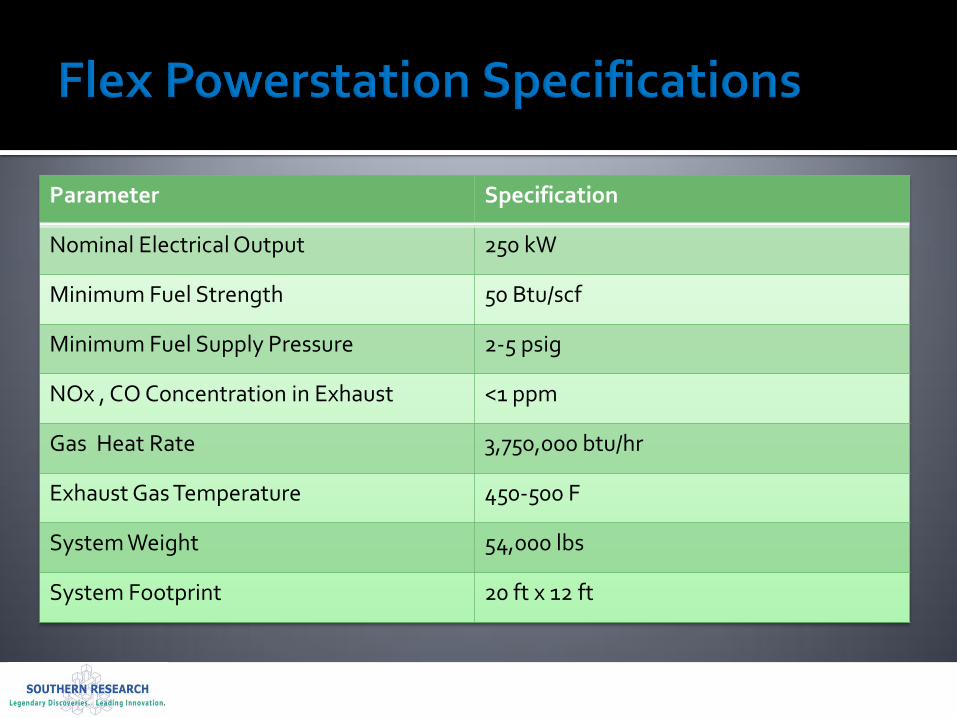
Parameter Specification
Nominal Electrical Output 250 kW
Minimum Fuel Strength 50 Btu/scf
Minimum Fuel Supply Pressure 2-5 psig
NOx , CO Concentration in Exhaust <1 ppm
Gas Heat Rate 3,750,000 btu/hr
Exhaust Gas Temperature 450-500 F
System Weight 54,000 lbs
System Footprint 20 ft x 12 ft

48 acres – MSW and mixed waste
2.3 million cubic yards / 1 million tons waste
Operated 1985 – 1998
Methane migrating off site
39 collection wells
Existing LFG flare

Commissioned September 29, 2011 Dedicated November 8, 2011

Complete independent verification testing Monitor for one year
Emissions and destruction efficiency evaluation
Economics
Reliability
EPA ETV Generic Protocol for DG-CHP Verification
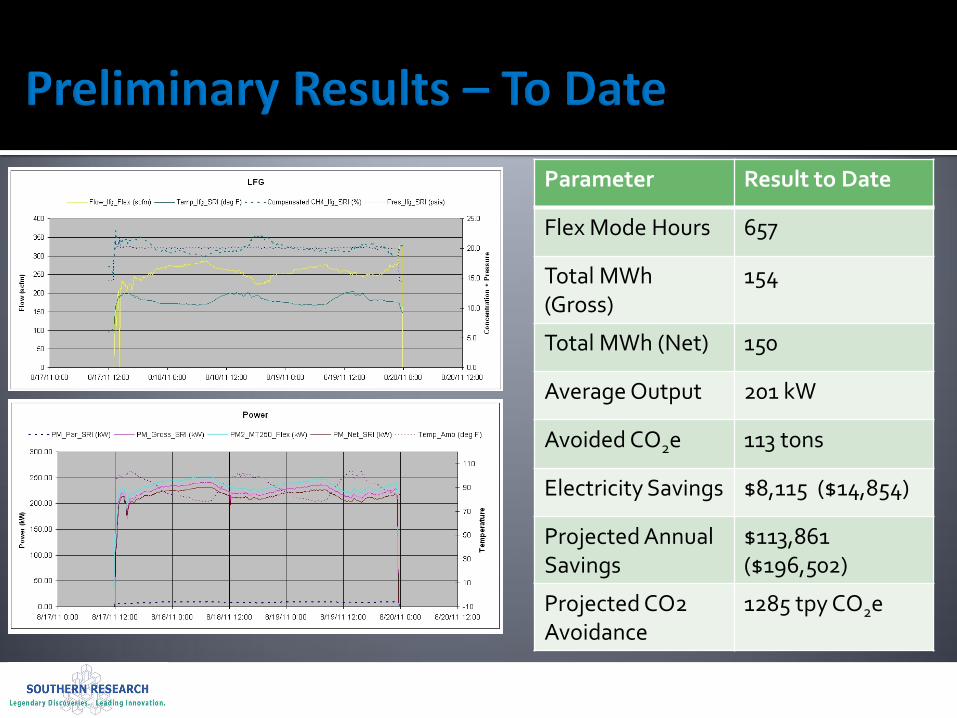
Parameter Result to Date
Flex Mode Hours 657
Total MWh (Gross)
154
Total MWh (Net) 150
Average Output 201 kW
Avoided CO2e 113 tons
Electricity Savings $8,115 ($14,854)
Projected Annual Savings
$113,861 ($196,502)
Projected CO2 Avoidance
1285 tpy CO2e
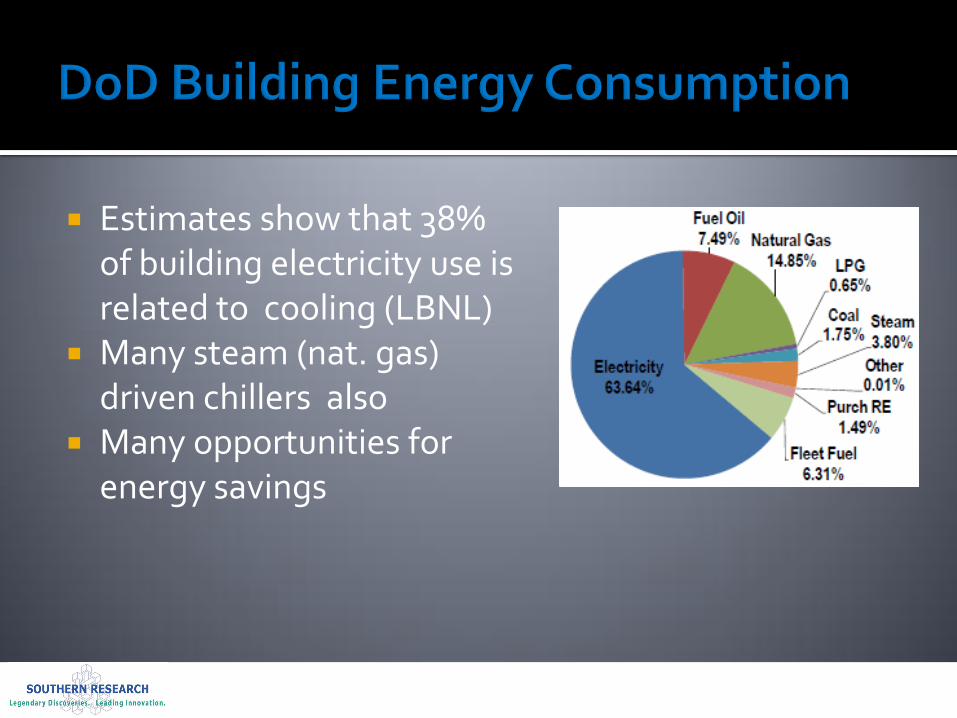
Estimates show that 38% of building electricity use is related to cooling (LBNL)
Many steam (nat. gas) driven chillers also
Many opportunities for energy savings

80 RT adsorption chiller 84 roof-mounted evacuated tube
collectors Supports a max. 38 RT load on chiller Steam backup and peaking 1,000 gallon hot water storage tank Capability for full operation on steam New, larger capacity cooling tower Pumps, piping, instrumentation, controls Existing 60RT electric chiller Solar for hot water heating when not
chilling

Use low grade or waste heat Water (refrigerant) and silica gel
(dessicant) Low energy consumption Low maintenance COP of 0.57; Average hot water =160 F
76 RT capacity
Supply temp = 58F
Chilled Water Temp = 49 F (avg.)
Max RT = 109 @ COP = 0.43
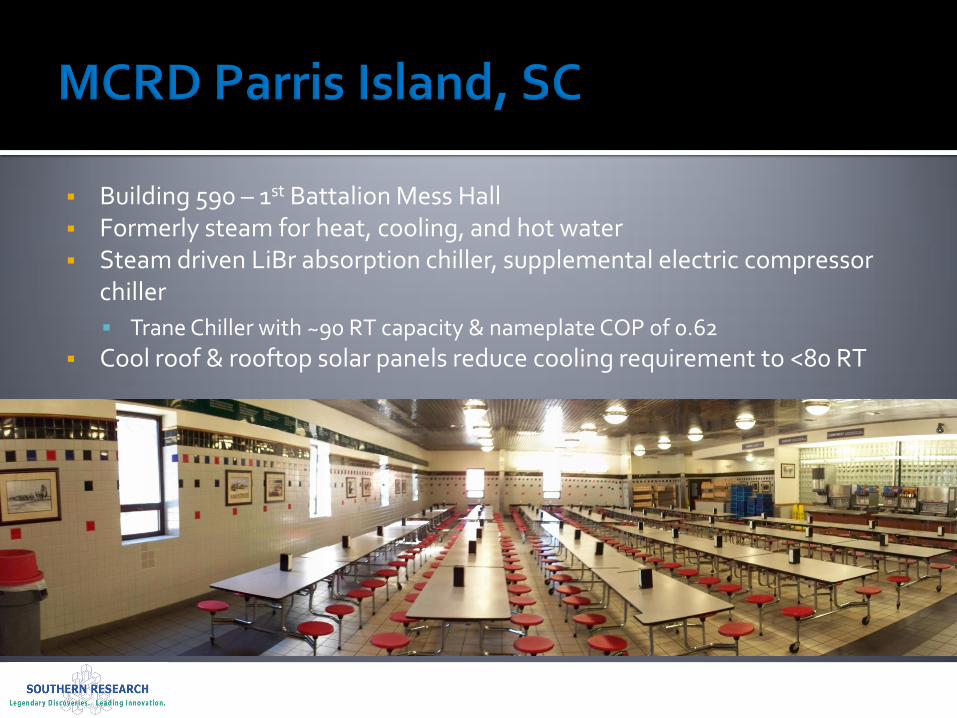
Building 590 – 1st Battalion Mess Hall Formerly steam for heat, cooling, and hot water Steam driven LiBr absorption chiller, supplemental electric compressor
chiller
Trane Chiller with ~90 RT capacity & nameplate COP of 0.62
Cool roof & rooftop solar panels reduce cooling requirement to <80 RT

GHG reduction 203 tpy CO2 offsets
752 MWh renewable energy equivalent at 50% solar fraction
Projections yield favorable economics
Economic Benefits
Solar Fraction
Annual Savings
Payback Period (yrs)
Net Present Value (20 yr life)
50% $ 119,328 7.23 $ 1,160,527
40% $ 95,462 9.20 $ 770,289
30% $ 71,596 12.66 $ 380,051
17% $ 40,571 24.87 $ (127,256)
6-Day Run Analysis (Preliminary)
Average Output 32 tons
Solar Fraction 17 %
COP 0.43
Chiller Load Contribution 69 %
Cumulative Array Output 18.2 MMBtu
Cumulative Steam Use 91.1 MMBtu
Continued Operation and Monitoring Flex Emissions Testing – July 2012 Flex Second installation – finalizing site
selection Guidance Document development System improvements Final Reports: Late 2012 / Early 2013

Expect the unexpected Baselines are often
difficult, and site specific Technologies can work
well, but… Integration, retrofit, or
balance of plant are key Existing equipment can have
major impacts Theory or Lab ≠ Reality Short term ≠ long term
Approvals ? Permits? Site specific results Did I mention
integration???
Contact: Tim A Hansen, P.E. Director, Advanced Energy Department Southern Research Institute [email protected]
919.282.1052
Jim Galvin Program Manager, Energy & Water ESTCP