bridging from single species tactical advice to ecosystem-based strategic advice lesson 1: we should...
TRANSCRIPT

Bridging from single species tactical advice to ecosystem-
based strategic advice
Lesson 1: We should expect our models to fail, sometimes spectacularly so. But when we do we should take the opportunity to learn from the failure

Traditional approach to fisheries management
• Management approach focuses on F via catch & effort regulation
– Stock assessments recommend B and F reference points
– SSC recommend ABC (<=OFL) that includes scientific uncertainty –tactical advice
– Council recommend ACT (<=ABC) that includes management uncertainty (implementation uncertainty)
• Stakeholders limited to
– Commercial fishery interests
– Managers (protecting societal interest)
)(1 MFRGBB tt

Approach to incorporating scientific uncertainty
• Select %ile of probability distribution
• Lack of data in many systems means that P* is becoming ordinal as cFlim
But this assumes that all stakeholders will want a maximal F
4
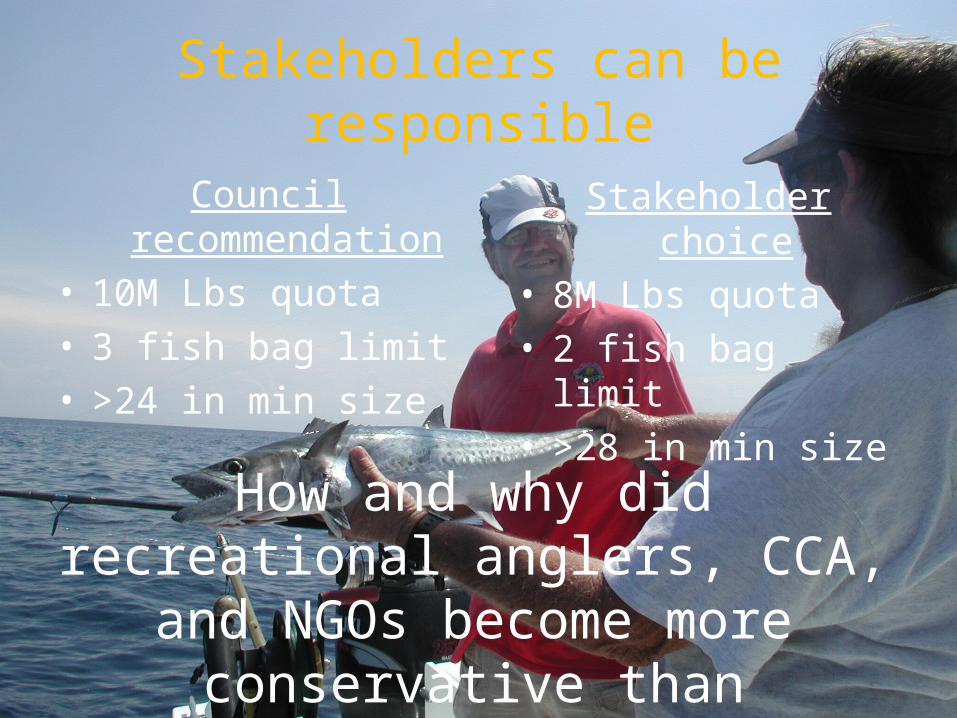
Stakeholders can be responsible
Council recommendation• 10M Lbs quota• 3 fish bag limit• >24 in min size
Stakeholder choice• 8M Lbs quota• 2 fish bag limit• >28 in min size
How and why did recreational anglers, CCA, and NGOs become
more conservative than managers?

5
Stakeholder-centered approach
Stakeholders propose objectives, options and performance
measures
Revise options and performance measuresModel development
and modification Stakeholders
Review
model results
Recommendations

6
Model Schematic
“Natural” Deaths
Reproduction
Growth & Maturity
Fishing
Migration

7
Model Structure• Abundance
• Mortality
• Catch
N = Abundance F = Inst. Fishing mort. RateM = Natural mort. Z = Total mort.p = migration ratey = year s = seasona = age x = sexo = area f = fishery
oxsayZoxay
osaoxtaty eNpN ,,,
,,,,,,,
f
foxasyxaoxasy FMZ ,,,,,,,,,,
oxasyoxasyfoxasy NFC ,,,,,,,,,,,,,

8
Parameter uncertainty
• Simulations drew from parameter distributions that reflected either– Scientific uncertainty– System uncertainty
• Recreational F – used 3 scenarios: either increasing, constant and decreasing scenarios with white noise variability (lognormal CV 10%)
• Ran multiple simulations to yield distributions of outcomes

9
Recommended optionsSSB F Season closure
8M, 2
Fis
h, 2
8in
8M, 2
Fis
h8M
, 32i
nSt
atus
Quo
8M, 2
Fis
h, 2
8in
8M, 2
Fis
h8M
, 32i
nSt
atus
Quo
8M, 2
Fis
h, 2
8in
8M, 2
Fis
h8M
, 32i
nSt
atus
Quo

Lesson 2
• Don’t under-estimate the ability of stakeholders to understand complicated management questions and processes.
• Stakeholder involvement is critical at all stages of management– Objectives– Management alternatives– Evaluation

EAM
Strategic advice: Management policies that support long term fishery and ecosystem sustainability

What kind of EAM do you want?
Lesson 3: Understanding of EAM by managers and stakeholders is at a infant’s level - education is critical

Case Study: Chesapeake Bay Fishery Ecosystem Plan
• Ecosystem boundaries– ~350 fishes described in Chesapeake Bay– Variation in life history causes boundary problems

FEP: Boundary issues
• Biological– 2 Large marine ecosystems
• Human– 11 states– 3 multi-jurisdictional commissions– 2 regional management councils– 2 nations

FEP: Simple strategic advice
• Patterns based on total removals• Empirical evidence
suggests ~250,000 mt may be sustainable
• 75,000 mt of non-menhaden harvest has been sustained

Ecosystem dynamics
• Used to examine ecosystem context of single species management decisions– What would happen if the region achieved a goal of a
10-fold increase in oyster biomass?• Concerns
• Fisheries model in a “microscopic” ecosystem• My species wasn’t included• Are we modeling the tail or the dog?
• Modeling effort was not integrated into management
• Maryland Sea Grant asked to facilitate an ecosystem based process for the Chesapeake Bay

Single-species ecosystem-based FMPs

Single-species ecosystem-based reference points
• Striped bass

Case study: Atlantic menhaden• Estuarine-dependent pelagic planktivore that provides
ecosystem-services – by filtering phytoplankton– important prey resource for charismatic piscivores
• Stock migrates along coast from Florida to Maine• Juveniles use estuarine nursery areas
• Stock assessment (2006) indicates neither stock is not overfished, nor experiencing overfishing.
• Yet concerns expressed over “localized” depletion in Chesapeake Bay

Localized depletion?
• A spatially-restricted decline in abundance that impairs ecological function– Predator production– Nutrient export
• Otolith chemistry evidence suggests spatial structure
150.00
200.00
250.00
300.00
350.00
400.00
Lower Mid Upper Upper 7 Upper 9
Li C
once
ntr
atio
n (ppb)
150.00
200.00
250.00
300.00
350.00
400.00
Lower Mid Upper Upper 7 Upper 9
Li C
once
ntr
atio
n (ppb)

Nutrient export services

MS-models
• Predator-prey model– Climate-driven recruitments are strongly negatively
correlated – Stochastic, correlated SR function
1,))((
,
10
21 t
NfMat
at NeNN t
10
21,
)(,1
at
Matt PeNP a
Pa

MS – models: effects of recruitment correlation on depletion

Biophysical EM
Luo et al.

Biophysical EM Sample output

Lesson 3
• Defining the question is essential– What is localized depletion?
• Models with different outputs can’t be compared– What are the common metrics
• Reference points for non fishery endpoints are needed

Case study: Regime shifts in the northwest Atlantic
• Dramatic shift from a groundfish-dominated community to an elasmobranch-dominated community
• Multiple explanatory hypotheses
0
20
40
60
80
100
120
140
160
1963
1966
1969
1972
1975
1978
1981
1984
1987
1990
1993
1996
Year
Bio
mas
s in
dex
Gadids Flatfish Skates Other Dogfish
0
1
2
3
4
5
6
7
8
1960 1964 1968 1972 1976 1980 1984 1988 1992Year
Lan
din
gs (
106 k
g)
0
20
40
60
80
100
120F
ish
ing
effo
rt (
103 d
)Groundfish & flounders Pelagic Elasmobranchs

Winter skate length frequencies
Frisk et al. 2008

Closed Ecosystem?
• Could broadscale movement of adult skate from Scotian Shelf be responsible

Ecosystem change on the Scotian Shelf
Figures from Frank, 2003

Lesson 4:
• Even the most successful EM may not forecast the future state of the ecosystem– CBO budget forecasts have all been wrong, but
that doesn’t mean that they haven’t been useful.
• Managing expectation is critical

Recommendations• Given a goal, what approaches are feasible or useful?
– There needs to be a clear statement of what question is the model being used to ask
– Not all ecosystem questions require an EM• What comes first – goal or stakeholders?
– The stakeholders you have in the room will affect the stated goal or vision
– Engage stakeholders early and often• Strategic advice may not be of the form of control rules, e.g.,
ecosystem services– How then do EM feed into the management process,
particularly ?