brianne powers february 21, 2003. financial snapshot of pepsico smip’s current position company...
Post on 21-Dec-2015
213 views
TRANSCRIPT
QuickTime™ and aGIF decompressor
are needed to see this picture.
Brianne PowersFebruary 21, 2003

• Financial Snapshot of PepsiCo• SMIP’s Current Position• Company Overview• Recent News• Stock Performance• Financial Statements• Ratio Comparison• Valuation• CAPM• RiskGrades Analysis
• Analyst Opinions
• Conclusions
QuickTime™ and aGIF decompressor
are needed to see this picture.Presentation Overview

QuickTime™ and aGIF decompressor
are needed to see this picture.Financial Snapshot
Ticker: PEP (NYSE)
Sector: Consumer Staples/Non-Cyclical
Industry: Beverages (Non-Alcoholic)
Market Cap.: $68.8 Billion
52 Week High: $53.50
52 Week Low: $34.00
Last Traded: $40.20 (as of 2/18/03)

QuickTime™ and aGIF decompressor
are needed to see this picture.SMIP’s Current Position
35 Shares of PEP
Purchased on December 2, 2002
Cost Basis: $1,470
Current Market Value: $1,407

QuickTime™ and aGIF decompressor
are needed to see this picture.Company Overview
PepsiCo, Inc. is a leading manufacturer, marketer, andseller of snack foods, soft drinks and concentrates, and branded juices. During the summer of 2001, the Companyacquired the Quaker Oats Company in an effort to grow andmature into the world’s premier convenient food and beverage provider.
Operates two business segments: Worldwide Snacks &Worldwide Beverages

QuickTime™ and aGIF decompressor
are needed to see this picture.Recent News
PepsiCo will no longer provide quarterly, annual guidance
PepsiCo net rises 21% on price increases
Riese Restaurants switches to Pepsi
Scuffle with rapper Ludacris over contract
War Over Obesity

QuickTime™ and aGIF decompressor
are needed to see this picture.Stock Performance (3-year)
QuickTime™ and aGIF decompressor
are needed to see this picture.

QuickTime™ and aGIF decompressor
are needed to see this picture.Stock Performance (1-year)
QuickTime™ and aGIF decompressor
are needed to see this picture.

QuickTime™ and aGIF decompressor
are needed to see this picture.Competitors

QuickTime™ and aGIF decompressor
are needed to see this picture.PEP vs. Competitors
QuickTime™ and aGIF decompressor
are needed to see this picture.

QuickTime™ and aGIF decompressor
are needed to see this picture.Financial Statements

QuickTime™ and aGIF decompressor
are needed to see this picture.Ratio Comparison
Valuation Ratios Company Industry Sector S&P 500P/E Ratio 21.51 23.98 20.50 21.93Beta 0.73 0.54 0.35 1.00Prices to Sales 2.84 3.83 2.41 2.80Price to Book 7.53 7.58 6.85 4.13
Dividends Company Industry Sector S&P 500Dividend Yield 1.51 1.66 2.54 2.31Payout Ratio 23.71 30.07 36.43 26.51
Financial Strength Company Industry Sector S&P 500Quick Ratio 0.31 0.50 0.53 1.15Current Ratio 1.06 1.02 1.17 1.67LT Debt to Equity 0.24 0.53 1.19 0.74Total Debt to Equity 0.30 0.70 1.48 0.96Interest Coverage 26.57 26.65 16.12 11.22
Profitability Ratios (%) Company Industry Sector S&P 500Operating Margin (TTM) 18.84 22.43 18.06 18.03Net Profit Margin (TTM) 13.19 15.83 11.28 10.88Asset Turnover (TTM) 1.09 0.92 1.14 0.95Inventory Turnover 9.95 8.07 7.24 11.01
Management Effectiveness (%)Company Industry Sector S&P 500ROA (TTM) 14.31 14.14 11.24 6.27ROI (TTM) 19.13 20.38 16.32 10.18
QuickTime™ and aGIF decompressor
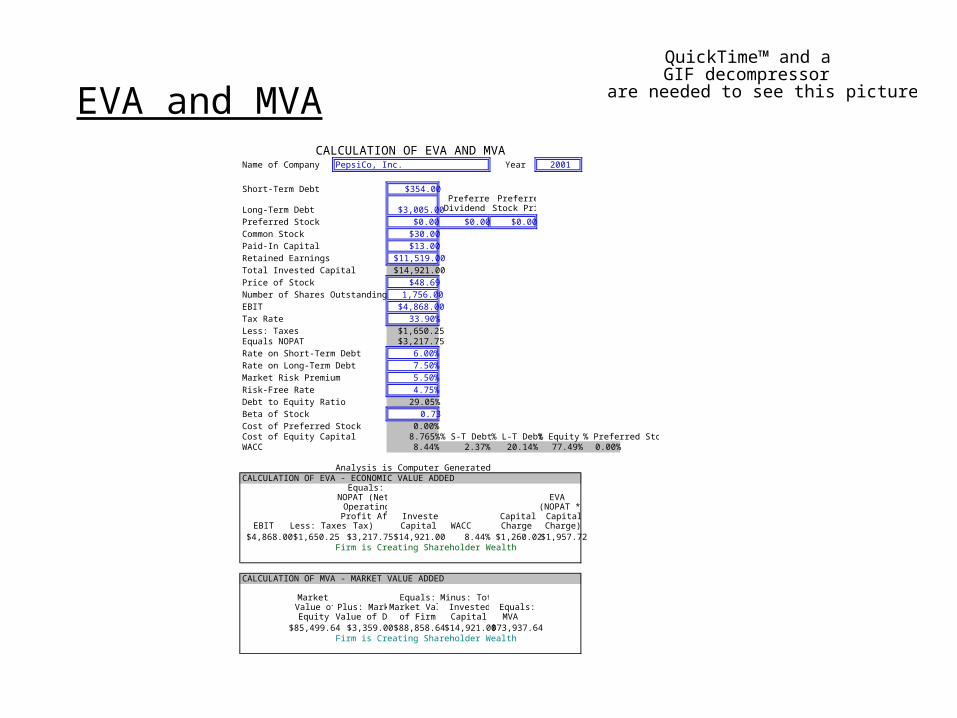
are needed to see this picture.EVA and MVACALCULATION OF EVA AND MVA
Name of Company PepsiCo, Inc. Year 2001
Short-Term Debt $354.00
Long-Term Debt $3,005.00Preferred
Dividend $Preferred
Stock Price
Preferred Stock $0.00 $0.00 $0.00
Common Stock $30.00
Paid-In Capital $13.00
Retained Earnings $11,519.00
Total Invested Capital $14,921.00
Price of Stock $48.69
Number of Shares Outstanding 1,756.00
EBIT $4,868.00
Tax Rate 33.90%
Less: Taxes $1,650.25Equals NOPAT $3,217.75
Rate on Short-Term Debt 6.00%
Rate on Long-Term Debt 7.50%
Market Risk Premium 5.50%
Risk-Free Rate 4.75%
Debt to Equity Ratio 29.05%
Beta of Stock 0.73
Cost of Preferred Stock 0.00%Cost of Equity Capital 8.765% % S-T Debt % L-T Debt % Equity % Preferred StockWACC 8.44% 2.37% 20.14% 77.49% 0.00%
Analysis is Computer GeneratedCALCULATION OF EVA - ECONOMIC VALUE ADDED
EBIT Less: Taxes
Equals: NOPAT (Net
Operating Profit After
Tax) Invested Capital WACC
Capital Charge
EVA (NOPAT *
Capital Charge)
$4,868.00 $1,650.25 $3,217.75 $14,921.00 8.44% $1,260.02 $1,957.72Firm is Creating Shareholder Wealth
CALCULATION OF MVA - MARKET VALUE ADDED
Market Value of Equity
Plus: Market Value of Debt
Equals: Market Value
of Firm
Minus: Total Invested Capital
Equals: MVA
$85,499.64 $3,359.00 $88,858.64 $14,921.00 $73,937.64Firm is Creating Shareholder Wealth

QuickTime™ and aGIF decompressor
are needed to see this picture.Basic Stock ValuationLAST YEAR 2002 YearNUMBER OF SHARES OUTSTANDING (Mil.) 1,756.00 Millions of SharesMARKET PRICE OF STOCK / SHARE $38.96 Dollars Per Share $47.00 Price of StockNET INCOME AFTER TAXES $3,313.00 Millions of Dollars Expected inTOTAL SALES OR REVENUES $25,112.00 Millions of Dollars 5 yearsBOOK VALUE OF EQUITY (FROM BALANCE SHEET) $9,298.00 Millions of DollarsRISK FREE RATE (T- Bill) 4.75% Annual Percentage RateDIVIDENDS PAID (TOTAL AMOUNT PAID) $1,041.00 Millions of DollarsSTOCK REPURCHASES (TOTAL AMOUNT PAID) $1,734.00 Millions of DollarsREQUIRED INFORMATION FOR CALCULATION OF REQUIRED RATE OF RETURNBETA OF STOCK 0.73MARKET RISK PREMIUM (5%-6% Historically) 5.50% Expected Market Risk Premium %REQUIRED INFORMATION FOR VARIABLE GROWTH RATE VALUATIONSEXPECTED GROWTH RATE (EARNINGS OR DIVIDENDS & STOCK REPURCHASES) 5.0000% 5.0000% 4.0000% 3.0000% 1.0000%
COMPUTER-GENERATED CALCULATIONS
EARNINGS PER SHARE $1.89LAST CASH DIVIDEND & STOCK REPURCHASE PAYMENT PER SHARE $1.58
EXPECTED ANNUAL GROWTH RATE (EARNINGS OR DIVIDENDS & STOCK REPURCHASES) 3.13% Geometric Mean of Annual Rates
EXPECTED EARNINGS PER SHARE IN 5 YEARS $1.92SUSTAINABLE RATE OF GROWTH 5.79% (ROE * (1-Payout Ratio))
REQUIRED RATE OF RETURN (k) 8.77% CAPMREQUIRED RATE OF RETURN (k) 7.31% Dividend Discount ModelREQUIRED RATE OF RETURN (k) 8.04% Average of CAPM and DDM
COMPUTER-GENERATED CALCULATIONS
STOCK VALUE - ZERO GROWTH MODEL $19.66 Not applicable for most stocksSTOCK VALUE - CONSTANT GROWTH MODEL $33.20STOCK VALUE - VARIABLE GROWTH MODEL $25.49STOCK VALUE - DIVIDEND & EARNINGS MODEL $38.82STOCK VALUE - PRICE / EARNINGS MODEL $37.55
AVERAGE PRICE EXCLUDING ZERO GROWTH $33.76
Must be positive values in each cell
All Data Required
Required Data

QuickTime™ and aGIF decompressor
are needed to see this picture.Free Cash Flow Model
Name of Company PepsiCo, Inc. Estimate Free Cash Flow Estimate Weighted Average Cost of CapitalCurrent Sales ($) $25,112.00 8.765% Cost of Equity Capital
Insert Initial Free Cash Flow (Computer) $5,454.55 Computer Calculates EBIT Margin (%) 19.39% 7.000% Before Tax Cost of DebtInsert Initial Growth Rate 5.00% See Note 1 EBIT $4,869.22 5.500% Market Risk Premium (RM-RF)Insert Terminal Growth Rate 1.00% See Note 2 Plus - Depreciation $1,112.00 11.700% Debt Ratio (Total Debt/Total Assets)Insert Weighted Average Cost of Capital 8.28% Computer Calculates Less - Capital Expenditures ($1,437.00) 0.730 BetaHow Many Years is Growth Projected 10 Years 0 Up to 20 Less - Net Change in Working Capital $313.00 4.750% Risk-free Rate (Use L-T Treasury Rate)Number of Shares of Common Stock 1,756.00 Equals Operating Cash Flow $7,105.22 8.281% = Weighted Average Cost of CapitalTax Rate 33.90% Less Taxes $1,650.66 See Note 3
Total Debt Outstanding $2,749.00 Equals Free Cash Flow $5,454.55
Year 0 1 2 3 4 5 6 7 8 9 10 11 12 13 14 15 16Free Cash
Flow$0 $5,727 $6,014 $6,314 $6,630 $6,962 $7,310 $7,675 $8,059 $8,462 $8,885 $0 $0 $0 $0 $0 $0
Terminal Value
$123,251 $0 $0 $0 $0 $0 $0
Total FCF $0 $5,727 $6,014 $6,314 $6,630 $6,962 $7,310 $7,675 $8,059 $8,462 $132,136 $0 $0 $0 $0 $0 $0Discounted
FCF $0 $5,289 $5,129 $4,974 $4,823 $4,677 $4,535 $4,398 $4,264 $4,135 $59,635 $0 $0 $0 $0 $0 $0
Net Present Value of FCF
$101,859
Net Present Value of FCF Minus Debt
$99,110
Per Share Value $56.44
Note: Terminal Growth Rate Must be less than WACC for projections of 1 or more years; for valuations based on 0 years of projections, WACC must be > Growth Rate
FREE CASH FLOW VALUATION MODEL

QuickTime™ and aGIF decompressor
are needed to see this picture.Intrinsic Value
Constant Growth Model $33.20Variable Growth Model $25.49Dividend and Earnings Model $38.82Price/Earnings Model $37.55Free Cash Flows $56.44Valuepro.net $33.66
Intrinsic Value $37.53

QuickTime™ and aGIF decompressor
are needed to see this picture.Capital Asset Pricing Model
K = Rf + (Rm * Beta)
Rf = 4.75
Rm = 5.5
Beta = .73
SO, K = 8.77%
This calculation shows that an 8.77% Return on Investment should be expected from an investment in PepsiCo, Inc.

QuickTime™ and aGIF decompressor
are needed to see this picture.RiskGrades Analysis
QuickTime™ and aGIF decompressor
are needed to see this picture.
QuickTime™ and aGIF decompressor
are needed to see this picture.
Less Risky than 71% of the market
Current RiskGrade: 147

QuickTime™ and aGIF decompressor
are needed to see this picture.Analyst Opinions
QuickTime™ and aPNG decompressor
are needed to see this picture.

QuickTime™ and aGIF decompressor
are needed to see this picture.Conclusions
Bad Press-Potential for Future Lawsuits
PEP does not fit with SMIP’s new Investment Theory
Less than Par Stock Performance (vs. Competitors)
Trading at Intrinsic Value

QuickTime™ and aGIF decompressor
are needed to see this picture.Recommendation
SELL 35 shares of PepsiCo, Inc.
QuickTime™ and aGIF decompressor
are needed to see this picture.