brian d. james jennie m. moton whitney g. colella for filling out a detailed h2a production case...
TRANSCRIPT

Guidance for Filling Out a Detailed H2A Production Case Study
9 July 2013
Brian D. James Jennie M. Moton Whitney G. Colella The H2A Production Model described in this presentation was
developed with support from the Fuel Cell Technologies Office (FCTO) within the Office of Energy Efficiency & Renewable Energy (EERE),
US Department of Energy.
2
Outline and Purpose
Explanation of H2A model capabilities, including comparing hydrogen (H2) generation technologies and charting progress. As part of a DOE contract, one may be requested to
prepare an H2A Case Study for a new H2 generation technology. This presentation • Reviews elements of the H2A Excel Model; • Gives examples of fully detailed Case Studies; • Identifies key numbers, common pitfalls & errors; • Clarifies the level of depth, accuracy & transparency needed
for a detailed analysis; and • Discusses metrics and common issues.
2
3
Overview of H2A
H2A is a discounted cash flow analysis that computes the required price of H2 for a desired after-tax internal rate of return (IRR) H2A uses custom macros within Microsoft Excel Latest analyses exist in H2A Version 3 • Developed in 2012 Two main types of H2A analyses: • production and delivery. Objective of H2A Analyses (production): • Establish a standard format for reporting the production
cost of H2, so as to compare technologies and case studies • Provide transparent analysis • Provide consistent approach
3
4
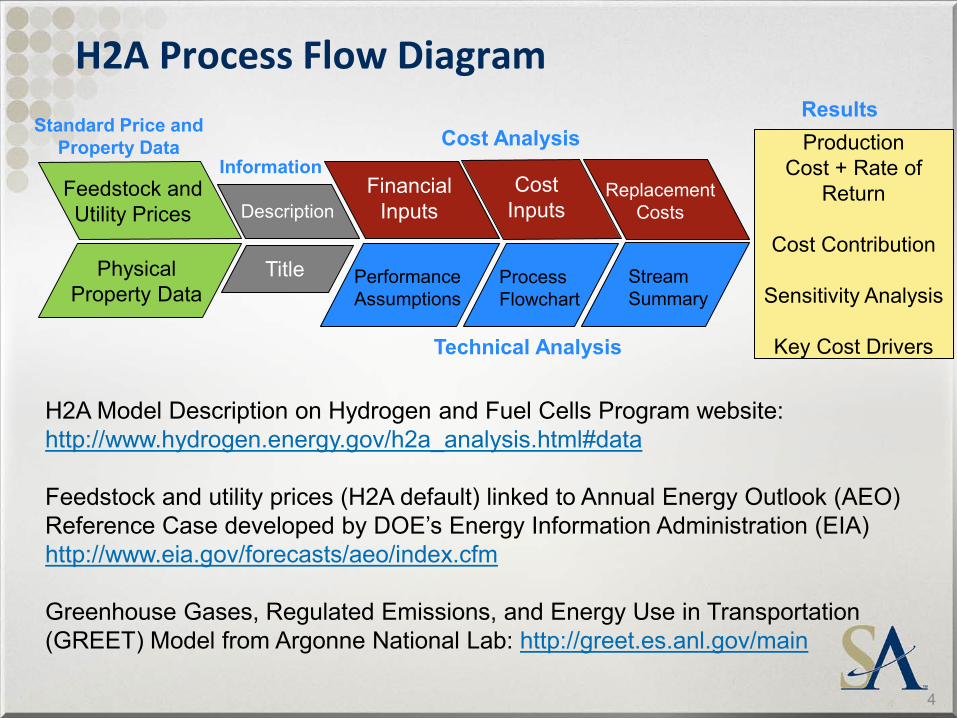
Feedstock and Utility Prices
Physical Property Data
Standard Price and Property Data
Information
H2A Process Flow Diagram
4
Production Cost + Rate of
Return
Cost Contribution
Sensitivity Analysis
Key Cost Drivers
Description
Title
Financial Inputs
Performance Assumptions
Cost Inputs
Process Flowchart
Replacement Costs
Stream Summary
H2A Model Description on Hydrogen and Fuel Cells Program website: http://www.hydrogen.energy.gov/h2a_analysis.html#data Feedstock and utility prices (H2A default) linked to Annual Energy Outlook (AEO) Reference Case developed by DOE’s Energy Information Administration (EIA) http://www.eia.gov/forecasts/aeo/index.cfm Greenhouse Gases, Regulated Emissions, and Energy Use in Transportation (GREET) Model from Argonne National Lab: http://greet.es.anl.gov/main
Cost Analysis Results
Technical Analysis
5
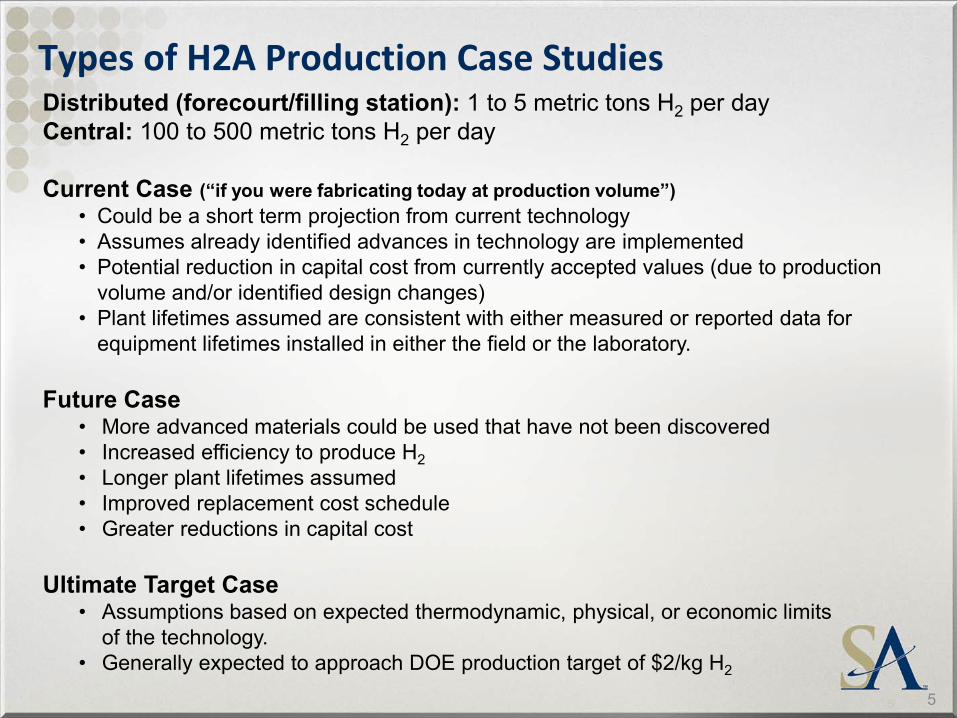
Types of H2A Production Case Studies Distributed (forecourt/filling station): 1 to 5 metric tons H2 per day Central: 100 to 500 metric tons H2 per day Current Case (“if you were fabricating today at production volume”)
• Could be a short term projection from current technology • Assumes already identified advances in technology are implemented • Potential reduction in capital cost from currently accepted values (due to production
volume and/or identified design changes) • Plant lifetimes assumed are consistent with either measured or reported data for
equipment lifetimes installed in either the field or the laboratory. Future Case
• More advanced materials could be used that have not been discovered • Increased efficiency to produce H2 • Longer plant lifetimes assumed • Improved replacement cost schedule • Greater reductions in capital cost
Ultimate Target Case
• Assumptions based on expected thermodynamic, physical, or economic limits of the technology.
• Generally expected to approach DOE production target of $2/kg H2 5
6
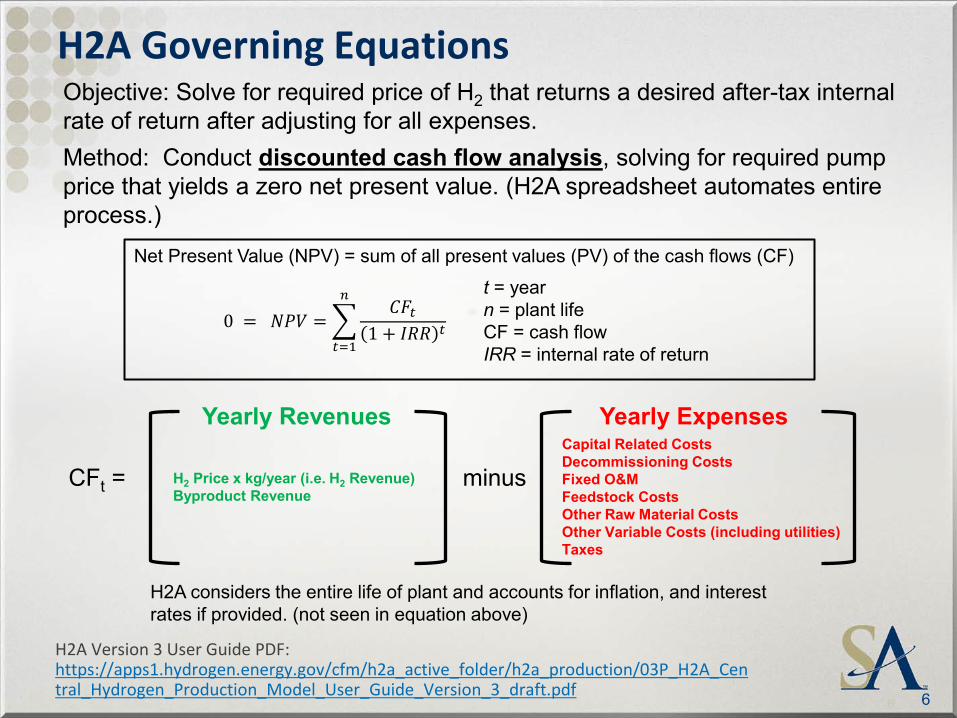
H2A Governing Equations
6
H2A Version 3 User Guide PDF: https://apps1.hydrogen.energy.gov/cfm/h2a_active_folder/h2a_production/03P_H2A_Central_Hydrogen_Production_Model_User_Guide_Version_3_draft.pdf
Net Present Value (NPV) = sum of all present values (PV) of the cash flows (CF)
0 = 𝑁𝑁𝑁 = �𝐶𝐶𝑡
1 + 𝐼𝐼𝐼 𝑡
𝑛
𝑡=1
t = year n = plant life CF = cash flow IRR = internal rate of return
H2A considers the entire life of plant and accounts for inflation, and interest rates if provided. (not seen in equation above)
Capital Related Costs Decommissioning Costs Fixed O&M Feedstock Costs Other Raw Material Costs Other Variable Costs (including utilities) Taxes
Objective: Solve for required price of H2 that returns a desired after-tax internal rate of return after adjusting for all expenses. Method: Conduct discounted cash flow analysis, solving for required pump price that yields a zero net present value. (H2A spreadsheet automates entire process.)
CFt = H2 Price x kg/year (i.e. H2 Revenue) Byproduct Revenue
minus
Yearly Revenues Yearly Expenses
7
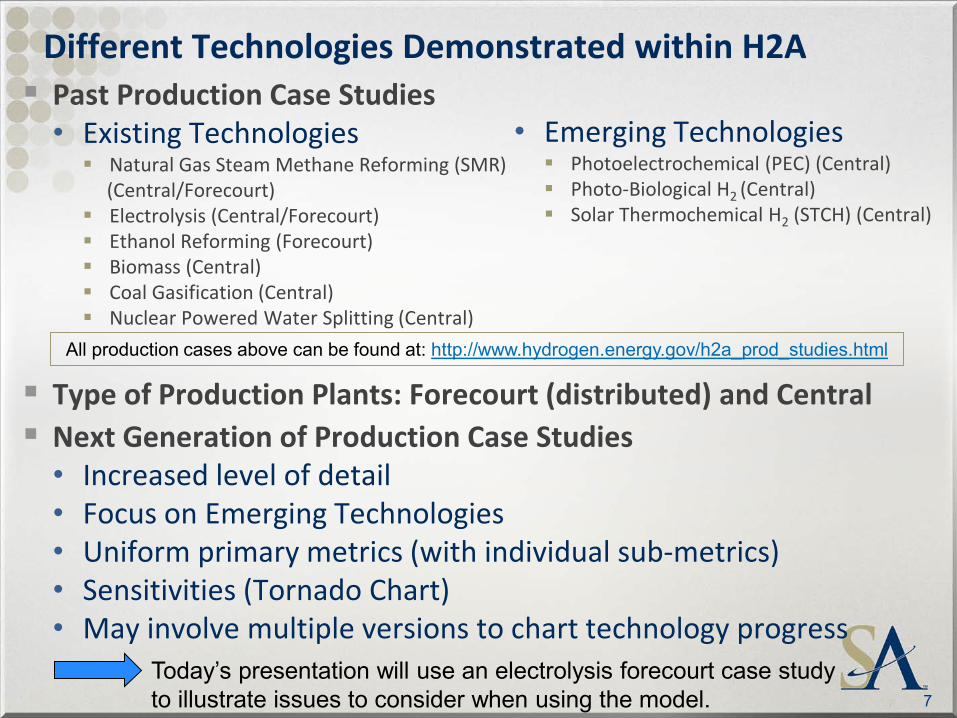
Past Production Case Studies • Existing Technologies Natural Gas Steam Methane Reforming (SMR) (Central/Forecourt) Electrolysis (Central/Forecourt) Ethanol Reforming (Forecourt) Biomass (Central) Coal Gasification (Central) Nuclear Powered Water Splitting (Central)
Type of Production Plants: Forecourt (distributed) and Central Next Generation of Production Case Studies • Increased level of detail • Focus on Emerging Technologies • Uniform primary metrics (with individual sub-metrics) • Sensitivities (Tornado Chart) • May involve multiple versions to chart technology progress
7
• Emerging Technologies Photoelectrochemical (PEC) (Central) Photo-Biological H2 (Central) Solar Thermochemical H2 (STCH) (Central)
Different Technologies Demonstrated within H2A
Today’s presentation will use an electrolysis forecourt case study to illustrate issues to consider when using the model.
All production cases above can be found at: http://www.hydrogen.energy.gov/h2a_prod_studies.html
8
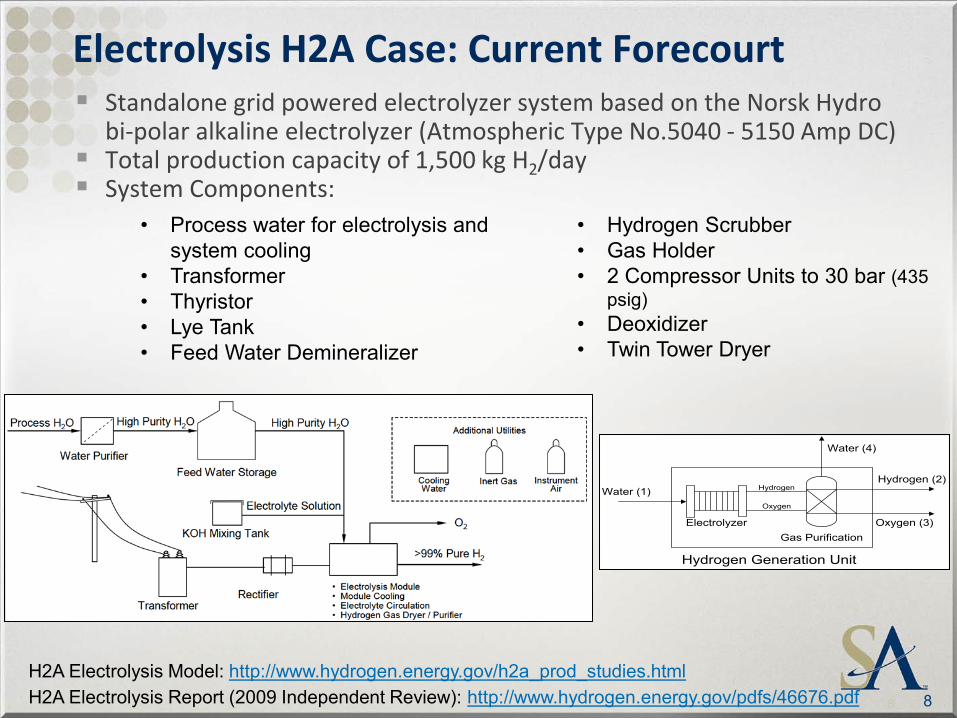
Electrolysis H2A Case: Current Forecourt Standalone grid powered electrolyzer system based on the Norsk Hydro
bi-polar alkaline electrolyzer (Atmospheric Type No.5040 - 5150 Amp DC) Total production capacity of 1,500 kg H2/day System Components:
8
• Process water for electrolysis and system cooling
• Transformer • Thyristor • Lye Tank • Feed Water Demineralizer
• Hydrogen Scrubber • Gas Holder • 2 Compressor Units to 30 bar (435
psig) • Deoxidizer • Twin Tower Dryer
Gas Purification
Water (4)
Electrolyzer
Hydrogen (2)
Oxygen (3)
Water (1)
Hydrogen Generation Unit
Hydrogen
Oxygen
H2A Electrolysis Model: http://www.hydrogen.energy.gov/h2a_prod_studies.html H2A Electrolysis Report (2009 Independent Review): http://www.hydrogen.energy.gov/pdfs/46676.pdf

9
Commonly Shared Features of H2A Across Technologies
9
(Using Electrolysis Current Forecourt as an Example)
10
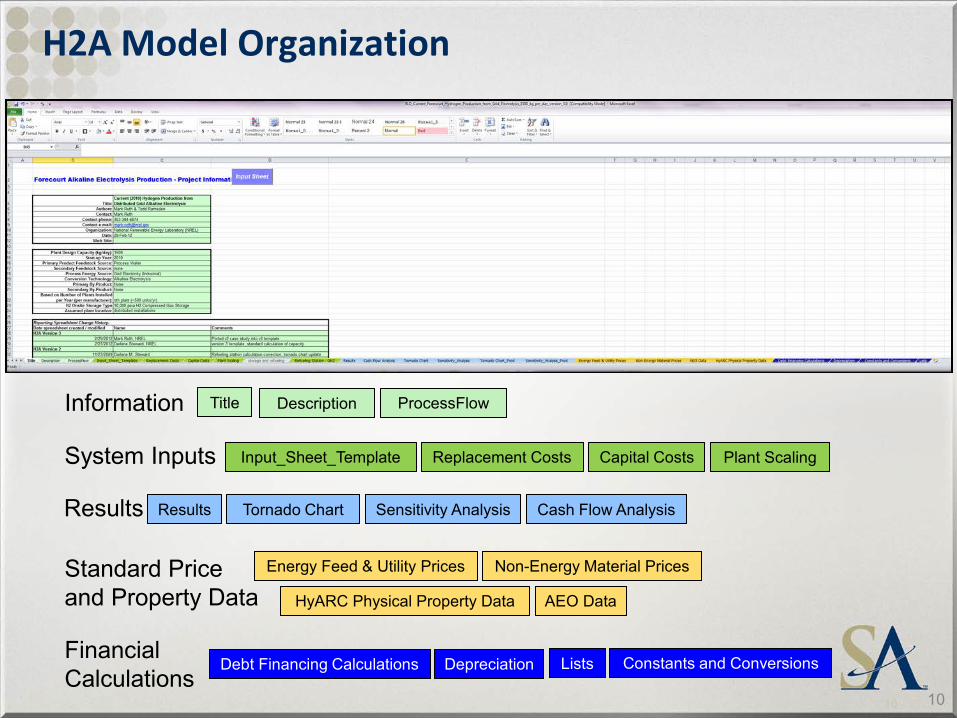
H2A Model Organization
10
Title Description ProcessFlow Information
Input_Sheet_Template Replacement Costs Capital Costs Plant Scaling System Inputs
Results Tornado Chart Sensitivity Analysis Cash Flow Analysis Results
Energy Feed & Utility Prices Non-Energy Material Prices
AEO Data HyARC Physical Property Data
Standard Price and Property Data
Debt Financing Calculations Depreciation Constants and Conversions Lists Financial Calculations
11
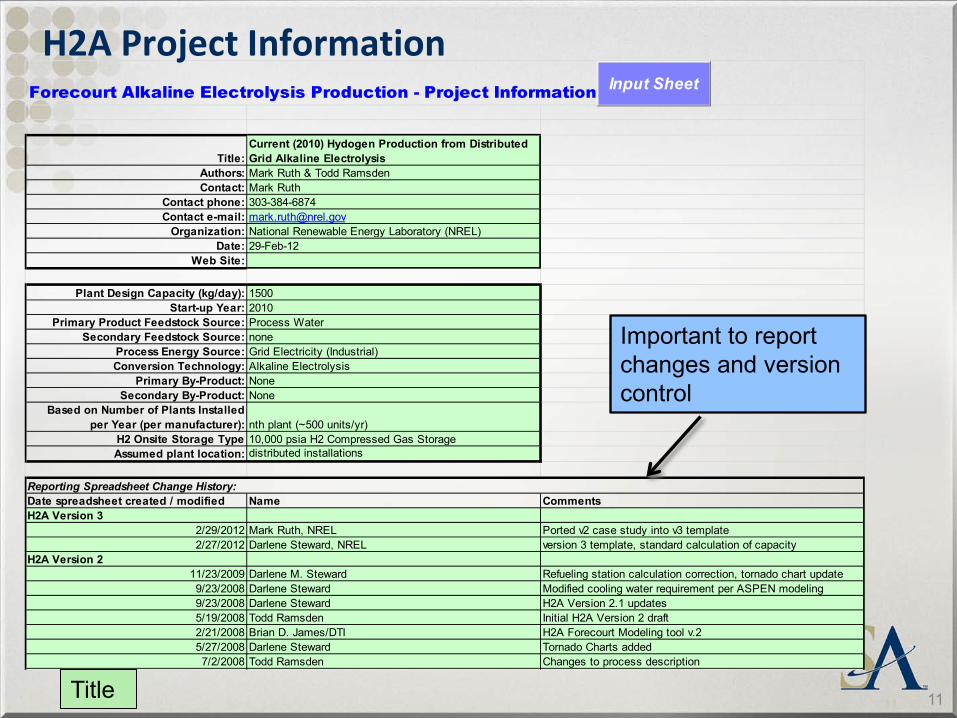
Forecourt Alkaline Electrolysis Production - Project Information
Title:Current (2010) Hydogen Production from Distributed Grid Alkaline Electrolysis
Authors: Mark Ruth & Todd RamsdenContact: Mark Ruth
Contact phone: 303-384-6874Contact e-mail: [email protected]
Organization: National Renewable Energy Laboratory (NREL)Date: 29-Feb-12
Web Site:
Plant Design Capacity (kg/day): 1500Start-up Year: 2010
Primary Product Feedstock Source: Process WaterSecondary Feedstock Source: none
Process Energy Source: Grid Electricity (Industrial)Conversion Technology: Alkaline Electrolysis
Primary By-Product: NoneSecondary By-Product: None
Based on Number of Plants Installed per Year (per manufacturer): nth plant (~500 units/yr)
H2 Onsite Storage Type 10,000 psia H2 Compressed Gas StorageAssumed plant location: distributed installations
Date spreadsheet created / modified Name CommentsH2A Version 3
2/29/2012 Mark Ruth, NREL Ported v2 case study into v3 template2/27/2012 Darlene Steward, NREL version 3 template, standard calculation of capacity
H2A Version 211/23/2009 Darlene M. Steward Refueling station calculation correction, tornado chart update9/23/2008 Darlene Steward Modified cooling water requirement per ASPEN modeling9/23/2008 Darlene Steward H2A Version 2.1 updates5/19/2008 Todd Ramsden Initial H2A Version 2 draft2/21/2008 Brian D. James/DTI H2A Forecourt Modeling tool v.25/27/2008 Darlene Steward Tornado Charts added7/2/2008 Todd Ramsden Changes to process description
Reporting Spreadsheet Change History:
Input Sheet
H2A Project Information
11
Important to report changes and version control
Title
12
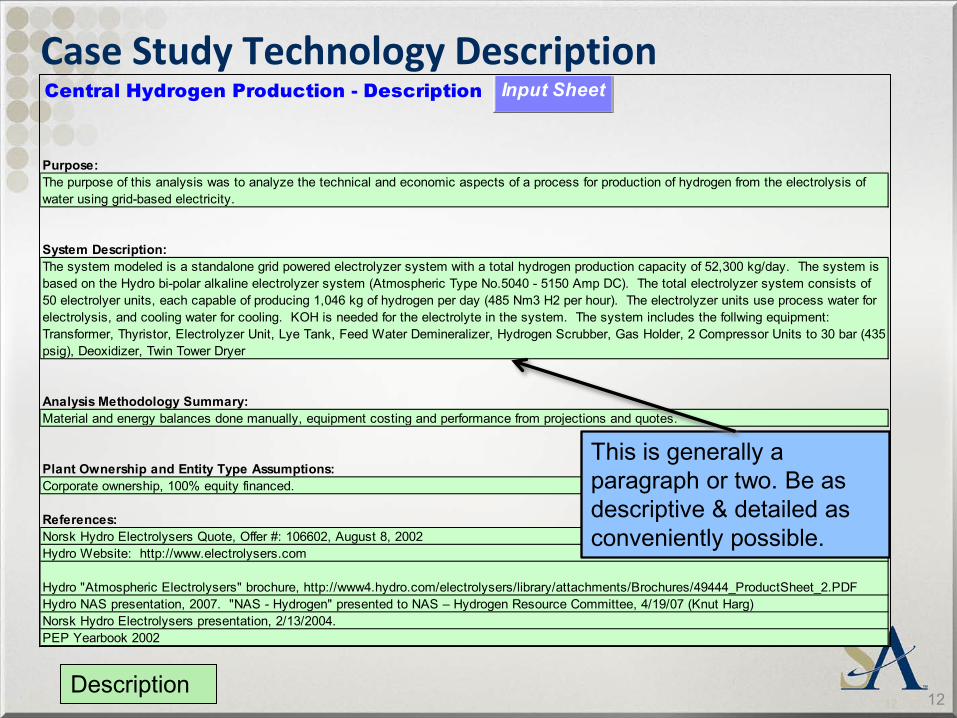
Central Hydrogen Production - Description
Purpose:The purpose of this analysis was to analyze the technical and economic aspects of a process for production of hydrogen from the electrolysis of water using grid-based electricity.
System Description:The system modeled is a standalone grid powered electrolyzer system with a total hydrogen production capacity of 52,300 kg/day. The system is based on the Hydro bi-polar alkaline electrolyzer system (Atmospheric Type No.5040 - 5150 Amp DC). The total electrolyzer system consists of 50 electrolyer units, each capable of producing 1,046 kg of hydrogen per day (485 Nm3 H2 per hour). The electrolyzer units use process water for electrolysis, and cooling water for cooling. KOH is needed for the electrolyte in the system. The system includes the follwing equipment: Transformer, Thyristor, Electrolyzer Unit, Lye Tank, Feed Water Demineralizer, Hydrogen Scrubber, Gas Holder, 2 Compressor Units to 30 bar (435 psig), Deoxidizer, Twin Tower Dryer
Analysis Methodology Summary:Material and energy balances done manually, equipment costing and performance from projections and quotes.
Plant Ownership and Entity Type Assumptions:Corporate ownership, 100% equity financed.
References:Norsk Hydro Electrolysers Quote, Offer #: 106602, August 8, 2002Hydro Website: http://www.electrolysers.com
Hydro "Atmospheric Electrolysers" brochure, http://www4.hydro.com/electrolysers/library/attachments/Brochures/49444_ProductSheet_2.PDFHydro NAS presentation, 2007. "NAS - Hydrogen" presented to NAS – Hydrogen Resource Committee, 4/19/07 (Knut Harg)Norsk Hydro Electrolysers presentation, 2/13/2004. PEP Yearbook 2002
Input SheetCase Study Technology Description
12
This is generally a paragraph or two. Be as descriptive & detailed as conveniently possible.
Description
13
System Schematic Concisely Informs Reader
13
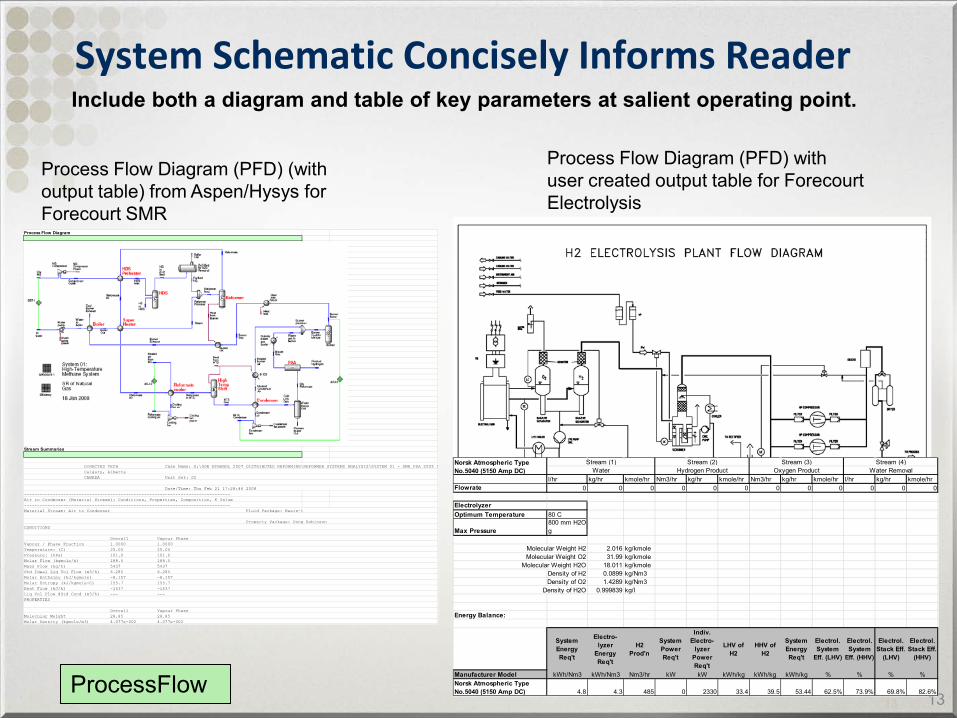
Process Flow Diagram
Stream Summaries
DIRECTED TECH Case Name: X:\DOE ETHANOL 2007 DISTRIBUTED REFORMING\REFORMER SYSTEMS ANALYSIS\SYSTEM 01 - SMR_PSA 2005 1 Calgary, Alberta CANADA Unit Set: SI Date/Time: Thu Feb 21 17:28:46 2008 -------------------------------------------------------------------------------Air to Condenser (Material Stream): Conditions, Properties, Composition, K Value-------------------------------------------------------------------------------Material Stream: Air to Condenser Fluid Package: Basis-1 Property Package: Peng Robinson CONDITIONS Overall Vapour Phase Vapour / Phase Fraction 1.0000 1.0000 Temperature: (C) 25.00 25.00 Pressure: (kPa) 101.0 101.0 Molar Flow (kgmole/h) 188.5 188.5 Mass Flow (kg/h) 5437 5437 Std Ideal Liq Vol Flow (m3/h) 6.285 6.285 Molar Enthalpy (kJ/kgmole) -8.157 -8.157 Molar Entropy (kJ/kgmole-C) 155.7 155.7 Heat Flow (kJ/h) -1537 -1537 Liq Vol Flow @Std Cond (m3/h) --- --- PROPERTIES Overall Vapour Phase Molecular Weight 28.85 28.85 Molar Density (kgmole/m3) 4.077e-002 4.077e-002
Process Flow Diagram (PFD) (with output table) from Aspen/Hysys for Forecourt SMR
l/hr kg/hr kmole/hr Nm3/hr kg/hr kmole/hr Nm3/hr kg/hr kmole/hr l/hr kg/hr kmole/hrFlowrate 0 0 0 0 0 0 0 0 0 0 0 0
Electrolyzer Optimum Temperature 80 C
Max Pressure800 mm H2O g
Molecular Weight H2 2.016 kg/kmoleMolecular Weight O2 31.99 kg/kmole
Molecular Weight H2O 18.011 kg/kmoleDensity of H2 0.0899 kg/Nm3Density of O2 1.4289 kg/Nm3
Density of H2O 0.999839 kg/l
Energy Balance:
System Energy Req't
Electro-lyzer
Energy Req't
H2 Prod'n
System Power Req't
Indiv. Electro-
lyzer Power Req't
LHV of H2
HHV of H2
System Energy Req't
Electrol. System
Eff. (LHV)
Electrol. System
Eff. (HHV)
Electrol. Stack Eff.
(LHV)
Electrol. Stack Eff.
(HHV)
Manufacturer Model kWh/Nm3 kWh/Nm3 Nm3/hr kW kW kWh/kg kWh/kg kWh/kg % % % %Norsk Atmospheric Type No.5040 (5150 Amp DC) 4.8 4.3 485 0 2330 33.4 39.5 53.44 62.5% 73.9% 69.8% 82.6%
Stream (3) Stream (4)Water Hydrogen Product Oxygen Product Water Removal
Norsk Atmospheric Type No.5040 (5150 Amp DC)
Stream (1) Stream (2)
Process Flow Diagram (PFD) with user created output table for Forecourt Electrolysis
Include both a diagram and table of key parameters at salient operating point.
ProcessFlow
14
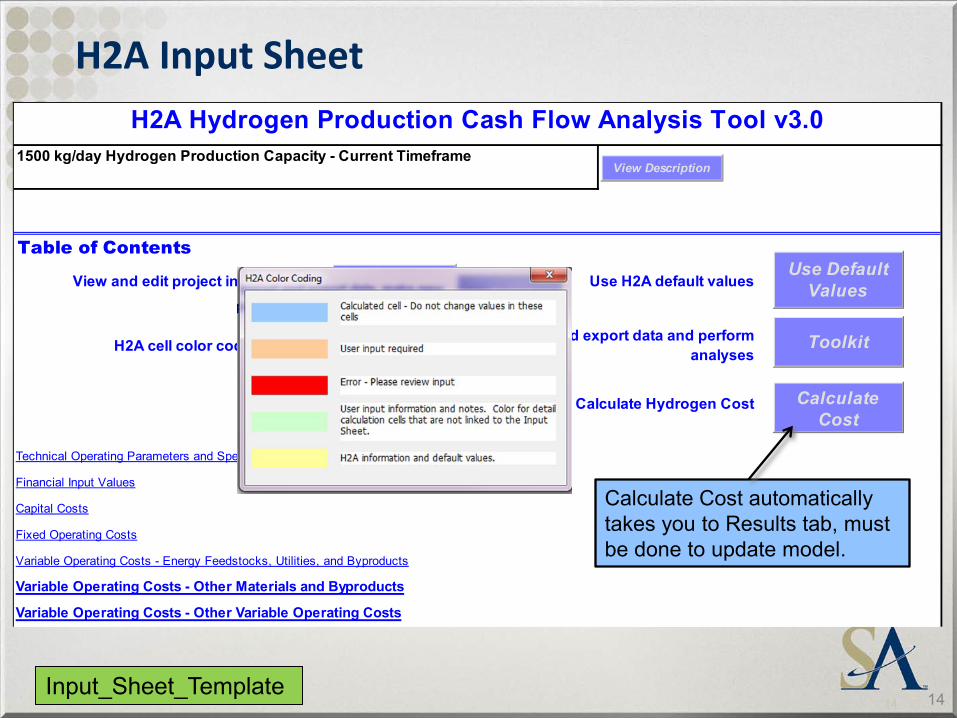
Table of Contents
View and edit project information
H2A cell color coding
Technical Operating Parameters and Specifications
Financial Input Values
Capital Costs
Fixed Operating Costs
Use H2A default values
Import and export data and perform analyses
Calculate Hydrogen Cost
H2A Hydrogen Production Cash Flow Analysis Tool v3.01500 kg/day Hydrogen Production Capacity - Current Timeframe
Variable Operating Costs - Other Variable Operating Costs
Variable Operating Costs - Energy Feedstocks, Utilities, and Byproducts
Variable Operating Costs - Other Materials and Byproducts
Toolkit
Calculate Cost
View Description
Key
Project Info Use Default Values
H2A Input Sheet
14 Input_Sheet_Template
Calculate Cost automatically takes you to Results tab, must be done to update model.
15
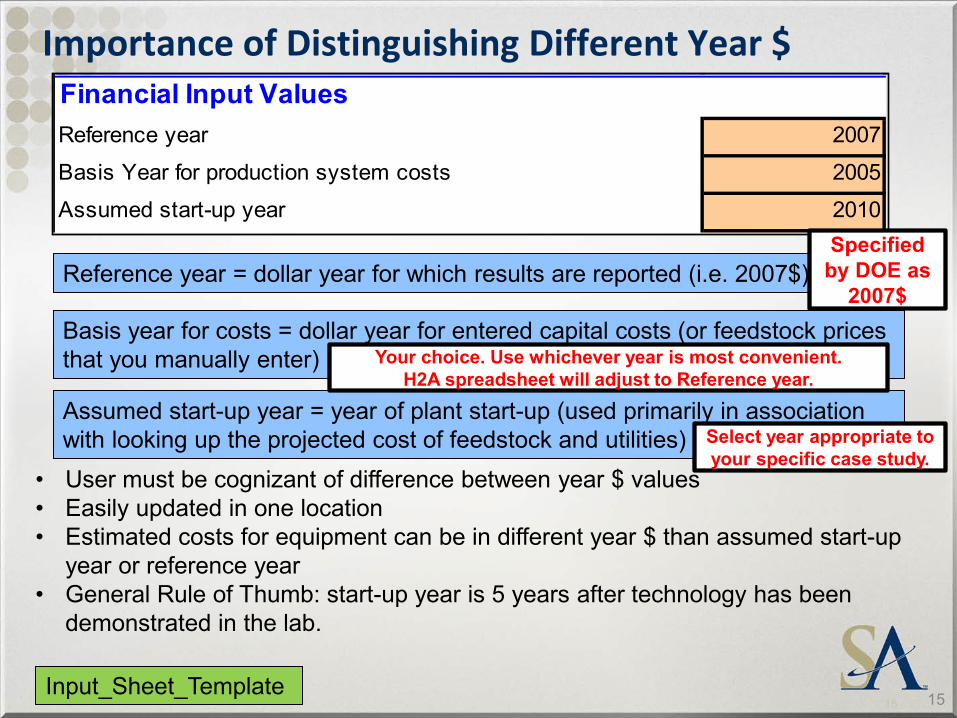
Importance of Distinguishing Different Year $
• User must be cognizant of difference between year $ values • Easily updated in one location • Estimated costs for equipment can be in different year $ than assumed start-up
year or reference year • General Rule of Thumb: start-up year is 5 years after technology has been
demonstrated in the lab.
15
Reference year = dollar year for which results are reported (i.e. 2007$)
Assumed start-up year = year of plant start-up (used primarily in association with looking up the projected cost of feedstock and utilities)
Basis year for costs = dollar year for entered capital costs (or feedstock prices that you manually enter)
Input_Sheet_Template
Financial Input ValuesReference year 2007
Basis Year for production system costs 2005
Assumed start-up year 2010Specified
by DOE as 2007$
Your choice. Use whichever year is most convenient. H2A spreadsheet will adjust to Reference year.
Select year appropriate to your specific case study.
16
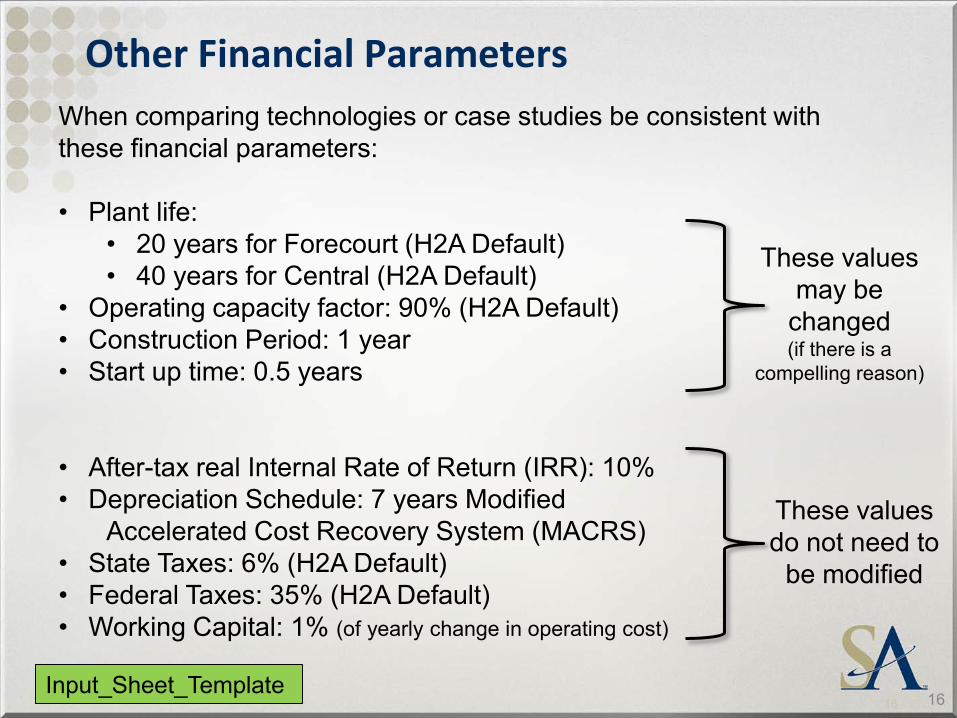
Other Financial Parameters When comparing technologies or case studies be consistent with these financial parameters: • Plant life:
• 20 years for Forecourt (H2A Default) • 40 years for Central (H2A Default)
• Operating capacity factor: 90% (H2A Default) • Construction Period: 1 year • Start up time: 0.5 years
• After-tax real Internal Rate of Return (IRR): 10% • Depreciation Schedule: 7 years Modified
Accelerated Cost Recovery System (MACRS) • State Taxes: 6% (H2A Default) • Federal Taxes: 35% (H2A Default) • Working Capital: 1% (of yearly change in operating cost)
16
These values do not need to
be modified
Input_Sheet_Template
These values may be
changed (if there is a
compelling reason)
17
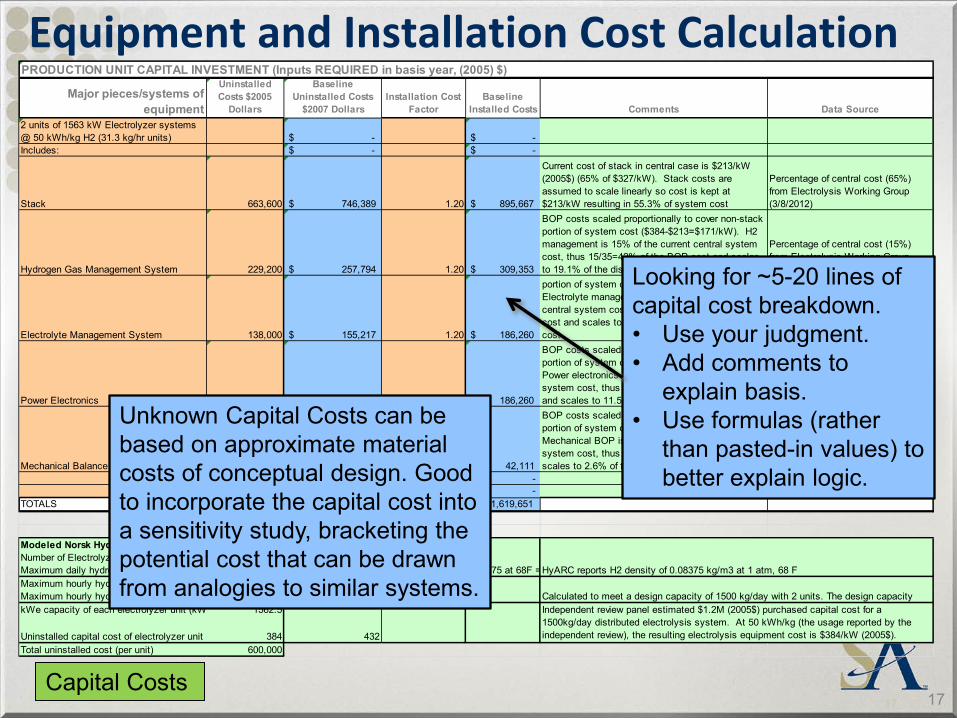
PRODUCTION UNIT CAPITAL INVESTMENT (Inputs REQUIRED in basis year, (2005) $)
Major pieces/systems of equipment
Uninstalled Costs $2005
Dollars
Baseline Uninstalled Costs
$2007 DollarsInstallation Cost
FactorBaseline
Installed Costs Comments Data Source2 units of 1563 kW Electrolyzer systems @ 50 kWh/kg H2 (31.3 kg/hr units) $ - $ - Includes: $ - $ -
Stack 663,600 $ 746,389 1.20 $ 895,667
Current cost of stack in central case is $213/kW (2005$) (65% of $327/kW). Stack costs are assumed to scale linearly so cost is kept at $213/kW resulting in 55.3% of system cost
Percentage of central cost (65%) from Electrolysis Working Group (3/8/2012)
Hydrogen Gas Management System 229,200 $ 257,794 1.20 $ 309,353
BOP costs scaled proportionally to cover non-stack portion of system cost ($384-$213=$171/kW). H2 management is 15% of the current central system cost, thus 15/35=42% of the BOP cost and scales to 19.1% of the distributed system cost
Percentage of central cost (15%) from Electrolysis Working Group (3/8/2012)
Electrolyte Management System 138,000 $ 155,217 1.20 $ 186,260
p p y portion of system cost ($384-$213=$171/kW). Electrolyte management is 9% of the current central system cost, thus 9/35=25.7% of the BOP cost and scales to 11.5% of the distributed system cost
Percentage of central cost (9%) from Electrolysis Working Group (3/8/2012)
Power Electronics 138,000 $ 155,217 1.20 $ 186,260
BOP costs scaled proportionally to cover non-stack portion of system cost ($384-$213=$171/kW). Power electronics is 9% of the current central system cost, thus 9/35=25.7% of the BOP cost and scales to 11.5% of the distributed system cost
Percentage of central cost (9%) from Electrolysis Working Group (3/8/2012)
Mechanical Balance of Plant 31,200 $ 35,092 1.20 $ 42,111
BOP costs scaled proportionally to cover non-stack portion of system cost ($384-$213=$171/kW). Mechanical BOP is 2% of the current central system cost, thus 2/35=5.7% of the BOP cost and scales to 2.6% of the distributed system cost
Percentage of central cost (2%) from Electrolysis Working Group (3/8/2012)
$ - $ - $ - $ -
TOTALS $ 1,200,000 $ 1,349,709 $ 1,619,651
Modeled Norsk Hydro SystemNumber of Electrolyzer units in the plant 2.0Maximum daily hydrogen output per electro 750 750 0.08375 at 68F = HyARC reports H2 density of 0.08375 kg/m3 at 1 atm, 68 FMaximum hourly hydrogen output per electr 347.6Maximum hourly hydrogen output per electr 31.3 31.25 Calculated to meet a design capacity of 1500 kg/day with 2 units. The design capacity kWe capacity of each electrolyzer unit (kW 1562.5
Uninstalled capital cost of electrolyzer unit 384 432Total uninstalled cost (per unit) 600,000
Independent review panel estimated $1.2M (2005$) purchased capital cost for a 1500kg/day distributed electrolysis system. At 50 kWh/kg (the usage reported by the independent review), the resulting electrolysis equipment cost is $384/kW (2005$).
Equipment and Installation Cost Calculation
17
Looking for ~5-20 lines of capital cost breakdown. • Use your judgment. • Add comments to
explain basis. • Use formulas (rather
than pasted-in values) to better explain logic.
Capital Costs
Unknown Capital Costs can be based on approximate material costs of conceptual design. Good to incorporate the capital cost into a sensitivity study, bracketing the potential cost that can be drawn from analogies to similar systems.
18
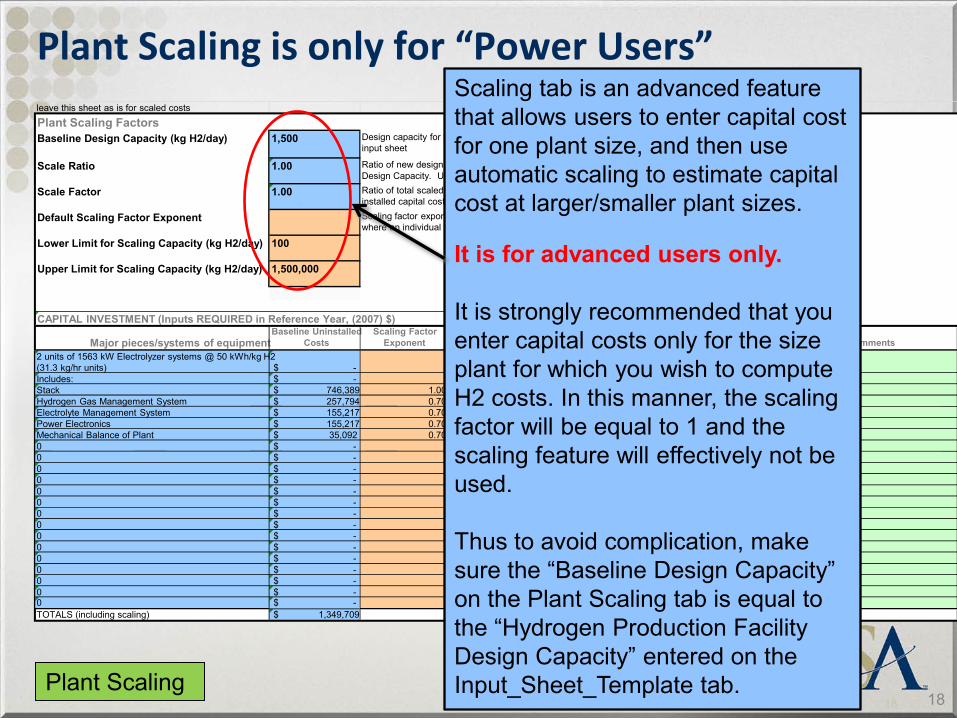
leave this sheet as is for scaled costs
Plant Scaling Factors Baseline Design Capacity (kg H2/day) 1,500
Scale Ratio 1.00
Scale Factor 1.00
Default Scaling Factor Exponent
Lower Limit for Scaling Capacity (kg H2/day) 100
Upper Limit for Scaling Capacity (kg H2/day) 1,500,000
CAPITAL INVESTMENT (Inputs REQUIRED in Reference Year, (2007) $)
Major pieces/systems of equipment Baseline Uninstalled
Costs Scaling Factor
Exponent Scaled Uninstalled
Costs Installation Cost
Factor Installed Cost
(scaled) Installed Cost
(baseline) Comments 2 units of 1563 kW Electrolyzer systems @ 50 kWh/kg H2 (31.3 kg/hr units) $ - $ - 0.00 $ - $ - Includes: $ - $ - 0.00 $ - $ - Stack $ 746,389 1.00 $ 746,389 1.20 $ 895,667 $ 895,667 Hydrogen Gas Management System $ 257,794 0.70 $ 257,794 1.20 $ 309,353 $ 309,353 Electrolyte Management System $ 155,217 0.70 $ 155,217 1.20 $ 186,260 $ 186,260 Power Electronics $ 155,217 0.70 $ 155,217 1.20 $ 186,260 $ 186,260 Mechanical Balance of Plant $ 35,092 0.70 $ 35,092 1.20 $ 42,111 $ 42,111 0 $ - $ - 0.00 $ - $ - 0 $ - $ - 0.00 $ - $ - 0 $ - $ - 0.00 $ - $ - 0 $ - $ - 0.00 $ - $ - 0 $ - $ - 0.00 $ - $ - 0 $ - $ - 0.00 $ - $ - 0 $ - $ - 0.00 $ - $ - 0 $ - $ - 0.00 $ - $ - 0 $ - $ - 0.00 $ - $ - 0 $ - $ - 0.00 $ - $ - 0 $ - $ - 0.00 $ - $ - 0 $ - $ - 0.00 $ - $ - 0 $ - $ - 0.00 $ - $ - 0 $ - $ - 0.00 $ - $ - 0 $ - $ - 0.00 $ - $ - TOTALS (including scaling) $ 1,349,709 $ 1,349,709 $ 1,619,651 1,619,651
Design capacity for original H2A case. Imported from capital cost input sheet
Ratio of total scaled installed capital capital cost to total baseline installed capital costs. Used for exponential scaling. Scaling factor exponent used for scaling all capital equipment where an individual factor has not been entered below.
Ratio of new design capacity (enter on Input Sheet) to the Baseline Design Capacity. Used for linear scaling Input Sheet
Plant Scaling is only for “Power Users”
18 Plant Scaling
Scaling tab is an advanced feature that allows users to enter capital cost for one plant size, and then use automatic scaling to estimate capital cost at larger/smaller plant sizes. It is for advanced users only. It is strongly recommended that you enter capital costs only for the size plant for which you wish to compute H2 costs. In this manner, the scaling factor will be equal to 1 and the scaling feature will effectively not be used. Thus to avoid complication, make sure the “Baseline Design Capacity” on the Plant Scaling tab is equal to the “Hydrogen Production Facility Design Capacity” entered on the Input_Sheet_Template tab.
19
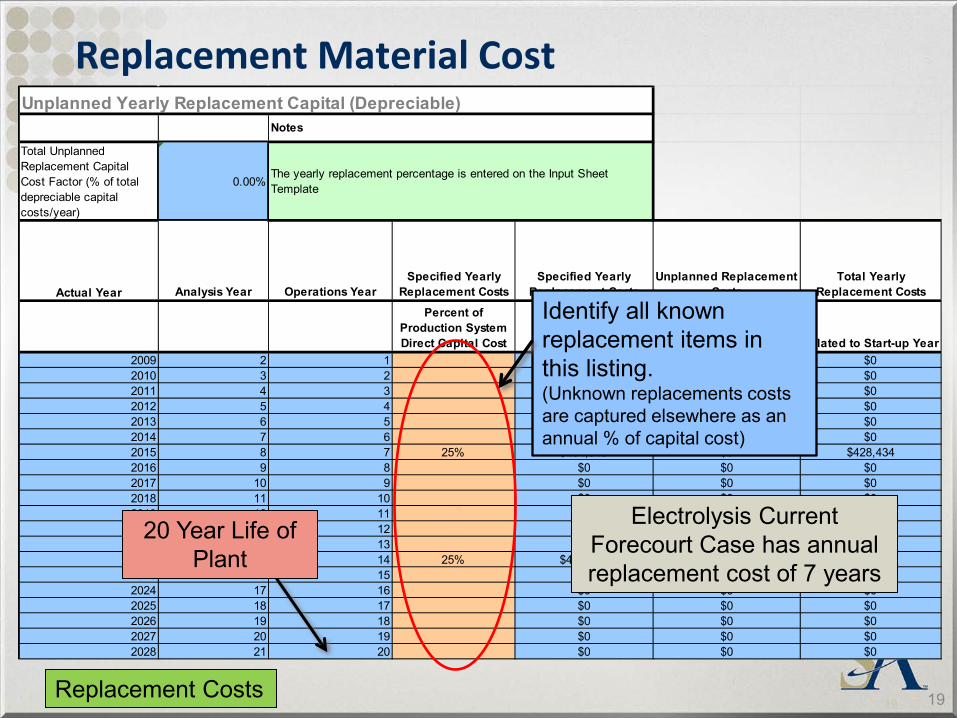
Unplanned Yearly Replacement Capital (Depreciable)
Total Unplanned Replacement Capital Cost Factor (% of total depreciable capital costs/year)
0.00%
Actual Year Analysis Year Operations YearSpecified Yearly
Replacement CostsSpecified Yearly
Replacement CostsUnplanned Replacement
CostsTotal Yearly
Replacement Costs
Percent of Production System Direct Capital Cost Year 2007 $ Year 2007 $ Inflated to Start-up Year
2009 2 1 $0 $0 $02010 3 2 $0 $0 $02011 4 3 $0 $0 $02012 5 4 $0 $0 $02013 6 5 $0 $0 $02014 7 6 $0 $0 $02015 8 7 25% $404,913 $0 $428,4342016 9 8 $0 $0 $02017 10 9 $0 $0 $02018 11 10 $0 $0 $02019 12 11 $0 $0 $02020 13 12 $0 $0 $02021 14 13 $0 $0 $02022 15 14 25% $404,913 $0 $428,4342023 16 15 $0 $0 $02024 17 16 $0 $0 $02025 18 17 $0 $0 $02026 19 18 $0 $0 $02027 20 19 $0 $0 $02028 21 20 $0 $0 $0
Notes
The yearly replacement percentage is entered on the Input Sheet Template
Replacement Material Cost
19 Replacement Costs
20 Year Life of Plant
Electrolysis Current Forecourt Case has annual replacement cost of 7 years
Identify all known replacement items in this listing. (Unknown replacements costs are captured elsewhere as an annual % of capital cost)
20
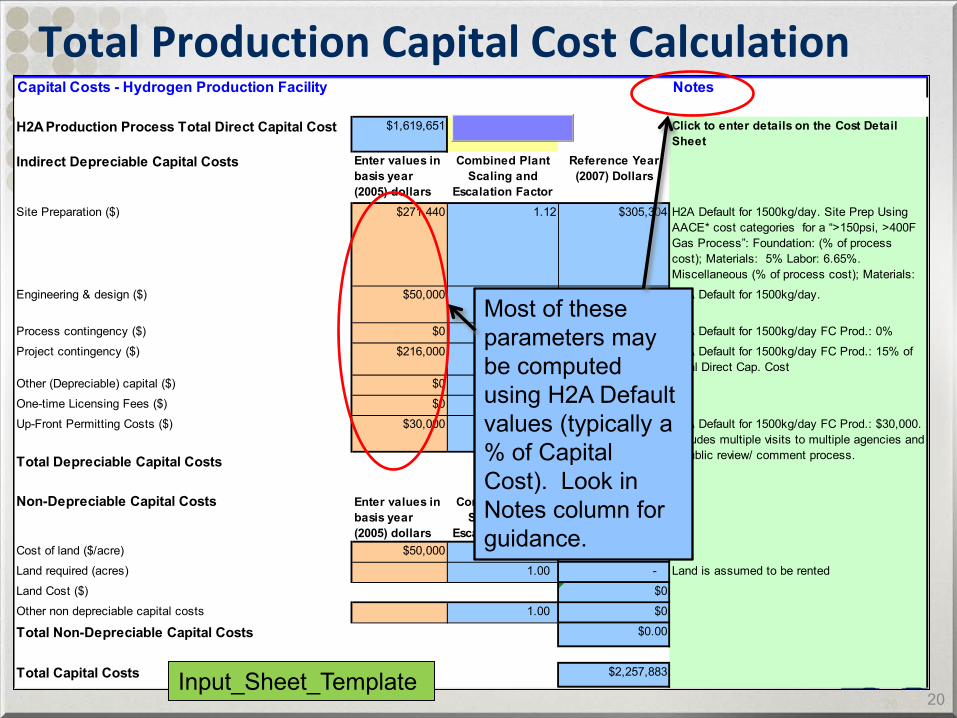
Capital Costs - Hydrogen Production Facility
H2A Production Process Total Direct Capital Cost $1,619,651
Indirect Depreciable Capital Costs Enter values in basis year (2005) dollars
Combined Plant Scaling and
Escalation Factor
Reference Year (2007) Dollars
Site Preparation ($) $271,440 1.12 $305,304
Engineering & design ($) $50,000 1.12 $56,238
Process contingency ($) $0 1.12 $0
Project contingency ($) $216,000 1.12 $242,948
Other (Depreciable) capital ($) $0 1.12 $0
One-time Licensing Fees ($) $0 1.12 $0
Up-Front Permitting Costs ($) $30,000 1.12 $33,743
Total Depreciable Capital Costs $2,257,883
Non-Depreciable Capital Costs Enter values in basis year (2005) dollars
Combined Plant Scaling and
Escalation FactorReference Year (2007) Dollars
Cost of land ($/acre) $50,000 0.96 $47,804.23
Land required (acres) 1.00 -
Land Cost ($) $0
Other non depreciable capital costs 1.00 $0
Total Non-Depreciable Capital Costs $0.00
Total Capital Costs $2,257,883
H2A Default for 1500kg/day. Site Prep Using AACE* cost categories for a “>150psi, >400F Gas Process”: Foundation: (% of process cost); Materials: 5% Labor: 6.65%. Miscellaneous (% of process cost); Materials: 4% L b 3 2%
Land is assumed to be rented
H2A Default for 1500kg/day.
Click to enter details on the Cost Detail Sheet
Notes
H2A Default for 1500kg/day FC Prod.: 0%
H2A Default for 1500kg/day FC Prod.: 15% of Total Direct Cap. Cost
H2A Default for 1500kg/day FC Prod.: $30,000. Includes multiple visits to multiple agencies and a public review/ comment process.
Total Production Capital Cost Calculation
20 Input_Sheet_Template
Most of these parameters may be computed using H2A Default values (typically a % of Capital Cost). Look in Notes column for guidance.
21
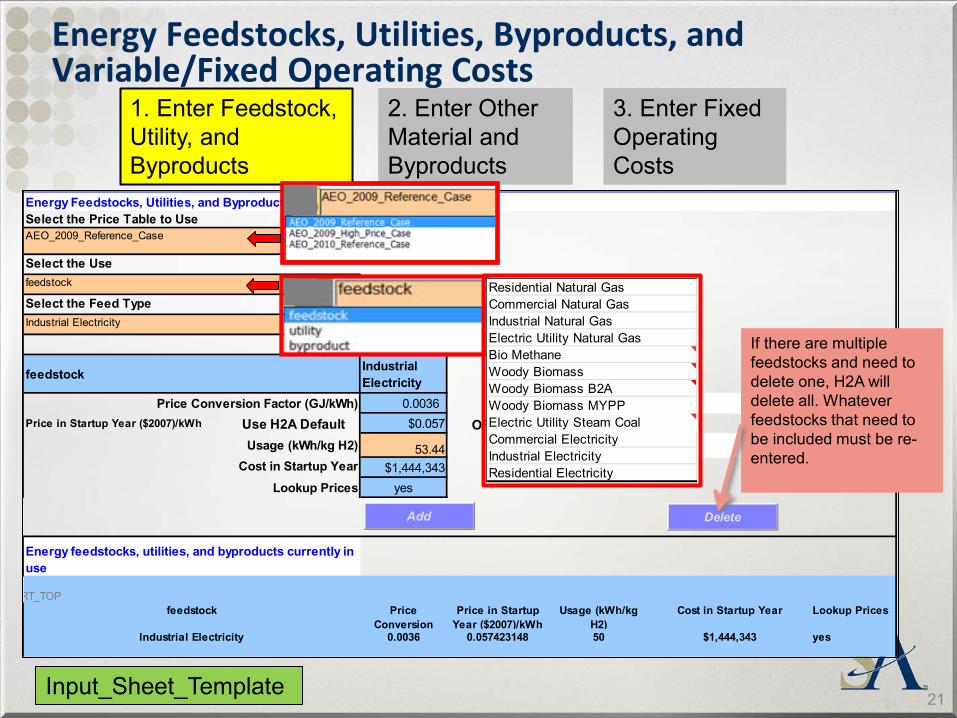
Energy Feedstocks, Utilities, and ByproductsSelect the Price Table to UseAEO_2009_Reference_Case
Select the Usefeedstock Enter usage kWhSelect the Feed TypeIndustrial Electricity
feedstock Industrial Electricity
Price Conversion Factor (GJ/kWh) 0.0036 Price in Startup Year ($2007)/kWh $0.057
Usage (kWh/kg H2) 53.44Cost in Startup Year $1,444,343
Lookup Prices yes
Energy feedstocks, utilities, and byproducts currently in use
RT_TOPfeedstock Price
Conversion Price in Startup
Year ($2007)/kWhUsage (kWh/kg
H2)Cost in Startup Year Lookup Prices
Industrial Electricity 0.0036 0.057423148 50 $1,444,343 yes
Add
Enter PriceOR
Delete
Use H2A Default
Energy Feedstocks, Utilities, Byproducts, and Variable/Fixed Operating Costs
21
1. Enter Feedstock, Utility, and Byproducts
2. Enter Other Material and Byproducts
3. Enter Fixed Operating Costs
Input_Sheet_Template
Residential Natural GasCommercial Natural GasIndustrial Natural GasElectric Utility Natural GasBio MethaneWoody BiomassWoody Biomass B2AWoody Biomass MYPPElectric Utility Steam CoalCommercial ElectricityIndustrial ElectricityResidential Electricity
If there are multiple feedstocks and need to delete one, H2A will delete all. Whatever feedstocks that need to be included must be re-entered.
22
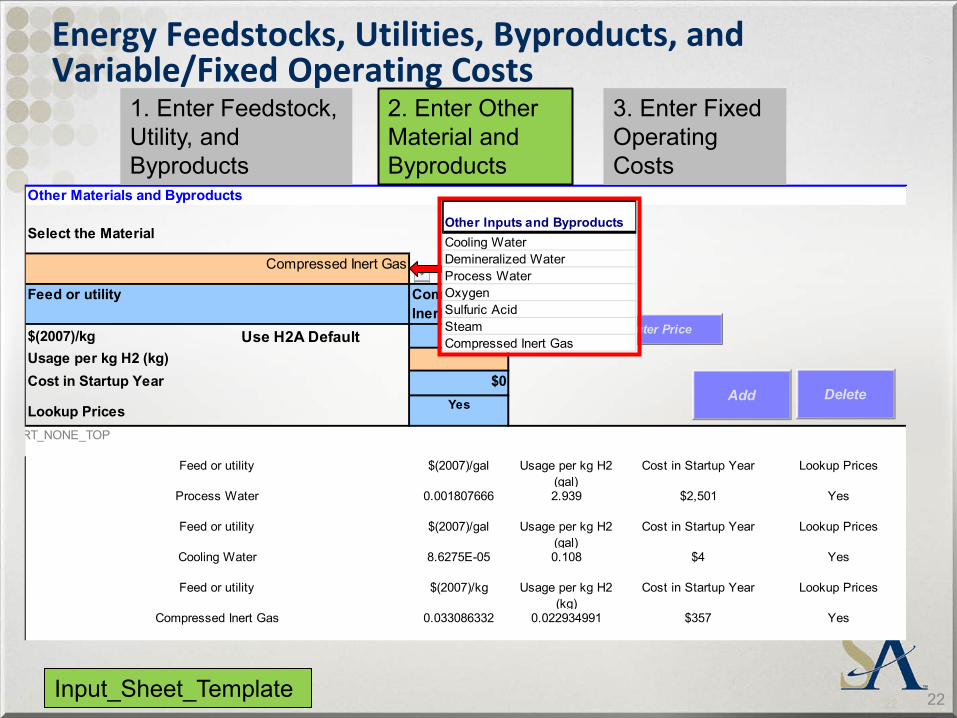
Other Materials and Byproducts
Select the Material
Compressed Inert Gas
Feed or utility Compressed Inert Gas
$(2007)/kg $0.033086
Usage per kg H2 (kg)Cost in Startup Year $0
Lookup Prices Yes
RT_NONE_TOP
Feed or utility $(2007)/gal Usage per kg H2 (gal)
Cost in Startup Year Lookup Prices
Process Water 0.001807666 2.939 $2,501 Yes
Feed or utility $(2007)/gal Usage per kg H2 (gal)
Cost in Startup Year Lookup Prices
Cooling Water 8.6275E-05 0.108 $4 Yes
Feed or utility $(2007)/kg Usage per kg H2 (kg)
Cost in Startup Year Lookup Prices
Compressed Inert Gas 0.033086332 0.022934991 $357 Yes
Byproduct
Add
Use H2A Default Enter PriceOR
Delete
Energy Feedstocks, Utilities, Byproducts, and Variable/Fixed Operating Costs
22
2. Enter Other Material and Byproducts
1. Enter Feedstock, Utility, and Byproducts
3. Enter Fixed Operating Costs
Input_Sheet_Template
Other Inputs and ByproductsCooling WaterDemineralized WaterProcess WaterOxygenSulfuric AcidSteamCompressed Inert Gas
23
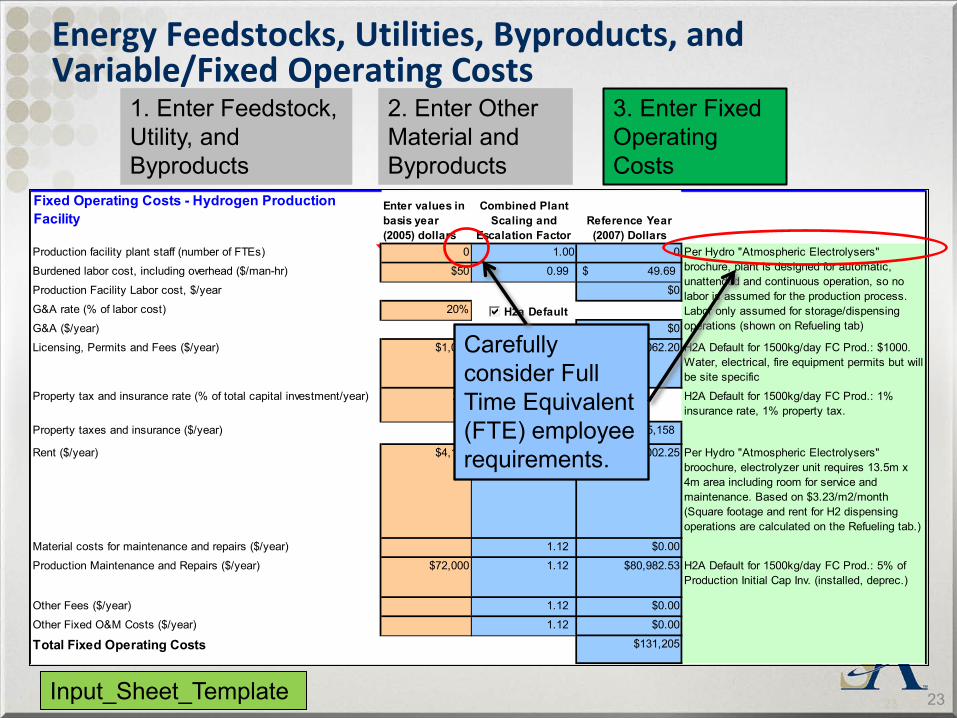
Fixed Operating Costs - Hydrogen Production Facility
Enter values in basis year (2005) dollars
Combined Plant Scaling and
Escalation FactorReference Year (2007) Dollars
Production facility plant staff (number of FTEs) 0 1.00 0
Burdened labor cost, including overhead ($/man-hr) $50 0.99 $ 49.69
Production Facility Labor cost, $/year $0
G&A rate (% of labor cost) 20%
G&A ($/year) $0
Licensing, Permits and Fees ($/year) $1,000 1.12 $1,062.20
Property tax and insurance rate (% of total capital investment/year) 2%
Property taxes and insurance ($/year) $ 45,158
Rent ($/year) $4,186 0.96 $4,002.25
Material costs for maintenance and repairs ($/year) 1.12 $0.00
Production Maintenance and Repairs ($/year) $72,000 1.12 $80,982.53
Other Fees ($/year) 1.12 $0.00
Other Fixed O&M Costs ($/year) 1.12 $0.00
Total Fixed Operating Costs $131,205
H2A Default for 1500kg/day FC Prod.: 5% of Production Initial Cap Inv. (installed, deprec.)
H2A Default for 1500kg/day FC Prod.: $1000. Water, electrical, fire equipment permits but will be site specific
H2A Default for 1500kg/day FC Prod.: 1% insurance rate, 1% property tax.
Per Hydro "Atmospheric Electrolysers" brochure, plant is designed for automatic, unattended and continuous operation, so no labor is assumed for the production process. Labor only assumed for storage/dispensing operations (shown on Refueling tab)
Per Hydro "Atmospheric Electrolysers" broochure, electrolyzer unit requires 13.5m x 4m area including room for service and maintenance. Based on $3.23/m2/month (Square footage and rent for H2 dispensing operations are calculated on the Refueling tab.)
H2a Default
H2a Default
Energy Feedstocks, Utilities, Byproducts, and Variable/Fixed Operating Costs
23
3. Enter Fixed Operating Costs
2. Enter Other Material and Byproducts
1. Enter Feedstock, Utility, and Byproducts
Carefully consider Full Time Equivalent (FTE) employee requirements.
Input_Sheet_Template
24
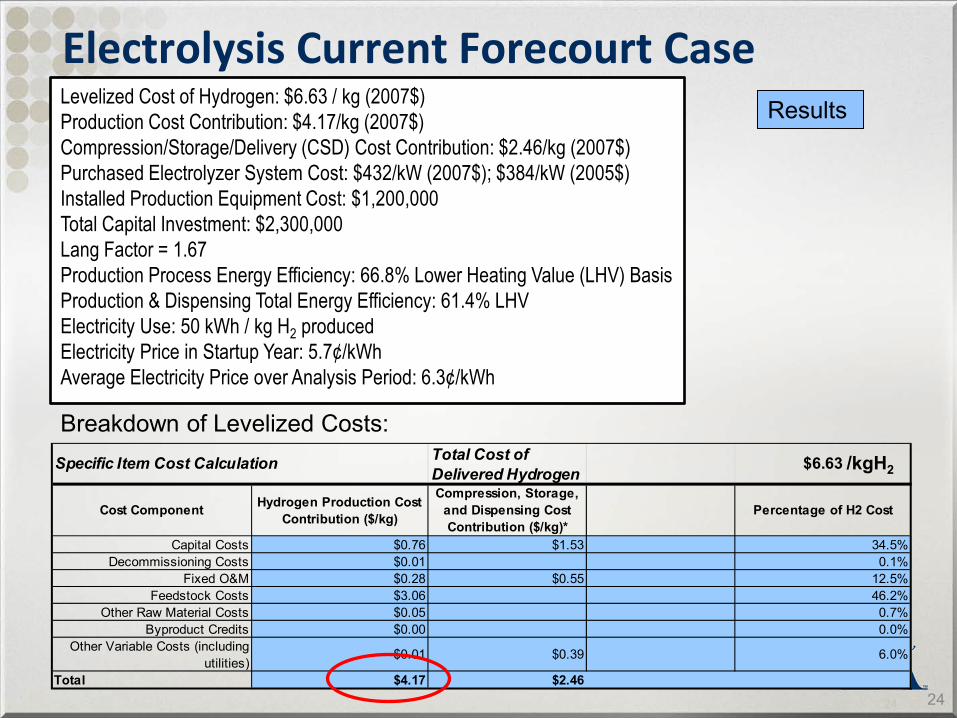
Electrolysis Current Forecourt Case Levelized Cost of Hydrogen: $6.63 / kg (2007$) Production Cost Contribution: $4.17/kg (2007$) Compression/Storage/Delivery (CSD) Cost Contribution: $2.46/kg (2007$) Purchased Electrolyzer System Cost: $432/kW (2007$); $384/kW (2005$) Installed Production Equipment Cost: $1,200,000 Total Capital Investment: $2,300,000 Lang Factor = 1.67 Production Process Energy Efficiency: 66.8% Lower Heating Value (LHV) Basis Production & Dispensing Total Energy Efficiency: 61.4% LHV Electricity Use: 50 kWh / kg H2 produced Electricity Price in Startup Year: 5.7¢/kWh Average Electricity Price over Analysis Period: 6.3¢/kWh
Breakdown of Levelized Costs:
24
Results
Total Cost of Delivered Hydrogen $6.63
Cost Component Hydrogen Production Cost Contribution ($/kg)
Compression, Storage, and Dispensing Cost Contribution ($/kg)*
Percentage of H2 Cost
Capital Costs $0.76 $1.53 34.5%Decommissioning Costs $0.01 0.1%
Fixed O&M $0.28 $0.55 12.5%Feedstock Costs $3.06 46.2%
Other Raw Material Costs $0.05 0.7%Byproduct Credits $0.00 0.0%
Other Variable Costs (including utilities)
$0.01 $0.39 6.0%
Total $4.17 $2.46
Specific Item Cost Calculation /kgH2
25
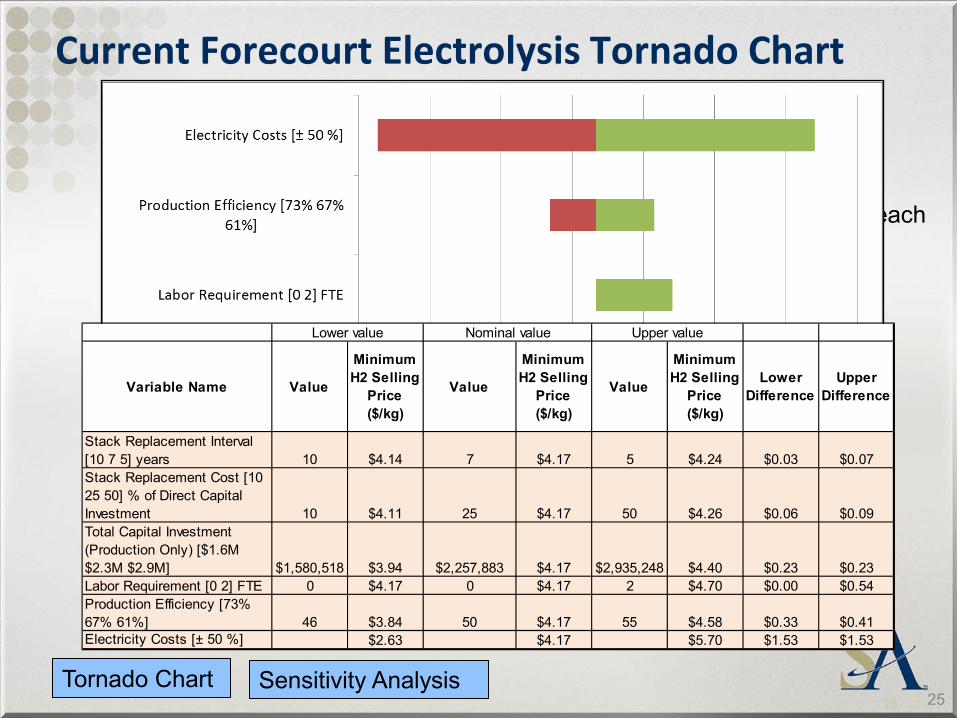
Current Forecourt Electrolysis Tornado Chart
25 Tornado Chart Sensitivity Analysis
• Pick set of variables that are cost drivers • Choose realistic lower and upper bounds for
variables • Run model with lower and upper bounds of each
variable, Record cost output. • Enter titles and costs results into
“Sensitivity_Analysis” Tab • Formatting/Programming of Tornado is
already in the H2A model Variable Name Value
Minimum H2 Selling
Price ($/kg)
Value
Minimum H2 Selling
Price ($/kg)
Value
Minimum H2 Selling
Price ($/kg)
Lower Difference
Upper Difference
Stack Replacement Interval [10 7 5] years 10 $4.14 7 $4.17 5 $4.24 $0.03 $0.07Stack Replacement Cost [10 25 50] % of Direct Capital Investment 10 $4.11 25 $4.17 50 $4.26 $0.06 $0.09Total Capital Investment (Production Only) [$1.6M $2.3M $2.9M] $1,580,518 $3.94 $2,257,883 $4.17 $2,935,248 $4.40 $0.23 $0.23Labor Requirement [0 2] FTE 0 $4.17 0 $4.17 2 $4.70 $0.00 $0.54Production Efficiency [73% 67% 61%] 46 $3.84 50 $4.17 55 $4.58 $0.33 $0.41Electricity Costs [± 50 %] $2.63 $4.17 $5.70 $1.53 $1.53
Lower value Nominal value Upper value
26
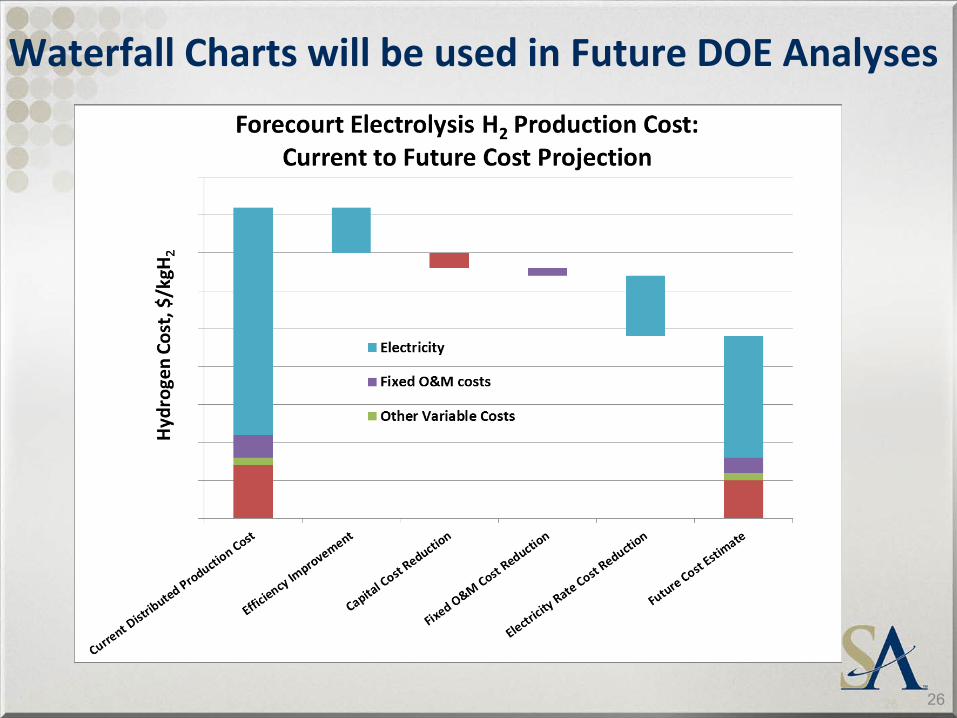
Waterfall Charts will be used in Future DOE Analyses
26
27
Alternative Examples for H2A Cases (Technologies Utilizing Solar Energy for Hydrogen Production)
27
28 28
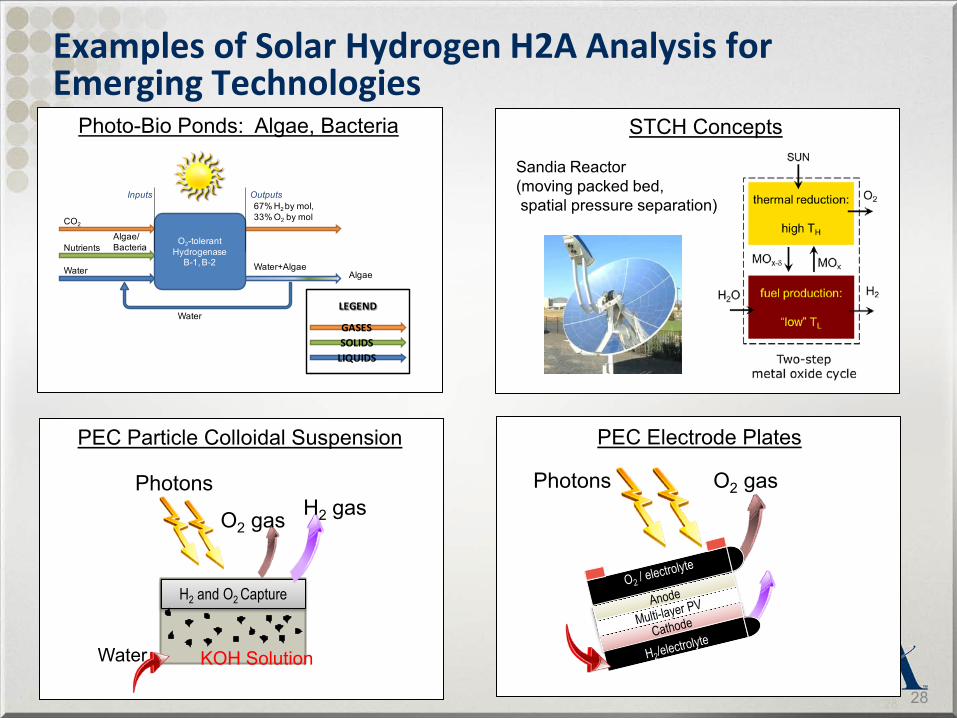
Examples of Solar Hydrogen H2A Analysis for Emerging Technologies
PEC Electrode Plates
Water KOH Solution
Photons
H2 and O2 Capture
O2 gas H2 gas
PEC Particle Colloidal Suspension
STCH Concepts Photo-Bio Ponds: Algae, Bacteria
GASES
LIQUIDSSOLIDS
LEGEND
O2-tolerantHydrogenase
B-1, B-2
Inputs Outputs67% H2 by mol, 33% O2 by mol
Water+AlgaeAlgae
Water
Algae/Bacteria
Water
Nutrients
CO2
O2 gas Photons
Sandia Reactor (moving packed bed, spatial pressure separation)
29
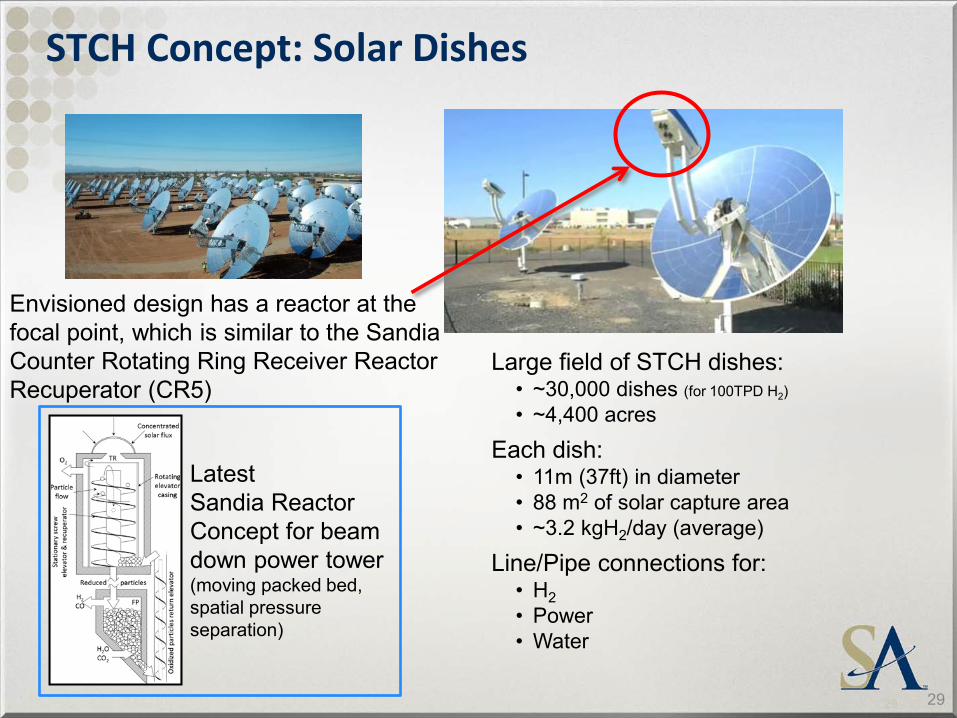
STCH Concept: Solar Dishes
29
Large field of STCH dishes: • ~30,000 dishes (for 100TPD H2)
• ~4,400 acres
Each dish: • 11m (37ft) in diameter • 88 m2 of solar capture area • ~3.2 kgH2/day (average)
Line/Pipe connections for: • H2 • Power • Water
Envisioned design has a reactor at the focal point, which is similar to the Sandia Counter Rotating Ring Receiver Reactor Recuperator (CR5)
Latest Sandia Reactor Concept for beam down power tower (moving packed bed, spatial pressure separation)
30
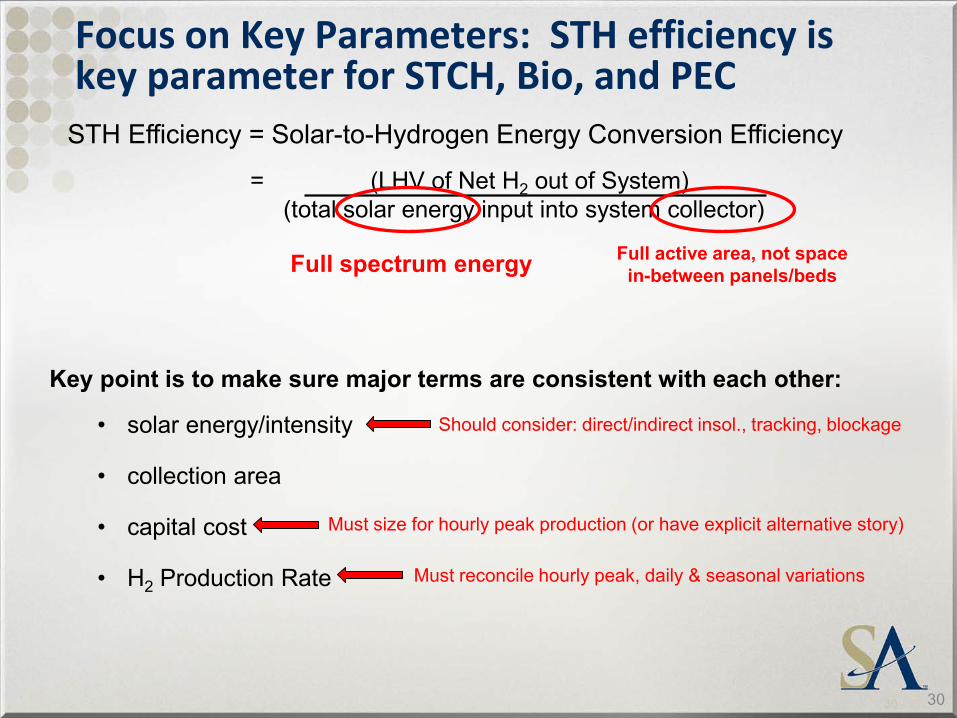
Focus on Key Parameters: STH efficiency is key parameter for STCH, Bio, and PEC
30
STH Efficiency = Solar-to-Hydrogen Energy Conversion Efficiency
= (LHV of Net H2 out of System) (total solar energy input into system collector)
Full spectrum energy Full active area, not space in-between panels/beds
Key point is to make sure major terms are consistent with each other:
• solar energy/intensity
• collection area
• capital cost
• H2 Production Rate
Should consider: direct/indirect insol., tracking, blockage
Must size for hourly peak production (or have explicit alternative story)
Must reconcile hourly peak, daily & seasonal variations
31
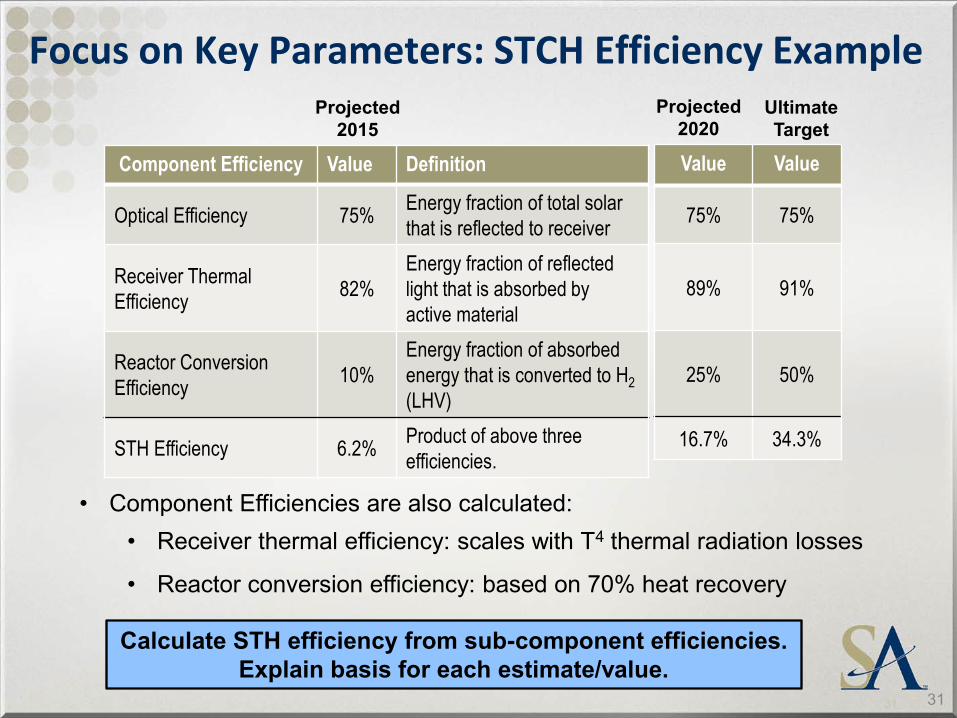
Focus on Key Parameters: STCH Efficiency Example
31
• Component Efficiencies are also calculated: • Receiver thermal efficiency: scales with T4 thermal radiation losses
• Reactor conversion efficiency: based on 70% heat recovery
Component Efficiency Value Definition
Optical Efficiency 75% Energy fraction of total solar that is reflected to receiver
Receiver Thermal Efficiency 82%
Energy fraction of reflected light that is absorbed by active material
Reactor Conversion Efficiency 10%
Energy fraction of absorbed energy that is converted to H2 (LHV)
STH Efficiency 6.2% Product of above three efficiencies.
Value Value
75% 75%
89% 91%
25% 50%
16.7% 34.3%
Projected 2015
Projected 2020
Ultimate Target
Calculate STH efficiency from sub-component efficiencies. Explain basis for each estimate/value.
32
66.6% Solar to heat conversion efficiency25.0% Heat to H2 (LHV) conversion efficiency16.7% STH efficiency of System
7.46
Average Solar Insolation, kWh/day/m2 (monthly average for concentrating solar, Dagget CA, tracking, no shading, NREL Solar Raciona Data Maual and SOLPOS and zero obstruction)
88 m2 of dish collection area33.33 Heating Value of H2 (LHV), kWh/kg
100,000 Design H2 production, kgH2/day2,681,769.76 Collection area required, m2
30,475 Number of dishes175 Number of dishes on a side
2986.867571 Field length in N/S direction, meters5969.788174 Field width in E/W direction, meters17,830,967 Total field m2
17.83 Total field km24,406.12 Total field acres
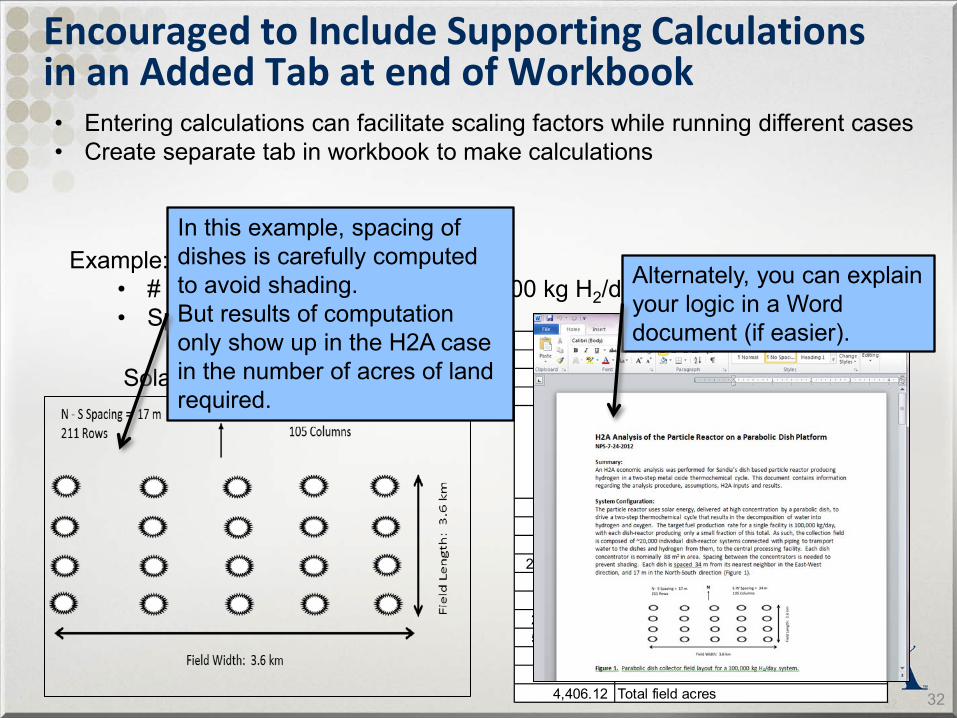
Encouraged to Include Supporting Calculations in an Added Tab at end of Workbook • Entering calculations can facilitate scaling factors while running different cases • Create separate tab in workbook to make calculations
32
Solar Dish Field Spacing
Example: STCH Model calculates: • # of dishes required to meet 100,000 kg H2/day target • Spacing for land cost calculation
Alternately, you can explain your logic in a Word document (if easier).
In this example, spacing of dishes is carefully computed to avoid shading. But results of computation only show up in the H2A case in the number of acres of land required.
33 33
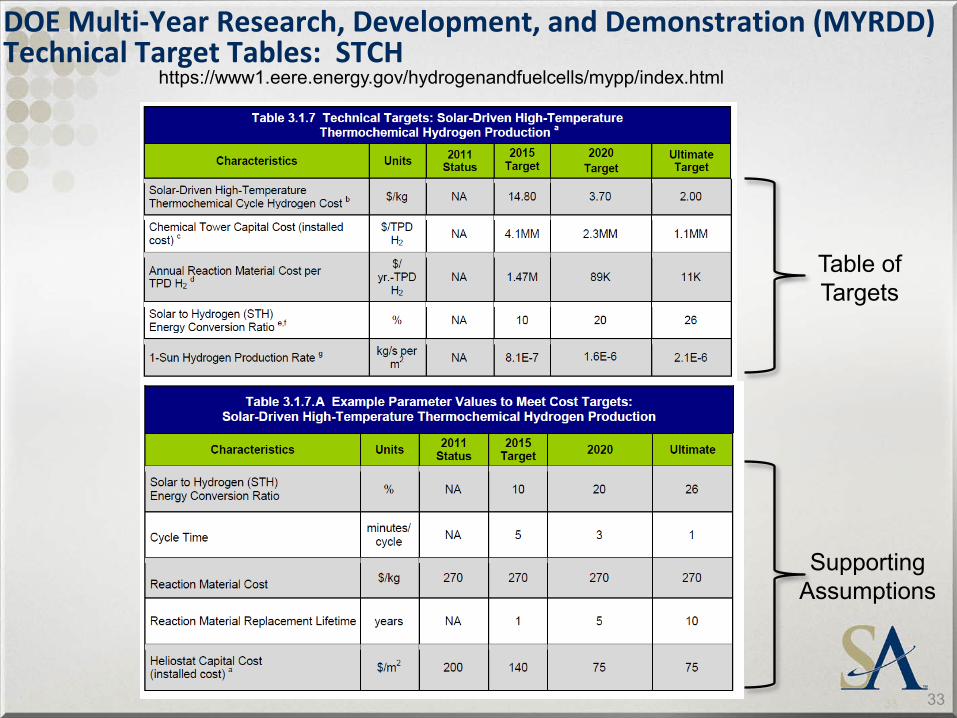
DOE Multi-Year Research, Development, and Demonstration (MYRDD) Technical Target Tables: STCH
https://www1.eere.energy.gov/hydrogenandfuelcells/mypp/index.html
Table of Targets
Supporting Assumptions
34 34
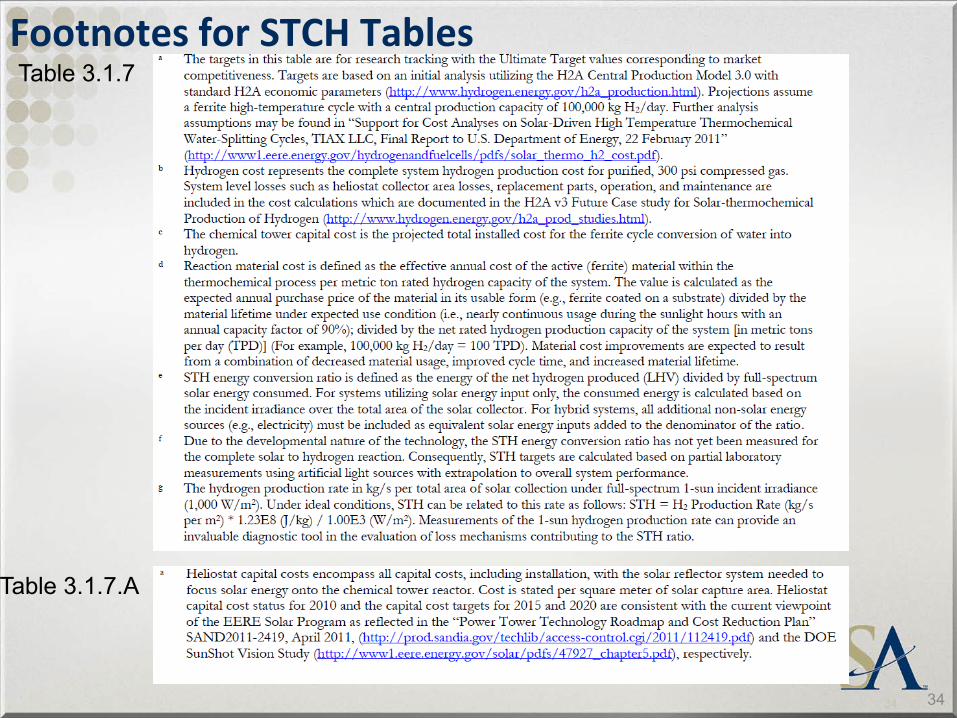
Footnotes for STCH Tables Table 3.1.7
Table 3.1.7.A
35
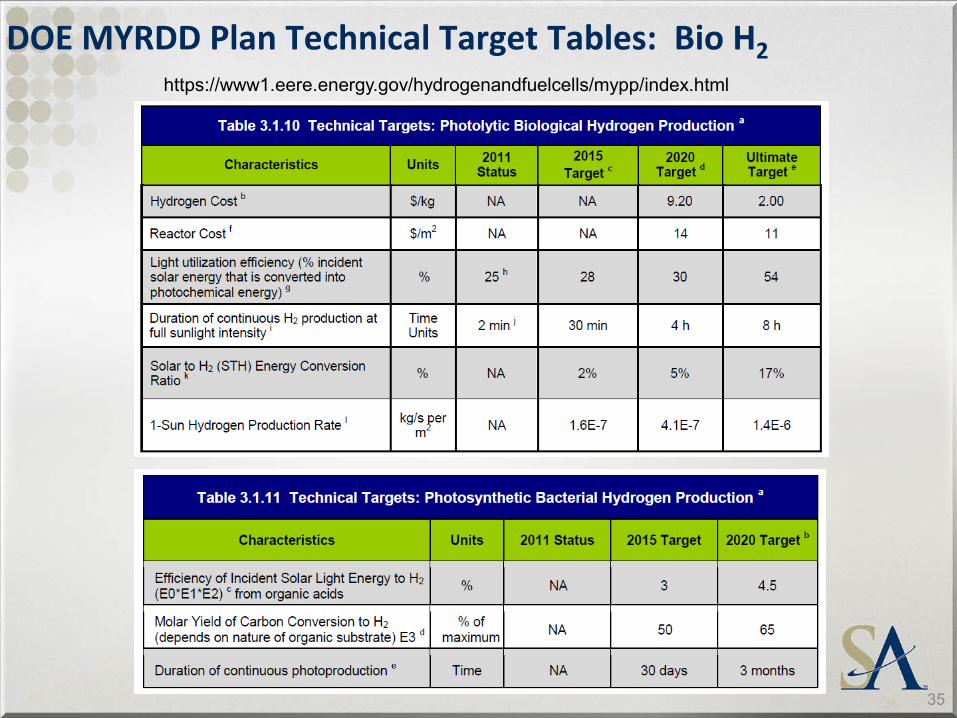
DOE MYRDD Plan Technical Target Tables: Bio H2
35
https://www1.eere.energy.gov/hydrogenandfuelcells/mypp/index.html
36
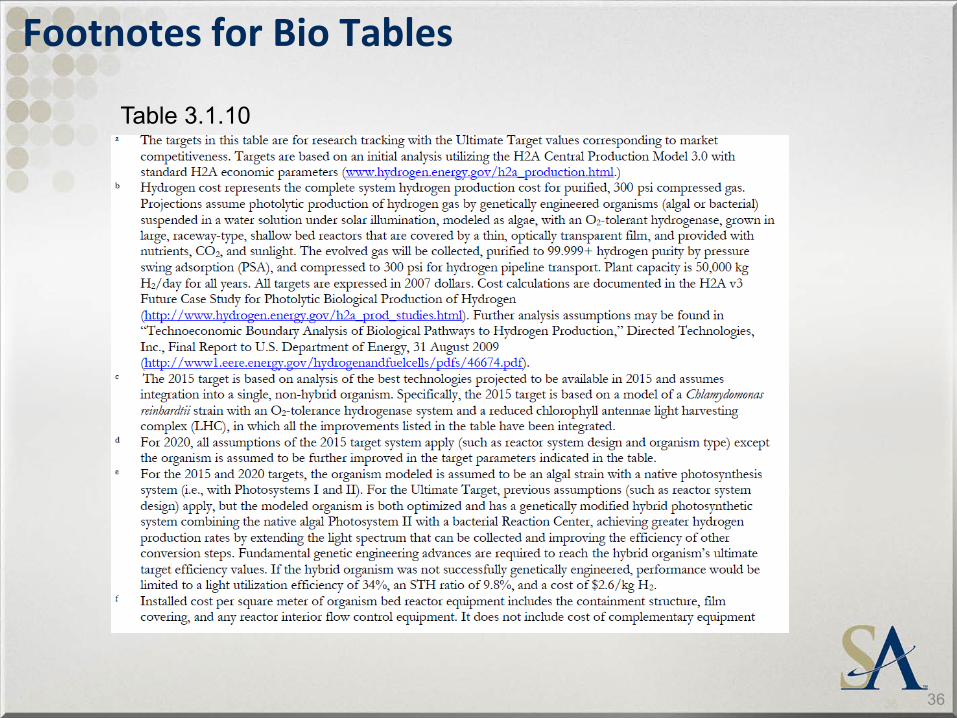
Footnotes for Bio Tables
36
Table 3.1.10
37
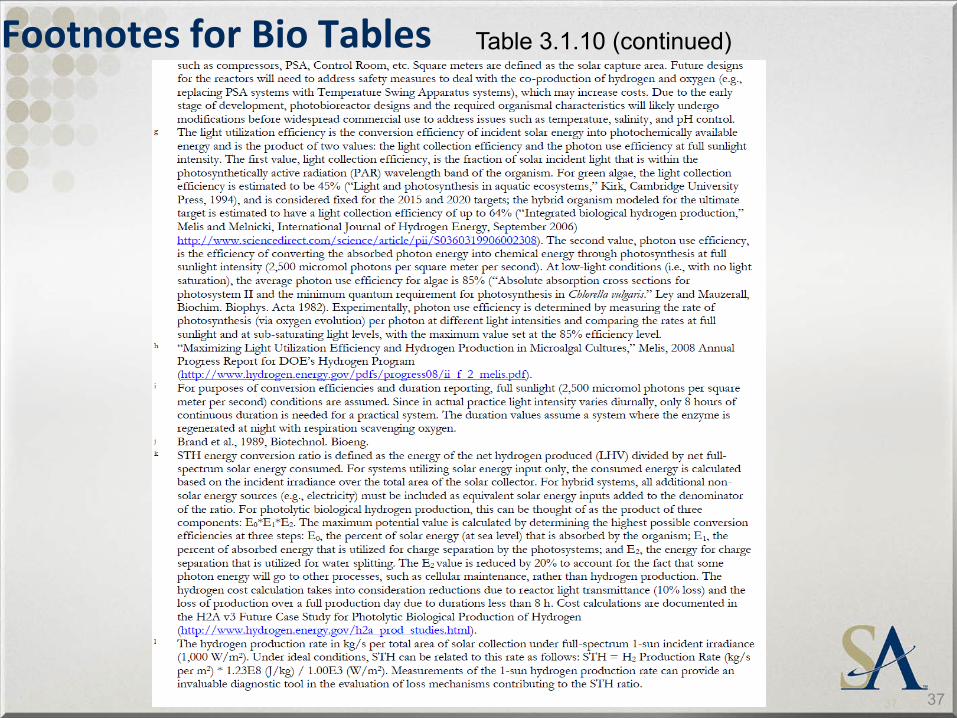
Footnotes for Bio Tables
37
Table 3.1.10 (continued)
38
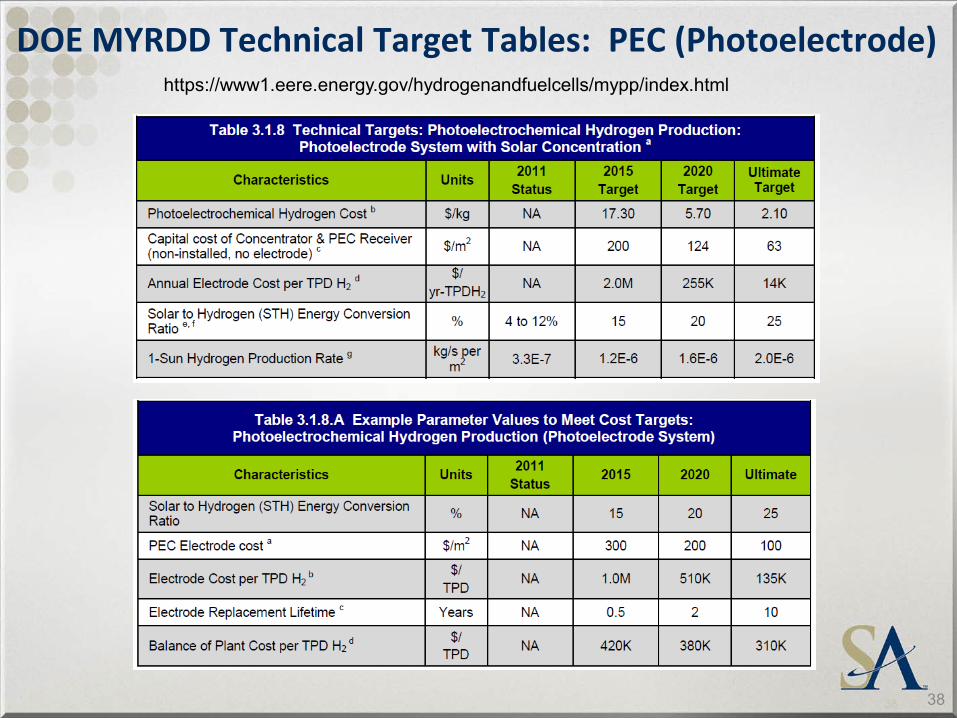
DOE MYRDD Technical Target Tables: PEC (Photoelectrode)
38
https://www1.eere.energy.gov/hydrogenandfuelcells/mypp/index.html
39
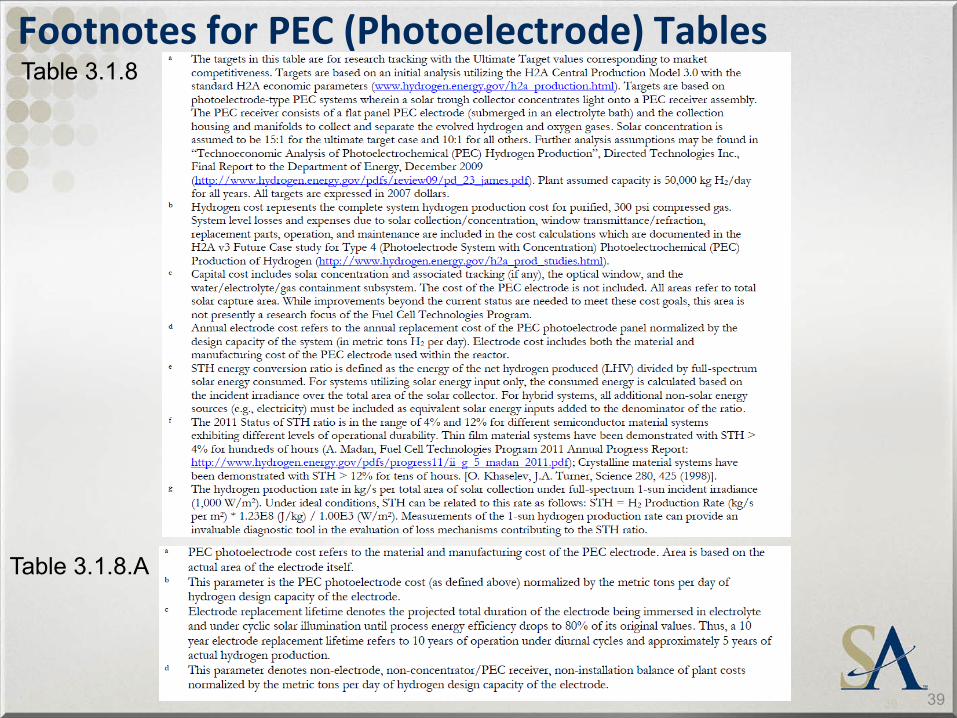
Footnotes for PEC (Photoelectrode) Tables
39
Table 3.1.8
Table 3.1.8.A
40
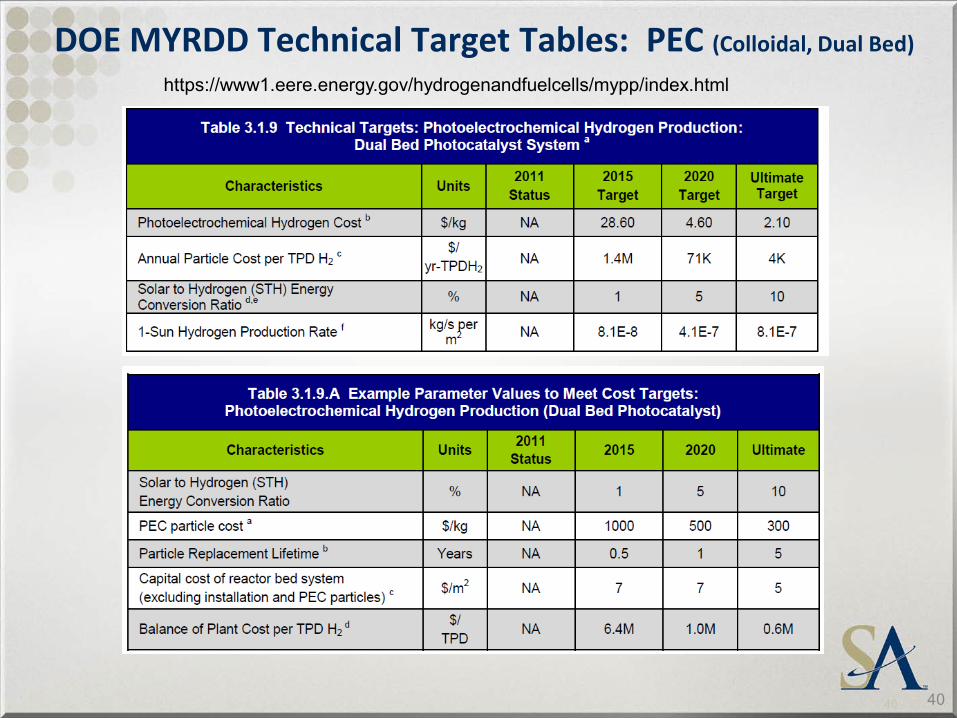
DOE MYRDD Technical Target Tables: PEC (Colloidal, Dual Bed)
40
https://www1.eere.energy.gov/hydrogenandfuelcells/mypp/index.html
41
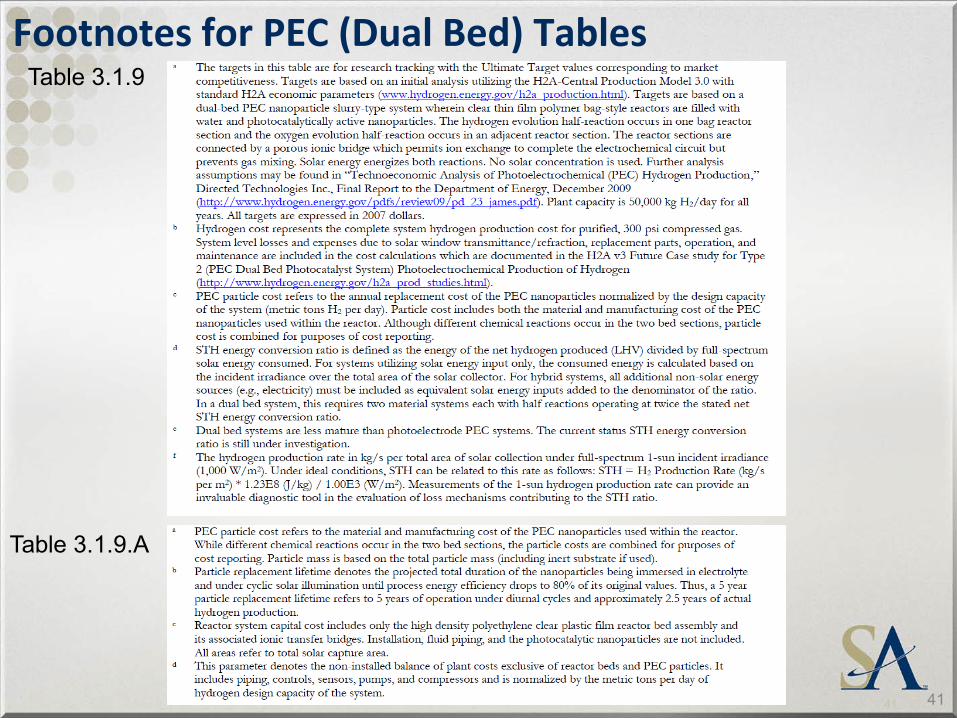
Footnotes for PEC (Dual Bed) Tables
41
Table 3.1.9
Table 3.1.9.A
42
Reference Information
42
This presentation available after WebEx. H2A Model Description on Hydrogen and Fuel Cells Program website: http://www.hydrogen.energy.gov/h2a_analysis.html#data H2A Production Models and Case Studies http://www.hydrogen.energy.gov/h2a_production.html H2A Version 3 User Guide PDF: https://apps1.hydrogen.energy.gov/cfm/h2a_active_folder/h2a_production/03P_H2A_Central_Hydrogen_Production_Model_User_Guide_Version_3_draft.pdf Feedstock and utility prices (H2A default) linked to Annual Energy Outlook (AEO) Reference Case developed by DOE’s Energy Information Administration (EIA) http://www.eia.gov/forecasts/aeo/index.cfm Greenhouse Gases, Regulated Emissions, and Energy Use in Transportation (GREET) Model from Argonne National Lab: http://greet.es.anl.gov/main