brent population estimation, household composition and · pdf filebrent population estimation,...
TRANSCRIPT

Brent population
estimation, household composition and change
A comparative analysis between
2005 and 2007
Leslie Mayhew
Gillian Harper Mayhew Associates Ltd. [email protected]
neighbourhood knowledge management

Brent population estimation, household composition and change
2
Executive Summary
The size of the population is a key determinant of the central
government grants given to local authorities and primary care trusts, so it is important that population figures can be trusted. An
untapped source of information about the local population is the administrative databases routinely maintained by local public
agencies. The potential advantages of using administrative data are that not only are they more up to date than official population
figures, but also more flexible in their use.
In July 2005 Brent Council and Brent Primary Care Trust asked the authors of this report to undertake a project to estimate the
population of Brent using administrative data sources. The aims were twofold: firstly to compare the estimates with the then latest
Office for National Statistics (ONS) population estimates, which at
that time were for mid-2004; secondly to create a geo-referenced database that could be used to improve the identification of health
and other needs at small area (neighbourhood) level in order to improve the delivery of local services.
In this report, commissioned by Brent Council, we revisit our
earlier population estimates using the same methodology. This time around we had the advantage of having access to slightly
more and better quality information than previously. We found that the ‘confirmed’ population was 289.1k at March 31st 2007, as
compared with the with the 2006 ONS mid-year estimate of 271.4k giving a difference of 17.7k. The Greater London Authority
(GLA), using a different methodology from ONS, gives a count of 279.2k for 2007 but rising to 290k by 2011.
This report explains our methodology and findings and possible reasons for the differences between sources. It analyses changes
between 2005 and 2007 in terms of occupancy, household composition, and income deprivation by household type and by
individuals. It analyses population changes and turnover at a small area level and uses changes of address as a proxy for migration
within and outside Brent.
It finds that while the number of UPRNS1 (a proxy for households) has increased, this has not kept pace with the population with the
result that the number of 2+ person dwellings has increased and the number of single person dwellings has decreased. It identifies
several changes in household composition and a rise for example in the number of three-generation families. It finds a small fall in
the percentage of the population receiving benefits but the picture
1 Unique Property Reference Numbers

Brent population estimation, household composition and change
3
between different groups varies according to factors such as
housing tenure and age.
It also shows that population growth has been mainly in the south below an east-west line through the Welsh Harp reservoir that
includes south Wembley, Willesden, Harlesden and Kilburn. Most of the growth is due to inflows exceeding outflows from Brent,
especially young pre-school children and adults. The influx of young adults in turn is having an effect on birth rates, which can
be expected to climb in the medium term. The combined effect of these trends is likely to put more pressure on public services,
particularly children’s services, education and housing.
The techniques described in this report involve matching people to addresses and then addresses to the Land and Local Property
Gazetteer (LLPG). A synopsis of the extended datasets used, and
their quality and coverage, is included at Annex D. While it finds some improvements in those datasets since 2005, it also makes
some further recommendations that could lead to future improvement.
Les Mayhew - Mayhew Associates Ltd. November 2007
Contents
1. Introduction 2. Background
3. Population count approach and data sources 4. Data matching and population count procedure
5. Brent population count
6. Occupancy changes by dwelling 7. Household profiling and change
8. Income deprivation analysis by individuals 9. Population turnover and change by neighbourhood
10. Conclusions
Annex A: Population count by age 2005 and 2007 Annex B: Population count by age and locality
Annex C: Ward and locality look-up map and table Annex D: Data quality issues arising

Brent population estimation, household composition and change
4
1. INTRODUCTION
1.1 In 2005 Mayhew Associates Ltd. undertook a project to ascertain the population of Brent from local administrative
sources. A key finding was that Brent’s population was being undercounted in official population projections by at least 8k
persons. Translated into central government funding, this equated at the time to a potential annual loss of revenue for the Council of
£4m and £11.3m for the PCT.
1.2 At the time of the original study it was agreed that it would be desirable to update it in two years’ time partly to update previous
figures but partly also to understand patterns of household turnover and migration. Such information, particularly at small
area level and segmented into population groups, would be
valuable as information in this detail is presently unavailable in accessible form from any other source.
1.3 A key finding in this report, based on administrative data
current at 31st March 2007, is that the population is being undercounted by 17.7k persons as compared with the 2006 Office
for National Statistics (ONS) mid-year estimate2. The implication is therefore that potential revenue shortfalls measured in terms of
Government grants are running potentially at double previous levels.
1.4 Whilst the overall aim was to determine the population of
Brent, subsidiary aims included:
producing a fully geo-referenced population source for
Brent of all Brent residents that can be used for other purposes such as service evaluation and planning
providing a comparison with ONS latest mid-year
population estimates drawing attention to any systematic differences
enabling breakdowns of population turnover,
segmented by age, gender, housing and benefit status at household and small area level
enabling analyses by household to evaluate occupancy,
benefit status, age composition etc. to examine changes in economic deprivation
2 ONS local authority projections for 2007 are not available until 2008, and so the 2006 mid
estimates used in this report were the latest available for comparative purposes.

Brent population estimation, household composition and change
5
providing evidence of changes in ethnicity
2. Background
2.1 Population is the basis for central Government financial allocations to councils and primary care trusts, and so any
inaccuracies in population estimates or projections can make a significant difference to available resources locally and hence to
budgets.
2.2 Accurate population estimates are also vital for the proper conduct and stewardship of services at neighbourhood level, and
thus robust estimates at a local as well as at a Brent level are arguably as important.
2.3 A key finding of this study is that the confirmed minimum population of Brent at 31st March 2007 is 289,051 persons. By
‘confirmed’, we mean people whose identity can be confirmed by reference to different datasets and according to assumptions for
linking people to addresses and hence households.
2.4 Our 2007 figure compares with the ONS 2006 mid-year population estimate of 271,400. Much of the difference of 17.7k is
concentrated in the youngest age groups (0-15), but also younger adults. We checked our higher figure against HMRC Child Benefit3
counts for Brent at August 2006 (the latest figures available) and we compared this count with our figure for 2007, focussing on the
0-14 age range.
2.5 We found that HMRC reported 52,195 beneficiaries at August
2006, which compares favourably with our figure, a year later, of 54,954. Of interest is the fact that the comparable 2006 ONS
figure was only 47,600. Our work also indicates a higher population than the other main source of population estimates
produced by the GLA. Using a different methodology to ONS and to ourselves, the GLA obtains a count of 279k for 2007, rising to
290.7k in 2011.
2.6 Our analysis indicates that the population of Brent has grown in two years by around 19.3k compared with our previous
estimate, although the previous study may have understated the population for reasons given at the time. It suggests, for example,
3 Child Benefit is available to anyone bringing up a child or young person who is normally resident in
the UK. All children under 16 are eligible for child benefit regardless of income, although there is
reduced entitlement up to 19 years, depending on circumstances. Child benefit counts are thus likely
to be a reasonable estimate of the number of children in an area up to the age of 16.

Brent population estimation, household composition and change
6
that the GLA’s projected figure for 2011 may have already been
reached in 2007. Apart from increases in young ages, we also found that Brent (along with Ealing and Newham) recorded the
biggest number of new national insurance registrations of any council, at over 15k in both 2005/06 and 2006/07, from people
seeking work4.
2.7 Although the number of addresses and therefore dwellings in Brent has expanded to accommodate extra people, it is clear that
there have been accompanying increases in occupancy (as discussed below). We found for example that there has been a
significant fall in the number of single person dwellings and a rise in multiple person dwellings.
3. Population count approach and data sources
Population count approach
3.1 The approach adopted here is based on the idea of filling up as
many addresses in Brent with people that can be confirmed for example by more than one database. The techniques involved are
collectively known as ‘Neighbourhood Knowledge Management’ or nkm. The aim of nkm is to develop comprehensive statistical
information, including population counts, about local areas using administrative datasets.
3.2 The source of addresses is the Brent Local Land and Property Gazetteer (LLPG) in which every address in Brent is assigned a
UPRN (Unique Property Reference Number)5. The method for
estimating population can be envisaged as a process in which the addresses act as a check on whether a person lives in the area and
has not been replaced by another person at the address and that addresses are not over or under filled.
4 A National Insurance Number (or NINO) is a personal number used to record a person's NI
contributions, and is needed when a person starts work or is self employed, or wants to claim social
security benefits. If a person needs a NINO he/she is called to interview to check identity and the
person’s right to work in the UK. A wide range of countries of origin are indicated in the Brent data
for 2006/2007, but Poland and India supplied the most new registrants with around 3k each.
5 The LLPG extract used was an extract of 'live' domestic and mixed properties as at 31st March
2007.

Brent population estimation, household composition and change
7
3.3 In our approach we adopt several tests before a person is deemed to exist:
a person is ‘confirmed’ if they are on the GP register6 and
on another database
if they are on the GP register, but not on any other database, they should be related to someone else at that
address by name e.g. a young child
if they are not on more than one database the person should be the latest person at that address according to
the GP register
a person may also be included if an address would
otherwise be vacant; this is ascertained after checking for people on other datasets with that address and removing
any with the same names/dates of birth so as to avoid possibility of double counting
all persons included in the database should have a UPRN
and therefore an address
3.4 Where a confirmed person has conflicting addresses, we give higher priority to the address in the most current database. If both
databases are of equal currency then we give more weight to the GP register because this is our main population base. Where the
total number of people at any address exceeds 9, the data are then re-checked for accuracy and a further judgement made.
3.5 Homes and hostels are flagged separately as they typically
have much higher occupancy. Whether people are still alive is then checked against the deaths register for the previous 12
months. The births register is also checked in case there are some people that have not yet been registered (e.g. on the GP register).
Data sources
3.6 Data sources used are listed below and were the latest available at March 31st 2007 so as to be as consistent as possible
6 Everyone living in the UK has a right to register with a GP. This right is based on residency and not
nationality or payment of taxes. However, patients must be only be registered with one practice at
any one time and generally need to reside in the UK for more than 3 months. If a person moves away
and changes GP the new practice contacts the previous GP for their medical records to be forwarded.

Brent population estimation, household composition and change
8
with the LLPG. They consist of information about housing,
information about people, or information about both. Every type is needed to establish the population but also to assist in splitting
population into sub-groups.
Dataset source
GP register Brent PCT Birth and deaths Brent PCT
Electoral Roll(1) Brent Council Council tax liable persons Brent Council
Council Tax benefit recipients Brent Council School pupil register Brent Council
Housing waiting list Brent Council Property gazetteer Brent Council
Note (1): The full unedited version was used rather than the edited version in
2005 (see also annex D).
Table 1: Administrative data sources used
3.7 In using administrative datasets two types of problem are encountered. The first is that some databases contain only
information for some of the population and therefore their value is mainly confirmatory. For example, the electoral roll only includes
people that are eligible to vote and who have registered. The second is that some fields like date of birth are not universally
provided and so it is necessary to use ‘fuzzy matching’ techniques to verify some people.
3.8 The database with the greatest coverage of people and
addresses proves to be the most useful. By far the most important of these is the GP register. This contains information on name,
gender, date of birth, date of registration with a GP, and full home
address. As long as a person is registered with a GP (which applies to the great majority of Brent citizens), the register provides a
firm starting point.
3.9 Numbers on the GP register are typically inflated because people that have left an area may not yet have notified their GP of
a change of address. Some may also have died and this may not yet have been picked up by the register; the corollary is that
recent births may not have been registered with a GP. However, the standard of GP list cleaning has improved since the
introduction of the new GP contracts, and so this did not prove to be as big an issue this time around.
3.10 Some persons may not be registered with a GP because they have only just arrived in the area e.g. new arrivals from abroad.
Sometimes these people may be picked up on other databases

Brent population estimation, household composition and change
9
such as Housing Benefit or the housing waiting list. This simply
reinforces the need to systematically check all datasets.
3.11 Although it is natural that some details (such as date of birth)
are not recorded in some databases (e.g. the electoral register), it is equally clear that some datasets are in better order than others.
In other words they have been maintained to a higher quality in terms of the consistency of addressing, the completion of
postcodes, correctly spelt names and list maintenance. Annex D provides further details.
4. Data matching and population count procedure
Data matching
4.1 Using an address-matching algorithm to match addresses on
each database to the LLPG, we extracted and assigned a UPRN to every person. We also kept a log of all persons that could not be
assigned a UPRN due to missing, incomplete or wrongly recorded
addresses.
4.2 We simultaneously extracted the x,y co-ordinates for later use. This part of the process is referred to as geo-referencing because
it enables the creation of detailed maps using GIS. This process is shown in Figure 1.
4.3 Two algorithms are involved. The first, called the Address
Matcher, matches addresses on a database to the addresses on the LLPG. The Address Matcher is designed to efficiently automate
address matching (usually with an 80% to 90% success rate).
4.4 The second algorithm is called the ‘Address Finder’. Unmatched, mostly non-standard or incomplete addresses are
individually compared with the addresses on the LLPG to find
possible matches. The user then selects which address is most likely to be correct and then proceeds to the next address in the
list of unmatched addresses.
4.5 At the end of this process there will still be some addresses that are unmatchable due to insufficient information. These are
stored and reassessed later. In summary, none of the datasets is perfect but in combination are sufficient to produce a robust
population count.
4.6 To determine a confirmed population count for Brent we used a 6-stage procedure as shown in Table 2. Partial or ‘fuzzy’ criteria
are used if, for example, a piece of information about a person is missing from their record such as forename, gender or date of

Brent population estimation, household composition and change
10
birth, or to combat spelling differences and so help to remove
duplicates.
Figure 1: The process of matching and geo-referencing addresses
5. Brent population count
5.1 Table 2 is a summary of the population identified or rejected at
each stage. It shows a final confirmed population count of 289,051 at 105,332 UPRNs (addresses) at 31st March 2007. Table 3 and
Figure 2 give breakdowns of the population into standard age categories based on our methodology, and compare our results
with the 2006 ONS mid-year estimates.
5.2 Note that within the totals we were unable to assign age to 17,319 people. This is because, as noted above, examples can
arise where persons, in particular those not on the GP register information about age is either not entered in the field provided or
not required. We note in passing that the number of ‘age
unknowns’ is less than was found in the previous exercise in 2005, as most databases have improved in this regard.
5.3 We know that around half of those with neither gender nor age
are females and that most are young adults and so our methodology enables us to assign such people fairly accurately
where such information is missing. For example, in the section on household composition below, we considered it reasonable to
assume that people of unknown age are adults between 19 and 64.
Match address to LLPG
using Address Matcher
Assign individuals to addresses
using same or other sources
Original data
source
Extract x,y co-
ordinates and
UPRN
Manual data
matching using
the Address
Finder
Match address to LLPG
using Address Matcher
Assign individuals to addresses
using same or other sources
Original data
source
Extract x,y co-
ordinates and
UPRN
Manual data
matching using
the Address
Finder

Brent population estimation, household composition and change
11
Stage Summary Main Comments Population
Count
1 – Clean GP Register
Identify current registered patients at each UPRN
Of the 352,831 on the GP register 25,793 could not be assigned a UPRN (i.e. address) mainly due to poor addressing. Of the remainder, 263,172 persons meet the criteria for inclusion (see para. 3.3)
91,521 of available Brent UPRNs (i,e. addresses) are represented on the cleaned GP register
That leaves 16,725 of all UPRNs on the domestic Land and Local Property Gazetteer (LLPG) to fill
+ 263,172
2+3 – Identify additional people from other datasets
To ensure no double counting, eliminate people on Electoral register (ER), Council Tax register (CT), Housing waiting list (HWL) and PLASC (school census) who are already confirmed GP on Register
238,070 people could be eliminated using all available identifying criteria where available (initial/forename, surname, date of birth) and UPRN across all datasets
A further 55,528 people were eliminated using fuzzy (partial) criteria where details incomplete
Leaves 168,730 records appearing on other databases that are not yet ‘confirmed’.
4+5 – Allocate people to UPRNs not on the GP Register
Identify which of the remaining 168,730 records have unused UPRNs, and remove any further duplicates to avoid double counting
42,027 records across datasets have unused UPRNs
These can be reduced to 26,553 people after removing duplicates
Leaves 126,703 records that do not have a non-GP Register UPRN (i.e. people that cannot be confirmed at any remaining UPRNs)
+ 26,553
6 – Add births and remove deaths
Adjust for births and deaths to deal with possibility that GP register had not been fully amended at 31/03/07
3,130 of the 3,516 births on the births database are already on the GP Register
386 births not yet on the GP register are additional
Subtract 773 deaths from existing population base that were still on the GP register
Subtract 287 records where the date of birth is after 31/3/2007
+ 386 - 773 - 287
Population Base = Covers 105,332 UPRNs Leaves 2,914 unallocated UPRNs
289,051
Table 2: Stage summary of the population count process

Brent population estimation, household composition and change
12
Age Group
Mayhew (A)
ONS 2006 mid-year estimate (B)
Difference (A-B)
Under 1 3,967 4,500 -533
1-4 15,668 14,800 868
5-9 17,795 14,000 3,795
10-14 17,524 14,300 3,224
15-19 17,518 16,400 1,118
20-24 18,787 20,700 -1,913
25-29 24,748 28,700 -3,952
30-34 22,908 26,600 -3,692
35-39 22,521 23,600 -1,079
40-44 21,666 20,900 766
45-49 18,796 18,000 796
50-54 15,194 14,300 894
55-59 12,982 12,600 382
60-64 10,969 10,200 769
65-69 9,576 9,600 -24
70-74 8,304 8,500 -196
75-79 5,953 6,200 -247
80-84 3,750 3,800 -50
85-89 2,009 2,200 -191
90+ 1,097 1,400 -303
age n/a 17,319 17,319
Total 289,051 271,400 17,751
Table 3: A comparison by age of the population with the 2006 ONS mid-year estimates
0
5,000
10,000
15,000
20,000
25,000
30,000
Under 1
1-4
5-9
10-1
4
15-1
9
20-2
4
25-2
9
30-3
4
35-3
9
40-4
4
45-4
9
50-5
4
55-5
9
60-6
4
65-6
9
70-7
4
75-7
9
80-8
4
85-8
9
90+
age n
/a
po
pu
lati
on
by a
ge g
rou
p
M A 31/3/07
ONS M YE 2006
Figure 2: An age comparison of ONS 2006 mid-year estimates with
Mayhew Associates estimates at March 31st 2007

Brent population estimation, household composition and change
13
5.4 There are three key points arising from the tables and chart
above:
there are 9,005 more children in the age range 1-19 living in Brent, most of whom we found through the GP register or
the 2007 school census. We have already noted the evidence of the HMRC Child Benefit counts for August 2006, which
lends support to this finding (see paragraph 2.4).
although our figure for the age range 20 to 39 is 10.6k less than the ONS 2006 mid-year estimates, this needs to be set
against the fact that we identified 17.3k people to whom we could not assign an age. Typically these are migrants of
working age, predominantly within this age range (see paragraph 2.6 for discussion of NINO registrations in Brent).
we found 1k fewer people in the 65+ age range than ONS. Our sources are administrative and based on current GP and
Council tax records, whereas ONS uses a different methodology.
Sensitivity analysis
5.5 We found using more stringent counting criteria that we could
reduce the population count by around 10k, still considerably higher than the ONS mid-year estimate. However, when we did so
the number of vacant properties rose to 5% (around 5k addresses) which seemed unreasonable bearing in mind current
housing pressures in Brent and taking into account that the vacant dwelling rate was only 2.9% in 2005 (see next section).
5.6 This conclusion was backed up in a comparison with the number of properties and the percentage vacant on the Council
Tax valuation list. At October 2005 it was between 2.63 % (excluding second homes) and 3.65 % (including second homes).
At October 2007 it was reduced to between 2.56% and 3.39%. Our central estimates for both years, but using a different method
of calculation, fall into this range (see next section).
5.7 In the next sections we compare our 2007 findings with those we obtained in 2005. We concentrate on four areas: (a) changes
in household occupancy, (b) changes in household composition, (c) changes in deprivation and income by individuals and age
group, and (d) population change and turnover by area and neighbourhood.

Brent population estimation, household composition and change
14
6. Household occupancy
6.1 The number of UPRNs (our proxy for households) in Brent increased between 2005 and 2007 by 2,240 from 106,006 to
108,246. Between the two dates we found that the vacant dwelling rate based on unused UPRNs fell from 2.9% to 2.7% and that the
average number of persons per household increased from 2.5 persons per occupied UPRN to 2.7 per occupied UPRN.
6.2 Figure 3 shows household frequency by occupancy in 2005 and
2007. The most obvious difference is a fall of around 3k in the number of single person households and a consequent rise in the
number of multiple-person households i.e. 2,3,4,5 etc. This is brought out more clearly in Figure 4, which is based on change by
occupancy between the years. Thus, a key conclusion is that the
number of dwellings (as measured by the UPRN count) has not kept pace with the growth in population and so occupancy has
risen.
0
5,000
10,000
15,000
20,000
25,000
30,000
35,000
40,000
occupancy (persons)
freq
uen
cy o
f h
ou
seh
old
s b
y o
ccu
pan
cy
2007
2005
2007 2914 3524 2368 16232 13228 7983 4195 2169 1145 601 322 205 127 54 51 23 20 11 6 6 1 17
2005 3041 38182 22414 15097 12486 7328 3675 1812 880 480 252 149 78 49 26 16 11 8 10 3 2 7
0 1 2 3 4 5 6 7 8 9 10 11 12 13 14 15 16 17 18 19 20 >20
Figure 3: Household size and frequency in 2005 and 2007 by
number of people

Brent population estimation, household composition and change
15
-3000
-2000
-1000
0
1000
2000
3000
household occupancy
ch
an
ge i
n h
ou
seh
old
fre
qu
en
cy b
y
occu
pan
cy
difference 2007 - 2005
dif ference 2007 - 2005 -127 -293 1273 1135 742 655 520 357 265 121 70 56 49 5 25 7 9 3 -4 3 -1 15
0 1 2 3 4 5 6 7 8 9 10 11 12 13 14 15 16 17 18 19 20 >20
Figure 4: Change in the frequency of household size by occupancy
-30,000 -25,000 -20,000 -15,000 -10,000 -5,000 0 5,000 10,000 15,000 20,000 25,000 30,000
Under 1
1-4
5-9
10-14
15-19
20-24
25-29
30-34
35-39
40-44
45-49
50-54
55-59
60-64
65-69
70-74
75-79
80-84
85-89
90+
N/A
(2005) population (2007)
living alone
2 person household
3 person household
4 person household
5 person household
6 person household
Figure 5: Number of persons living in households with 1 to 6+ persons in 2005 and 2007
6.3 Using a different perspective, Figure 5 shows household occupancy by age group in 2005 and 2007, the horizontal lengths
of the bars representing the sizes of the population in each age group and the shading the number living in 1 person to 6+ person
dwellings. Inspection of the chart shows that there are more

Brent population estimation, household composition and change
16
multiple person dwellings in 2007 compared with 2005 especially
in young to middle age groups. For example, we found 11.7k more persons living in 6+ dwellings compared with 2005, around 80% of
whom were under 50 years old.
7. Household composition and change
7.1 We sub-divided households into eight mutually exclusive
categories described below. Each household is defined by the
occupants of the household of which there are 81 different sub-categories or demographic combinations. For example a household
with two adults and dependent children is defined as ‘family households with dependent children7’ in which both adults are
aged between 20 and 64.
7.2 A household with a person aged 65+ living alone is simply ‘an older person living alone’; an older cohabiting household is one in
which at least one person is 65+. A household with at least one working age adult and at least one person of 65+ and dependent
children is called a ‘three generational household’. Table 4 lists all eight categories.
category description
A family households with dependent children
B single adult households with dependent children
C older cohabiting households
D older person living alone
E three generational households
F cohabiting adult households no children
G single adult households
H other households
Table 4: Household classification and definition
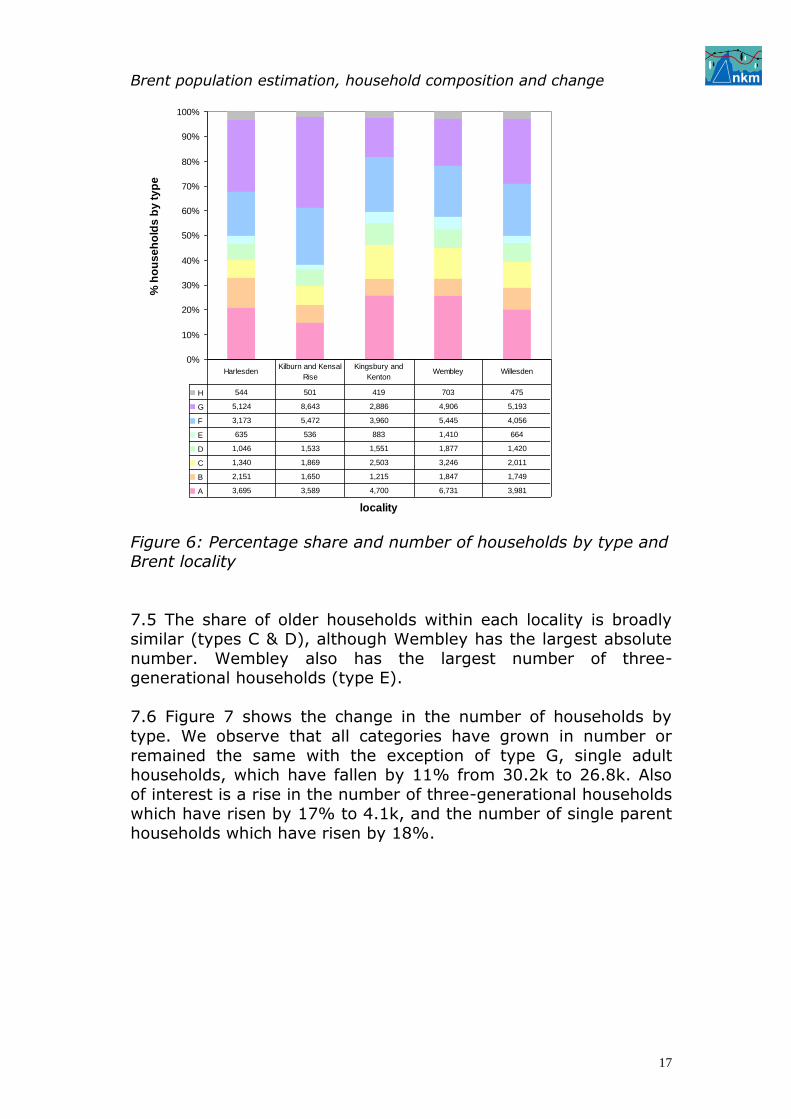
7.3 Of the 105k households in Brent in 2007, 16.8% are in Harlesden, 22.6% in Kilburn, 17.2% in Kingsbury, 24.8% in
Wembley, and 18.6% in Willesden. The share by household type and locality is shown in Figure 6.
7.4 It indicates that Kingsbury has the largest share of two parent
households with dependent children (type A) and Kilburn and Kensal Rise the smallest share. The largest share of single parent
households (type B) is in Harlesden, and the largest share of
single adult households (type G) is in Kilburn and Kensal Rise.
7 Dependent child is defined as 19 or under.
Brent population estimation, household composition and change
17
0%
10%
20%
30%
40%
50%
60%
70%
80%
90%
100%
locality
% h
ou
se
ho
lds
by
ty
pe
H 544 501 419 703 475
G 5,124 8,643 2,886 4,906 5,193
F 3,173 5,472 3,960 5,445 4,056
E 635 536 883 1,410 664
D 1,046 1,533 1,551 1,877 1,420
C 1,340 1,869 2,503 3,246 2,011
B 2,151 1,650 1,215 1,847 1,749
A 3,695 3,589 4,700 6,731 3,981
HarlesdenKilburn and Kensal
Rise
Kingsbury and
KentonWembley Willesden
Figure 6: Percentage share and number of households by type and Brent locality
7.5 The share of older households within each locality is broadly similar (types C & D), although Wembley has the largest absolute
number. Wembley also has the largest number of three-generational households (type E).
7.6 Figure 7 shows the change in the number of households by
type. We observe that all categories have grown in number or
remained the same with the exception of type G, single adult households, which have fallen by 11% from 30.2k to 26.8k. Also
of interest is a rise in the number of three-generational households which have risen by 17% to 4.1k, and the number of single parent
households which have risen by 18%.

Brent population estimation, household composition and change
18
-4000
-3000
-2000
-1000
0
1000
2000
3000
4000
A B C D E F G H
household type
ch
an
ge
be
twe
en
20
05
an
d 2
00
7
Figure 7: Change in the number of Households by type between
2005 and 2007
Benefits by Household type
7.7 Means tested benefits such as Housing Benefit and Council Tax
Benefit are paid according to the income of households rather than the income of individuals. The proportion of households receiving
mean tested benefits is therefore a good indication of income deprivation by household type and of the occupants of the house.
7.8 This is shown in Figures 8 and 9 in which the percentage of
households on benefits is shown on the vertical axis and the number (frequency) of household type is shown on the horizontal
access. The circles in each chart are proportioned to the population within each household category.
7.9 So for example in 2007 there were 22.6k type A households
with a combined population of 108.9k persons. This compares with 20k such households in 2005 which had a combined population of
94.2k persons. It is also estimated that 30.3% of type A
households received benefits in 2007, as compared with 33.0% in 2005. We infer therefore that there are now more family
households than before but with proportionately similar incomes.
7.10 Further inspection shows that although there have been changes in frequency by household type, the percentages on
benefits have in general stayed approximately the same. The most notable changes are to cohabiting adults (type F) where the
percentage has gone down from 22.3% to 17% and in older adults living alone (type D) where the percentage has increased from
47.4% to 50.6%.

Brent population estimation, household composition and change
19
Figure 8: The percentage of households receiving means tested benefit by household type and frequency in 2007. Circles are
proportioned to the populations within each household type.
Figure 9: The percentage of households receiving means tested benefits by household type and frequency in 2005. Circles are
proportioned to the populations within each household type.
2007
0
10
20
30
40
50
60
70
80
90
100
0 5,000 10,000 15,000 20,000 25,000 30,000 35,000
frequency of households
% h
ou
seh
old
s r
eceiv
ing
ben
efi
ts
108.9k
60.1k26.7k
29.2k
24.2k
7.4k
24.9k
7.4k
A E
B F
C G
D H
2005
0
10
20
30
40
50
60
70
80
90
100
0 5,000 10,000 15,000 20,000 25,000 30,000 35,000
frequency of households
% o
f h
ou
seh
old
receiv
ing
ben
efi
ts
94.2k
61.1k
30.2k27.9k
20.0k
7.1k
21.0k
6.5k
A E
B F
C G
D H

Brent population estimation, household composition and change
20
8. Income deprivation analysis by individuals
8.1 In this section we analyse the population by individuals, rather than by household type, in order to examine in more detail income
inequalities in Brent. Although there are no direct data on income at household level a useful proxy for identifying individuals on low
income is measured by whether they live in households receiving means tested benefits.
8.2 In considering individuals rather than households it is
important to reiterate that benefits, such as Council Tax benefit and Housing Benefit, are based on household and not individual
income8. Nevertheless it is reasonable to assume that an individual, whether child or adult, can be deemed to be living on
low income, if the household in which he/she lives receives
benefits.
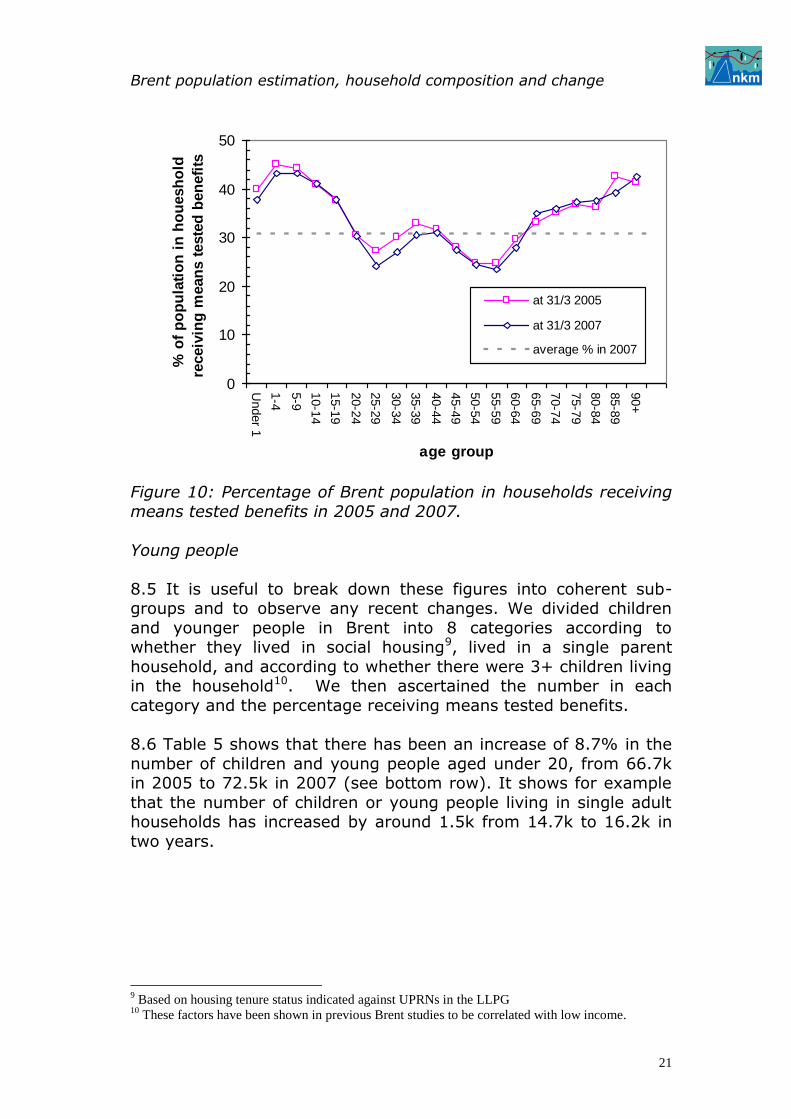
8.3 Using this as a basis for assigning low income to individuals, Figure 10 shows the percentage of persons in Brent in low income
according to age in 2005 and 2007. It shows clearly that children and young people have a higher than average chance of being in
low income households but also older people aged 65+.
8.4 The proportion of working age adults in households in receipt of benefit is below the Brent average, although there is a small
peak in the 35-40 age range mainly representing adults with young families that are eligible for means tested benefits. It is also
noteworthy that there has been some slight change in 2007 with a smaller percentage of adults and very young children on benefits
as compared with 2005.
8 Council Tax Benefit (CTB) provides financial assistance to people on a low income to help them
pay council tax. Housing Benefit (HB) is a benefit for people on a low income to help them pay their
rent, regardless of whether the landlord registered social landlord or a private landlord. Only one
person in a household can claim HB or CTB, and eligibility is based on joint income where people
live together. Housing Benefit and CTB are not paid to persons with assets such as savings, land,
property or anything else which could provide an income unless it is below £16,000, unless the
person receives Pension Credit.
Brent population estimation, household composition and change
21
0
10
20
30
40
50
Under 1
1-4
5-9
10-1
4
15-1
9
20-2
4
25-2
9
30-3
4
35-3
9
40-4
4
45-4
9
50-5
4
55-5
9
60-6
4
65-6
9
70-7
4
75-7
9
80-8
4
85-8
9
90+
age group
% o
f p
op
ula
tio
n i
n h
ou
esh
old
receiv
ing
mean
s t
este
d b
en
efi
ts
at 31/3 2005
at 31/3 2007
average % in 2007
Figure 10: Percentage of Brent population in households receiving
means tested benefits in 2005 and 2007.
Young people
8.5 It is useful to break down these figures into coherent sub-groups and to observe any recent changes. We divided children
and younger people in Brent into 8 categories according to whether they lived in social housing9, lived in a single parent
household, and according to whether there were 3+ children living in the household10. We then ascertained the number in each
category and the percentage receiving means tested benefits.
8.6 Table 5 shows that there has been an increase of 8.7% in the
number of children and young people aged under 20, from 66.7k in 2005 to 72.5k in 2007 (see bottom row). It shows for example
that the number of children or young people living in single adult households has increased by around 1.5k from 14.7k to 16.2k in
two years.
9 Based on housing tenure status indicated against UPRNs in the LLPG
10 These factors have been shown in previous Brent studies to be correlated with low income.

Brent population estimation, household composition and change
22
No. frequency in 2005
frequency in 2007
% change
single adult home
3+ children under
20
living in social
housing
% on benefit
in 2005 (A)
% on benefit
in 2007 (B)
diff (B) -(A)
1 2,206 2,272 3.0 Y Y Y 81.1 79.1 -2.0
2 3,443 4,086 18.7 Y Y 63.4 69.7 6.3
3 5,603 5,916 5.6 Y Y 70.0 67.6 -2.4
4 3,638 3,636 -0.1 Y Y 66.9 66.6 -0.3
5 6,027 6,130 1.7 Y 55.3 52.8 -2.6
6 5,388 6,184 14.8 Y 38.8 44.8 6.0
7 17,114 19,741 15.4 Y 38.8 39.1 0.3
8 23,263 24,507 5.3 21.5 20.3 -1.2
total 66,682 72,472 8.7 41.7 41.1 -0.6
Table 5: A breakdown by risk factor combination of the number of children and young adults in 2005 and 2007 and the percentage in
each group living in households on means tested benefits
8.7 The table also indicates increases in the number of children and young people in single parent households living in private
accommodation (row 2 and row 6). It is also noteworthy that there has been a significant increase in children living in family
households in private accommodation with 3+ children (row 7).
8.8 Table 5 suggests that income deprivation varies significantly depending on different risk factors. For example,
those living in single adult homes, where there are 3+ children or young people under 20 living in social housing,
are worst off. These accounted for 2.3k of the total in 2007 with 79.1% living off mean tested benefits (row 1)
those least income deprived live in families and private
housing with fewer than 3 children. Of these 20.3% were on benefits in 2007 (row 8)
overall the change in the percentage of children living in
households on benefits between 2005 and 2007 has been small, falling slightly from 41.7% to 41.1%
however, it is evident some groups have worsened their
positions relative to others, for example the percentage on
benefits in rows 2 and 6, both single adult private housing, rose by 6%
those whose positions have improved relatively the most
either live in social housing or are 2-adult families in private accommodation (rows 1, 3, 4, 5 and 8).

Brent population estimation, household composition and change
23
8.9 We found that the odds of a child or younger person living being on benefits fell from 3.7 times to 3.2 times if living in social
housing as compared with living in private housing, and that the odds of being on benefits if living in a single parent household
increased from 2.1 to 2.8 times. This appears to suggest therefore a small shift in the pattern of hardship towards single parent
households in private sector accommodation (most probably privately rented).
Older people 60+
8.10 We divided older people aged 60+ in Brent into 8 categories
according to whether they lived alone, were 75+ or lived in social housing. As with children and younger people we ascertained the
number in each category and the percentage living in households
receiving means tested benefits.
8.11 The results are shown in Table 6. It shows that there has been an increase of 7.5% in the number of people aged 60+, from
38.6k in 2005 to 41.7k in 2007 (see bottom row). The number living alone has increased slightly from 8.5k in 2005 to 9k in 2007,
while the number aged 75+ has increased from 11.4k to 12.8k.
8.12 Table 6 suggests that income deprivation varies significantly depending on household type. For example,
those aged 75+ living alone and in social housing have least
income with 81.4 % out of 1.3k on mean tested benefits (up 5% on 2005, row 1)
this is closely followed by people aged between 60 and 74 living in social housing. They totalled 2k in 2007, 76.4% of
whom lived in households on benefits. Their number is up 9.4% compared with 2005 (76.2% of whom were in
households on benefits)
the largest group and also the most income rich are aged between 60 and 74, cohabiting and living in private
accommodation (row 8). They total 20k as compared with 18.9k in 2005; 22.2% of this group live in households on
benefits as compared with 22.8% in 2005.

Brent population estimation, household composition and change
24
No. frequency in 2005
frequency in 2007
% change
living alone 75+
social housing
% on benefit in 2005
(B)
% on benefit in 2007
(A) diff
(A)-(B)
1 1,230 1,295 5.0 Y Y Y 83.0 81.4 -1.6
2 1,865 2,059 9.4 Y Y 76.2 76.4 0.3
3 1,115 1,304 14.5 Y Y 71.9 72.8 0.8
4 3,614 3,943 8.3 Y 63.6 63.3 -0.3
5 2,748 2,757 0.3 Y Y 30.1 33.6 3.5
6 2,693 2,885 6.7 Y 27.4 31.3 3.9
7 6,318 7,453 15.2 Y 26.3 26.3 0.0
8 18,943 19,962 5.1 22.8 22.2 -0.6
total 38,526 41,658 7.5 34.0 34.3 0.3
Table 6: A breakdown by risk factor combination of the number of people aged 60+ in 2005 and 2007 and the percentage in each
group living in households on means tested benefits
8.13 We found that the chances of an older person living in a household getting benefits increased 6.8 times if they live in social
housing (down from 7.2 times in 2005, in the original study), and 1.6 times if they lived alone (up from 1.4 times from 2005). The
odds of getting benefits increased if they were 75+ by 1.3 times,
which is broadly similar to 2005, so very little change overall.
9. Population turnover and change by neighbourhood
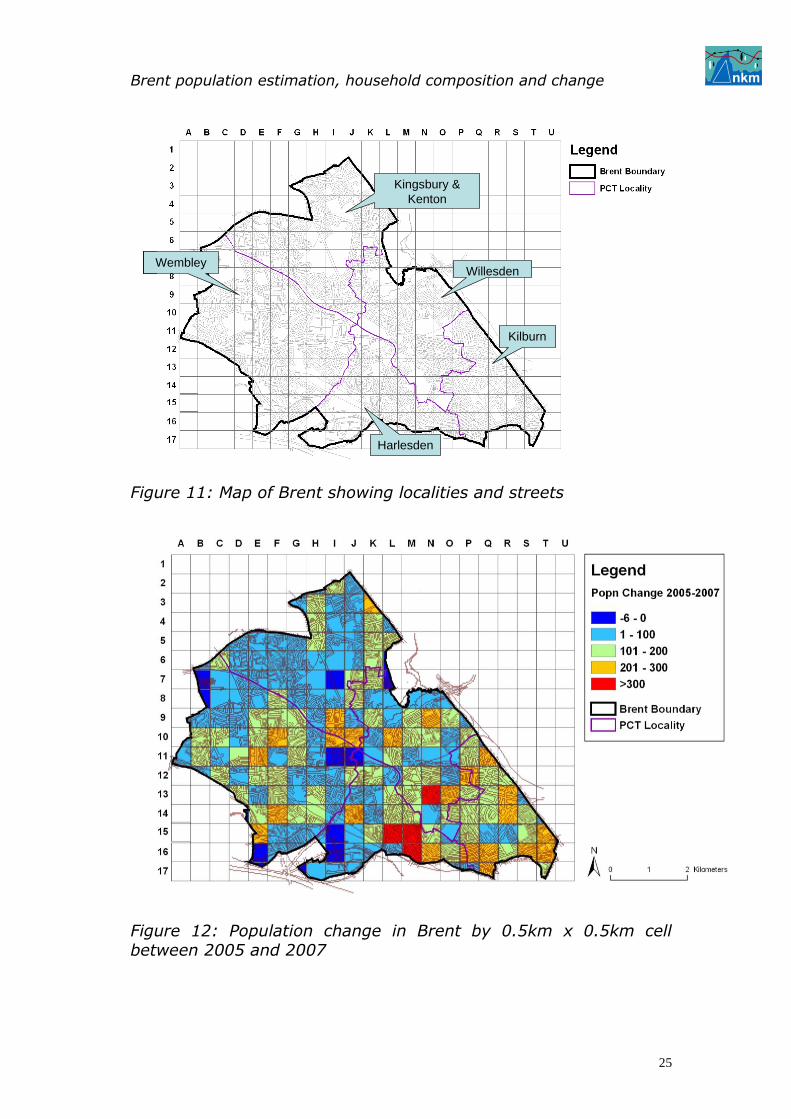
9.1 In considering local changes in population and turnover by household it is helpful to refer to the background map in Figure
11, which shows Brent, the locality boundaries and names of each locality. Overlaid is a grid labelled A, B, C etc to U on the columns
and 1,2,…17 on the rows. A further map and look-up table is given at Annex C linking Brent wards and localities.
9.2 The map key works like a spreadsheet so that cell K11, for
example, can be shown to correspond with the population centre of gravity for Brent (a location just north of the North Circular
Road). Each cell is 0.5k x 0.5km so that 4 cells together equal one
square kilometre and one cell would roughly take about 10 minutes to traverse by foot.
9.3 In the next paragraphs we consider population change within
Brent since 2005 at the cellular level. Figure 12 shows that change has been widespread but with a greater tendency to increase in
the south of the borough. This is confirmed in Figure 13, which shows the change in population in 0.5km step intervals from north
to south in absolute and percentage terms. A trend line through the data for example indicates average increases ranging from 6%
in the north to 9% in the south.
Brent population estimation, household composition and change
25
Figure 11: Map of Brent showing localities and streets
Figure 12: Population change in Brent by 0.5km x 0.5km cell between 2005 and 2007
Kingsbury &
Kenton
Wembley
Harlesden
Willesden
Kilburn
Kingsbury &
Kenton
Wembley
Harlesden
Willesden
Kingsbury &
Kenton
Wembley
Harlesden
Willesden
Kilburn

Brent population estimation, household composition and change
26
0
500
1,000
1,500
2,000
2,500
3,000
3,500
1 2 3 4 5 6 7 8 9 10 11 12 13 14 15 16 17
cell numbers from north to south
po
pu
lati
on
ch
an
ge
no
rth
to
so
uth
0
2
4
6
8
10
12
14
16
18
20
% p
op
ula
tio
n c
han
ge
population change from north to south
% change
Figure 13: Population change in Brent between 2005 and 2007 ranging from north to south
0
500
1,000
1,500
2,000
2,500
3,000
3,500
A B C D E F G H I J K L M N O P Q R S T U
cell reference west to east (0.5kms)
po
pu
lati
on
ch
an
ge w
est
to
east
0
2
4
6
8
10
12
14
16
18
20
% p
op
ula
tio
n c
han
ge population change w est to east
% change
Figure 14: Population change in Brent between 2005 and 2007 ranging from east to west
9.4 The change from west to east is slightly more even than that
from north to south with average growth rates of around 7% in the west rising to 9% in the east, as shown in Figure 14. As the
cell map in Figure 12 confirms, some areas in the south have experienced greater growth than others (e.g. red cells N13, L15,
M15 and N16 in the south of Brent correspond to increases of over 300). The north of Brent by contrast has experienced less or even
negative change as indicated by light and dark blue cells.

Brent population estimation, household composition and change
27
9.5 Population change is not necessarily the best measure for population churn. However, measuring turnover is more difficult
than measuring population change since it is necessary to track every change, individual by individual. This process may be
complicated by gaps in information between dates, poor recording of names or similarities in names and other potentially
confounding data issues.
9.6 We pursued this line of thinking because population churn is a factor in providing different types of services to an area and such
information could be valuable in deciding where to locate certain services (e.g. public call centres, accommodation agents, or
benefit offices). To give an example, an area in which the population has remained static may in fact comprise completely
different people i.e. turnover has been 100%.
9.7 We measured turnover at the household level in the following
way. Suppose a house retained exactly the same people between both points in time, then the turnover is defined as zero % in this
case. Conversely if all the people in that house changed turnover is defined as 100%.
9.8 To take into account intermediate cases we need to combine
both inflow and outflow. We therefore added these together at each address and divided through by the sum of the occupancy at
the two dates11. For example, a property which had replaced half the occupants has a turnover of 50%, but a property which had 4
people, then lost two and gained three would have a turnover of 55.5% (i.e. 100 x (3+2)/(4+5)) and so on. From this basis, we
established the aggregate level of turnover at cell level.
9.9 The result is the average turnover per household per cell and
the outcome is shown in the form of a map in Figure 15. Among other things it shows that turnover rates of around 30% over the
two-year period are not unusual regardless of area. It suggests that the north of Brent typically has lower turnover than the south
of Brent, although there are some relatively static pockets included in the south e.g. cells I15, I16 and I17.
9.10 Figure 15 also shows that the south east corner of Brent has
the most turnover, as indicated by the preponderance of orange and red cells. These areas tend to correlate with neighbourhoods
that are known to have significant amounts of high-density
11
Note that this is analogous to dividing the average of the inflow and outflow by the average
occupancy

Brent population estimation, household composition and change
28
privately rented accommodation (privately rented accommodation
was not specifically analysed, however).
Inflows and outflows
9.11 Whereas turnover is a measure of churn at a household level, population levels are determined by the combination of fertility,
mortality and net migration. In Brent annual deaths have been slowly decreasing for a number of years but it appears that births
and net in-migration have expanded significantly.
Figure 15: Average household turnover by 0.5 x 0.5km cell
9.12 Available administrative data does not allow a detailed
analysis of migration by source and destination, because none of them includes a previous or forwarding address. Additionally,
names may be subject to change, for example as a result of marriage, and there may be gaps in individual records, for
example a missing date of birth or gender.
9.13 By far the best administrative source is the GP register which, after cleaning, provided the backbone of our population estimation
procedure. Crucially the GP register contains an NHS number for each person, which is a unique number issued at birth or at first
registration so that people can be easily linked and traced between years. However, it is not a completely accurate proxy for
migration, because not everybody is registered with a GP and

Brent population estimation, household composition and change
29
some addresses will not be current due to delays in registering
changes of address.
9.14 We used the GP register at both dates to split the population into people: (a) that had the same Brent address in 2005 and
2007; (b) had a different Brent address in 2005 and 2007; (c) had a Brent address in 2005 but not in 2007; (d) had no Brent address
in 2005 but a Brent address in 2007.
9.15 We found that of the 247k confirmed GP-registered people with a Brent address in 2005 with complete information, 14.8k
changed address within Brent between 2005 and 2007 and 47k left Brent (note: includes deaths). This outflow was offset by 60.9k
persons who had no Brent address in 2005 but a Brent address in 2007 (note: includes births). Together this makes a 13.9k
difference in population (6.95k on an annual basis), the 5.5k
balance in overall population movement being identified from data sources other than the GP register.
9.16 The information on flows into and out of Brent based on the
GP register was plotted by age band with the result shown in Figure 16. It shows that inflows are greater than outflows at every
age except at oldest ages. Of particular importance is the inflow of young pre-school children and young adults aged between 20 and
35. The former especially will impact significantly on Brent schools over the next few years.
0
1,000
2,000
3,000
4,000
5,000
6,000
7,000
8,000
9,000
10,000
age group
Bre
nt
infl
ow
an
d o
utf
low
outflow 2005 to 2007
inflow 2005 to 2007
outflow 2005 to 2007 0 2,237 2,285 1,960 2,492 3,567 6,712 6,935 5,368 3,814 2,668 1,866 1,506 1,226 1,102 930 786 617 1,050
inflow 2005 to 2007 3,830 6,430 2,773 2,491 2,619 5,869 9,558 7,783 5,694 4,154 2,887 1,961 1,402 1,019 798 600 364 254 248
<1 1-4 5-9 10-14 15-19 20-24 25-29 30-34 35-39 40-44 45-49 50-54 55-59 60-64 65-69 70-74 75-79 80-85 85+
Figure 16: Inflows and outflows into and out of Brent based on changes of address.

Brent population estimation, household composition and change
30
9.17 Changes at older ages are also of interest and need further analysis than can be provided here. It is possible for example that
the inflows observed are the effect of older relatives moving in with their families (paragraph 7.6 for example noted an increase in
type E, three generational, households).
Ethnicity
9.18 Whilst changes in ethnicity are an important outcome of recent population changes, administrative information on ethnicity
is mainly limited to children attending state schools in Brent and so is not necessarily representative of the wider picture among
pre-school children and young adults where most changes in population have occurred, or among children educated privately or
in neighbouring authorities12.
9.19 Current data show that Asian children form the largest group
at 31.5%, followed by black children (African and Caribbean) 28.5%, then white children at 20.3%, and finally mixed/other,
other children at 19.8%. Based on this limited extract, we found that most changes within the Brent school population segment are
attributable to increases among children with either ‘mixed heritage’ backgrounds or who are from ‘other minority ethnic
groups’ (i.e. non-black or Asian or white) which have grown by 22% since 2005. Although some further information could be
derived by using the available data to analyse joiners and leavers by ethnicity, it was felt that it would be misleading to extrapolate
this information with confidence to the whole population.
10 Conclusions
10.1 The study has shown that official ONS figures underestimate
Brent’s population by 17.7k. The Brent ‘confirmed’ population in this study is 289.1k at 31st March 2007 as compared with the ONS
2006 mid-year estimate of 271.4k. This has a substantial impact on the funding available to the council, Brent PCT and other public
bodies.
10.2 The study also shows that there has been a significant growth in the Brent population. Our previous study of the Brent population
at the 31st of March 2005 found a ‘minimum confirmed population’ of 269.8k, which was considered at the time to be at the bottom
end of what we considered to be the true Brent population.
12
It was recommended after the 2005 study that Brent should seek to share data with neighbouring
authorities to assist in school planning.

Brent population estimation, household composition and change
31
10.3 The availability of additional data in this study, together with
improvements in a number of data sources, including the GP register and housing benefit and council tax data means that the
population count at 31st March 2007 is not directly comparable with the 2005 count in all respects. However, other evidence such
as the growth in pupil numbers, new national insurance registrations, child benefit statistics, increases in properties,
increased births and GP registrations all point to significant population growth.
10.4 The growth in population has been accompanied by changes
in household composition, occupancy and deprivation. There is now 3k fewer single adult households and more 2, 3, 4, 5 etc
households, as a consequence of which occupancy has increased and the vacancy rate decreased slightly. However, there are 2.2k
more UPRNs in 2007 as compared with 2005, without which
housing pressures would have been greater.
10.5 Turning to income deprivation, over the age distribution there was a small fall in the percentage of persons aged 25 to 35 that
received means tested benefits. This could be due to a number of factors including a stronger labour market, more cohabiting adults
without children and so forth.
10.6 In terms of children and young people, there were small reductions in the numbers of children and young people in
households on benefits and a small increase in the number of older people (less than one percentage point in both cases). Within this
overall picture however there have been shifts in the relative positions of different groups.
10.7 For example there were significant increases in the number of single parent households living in private accommodation and the
proportions of these on benefits and a significant increase in the number of family (i.e. two-parent) households with children.
10.8 In terms of older people, we observed a growth in the
number of 75+ as compared with 2005, which could be due to a combination of factors including an accompanying growth in the
number of three-generational households. The effect of this is likely to be increased pressures on health and social care services
in the borough in the short term.
10.9 Population growth has been mainly in the south of the borough in a line south of the Welsh Harp reservoir that includes
south Wembley, Willesden, Harlesden and Kilburn. Most of the
growth is due to inflows to Brent exceeding outflows from Brent

Brent population estimation, household composition and change
32
especially in young pre-school children and adults. These influxes
in turn are having an effect on birth rates, which can be expected to increase over the next few years.
10.10 The scale of the inflows and outflows is significant and
exceeds for example migration within Brent by a considerable margin. The combined effects of these trends continuing will be
further increases in population and therefore more pressures on public services, particularly children’s services and education and
housing.
10.11 Annex D provides information concerning our experiences in using the datasets in this study and any significant changes from
2005 are noted. Continuous improvements in data quality are both desirable and important and so Brent Council and the PCT might
find our comments in these respects helpful.

Brent population estimation, household composition and change
33
Annex A: Population count by age in 2005 and 2007 using administrative data
Age group 2007 2005
Under 1 3,967 3,947
1-4 15,668 13,585
5-9 17,795 16,345
10-14 17,524 16,469
15-19 17,518 16,552
20-24 18,787 18,110
25-29 24,748 21,648
30-34 22,908 21,362
35-39 22,521 21,237
40-44 21,666 19,683
45-49 18,796 17,069
50-54 15,194 13,644
55-59 12,982 12,112
60-64 10,969 10,193
65-69 9,576 9,366
70-74 8,304 7,630
75-79 5,953 5,330
80-84 3,750 3,512
85-89 2,009 1,743
90+ 1,097 1,006
age n/a 17,319 19,248
Total 289,051 269,791

Brent population estimation, household composition and change
34
Annex B: Population count by age and Brent locality in 2007 using
administrative data
Population at 31/03/2007
age groups Harlesden Kilburn
Kingsbury and
Kenton Wembley Willesden total
Under 1 768 713 582 1,146 758 3,967
1-4 3,104 2,754 2,637 4,300 2,873 15,668
5-9 3,416 2,932 3,301 4,961 3,185 17,795
10-14 3,400 2,460 3,604 4,916 3,144 17,524
15-19 3,124 2,364 3,620 5,135 3,275 17,518
20-24 3,083 2,921 3,679 5,543 3,561 18,787
25-29 3,509 4,974 4,384 7,066 4,815 24,748
30-34 3,467 5,179 3,964 6,168 4,130 22,908
35-39 3,855 4,805 3,870 6,019 3,972 22,521
40-44 3,906 4,237 3,763 5,921 3,839 21,666
45-49 3,001 3,261 3,782 5,387 3,365 18,796
50-54 2,160 2,601 3,260 4,513 2,660 15,194
55-59 1,614 2,293 3,041 3,755 2,279 12,982
60-64 1,374 1,872 2,608 3,157 1,958 10,969
65-69 1,345 1,602 2,028 2,879 1,722 9,576
70-74 1,148 1,372 1,816 2,472 1,496 8,304
75-79 736 993 1,316 1,802 1,106 5,953
80-84 404 667 918 1,117 644 3,750
85-89 182 348 560 586 333 2,009
90+ 74 184 343 316 180 1,097
age n/a 3,289 5,386 2,198 3,461 2,985 17,319
Total 46,959 53,918 55,274 80,620 52,280 289,051

Brent population estimation, household composition and change
35
Population change between 31/03/2005 and 31/03 2007
age groups Harlesden Kilburn
Kingsbury and
Kenton Wembley Willesden total
Under 1 26 -12 -62 55 27 34
1-4 494 391 275 568 382 2110
5-9 270 377 177 407 237 1468
10-14 354 88 245 245 143 1075
15-19 218 176 193 281 234 1102
20-24 309 86 200 225 273 1093
25-29 438 426 624 1140 700 3328
30-34 159 548 392 450 178 1727
35-39 185 590 154 247 214 1390
40-44 519 666 165 380 337 2067
45-49 470 420 243 363 310 1806
50-54 347 339 223 376 318 1603
55-59 167 220 117 269 148 921
60-64 62 213 272 163 88 798
65-69 56 94 28 -43 100 235
70-74 164 163 138 145 91 701
75-79 93 58 105 230 167 653
80-84 68 86 53 61 16 284
85-89 31 57 90 86 43 307
90+ 14 36 42 32 30 154
age n/a -879 -673 284 -198 -466 -1932
Total 3565 4349 3958 5482 3570 20924 Note: Excludes 1,664 persons in 2005 with un-assignable addresses
Annex C: Ward and locality look-up table and map
Locality Ward Name
Harlesden Harlesden
Kensal Green
Stonebridge
Kilburn and Kensal Rise Brondesbury Park
Kilburn
Mapesbury
Queens Park
Kingsbury and Kenton Barnhill
Fryent
Kenton
Queensbury
Wembley Alperton
Northwick Park
Preston
Sudbury
Tokyngton
Wembley Central
Willesden Dollis Hill
Dudden Hill
Welsh Harp
Willesden Green

Brent population estimation, household composition and change
36
Figure C1: Look- up map showing Brent wards and localities

Brent population estimation, household composition and change
37
Annex D: Data quality issues arising Database Original
number of records
Addresses UPRNs Date of birth Forename Surnames Gender Comments Comparison with 2005
GP register
352,831 64% of those not assigned a UPRN is due to incomplete addresses – missing flat numbers etc
25,793 could not be assigned a UPRN due to poor addressing
OK OK OK OK All registered patients with a Brent postcode. 3,742 have an ‘unallocated’ NHS Number. 901 duplicate people removed – but with different NHS numbers
GP Register base increased from 333,438 in 2005 to 352,831 in 2007.
Births 3,516 (06-07)
10% on the original 2005-7 file have missing addresses, or addresses outside Brent
14% on original file could not be assigned a UPRN
OK OK OK OK
Deaths 909 (06-07)
67% on the original 2005-7 file have missing addresses, or addresses outside Brent
70% on original file could not be assigned a UPRN
OK OK OK OK
Electoral register
195,505 66% of those not assigned a UPRN is due to incomplete addresses
4,306 records do not have UPRNs
N/A – only if 16/17
OK OK N/A 47,636 ER records not used in PE 2007 (24.4%) – similar to 2005.
Full unedited version provided in 2007, so much larger than in 2005; 47,636 records not found on GP Register or unallocated UPRNs (approx same % as 2005). Does not mean they are not on this or other datasets because ER has only limited identification information e.g. no date of birth. However, should benefit from being checked and cleaned.

Brent population estimation, household composition and change
38
Database Original number of records
Addresses UPRNs Date of birth Forename Surnames Gender Comments Comparison with 2005
PLASC 41,751 82% of those not assigned a UPRN is due to addresses that appear to be outside of Brent
8,056 have no UPRN
OK OK OK OK Not all live in Brent. PLASC @ January 2007 – 2 months before population snapshot.
PLASC 2007 now has full addresses There is no record available for children living in Brent that go to school outside Brent or for children attending independent schools. Brent should seek to share PLASC data with neighbouring authorities.
HWL 53,818 Problems with addresses missing a flat number or with a flat number not on the LLPG, or addresses outside of Brent
7,962 have no UPRN
OK OK OK OK May be more than one name in the name field, which is difficult to extract.
Dob and gender now available for applicants and dependants – only dependants in 2005
Housing Benefit
65,953 Most UPRNs already provided
Only 245 do not have a UPRN
OK OK OK N/A Different format in 2007: a separate file of 65,593 people who are Housing Benefit claimants or dependants/partners. Most of file already address matched by CT.
Council Tax Properties - Liable
106,528 Most UPRNs already provided
Only 404 do not have a UPRN
31% have a DoB
6,766 have no forename or initial
OK N/A Named person e.g. landlord does not necessarily live at address.
Different format in 2007: 30,607 properties listed as receiving CT Benefit, CT Benefit list much reduced (fewer ‘ghosts’) from 2007. 184, 209 people listed in 2005 as compared with 106,528 in 2007 (i.e. one for each address). Most of 2007 file already address matched by CT
Local property gazetteer
108,246 Not applicable
Not applicable
Not applicable
Not applicable
Approximately 2,000 more UPRNs on residential and mixed LLPG in 2007 than 2005. No problems in 2007 with excluding those with an end date or any additional properties to be added on.