breaking up prolonged sitting with standing or walking ... up...breaking up prolonged sitting with...
TRANSCRIPT

1
Breaking up prolonged sitting with standing or walking attenuates the postprandial metabolic response in post-menopausal women: A randomised acute study
Running title – Breaks in sitting time and metabolic risk Authors and Affiliations - Joseph Henson1,2 PhD, Melanie J. Davies1,2 MD, Danielle H. Bodicoat1,2,3 PhD, Charlotte L. Edwardson1,2 PhD, Jason M.R. Gill4 PhD, David J. Stensel2,5 PhD, Keith Tolfrey2,5 PhD, David W. Dunstan6,7 PhD, Kamlesh Khunti3 MD, Thomas Yates1,2 PhD 1 Diabetes Research Centre, University of Leicester, UK 2 NIHR Leicester-Loughborough Diet, Lifestyle and Physical Activity Biomedical Research Unit, UK 3 NIHR Collaborations for Leadership in Applied Health Research and Care (CLAHRC) East Midlands, UK and Diabetes Research Centre, University of Leicester, UK 4 Institute of Cardiovascular and Medical Sciences, University of Glasgow, UK 5 School of Sport, Exercise and Health Sciences, Loughborough University, UK 6 Baker IDI Heart and Diabetes Institute, Melbourne, Victoria, Australia 7 Mary MacKillop Institute of Health Research, Australian Catholic University, Melbourne, Victoria, Australia
Main text word count =4326; Number of Tables = 1; Number of Figures = 3; Number of references = 40 Number of supplemental tables= 9; Number of supplemental figures= 1 Corresponding Author: Joseph Henson Leicester Diabetes Centre Leicester General Hospital Leicester LE5 4PW UK Email address: [email protected] Tel: +44 116 258 4389. Fax: +44 116 258 4053.

2
Objective
To determine whether breaking up prolonged sitting with short bouts of standing or walking
improves post-prandial markers of cardio-metabolic health in women at high risk of type 2
diabetes.
Research Design and Methods
Twenty-two overweight/obese, dysglycaemic, postmenopausal women (mean age ± SD:
66.8±4.6 years) each participated in two of the following treatments; prolonged, unbroken
sitting (7.5 hours) or prolonged sitting broken up with either standing or walking at a self-
perceived light-intensity (for 5 minutes every 30 minutes). Both allocation and treatment
order were randomised. The incremental area under the curves (iAUC) for glucose, insulin,
non-esterified fatty acids (NEFA) and triglycerides were calculated for each treatment
condition (mean ± SEM). The following day, all participants underwent the 7.5 hours sitting
protocol.
Results
Compared to a prolonged bout of sitting (iAUC 5.3±0.8mmol/L•h), both standing (3.5±0.8)
and walking (3.8±0.7) significantly reduced the glucose iAUC (both p<0.05). When
compared with prolonged sitting (548.2±71.8mU/L•h), insulin was also reduced for both
activity conditions (standing: 437.2±73.5; walking: 347.9±78.7; both p<0.05). Both standing
(-1.0±0.2mmol/L•h) and walking (-0.8±0.2) attenuated the suppression of the NEFA
compared with prolonged sitting (-1.5±0.2); both p<0.05. There was no significant effect on
triglyceride iAUC. The effects on glucose (standing and walking) and insulin (walking only)
persisted into the following day.
Conclusions
Breaking up prolonged sitting with 5-minute bouts of standing or walking at a self-perceived
light-intensity reduced postprandial glucose, insulin and NEFA responses in women at high
risk of type 2 diabetes. This simple, behavioural approach could inform future public health
interventions aimed at improving the metabolic profile of post-menopausal, dysglycaemic
women.
3
Sedentary behaviour, now commonly conceptualised as sitting during waking hours with low
energy expenditure (1), has recently emerged as an independent determinant of morbidity
(particularly type 2 diabetes) and mortality (2-4). Multiple observational studies have also
demonstrated a positive association between objectively measured sedentary time and
markers of diabetes risk, independent of the amount of moderate-to-vigorous physical activity
(MVPA) undertaken (5-7). This suggests that sedentary behaviour is likely to be a distinct
risk factor for type 2 diabetes and a potential target for lifestyle intervention. This is
important as individuals at high risk of type 2 diabetes spend around 70% of their waking
time sedentary, with 25% in light activity and <5% engaged in MVPA (6). Moreover, the
inverse correlation between sedentary behaviour and MVPA is weak (7), further suggesting
these are independent behaviours. However, experimental data are needed to determine
whether a causal relationship exists between modifications to sedentary time and metabolic
health.
Recently, experimental studies which have broken up prolonged sitting with short periods of
light or moderate intensity activity have been shown to reduce postprandial glucose and
insulin concentrations in both healthy and overweight adults (8-11). These studies suggest
that important health-related metabolic processes occur when individuals transition from
sitting to movement (light and moderate intensity). However, it is unclear whether moving
from sitting to standing provides a sufficient stimulus to elicit metabolic benefits. Whilst
there is emerging evidence that sustained bouts of standing may improve glucose regulation
(12, 13), it is not clear whether breaking up prolonged sitting with intermittent short bouts of
standing might improve the metabolic health of individuals at high risk of chronic disease.

4
Therefore, the aim of this study was to establish whether breaking up prolonged sitting
through frequent short bouts of standing or walking activity modulates postprandial
metabolic responses in individuals at high risk of type 2 diabetes.
Research Design and Methods
Study design
A balanced incomplete block design was utilised for this study (14). Such designs have been
used in pharmaceutical trials and reduce participant burden whilst minimising the intra-
subject effect, thus increasing the sensitivity of the outcome (15, 16). With this design,
participants were randomised to two of the three following treatment conditions: 1)
prolonged, unbroken sitting (7.5 hours); 2) prolonged sitting broken up with standing for 5
minutes every 30 minutes or 3) prolonged sitting broken up with walking for 5 minutes every
30 minutes (Supplemental Table S1). Regardless of the treatment condition carried out on
day 1, all participants underwent the prolonged sitting protocol on day 2, thus each treatment
condition was carried out over two consecutive days. As an acute bout of physical activity
may enhance insulin sensitivity for up to 48 hours (17), we used a minimum wash-out period
of 7 days between each condition (the maximum wash-out was 22 days).
Participants attended five separate visits to the Leicester Diabetes Centre, Leicester, UK.
Supplemental Figure 1 describes the study design. One to two weeks after an initial
familiarisation visit, participants were randomised by an independent third party to one of six
sequences, prepared by the study statistician prior to recruitment of the first participant
(Supplemental Table S1).

5
The study is registered with clinicaltrials.gov (NCT02135172). Informed consent was
obtained from all eligible participants and ethical approval was obtained from the
Northampton Research Ethics Committee.
Participants
A total of 34 participants were recruited between January 2014 and October 2014. Post-
menopausal women at high risk of developing type 2 diabetes were identified from studies
previously conducted within the Leicester Diabetes Centre (18, 19). This cohort was included
in order to negate the impact of hormone variations and as associations between sedentary
behaviour and markers of cardio-metabolic health have previously been shown to be stronger
in women (20).
Eligibility criteria included: overweight or obese (BMI ≥27.5 kg/m2 or ≥25 kg/m2 if south
Asian), post-menopausal women (12 consecutive months without menstruation (21)), aged
50-75 years with screen detected impaired glucose regulation (IGR) identified within the 12
months prior to the invitation letter being sent. IGR was defined as 2 hour post-challenge
glucose ≥7.8mmol/L to <11.1mmol/L following a standard oral glucose tolerance test (22), or
HbA1c between 5.7-6.4% (39-46mmol/mol) inclusive (23). Exclusion criteria were regular
purposeful exercise (≥150 minutes of objectively measured MVPA over a typical week),
inability to communicate in spoken English, steroid use, known type 2 diabetes, or currently
taking hormone replacement medication.
In total, 30 participants were randomised (Figure 1). Causes of drop out between
familiarisation and randomisation are detailed in Figure 1. A further 8 individuals were

6
excluded after randomisation, due to cessation of the venous cannula line which resulted in
less than 50% of data collection (n=5), illness (n=2), or a change in personal circumstance
(n=1). This left 22 participants that were included in the analysis. There were no significant
differences in BMI, age or HbA1c between those who dropped out or were excluded and
those who were included in the study.
Familiarisation visit
Before participating in the experimental protocol, all participants visited the Leicester
Diabetes Centre for a familiarisation visit where they provided informed consent. This
allowed participants to become accustomed to the walking speed and also familiarize
themselves with the Borg rating of perceived exertion (RPE) scale (24). A venous blood
sample was also taken for HbA1c, lipid profile, and non-esterified fatty acids (NEFA)
analysis.
Body mass (Tanita TBE 611, Tanita, West Drayton, UK), waist circumference (midpoint
between the lower costal margin and iliac crest), and height were measured, to the nearest
0.1kg, 0.5cm and 0.5cm respectively.
Participants also wore an accelerometer (placed on the right anterior axillary line) for seven
days after familiarisation (Actigraph GT3X+, Pensacola, FL, USA) to measure time spent
engaged in sedentary, light or MVPA, under free-living conditions.

7
Experimental regimen overview
Participants were asked to record all food and drink consumed the day before the first
experimental condition. They were then asked to replicate this diet before subsequent
treatments. Participants were also requested to avoid alcohol, caffeine and any MVPA for
two days prior to each experimental condition.
Participants arrived at the laboratory by car (08:00) after a 10 hour fast and had a cannula
fitted into an accessible vein. A fasting blood sample (9ml) was then taken (time point: -1 h)
for the quantification of glucose, insulin, NEFA and triglycerides. Participants were asked to
sit quietly for 60 minutes and a further 9ml blood sample was taken. A standardised mixed-
meal breakfast (croissant, butter, cheese, double cream, skimmed milk and a meal
replacement drink (Complan, Nutricia Limited, Wiltshire, UK)) was consumed (09:00; 0 h)
providing 0.66g fat, 0.66g carbohydrate and 0.4g protein per kg of body mass (58% fat, 26%
carbohydrate and 16% protein). The time taken to consume the meal (≤15 minutes) was
recorded and replicated in subsequent conditions. Blood was sampled again at 30, 60, 120
and 180 minutes postprandially. Lunch, with an identical nutrient composition to breakfast,
was consumed at 12:00 with blood samples at 30, 60, 120, 180 and 210 minutes
postprandially. The research staff supervised participants throughout each study cycle to
ensure full compliance with the trial protocols. Participants consumed water ad libitum
during the first of the experimental conditions and were then asked to replicate the volume
ingested in subsequent conditions.

8
Experimental Regimens – Day 1
Experimental Condition: Prolonged sitting (7.5 hours)
During the prolonged sitting condition, walking and standing was restricted (lavatory visits
were conducted via a wheelchair). Participants sat in a designated room equipped with a
chair, desk and access to books, magazines and internet services.
Experimental Condition: Sitting (total 6.5 hours) + Standing (total 60 minutes)
This followed the same procedure as the sitting condition except that participants were
instructed to break their sitting time by standing close to their chair for 5 minutes, every 30
minutes. Individuals were asked to stand in the same, fixed position. In total, individuals
accumulated 12 bouts (60 minutes) of standing.
Experimental Condition: Sitting (total 6.5 hours) + Walking (total 60 minutes)
This was similar to the standing condition, but sitting time was punctuated with 5 minute
bouts of walking at a self-perceived light intensity on a treadmill (Spazio Forma Folding
Treadmill, TechnoGym UK Ltd, Bracknell, UK). During the first bout of walking,
participants were gradually taken up to a speed that registered between 10 and 12 on the Borg
RPE scale (24), up to a maximum of 4.0 km/h. This speed was fixed and replicated for all
other intervals. In total, individuals accumulated 12 bouts (60 minutes) of walking.

9
The average treadmill speed during the walking condition was 3.0km/h (range =1.5-4.0km/h)
with an average RPE score of 10 (range 8-12).
Experimental Regimens – Day 2 (Prolonged sitting – 7.5 hours)
To determine whether any acute effects of standing and walking persisted into the next day,
participants returned to the laboratory (08:00) following another 10 h fast to undergo the
prolonged sitting protocol (including the same standardised meals and timings). They were
asked to consume exactly the same meal as the previous evening – whilst again avoiding
alcohol, caffeine and MVPA.
Sedentary, physical activity and posture data
Participants were asked to wear an accelerometer (Actigraph GT3X+, Pensacola, FL, USA)
and an activPAL professional physical activity monitor (PAL Technologies, Glasgow,
Scotland), during experimental conditions and an accelerometer for 7 days before each
experimental condition (Supplemental Figure 1).
ActivPAL proprietary software (activPAL Professional V5.9.1.1) was used to create
processed csv files.
For accelerometer data collected over each 7 day period, non-wear time was defined as a
minimum of 60 minutes of continuous zero counts and days with at least 10 h of wear time
were considered valid (5, 6). Valid data required at least three valid days (25). Freedson cut
points were used to categorise activity intensity (26). Accelerometer data were analysed using

10
a bespoke tool (KineSoft version 3.3.76, KineSoft, New Brunswick, Canada;
www.kinesoft.org).
Biochemical analysis
Plasma glucose and serum triglyceride concentrations were determined using standard
enzymatic techniques with commercially available kits (Beckman, High Wycombe, UK). The
measurement of plasma NEFA involved a three stage colorimetric assay using a
commercially available kit (RX Monza, Randox Laboratories, County Antrim, UK). Glucose,
triglycerides and NEFA were analysed on the day of collection.
Insulin samples underwent centrifugation to separate plasma within 15 minutes of collection.
Plasma was stored at -80oC and analysed at the end of data collection using an enzyme
immuno-assay (Mercodia, Sweden). All measurements and analysis were undertaken by
individuals blinded to experimental condition and independent of the scientific advisory
team.
Sample size
The primary outcome was incremental postprandial area under the glucose curve (iAUC) on
day 1. Allowing for an intervention effect of a 20% change in glucose iAUC, a standardised
difference of 1 (where the SD is equivalent to the anticipated intervention effect), a within-
person correlation of 0.3, 90% power, and an alpha of 0.025 (allowing for two primary
comparisons against control conditions), we estimated that we would require 12 participants
for a complete 3-treatment, 3-period crossover design. Twice as many participants were

11
required for the 3-treatment, 2-period balanced incomplete block design (27), and a 20%
drop-out rate was allowed for; therefore we aimed to recruit 30 participants with 24 needed to
complete the trial. Estimates were based on previous experimental research (8), and with
consideration given to the high risk nature of our cohort where a greater effect was
anticipated.
Statistical Analyses
In line with best practice for acute studies where fasting physiology does not change,
outcomes were calculated as iAUC rather than total AUC (28). Values were determined using
the trapezium rule and by subtracting fasting levels from the overall postprandial response.
Participants were excluded if they had over 50% of blood samples missing across any
treatment condition (n=5). Missing outcome data for remaining participants were imputed
using a regression model with key predictor variables (BMI, age, fasting values, ethnicity and
treatment) for each time point and outcome. Imputation was used to correct for verification
bias (29). Across all experimental conditions, 11% of data values (378/3472) were missing
and imputed (Supplemental Table S2)On average, participants were missing 2 (1-4) (median
(IQR) values across all experimental days and biochemical variables.
Multilevel mixed-effects linear regression was used to look at the difference between groups
in the continuous outcome measures (glucose, insulin, NEFA, triglycerides) allowing for
repeated measurements from the same individuals. In these models, treatment was modelled
as a fixed factor and participant as a random factor. The primary analysis involved comparing
standing and walking against the control (prolonged sitting) condition. Tests between

12
treatment conditions (standing vs. walking) were conducted for exploratory purposes and
form a secondary outcome for the study.
All data were analysed using STATA (version 13.0; StataCorp, College Station, TX). A p-
value of <0.05 was considered statistically significant. Descriptive data are reported as mean
± SD in text and tables, unless otherwise stated, and as mean ± SEM in Figure 2, Figure 3 and
Supplemental Tables S3-S6.
In order to aid interpretation of the results, a sensitivity analysis was conducted to investigate
whether results were affected by analysing the total AUC (including fasting values).
Furthermore, we also investigated whether fasting values differed between day 1 and day 2
(Supplemental Table S7).
Results
Anthropometric, biochemical and demographic information of the included participants are
displayed in Table 1.
Experimental Regimens – Day 1
Biochemical results collected on day 1 (for each experimental condition) are presented in
Figure 2, with the corresponding numerical values displayed in Supplemental Table S3.
The mean glucose iAUC response (iAUC) was 5.3±0.8mmol/L•h in the prolonged sitting
condition. Breaking sitting time with 5 minutes of standing, every 30 minutes, reduced the

13
glucose iAUC by 34% (3.5±0.8mmol/L•h, p=0.022) compared with prolonged sitting.
Similarly, walking reduced the glucose iAUC by 28% (3.8±0.7mmol/L•h, p=0.009)
compared with prolonged sitting.
A similar pattern of results were observed for insulin and NEFA on day 1. The insulin iAUC
was reduced by 20% (437.2±73.5mU/L•h, p=0.045) when breaking sitting time with standing
and by 37% (347.9±78.7mU/L, p=0.008) when it was broken with walking compared with
prolonged sitting (548.2±71.8mU/L•h). Breaking sitting time with standing attenuated the
suppression of the NEFA iAUC by 33% (-1.0±0.2mmol/L•h, p=0.024), and with walking by
47% (-0.8±0.2mmol/L•h, p=0.003) compared with prolonged sitting (-1.5±0.2mmol/L•h).
There were no significant differences between the standing and walking conditions for any of
these outcomes (glucose p=0.717, insulin p=0.376, NEFA p=0.398).
Conversely, neither standing (6.2±0.8mmol/L•h) nor walking (6.1±0.8mmol/L•h)
significantly reduced the triglyceride iAUC compared with the sitting condition
(5.6±0.7mmol/L•h) on day 1.
Experimental Regimens – Day 2 (Prolonged sitting – 7.5 hours)
17 participants completed the second day due to problems with intravenous cannulation.
Biochemical results for day 2 are presented in Figure 3 with the corresponding numerical
values displayed in Supplemental Table S4.

14
Day 2 yielded a mean net glucose response of 4.8±0.6mmol/L•h if participants had
undertaken the sitting condition on day 1. Breaking sitting time with standing on day 1
elicited a response of 3.9±0.8mmol/L•h on day 2 (19% reduction in iAUC compared to
sitting, p=0.039). Similarly, walking carried out on day 1 reduced the glucose iAUC by 17%
on day 2 (4.0±0.7mmol/L•h, p=0.027). There was no significant difference between the
standing and walking conditions (p=0.877).
The mean net insulin response was 464.6±70.2mU/L•h if participants had undertaken the
sitting condition on day 1. The significant results for standing on day 1 did not persist into the
second day (363.5±57.5mU/L•h, p=0.325). In contrast, results for walking persisted into day
2 (354.3±57.3U/L•h p=0.038). There was no significant difference between the standing and
walking conditions (p=0.529).
There was no difference in triglyceride response between the prolonged sitting
(7.2±0.5mmol/L•h) and standing conditions (7.2±0.8mmol/L•h, p=0.603) on day 2. Results
for the walking condition (6.0±0.7mmol/L•h, p=0.077) neared significance compared to
prolonged sitting.
The effects of standing and walking on NEFA were no longer significant on day 2 (standing:
-1.0±0.3mmol/L•h, p=0.161; walking: -1.0±0.3mmol/L•h, p=0.144) when compared to
prolonged sitting (-1.5±0.2mmol/L•h).
15
Sensitivity analysis
The pattern of results and significance levels were largely unaffected if the data were
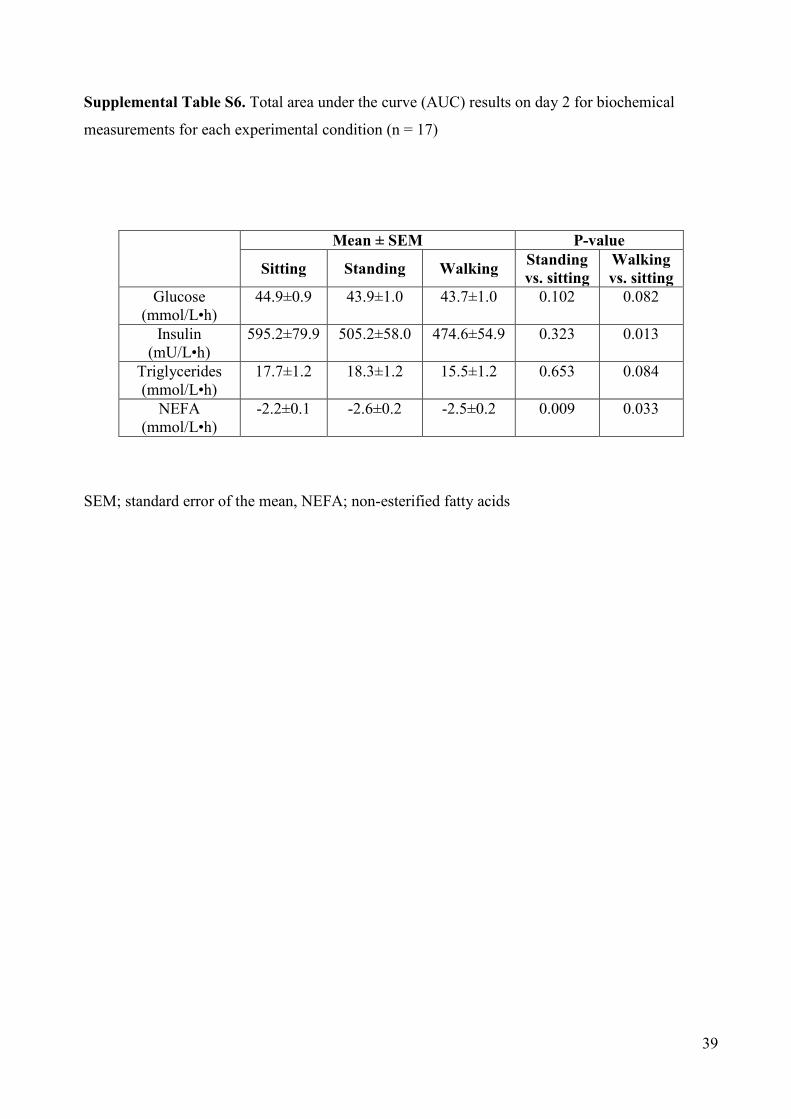
analysed using total AUC on day 1 (Supplemental Table S5). However, total AUC on day 2
failed to reach significance for both glucose (standing and walking condition) and insulin
(standing only) (Supplemental Table S6). Conversely, results for NEFA became significant
for both standing and walking. There were no significant differences between any fasting
values on day 1 or day 2 (Supplemental Table S7).
Sedentary and physical activity data
Free-living accelerometer data collected after the familiarisation visit (n=22) (Supplemental
Table S8) showed that participants spent 594±80 minutes per day sedentary (71.5% of total
wear time) and only engaged in modest amounts of MVPA (19±10 minutes per day; 2% of
total wear time); there was no difference in these behaviours for the 7-days prior to each
experimental conditions (p>0.05).
The Actigraph and activPAL monitor data recorded during the experimental conditions
confirmed that compliance to the protocol was high (Supplemental Tables S8 and S9).
Participants took an average 6±2 steps and 252±18 steps during each 5-minute standing and
walking bout respectively.

16
Conclusions
In overweight, post-menopausal women with dysglycaemia we observed that interrupting
periods of prolonged sitting with 5 minutes of standing every 30 minutes elicits similar
changes to postprandial glucose metabolism as breaking up sitting with identical periods of
self-perceived light-intensity walking. Compared with uninterrupted sitting, standing reduced
the postprandial rise in glucose by 34% (compared with a 28% reduction for walking) and the
postprandial rise in insulin concentrations by 20% (37% for walking) on the day of the
intervention. Moreover, the observations for glucose (standing and walking) and insulin
(walking only) persisted into the next day.
These data build on previous work in overweight men and women (8) reporting similar
glucose and insulin postprandial responses after light and moderate intensity walking. The
present findings extend these observations by suggesting that metabolic benefits are also
accrued when regularly breaking up prolonged sitting by moving from a sitting to a stationary
upright posture.
To date, four other studies have examined the acute effect of standing on postprandial
glucose and insulin responses (12, 13, 30, 31). Two of these found that breaking prolonged
sitting with regular standing breaks had no impact on postprandial glucose (30, 31) and
insulin (30) in young healthy men. In contrast, alternating 30 minute bouts of sitting and
standing throughout the day has been shown to significantly reduce the iAUC between trial
conditions for postprandial glucose (11% reduction compared to prolonged sitting) (12). A
non-randomised office-based study also found that glucose levels were reduced by 43%
following an afternoon of standing compared with seated computer work (13). The fact that

17
our study reported effects that were towards the upper end of those reported in previous
studies, whilst employing substantially smaller doses of standing, is likely to be driven by
differences in sample characteristics and potentially the increased frequency in interruptions
to prolonged sitting. Other studies have been conducted in groups that are broadly
representative of the general population (age <50 years, BMI <30kg/m2), whereas our
participants were older with existing dysglycaemia who represent those likely to be referred
into diabetes prevention pathways. This is particularly important given the prominence of
national and international strategies highlighting the need for identification and subsequent
referral of individuals at high risk of type 2 diabetes (32, 33).
Another novel finding was that reductions in glucose and insulin responses following the
breaking up of prolonged sitting were maintained into the second observation day. Glucose
remained 19% lower after the standing condition and 17% lower after the walking condition.
Similarly, insulin remained 24% lower after the walking condition. These findings are
consistent with a previous experimental study carried out in obese adults showing that a
single bout of modest exercise (50% VO2 peak on a stationary cycle ergometer) increased
insulin sensitivity into the next day (11). A similar study also demonstrated that the morning
after a prolonged bout of sitting (17 hours), participants exhibited a significant reduction
(39%) in whole-body insulin action compared to upright light-intensity activity (10). Our
findings indicate that an even lower activity stimulus (e.g.: standing) may yield metabolic
advantages for a minimum of 24 hours.
The mechanisms underpinning the effects of standing and walking on glucose and insulin
levels requires further elucidation. Acute and chronic light-intensity physical activity training
studies have consistently demonstrated improvements in markers of glycaemic control in
18
those with dysglycaemia, with similar effects observed between light and moderate intensity
exercise training regimes, when matched for total volume (34). However, it has not been
established whether the specific mechanisms involved in enhancing peripheral glucose uptake
that have been shown for MVPA, primarily through the translocation and turnover of GLUT-
4 (35), are observed with walking at a self-perceived light intensity or standing.
The attenuated postprandial suppression in plasma NEFA concentration observed on day 1 of
this study for both the standing and walking is likely to reflect an increase in the lipolysis of
triglycerides stored in adipose tissue in order to supply the working muscle. Moreover, the
reduction of insulin in the standing and walking conditions suggests that suppression of
lipolysis, driven by the antilipolytic properties of insulin (36), may have been reduced in
these conditions. Previous studies have shown that during low-intensity exercise, adipose
tissue lipolysis increases four-to fivefold above resting levels (37). Others have also reported
that lipolysis and mobilization of NEFA resulting from exercise are related to, and may be
enhanced by, hormonal changes, particularly increased catecholamines levels (38).
We found no change in the triglyceride iAUC for the standing and walking conditions on
either day 1 or day 2 of the experimental regimens. The non-significant results on day 1 are
consistent with previous studies that have shown no effect (9, 12). Decreased triglyceride
levels were observed on day 2 following the walking condition, although the changes were
not statistically significant (17% reduction compared to sitting, p=0.077). However, the
magnitude of the effect for walking on day 2 was consistent with previous studies
demonstrating that walking (both intermittent and continuous) elicited reductions in the
postprandial triglyceride levels the following day (16-23% reduction). Our results corroborate
19
with other findings suggesting that standing is not a sufficient stimulus to reduce postprandial
triglyceride levels (12, 30).
This study has a number of strengths. Firstly, we studied postmenopausal women at high risk
of type 2 diabetes, so the findings are directly relevant for public health guidance and
interventions for metabolic risk reduction. Secondly, this is the first study to directly compare
the effects of breaking up prolonged sitting with standing and walking, demonstrating that
they both induce cardio-metabolic benefits. Moreover, by employing a two day protocol we
were able to determine that the acute effects of standing and walking persisted into the
following day. Our study also highlights the importance of reporting both iAUC and total
AUC in experimental studies that assess outcomes over several days. Although results on day
1 were unaffected by the analysis method there were small differences in interpretation on
day 2. Notwithstanding the non-significant differences in mean fasting levels on day 2, it is
possible that the intervention conditions had a subtle effect on fasting pathophysiology that
subsequently influenced total AUC. As such, results should be interpreted in relation to the
method used; for this study the primary focus was on the postprandial response (iAUC).
Finally, all measurements were performed by the same team of trained staff, following
identical standard operating procedures and analysis was conducted by individuals blinded to
treatment allocation.
This study has several important limitations. Firstly, the acute nature of the trial prohibits
inferences about longer-term chronic effects. Secondly, the test meals used were relatively
high in fat (58% of total energy) and further studies are needed in order to determine whether
the findings persist when meals with a macronutrient composition more representative of
dietary recommendation are consumed. However, the macronutrient composition of food was

20
almost identical to that which may be plausibly consumed by the general population through
a meal or as a snack. For example, based on an 80kg individual the standardised meal used in
this study is equivalent to 46g brown bread, 6g butter, 100g bacon and a 59g chocolate bar
(39). Studies have also indicated that the recommended daily intake of fat is often exceeded
by many adults (40). We also relied upon participants to record and standardise their own
food intake the day before and in-between each experimental conditions for practical reasons,
therefore misreporting is possible. Similarly, no physical activity data was recorded between
day 1 and day 2. Thirdly, the prolonged nature of the sitting condition may not reflect
habitual behaviour for many individuals where some standing or light movement would be
expected over an 8 hour period. Nonetheless, it was important to initially establish a proof of
concept where standing and walking effects are observed compared to a prolonged
standardised bout of sitting. Future studies should also focus on whether the effects observed
in this study are replicated under free living scenarios. The reduced sample size (and
subsequent underpowered comparison) particularly pertaining to comparisons on day 2
increased the risk of a type 2 error and thus limits the conclusions that can be drawn over the
second day. Furthermore, the study was not designed to assess differences between the
standing and walking conditions which were included as a secondary outcome. Finally,
further research is needed to determine whether the effects can be generalized to men and
premenopausal women.
In conclusion, this study demonstrates that breaking up prolonged sitting with 5-minute bouts
of standing or walking at a self-perceived light intensity reduces postprandial glucose, insulin
and NEFA responses in post-menopausal women at high risk of type 2 diabetes. This simple,
behavioural approach could inform future public health interventions aimed at improving the
metabolic profile of dysglycaemic individuals. Habitual standing and light-intensity physical

21
activity are behaviourally more ubiquitous than MVPA and may therefore provide appealing
interventional targets in the promotion of metabolic health. However, future behavioural
intervention studies are needed to investigate the most effective methods of reducing habitual
sedentary behaviour within a prevention context and to assess generalizability beyond post-
menopausal women.
Acknowledgements
The research was supported by the NIHR Leicester-Loughborough Diet, Lifestyle and
Physical Activity Biomedical Research Unit which is a partnership between University
Hospitals of Leicester NHS Trust, Loughborough University and the University of Leicester;
The National Institute for Health Research Collaboration for Leadership in Applied Health
Research and Care - Leicestershire, Northamptonshire and Rutland (NIHR CLAHRC – LNR)
and East Midlands (NIHR CLAHRC EM) and the University of Leicester Clinical Trials
Unit. The views expressed are those of the author(s) and not necessarily those of the NHS,
the NIHR or the Department of Health.
Conflict of Interest
K.K. (Chair), M.J.D. and T.Y. are members of the NICE Public Health Guidance (PH38)
Preventing type 2 diabetes: risk identification and interventions for individuals at high risk.
Author contributions
J.H., M.J.D., D.H.B., C.L.E., J.M.R.G., D.J.S., K.T., D.D., K.K. and T.Y. made significant
contributions to the concept and subsequent design of the study; all authors made substantial

22
contributions to analysis, and interpretation; J.H. and T.Y. wrote the manuscript. All authors
provided critical revision of the manuscript and approved the final version of this manuscript.
J.H. supervised the study and is the guarantor of this work and, as such, had full access to all
the data in the study and takes responsibility for the integrity of the data and the accuracy of
the data analysis.
The authors thank Ros Downing, Steve Hartshorn, Carrie Wilson, Dr Hamid Mani, Dr David
Webb, Dr Zin Zin Htike, Sarah Bunnewell, Jo Paul, Dr Balu Webb, Dr Helen Waller and
Ellen Edwardson for their assistance throughout the study. A special thank-you must also go
to all of the participants who took the time to take part.
23
References
1. Sedentary Behaviour Research N. Letter to the editor: Standardized use of the terms "sedentary" and "sedentary behaviours". Appl Physiol Nutr Metab 2012 Jun;37(3):540-542
2. Wilmot EG, Edwardson CL, Achana FA, Davies MJ, Gorely T, Gray LJ, Khunti K, Yates T, Biddle SJ. Sedentary time in adults and the association with diabetes, cardiovascular disease and death: Systematic review and meta-analysis. Diabetologia 2012 Nov;55(11):2895-2905
3. Biswas A, Oh PI, Faulkner GE, Bajaj RR, Silver MA, Mitchell MS, Alter DA. Sedentary time and its association with risk for disease incidence, mortality, and hospitalization in adults: A systematic review and meta-analysis. Ann Intern Med 2015 Jan 20;162(2):123-132
4. Edwardson CL, Gorely T, Davies MJ, Gray LJ, Khunti K, Wilmot EG, Yates T, Biddle SJ. Association of sedentary behaviour with metabolic syndrome: A meta-analysis. PLoS One 2012;7(4):e34916
5. Healy GN, Matthews CE, Dunstan DW, Winkler EA, Owen N. Sedentary time and cardio-metabolic biomarkers in US adults: NHANES 2003-06. Eur Heart J 2011 Mar;32(5):590-597
6. Henson J, Yates T, Biddle SJ, Edwardson CL, Khunti K, Wilmot EG, Gray LJ, Gorely T, Nimmo MA, Davies MJ. Associations of objectively measured sedentary behaviour and physical activity with markers of cardiometabolic health. Diabetologia 2013 May;56(5):1012-1020
7. Healy GN, Wijndaele K, Dunstan DW, Shaw JE, Salmon J, Zimmet PZ, Owen N. Objectively measured sedentary time, physical activity, and metabolic risk: The australian diabetes, obesity and lifestyle study (AusDiab). Diabetes Care 2008 Feb;31(2):369-371
8. Dunstan DW, Kingwell BA, Larsen R, Healy GN, Cerin E, Hamilton MT, Shaw JE, Bertovic DA, Zimmet PZ, Salmon J, Owen N. Breaking up prolonged sitting reduces postprandial glucose and insulin responses. Diabetes Care 2012 May;35(5):976-983
9. Peddie MC, Bone JL, Rehrer NJ, Skeaff CM, Gray AR, Perry TL. Breaking prolonged sitting reduces postprandial glycemia in healthy, normal-weight adults: A randomized crossover trial. Am J Clin Nutr 2013 Aug;98(2):358-366
10. Stephens BR, Granados K, Zderic TW, Hamilton MT, Braun B. Effects of 1 day of inactivity on insulin action in healthy men and women: Interaction with energy intake. Metabolism 2011 Jul;60(7):941-949
11. Newsom SA, Everett AC, Hinko A, Horowitz JF. A single session of low-intensity exercise is sufficient to enhance insulin sensitivity into the next day in obese adults. Diabetes Care 2013 Sep;36(9):2516-2522
12. Thorp AA, Kingwell BA, Sethi P, Hammond L, Owen N, Dunstan DW. Alternating bouts of sitting and standing attenuate postprandial glucose responses. Med Sci Sports Exerc 2014 Nov;46(11):2053-2061

24
13. Buckley JP, Mellor DD, Morris M, Joseph F. Standing-based office work shows encouraging signs of attenuating post-prandial glycaemic excursion. Occupational & Environmental Medicine 2014 February;71(2):109-111
14. Senn SS. Incomplete block designs. In Cross-over trials in clinical research. 2nd ed. West Sussex, England, John Wiley & Sons Ltd, 2003, p. 211
15. Peng JZ, Denney WS, Musser BJ, Liu R, Tsai K, Fang L, Reitman ML, Troyer MD, Engel SS, Xu L, Stoch A, Stone JA, Kowalski KG. A semi-mechanistic model for the effects of a novel glucagon receptor antagonist on glucagon and the interaction between glucose, glucagon, and insulin applied to adaptive phase II design. AAPS J 2014 Nov;16(6):1259-1270
16. Henry RR, Mudaliar S, Ciaraldi TP, Armstrong DA, Burke P, Pettus J, Garhyan P, Choi SL, Jacober SJ, Knadler MP, Lam EC, Prince MJ, Bose N, Porksen N, Sinha VP, Linnebjerg H. Basal insulin peglispro demonstrates preferential hepatic versus peripheral action relative to insulin glargine in healthy subjects. Diabetes Care 2014 Sep;37(9):2609-2615
17. Mikines KJ, Sonne B, Farrell PA, Tronier B, Galbo H. Effect of physical exercise on sensitivity and responsiveness to insulin in humans. Am J Physiol 1988 Mar;254(3 Pt 1):E248-59
18. Yates T, Davies MJ, Henson J, Troughton J, Edwardson C, Gray L, Khunti K. Walking away from type 2 diabetes: Trial protocol of a cluster randomized controlled trial evaluating a structured education programme in those at high risk of developing type 2 diabetes. BMC Fam Pract 2012 May 29;13(1):46
19. Gray LJ, Khunti K, Williams S, Goldby S, Troughton J, Yates T, Gray A, Davies MJ, for the Let's Prevent Collaborators. Let's prevent diabetes: Study protocol for a cluster randomised controlled trial of an educational intervention in a multi-ethnic UK population with screen detected impaired glucose regulation. Cardiovasc Diabetol 2012 May 20;11(1):56
20. Owen N, Healy GN, Matthews CE, Dunstan DW. Too much sitting: The population health science of sedentary behavior. Exerc Sport Sci Rev 2010 07;38(3):105-13
21. Tamimi RM, Hankinson SE, Chen WY, Rosner B, Colditz GA. Combined estrogen and testosterone use and risk of breast cancer in postmenopausal women. Arch Intern Med 2006 Jul 24;166(14):1483-1489
22. International Diabetes Federation. Definition and diagnosis of diabetes mellitus and intermediate hyperglycaemia [article online], 2006. Available from https://www.idf.org/webdata/docs/WHO_IDF_definition_diagnosis_of_diabetes.pdf. Accessed March 2015
23. American Diabetes Association. Standards of medical care in diabetes--2012. Diabetes Care 2012 Jan;35 Suppl 1:S11-63
24. Borg GA. Psychophysical bases of perceived exertion. Med Sci Sports Exerc 1982;14(5):377-381

25
25. Trost SG, McIver KL, Pate RR. Conducting accelerometer-based activity assessments in field-based research. Med Sci Sports Exerc 2005 Nov;37(11 Suppl):S531-43
26. Freedson PS, Melanson E, Sirard J. Calibration of the computer science and applications, inc. accelerometer. Med Sci Sports Exerc 1998 May;30(5):777-781
27. Senn SJ, Lillienthal J, Patalano F, Till D. An incomplete blocks cross-over in asthma: A case study in collaboration. In Cross-over clinical trials. Vollmar J, Hothorn LA, Eds. Stuttgart, Fischer, 1997, p. 3-26
28. Le Floch JP, Escuyer P, Baudin E, Baudon D, Perlemuter L. Blood glucose area under the curve. methodological aspects. Diabetes Care 1990 Feb;13(2):172-175
29. Janssen KJ, Donders AR, Harrell FE,Jr, Vergouwe Y, Chen Q, Grobbee DE, Moons KG. Missing covariate data in medical research: To impute is better than to ignore. J Clin Epidemiol 2010 Jul;63(7):721-727
30. Miyashita M, Park JH, Takahashi M, Suzuki K, Stensel D, Nakamura Y. Postprandial lipaemia: Effects of sitting, standing and walking in healthy normolipidaemic humans. Int J Sports Med 2013 Jan;34(1):21-27
31. Bailey DP, Locke CD. Breaking up prolonged sitting with light-intensity walking improves postprandial glycemia, but breaking up sitting with standing does not. J Sci Med Sport 2015 May;18(3):294-298
32. National Institute for Health and Care Excellence. Preventing type 2 diabetes: risk identification and interventions for individuals at high risk [article online], 2012. Available from https://www.nice.org.uk/guidance/ph38. Accessed February 2015
33. ADA. American Diabetes Association - Standards of medical care in diabetes [article online], 2015. Available from http://professional.diabetes.org/admin/UserFiles/0%20-%20Sean/Documents/January%20Supplement%20Combined_Final.pdf. Accessed March 2015
34. Hansen D, Dendale P, Jonkers RA, Beelen M, Manders RJ, Corluy L, Mullens A, Berger J, Meeusen R, van Loon LJ. Continuous low- to moderate-intensity exercise training is as effective as moderate- to high-intensity exercise training at lowering blood HbA(1c) in obese type 2 diabetes patients. Diabetologia 2009 Sep;52(9):1789-1797
35. Richter EA, Hargreaves M. Exercise, GLUT4, and skeletal muscle glucose uptake. Physiol Rev 2013 Jul;93(3):993-1017
36. Karpe F, Dickmann JR, Frayn KN. Fatty acids, obesity, and insulin resistance: Time for a reevaluation. Diabetes 2011 Oct;60(10):2441-2449
37. Horowitz JF. Fatty acid mobilization from adipose tissue during exercise. Trends Endocrinol Metab 2003 Oct;14(8):386-392
26
38. Henderson GC, Fattor JA, Horning MA, Faghihnia N, Johnson ML, Mau TL, Luke-Zeitoun M, Brooks GA. Lipolysis and fatty acid metabolism in men and women during the postexercise recovery period. J Physiol 2007 Nov 1;584(Pt 3):963-981
39. National Health Service Calorie Checker [article online], 2014. Available from http://www.nhs.uk/LiveWell/weight-loss-guide/Pages/calorie-counting.aspx. Accessed January 2015
40. The National Diet and Nutrition survey data assesses the diet, nutrient intake and nutritional status of the general population in the UK [article online], 2014. Available from https://www.gov.uk/government/uploads/system/uploads/attachment_data/file/310995/NDNS_Y1_to_4_UK_report.pdf. Accessed 2015 January

27
Figure 1. Study CONSORT Diagram
121 participants invited from previous type 2 diabetes prevention projects
3 screen failures
1 did not meet inclusion criteria (BMI <25 kg·m-2)
2 diagnosed with type 2 diabetes
30 randomised
Dropout N=2
Dropout N=2
Dropout N=2
Dropout N=1
1 withdrawn; change in circumstance
Dropout N=1
70 replies
34 attended familiarisation visit
Block C
Walking + Sitting
N= 5
Block B
Standing + Walking
N= 6
Block A
Sitting + Standing
N= 5
Block D
Sitting + Walking
N= 5
Block E
Standing + Sitting
N= 4
Block F
Walking + Standing
N= 5
36 negative responses
28 not interested 3 diagnosed with type 2 diabetes
3 unable to contact 2 other health problems
22 completed study (day 1; primary outcome)
17 completed day 2 (secondary outcome)
Incomplete data N=2
Incomplete data N=1
Incomplete data N=1
Incomplete data N=1

28
Table 1. Metabolic, demographic and anthropometric characteristics at baseline and dietary and physical activity variables during the study (n=22)
Baseline characteristics Age (years) 66.6 ± 4.7 Current smoker 1 (4.5) BMI (kg/m2) 32.9 ± 4.7 Waist circumference (cm) 102 ± 9.0 Body mass (kg) 83.6 ± 11.7 Total cholesterol (mmol/L) 5.60 ± 0.87 Triglycerides (mmol/L) 2.17 ± 0.86 Non-esterified fatty acids (mmol/L) 0.44 ± 0.24 HbA1c (%) 5.8 ± 0.2 HbA1c (mmol/mol) 40 ± 2.3 Fasting plasma glucose (mmol/L) 5.4 ± 0.4 Lipid lowering medication 5 (22.7) Beta-blockers 5 (22.7) ACE Inhibitors 3 (13.6) Ethnicity White European Black and minority ethnic
20 (90.9) 2 (9.1)
In study characteristics Diet Total energy intake (kcal/day) Total fat (energy %) Total carbohydrate (energy %) Total protein (energy %)
1717 ± 234
58 ± 0.2 26 ± 0.1 16 ± 0.2
Walking speed (km/h) 3.0 (1.5-4.0) Borg rate of perceived exertion score 10 (8-12)
Data are presented as mean±standard deviation, number (%) or mean (range)

29
Figure 2. The effect of sitting, standing and walking upon glucose (A), insulin (B) NEFA (C) and triglyceride (D) levels on day 1 (n=22)

30

31
Figure 3. The effect of sitting, standing and walking upon glucose (A), insulin (B) NEFA(C) and triglyceride (D) levels on day 2 (n=17)

32
Mean (± SEM) glucose, insulin,NEFA and triglycerideson day 1 (Figure 2; A, B, C, D) and day 2 (Figure 3; A, B, C, D) measured over a 6.5-h period during the prolonged sitting, sitting and standing and sitting and walking conditions. Standardised meals provided at 0h and 3h. iAUC; incremental area under the curve, SEM; standard error of the mean, NEFA; non-esterified fatty acids

33
Online-Only Supplemental Material Supplemental Table S1. Balanced incomplete block design sequence. Each participant was randomised to one of the sequences A-F.
Period 1 Period 2
Sequence Day 1 Day 2 Day 1 Day 2 A Sitting Sitting Standing Sitting
B Standing Sitting Walking Sitting
C Walking Sitting Sitting Sitting
D Sitting Sitting Walking Sitting
E Standing Sitting Sitting Sitting
F Walking Sitting Standing Sitting

34
Supplemental Figure 1. Study protocol for treatment conditions
Actigraph GT3X+ worn Actigraph GT3X+ and activPAL worn
Fam
iliar
isat
ion
visi
t
Habitual physical activity
*Restrictive Period
(no alcohol and MVPA 48 hrs
before)
* Record all food and drink consumed
Day
1: E
xper
imen
tal c
ondi
tion
*Restrictive Period
* Consume
identical amounts of the same food and
drink as the previous evening
Day
2: S
ittin
g pr
otoc
ol
Habitual physical activity
*Restrictive Period (no alcohol and
MVPA 48 hrs before)
* Consume
identical amounts as the
previous experimental
condition
Day
1: E
xper
imen
tal c
ondi
tion
*Restrictive Period
* Consume
identical amounts of the same food and
drink as the previous evening
Day
2: S
ittin
g pr
otoc
ol
<-------------7-14 days --------------> <---------------- 2 days -------------> <------------7-14 days ----------> <---------------- 2 days --------------> <--------24hr--------> <-------24hr------>
Standardised meals
Standardised meals
Standardised meals
Standardised meals

35
Supplemental Table S2. Number of imputed values for each participant included across both experimental days
Data presented as number (percentage of total available samples)
Participant Number
Day 1: Missing values across both randomised experimental conditions
(total scheduled samples = 22)
Day 2: Missing values across both randomised experimental conditions (total
scheduled samples = 22) Glucose Insulin Triglycerides NEFA Glucose Insulin Triglycerides NEFA
1 2 (9) 7 (32) 6 (28) 7 (32) 2 0 0 1 (5) 2 (9) 0 1 (5) 4 (18) 6 (28) 3 0 0 2 (9) 2 (9) 4 (18) 5 (23) 5 (23) 7 (32) 4 0 3 (14) 3 (14) 3 (14) 1 (5) 1 (5) 1 (5) 2 (9) 5 2 (9) 5 (23) 3 (14) 4 (18) 6 1 (5) 5 (23) 3 (14) 1 (5) 1 (5) 1 (5) 2 (9) 1 (5) 7 2 (9) 7 (32) 2 (9) 3 (14) 0 1 (5) 1 (5) 2 (9) 8 0 2 (9) 1 (5) 3 (14) 2 (9) 2 (9) 2 (9) 3 (14) 9 3 (14) 6 (28) 6 (28) 6 (28) 0 2 (9) 2 (9) 1 (5) 10 1 (5) 2 (9) 1 (5) 2 (9) 0 0 0 1 (5) 11 0 2 (9) 0 0 0 0 0 2 (9) 12 0 0 0 0 13 0 4 (18) 3 (14) 8 (36) 3 (14) 3 (14) 4 (18) 4 (18) 14 1 (5) 4 (18) 4 (18) 4 (18) 4 (18) 5 (23) 5 (23) 5 (23) 15 0 0 1 (5) 8 (36) 16 3 (14) 3 (14) 3 (14) 4 (18) 4 (18) 4 (18) 4 (18) 4 (18) 17 2 (9) 3 (14) 5 (23) 5 (23) 4 (18) 5 (23) 5 (23) 4 (18) 18 1 (5) 3 (14) 2 (9) 2 (9) 3 (14) 4 (18) 4 (18) 4 (18) 19 1 (5) 3 (14) 1 (5) 1 (5) 2 (9) 2 (9) 2 (9) 2 (9) 20 0 2 (9) 0 0 21 0 5 (23) 2 (9) 2 (9) 1 (5) 1 (5) 2 (9) 3 (14) 22 1 (5) 5 (23) 1 (5) 1 (5) 1 (5) 2 (9) 2 (9) 4 (18)

36
Supplemental Table S3. Incremental area under the curve (iAUC) results on day 1 for biochemical measurements for each experimental condition (n = 22)
Mean ± SEM P-value
Sitting Standing Walking Standing vs. sitting
Walking vs. sitting
Glucose (mmol/L•h)
5.3±0.8 3.5±0.8 3.8±0.7 0.022 0.009
Insulin (mU/L•h)
548.2±71.8 437.2±73.5 347.9±78.7 0.045 0.008
Triglycerides (mmol/L•h)
5.6±0.7 6.2±0.8 6.1±0.8 0.493 0.673
NEFA (mmol/L•h)
-1.5±0.2 -1.0±0.2 -0.8±0.2 0.024 0.003
SEM; standard error of the mean, NEFA; non-esterified fatty acids

37
Supplemental Table S4. Incremental area under the curve (iAUC) results on day 2 for biochemical measurements for each experimental condition (n = 17)
Mean ± SEM P-value
Sitting Standing Walking Standing vs. sitting
Walking vs. sitting
Glucose (mmol/L•h)
4.8±0.6 3.9±0.8 4.0±0.7 0.039 0.027
Insulin (mU/L•h)
464.6±70.2 363.5±57.5 354.3±57.3 0.325 0.038
Triglycerides (mmol/L•h)
7.2±0.5 7.2±0.8 6.0±0.7 0.603 0.077
NEFA (mmol/L•h)
-1.5±0.2 -1.0±0.3 -1.0±0.3 0.161 0.144
SEM; standard error of the mean, NEFA; non-esterified fatty acids

38
Supplemental Table S5 Total area under the curve (AUC) results on day 1 for biochemical measurements for each experimental condition (n = 22)
Mean ± SEM P-value
Sitting Standing Walking Standing vs. sitting
Walking vs. sitting
Glucose (mmol/L•h)
46.5±1.2 44.0±1.1 44.1±1.1 0.004 <0.001
Insulin (mU/L•h)
661.7±81.6 560.9±80.1 475.2±85.9 0.048 0.018
Triglycerides (mmol/L•h)
16.5±1.4 18.7±1.5 17.8±1.5 0.641 0.571
NEFA (mmol/L•h)
-2.5±0.2 -3.0±0.2 -2.9±0.2 0.019 0.046
SEM; standard error of the mean, NEFA; non-esterified fatty acids
39
Supplemental Table S6. Total area under the curve (AUC) results on day 2 for biochemical
measurements for each experimental condition (n = 17)
Mean ± SEM P-value
Sitting Standing Walking Standing vs. sitting
Walking vs. sitting
Glucose (mmol/L•h)
44.9±0.9 43.9±1.0 43.7±1.0 0.102 0.082
Insulin (mU/L•h)
595.2±79.9 505.2±58.0 474.6±54.9 0.323 0.013
Triglycerides (mmol/L•h)
17.7±1.2 18.3±1.2 15.5±1.2 0.653 0.084
NEFA (mmol/L•h)
-2.2±0.1 -2.6±0.2 -2.5±0.2 0.009 0.033
SEM; standard error of the mean, NEFA; non-esterified fatty acids

40
Supplemental Table S7. Fasting biochemical values for each experimental condition (Day 1 and Day 2)
Data presented as mean ± standard deviation
Day 1 Day 2 P value (Day 1 vs. Day 2)
Glucose (mmol/L) – Sitting 5.4 ± 0.4 5.5 ± 0.4 0.878 Glucose (mmol/L) - Standing 5.5 ± 0.4 5.6 ± 0.4 0.902 Glucose (mmol/L) - Walking 5.4 ± 0.4 5.5 ± 0.3 0.898 Insulin (mu/L) - Sitting 15.6 ± 9.6 17.4 ± 11.1 0.471 Insulin (mu/L) - Standing 16.0 ± 8.6 20.1 ± 11.8 0.183 Insulin (mu/L) - Walking 16.4 ± 5.6 16.8 ± 10.7 0.823 NEFA (mmol/L) - Sitting 0.55 ± 0.16 0.49 ± 0.13 0.163 NEFA (mmol/L) – Standing 0.53 ± 0.13 0.48 ± 0.15 0.219 NEFA (mmol/L) –Walking 0.51 ± 0.11 0.47 ± 0.09 0.378 Triglycerides (mmol/L) – Sitting 1.54 ± 0.49 1.39 ± 0.36 0.363 Triglycerides (mmol/L) – Standing 1.66 ± 0.47 1.47 ± 0.37 0.121 Triglycerides (mmol/L) - Walking 1.56 ± 0.47 1.27 ± 0.43 0.093

41
Supplemental Table S8. Physical activity data before and during each experimental condition (n = 22)
SD; standard deviation, MVPA; moderate-to-vigorous physical activity
Mean (range) Mean ± SD Experimental regimens Days
accelerometer worn
Wear-time (Minutes) Sedentary time (Minutes)
Light activity (Minutes)
MVPA (Minutes)
Steps
Familiarisation visit 6 (4-7) 831±85 594±80 218±52 19±10 5024±2021 7 days prior to experimental condition 1
5 (4-6) 821±89 569±91 234±59 18±14 4731±2667
2 days prior to experimental condition 1
2 826±87 597±98 225±56 4±3 3399±2027
7 days prior to experimental condition 2
5 (4-6) 829±86 588±91 223±54 18±9 4822±1659
2 days prior to experimental condition 2
2 838±102 600±108 233±62 5±2 3612±1983
Day 1 - Sitting Condition 1 478±27 475±11 3±1 Nil 121±50 Day 1 - Standing Condition 1 475±11 448±13 27±5 Nil 197±64 Day 1 - Walking Condition 1 477±9 415±9 41±11 21±13 4818±1550 Day 2 – Sitting Condition 1 480±11 476±11 4±1 Nil 116±45

42
Supplemental Table S9. ActivPAL results during each experimental condition SD; standard deviation
Minutes ± SD Sitting
Standing
Walking
Day 1 – Sitting condition 479.7±4.3 1.5±0.7 0.8±0.1 Day 1 – Standing condition 419.1±6.9 62.9±2.2 1.4±0.2 Day 1 - Walking condition 412.7±7.3 4.8±0.8 64.2±0.3 Day 2 – Sitting condition 481.1±4.0 1.7±0.4 0.5±0.1