breaking news in climate change - alanbetts.com
TRANSCRIPT

Breaking News in Climate Change
Dr. Alan K. BettsAtmospheric Research, Pittsford, VT 05763
[email protected]://alanbetts.com
Session 7a: Climate Change, Vulnerability and Adaptation
2013 Joint Winter Meeting of the New England and New York Society of American Foresters
Saratoga Springs, NYJanuary 31, 2013

• Half the Arctic Sea Ice Melted in 2012
• Open water in Oct. Nov. gives warmer Fall in Northeast
Sept 16, 2012
End of Nov. 2011 Hudson Bay was still nearly ice-free
• Positive feedbacks:
• Less ice, less reflection of sunlight
• More evaporation, larger vapor greenhouse effect
• Ice thin: most 1-yr-oldhttp://nsidc.org/arcticseaicenews/

June 2012 snow cover minimum
• Arctic warming rapidly– Melting fast– Much faster than IPCC models
• Northeast winters also– Same positive feedbacks
Steep fall since 2003
≈
500,000 km2/yr
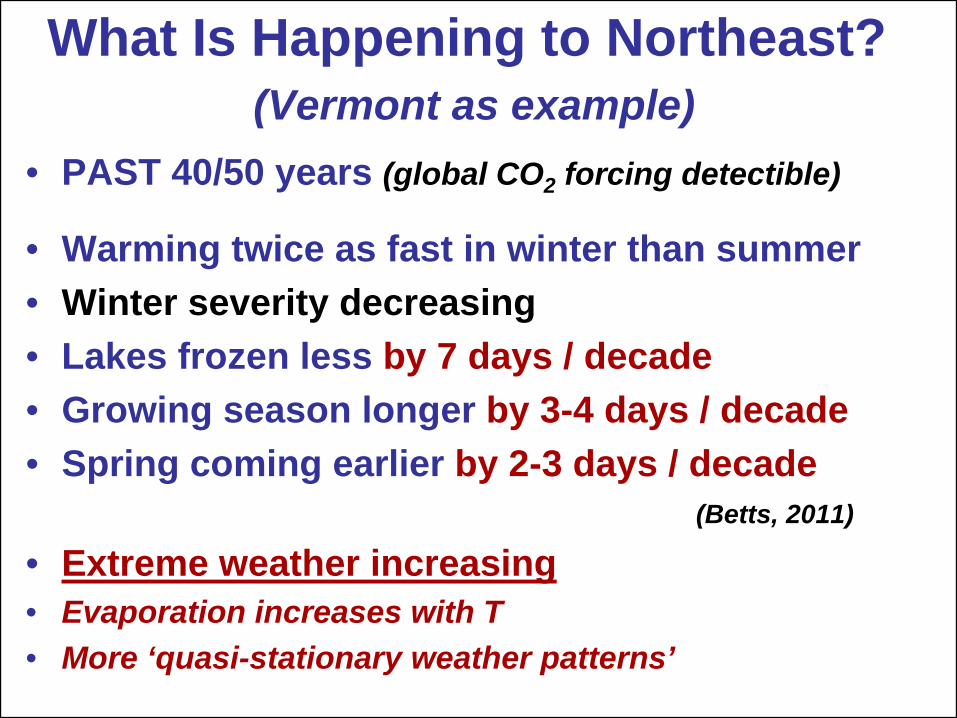
What Is Happening to Northeast? (Vermont as example)
• PAST 40/50 years (global CO2
forcing detectible)
• Warming twice as fast in winter than summer• Winter severity decreasing• Lakes frozen less
by 7
days / decade
• Growing season longer by 3-4 days / decade• Spring coming earlier by 2-3 days / decade
(Betts, 2011)
• Extreme weather increasing• Evaporation increases with T• More ‘quasi-stationary weather patterns’

VT Temperature Trends
• Summer 0.4±0.12◦F (0.23±0.07◦C) per decade
• Winter 0.91±028◦F (0.5±0.16◦C) per decade– Larger trend, larger variability (warmer if less snow)

Lake Freeze-up & Ice-out Changing Frozen Period Shrinking Fast
• Ice-out earlier
by 2.9 (±1.0)
days / decade• Freeze-up later by 3.9 (±1.1)
days / decade
• River and soil ice probably similar
Frozen period trend -
7 days/decade
- Apr 1

Hydrology Sensitive to ClimateHydrology Sensitive to Climate
•• Spring runoff Spring runoff dominates the dominates the annual annual hydrographhydrograph
•• Significantly Significantly earlier in earlier in northern New northern New England in England in recent yearsrecent years–– ≈≈3 days/decade3 days/decade
•• Timing related to Timing related to air temperatures air temperatures
1900 1920 1940 1960 1980 2000
Year
Mar 11
Mar 21
Mar 31
Apr 10
Apr 20
Apr 30
May 10
LOESS smooths of winter/spring center of volume dates for 13 longest-record rivers in New England
Dat
e
(Hodgkins and others, 2003)
Lent (2010), USGS, Me

Heating Degree Days and Days below 0oF (-17.8oC)
(Burlington)
• HDD trend 289 (±37) /decade
• Tmin
<0oF 4.1 (±0.7)
days /decade

Winter Hardiness Zones –
winter cold extremes
Change in 16 years
Minimum winter T
4: -30 to -20oF
5: -20 to -10oF
6: -10 to 0oF

• VT Hardiness Zone Map 1976-2005 – mean 1990 – South now zone 6
• Half-zone in 16 yrs = 3.1oF/ decade
– triple the rise-rate of winter mean T
– 3 zones/century
• http://planthardiness.ars.usda.g
ov/PHZMWeb/
Detailed Map (most recent)

Bennington & Brattleboro are becoming zone 6 (Tmin
> -10F)• Hardy peaches: 2012• More pests survive winter
• What is this?

Bennington & Brattleboro are becoming zone 6
• Hardy peaches: 2012• More pests survive winter
• What is this?
• Avocado– Didn’t survive frost– 2100 survive in
CT ≈
zone 9-10?

Lilac Leaf and Bloom
• Leaf-out -2.9 days/decade; Bloom -1.6 days/decade• Large year-to-year variation related to temperature:
2.5 days/ oF
or 4.5 days/ oC
- Apr 10

Lilac Leaf-out and Ice-out Coupled
• Lilac leaf and lake ice-out both depend on Feb. Mar. and April temperatures
• Trends indicate earlier spring
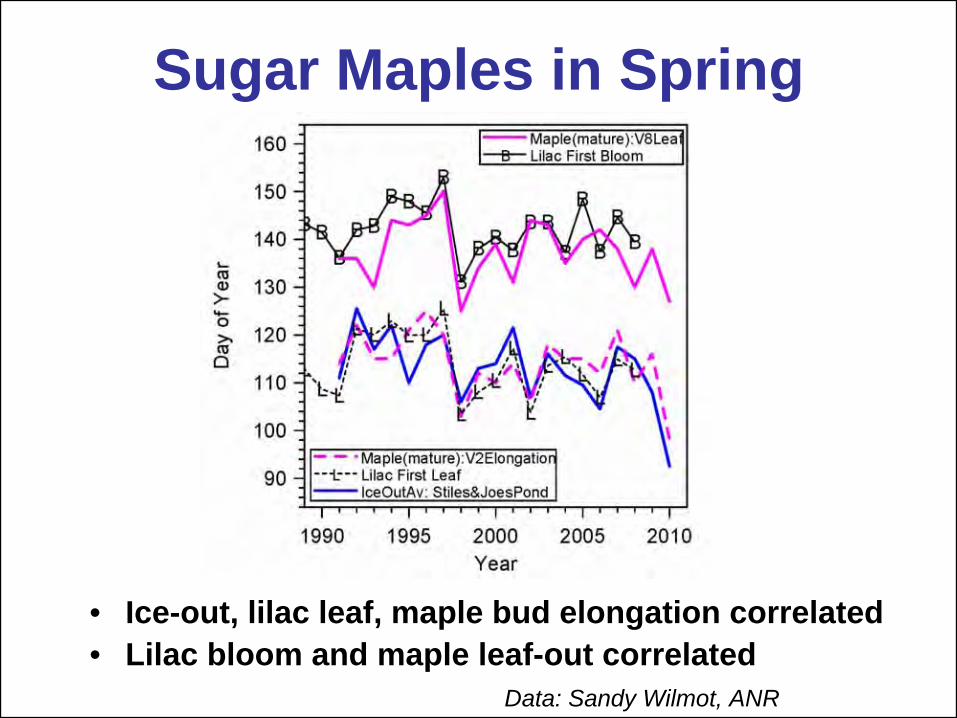
Sugar Maples in Spring
• Ice-out, lilac leaf, maple bud elongation correlated• Lilac bloom and maple leaf-out correlated
Data: Sandy Wilmot, ANR

First and Last Frosts Changing
• Growing season for frost-sensitive plants increasing 3.7 days / decade
• Important for agriculture; local food supply

October 2011–
March 2012
• Warmest 6 months on record• My garden frozen only 67 days• No permanent snow cover
west of Green Mountains• Contrast snowy winter 2010-11
January 2, 2012 March 11, 2012

Across the border: Canada
• Winter 2011-12: 3.6oC (6.5oF) above normal– Canada’s winters also warming 0.9oF/decade
• Climate doesn’t see the border!
+12oF
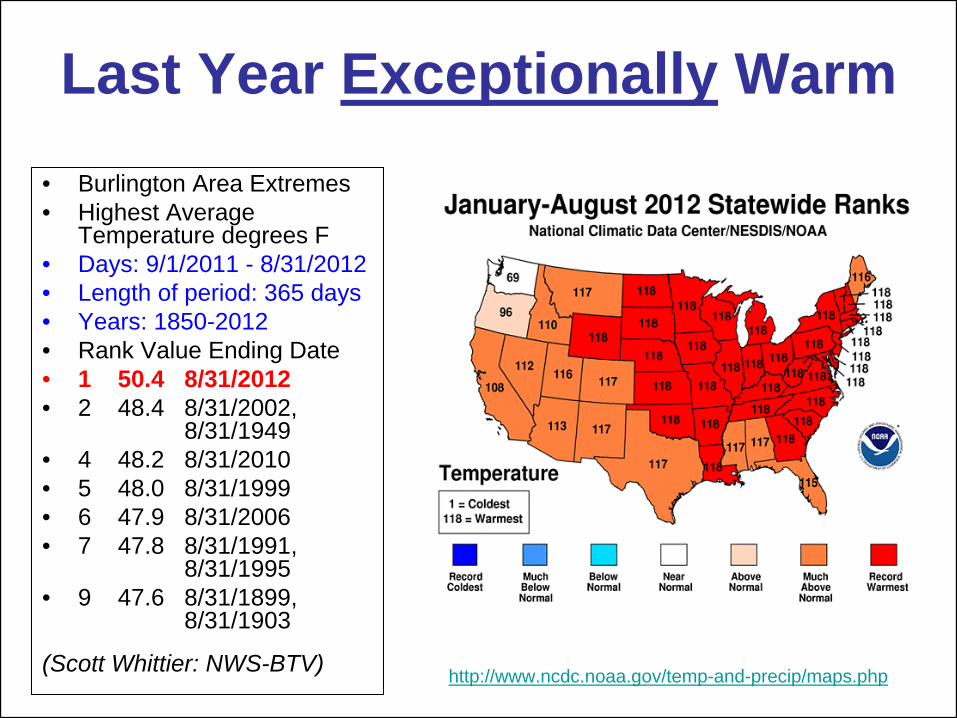
Last Year Exceptionally
Warm• Burlington Area Extremes • Highest Average
Temperature degrees F • Days: 9/1/2011 - 8/31/2012 • Length of period: 365 days • Years: 1850-2012 • Rank Value Ending Date • 1 50.4 8/31/2012• 2 48.4 8/31/2002,
8/31/1949 • 4 48.2 8/31/2010 • 5 48.0 8/31/1999 • 6 47.9 8/31/2006 • 7 47.8 8/31/1991,
8/31/1995 • 9 47.6 8/31/1899,
8/31/1903
(Scott Whittier: NWS-BTV) http://www.ncdc.noaa.gov/temp-and-precip/maps.php

Increasing Temperature Extremes is “Global Warming”
• Frequency of occurrence (vertical axis) of local June-July-
August temperature anomalies for Northern Hemisphere land in units of local standard deviation (horizontal axis). The normal (gaussian) distribution bell curve is shown in green.
• Large increase in anomalies > +3σ
is
global warming– Baseline 0.15% has increased to 10% in 45 years
(Hansen, 2012)

• Dec 25: Ground froze hard • Dec 27-28: Foot of snow
• Air temperatures plunged but ground thawed under snow
• Jan 12-14: 45-50F• Snow melted
• Jan 15: Time to dig again..• Followed by freeze-up.. melt
December 21, 2012 January 15, 2013
Past Month

Vermont Winter 2006
• Sun is low; snow reflects sunlight, except where there are trees -
shadows
• Sunlight reflected, stays cold; little evaporation, clear sky; earth cools to space
• Feedbacks amplify: Less snow, warmer winters (2012)

Spring Climate Transitions
• Before leaf-outLittle evaporation
Dry atmosphere, low humidity Low water vapor greenhouse
Large cooling at nightLarge diurnal temp. range
giving warm days, cool nights and frost
• After leaf-outLarge evaporation
Wet atmosphere, low cloudbase
Small cooling at night Reduced maximum temperature Reduced chance of frost
• Spring is coming earlier: 2012 was extreme

Vermont’s Future with High
and Low
GHG Emissions
NECIA, 2007
Sub-tropical drought areas moving into southern US
What about VT forests?
Business as usual

Very Heavy Precipitation Is Increasing• Precipitation Extremes• Most of the observed
increase in precipitation during the last 50 years
has come from the increasing frequency and intensity of heavy downpours.
• 67% increase in Northeast
• Little change or a decrease in the frequency of light and moderate precipitation
• Vermont streamflow
is increasing
(USGCRP, 2009)

Stormflow changes1950-2006
Increasesin blue
Summer stormflow
increases 20-50%
Lent (2010) USGS, Me

Many Wet Summers in Vermont –
until 2012
• 2004, 2006, 2008, 2009, (2010), 2011 all wet • Direct fast evaporation off wet canopies• Positive evaporation-precipitation feedback, coupled
to synoptic system frequency

Summer dry-down
• Wet in spring• Soil moisture falls:
summer dry-down• Low humidity &
little rain
• Can lock-in drought in central US: as 2012

Extreme Weather (precip.)• Precip. is condensation of atmospheric water
vapor -
larger latent heat release drives storms• Saturation vapor pressure at cloud-base
increases steeply with temperature (6%/oC)
• Quasi-stationary large-scale flow means longer rain events in low-pressure convergent regions, and longer droughts in high-pressure divergent regions
• As climate changes, quasi-stationary
large- scale modes appear to be more frequent
– Cause may be Arctic warming: needs more study

2011 Floods: VT and NY• Record spring flood on Lake Champlain• Record floods following TS Irene• Record wet March-August, 2011: OH to VT
(but record drought in TX & NM)• Quasi-stationary
pattern for 6 mos

2011 Classic Flood Situations• Spring flood: heavy rain and warm weather,
melting large snowpack from 2010 winter– 70F (4/11) and 80F(5/27) + heavy rain– record April, May rainfall: 3X at BTV– Severe floods on Winooski and Adirondack rivers– Lake Champlain record flood stage of 103ft
• Irene flood: tropical storm
moved up east of Green Mountains and Catskills– dumped 6-8 ins rain on wet soils– Extreme flooding– (Floyd on 9/17/1999 had similar rain -
but with dry
soils there was less flooding)

Three Successive Years of East- Coast Tropical Storm Disasters
• September 21, 2010:
Hurricane Igor with winds and record rainfall devastates eastern Newfoundland, isolating 150 communities as swollen rivers washed away the only roads into town and all connecting bridges. The worst storm ever in a province known for its storms.
• August 28, 2011:
Tropical Storm Irene devastates Vermont, as heavy rain washes out roads and bridges, cutting off 20 towns
• October 29, 2012:
Hurricane Sandy devastates New Jersey and New York City with winds and record storm surge flooding the subway tunnels, airports and shorelines; 8 million lose power

Disasters Happen in Strong Storms
• Hurricane Sandy hits NYC and floods subway tunnels: Oct 29 2012
• Extreme weather event + climate change = disaster– ≈
1ft rise in mean sea-level
– Gulfstream warm + 5oF– Blocking high: NE Canada– 13 ft
(4m) storm surge

Increasing
Extreme Weather • The answer to the oft-asked question of
whether an (extreme) event is caused by climate change is that it is the wrong question.
• All weather events are affected by climate change
because the environment in which
they occur is warmer and moister than it used to be.
(Trenberth: Climatic Change 2012)
• .. and global weather patterns are changing

Water: Strong Positive Feed-backs• GHGs
up Oceans, land warmer Evaporation up
• Water Vapor up– WV infrared greenhouse up
• Approx triples climate warming of planet• Locally reduces night-time cooling
– Winter Tmin
increase: less severe winters– Longer growing season between frosts
– Latent heat release in storms up• Increases precipitation rates
– Increases precipitation extremes• Increases wind-speeds and storm damage
• Snow and ice down– Less sunlight reflected
• Warmer Arctic in summer• Warmer northern winters
– Less ice-cover: more evaporation
Discussion
• Background papers: http://alanbetts.com/– Vermont Climate Change Indicators– Seasonal Climate Transitions in New England– Extreme Weather and Climate Change

Winter snowfall (USGCRP 2009)• Trends since 1970
– Winter temps rising 1oF/decade– Less winter precipitation falling as snow and more as rain– Reduced snowpack– Earlier breakup of winter ice on lakes and rivers– Earlier spring snowmelt resulting in earlier peak river flows
• Projections to late century– Winters in the Northeast are projected to be much shorter with
fewer cold days and more precipitation– The length of the winter snow season would be cut in half across
northern New York, Vermont, New Hampshire, and Maine, and reduced to a week or two in southern parts of the region
• Reality– Northern winters may be shrinking faster than model projections – Winter extremes increasing

Current Reality• Northern winters may be shrinking faster
than model projections– Model ice-coupled feedbacks too weak?– Winter extremes increasing: eg
2010, 2011
• Our limited seasonal forecast skill is related to Pacific and Atlantic ocean temperatures– Now Arctic warming is major factor– Changing NH circulation: blocking patterns– Limited understanding: less than decade of data

Models Strengths
and Weaknesses• Weather:
Sandy landfall forecast at 7-days lead-time
• Climate: Mean state changes• Temperature mean trends and statistics
– Depend on model sensitivity to clouds/ice-melt– Cloud field changes uncertain, Arctic ice-melt too slow– Bias of model Temps. from freezing
critical
• Large-scale mean precipitation trends– Circulation mode changes less certain– Precipitation extremes less certain
• Diurnal cycle trends poorly forecast• Arctic melt-rate under-forecast
– Appears to be changing circulation modes• Biogeochemical feedbacks uncertain
– Methane release, CO2
fertilization

Agricultural planning• Frozen ground and lakes: -7d/decade• Earlier melt, earlier spring leaf-out:
-
3d/decade
• Frost-free growing season: +4d/decade– Greenhouse, row cover seasonal extenders
• Winter extremes increasing with variable snow– Tmin
extremes increasing +3oF/decade
• More winter precipitation– Wetter snow; more mixed phase; more frequent melt
• Variable summer precipitation– Heavier rain-rates, longer storms, longer droughts– Maximize soil water infiltration; water storage– Manage to reduce soil erosion– Design infrastructure to handle larger runoff