brazil: technological innovation &...
TRANSCRIPT

BRAZIL: TECHNOLOGICAL INNOVATION & INVESTMENT OPPORTUNITIES

Telecommunication Brazilian Market
IT Brazilian Market
Segment of SW for Telecom in Brazil
Opportunities for investment in the segment
Example: VÍSENT Case

R Market Share (%)145Owner Telecom Group
Gross
Revenue
Fixed
Cellular
Broadband
PayTV
Telefónica/Portugal Telecom Telefónica/Vivo 30% 30 31 26 7
Accesses (in Million)October 2008
Telmex/America Movil Claro/Embratel/ Net 23% 11 25 21 48
Brazilian Group Oi/Way TV 18% 35 15 21 1
Italy Telecom TIM 11% 0 25 - -s
41
106
39
Brazilian Group Brasil Telecom 11% 20 4 19 -
Various Others (GVT, BT, Nextel, Sky,Intelig, VoIP Operators, etc.) 7% 4 0 13 44
Brazilian Group (M&A Proccess) Brasil Telecom/Oi 29% 55 19 40 1
Cel
lula
r
Fixe
dTe
leph
one s
Bro
adba
nd
Inte
rnet
Pay
TV
Inte
rnet
Use
rs
sues 3G
• 2 millions cellular in operation (2008/Oct)
ll ( / )
WiMax - broadband access to distances of 6 to 9 Km
• 2.6 GHz (shared with MMDS); 3.5 GHz (in licitation); 5 GHz (no need license)
ain
Iss • Basically 100% UMTS (WCDMA/HSDPA)
Ericsson and Nokia technologies
• Main application: broadband connection PC/Laptop in to Internet
• Some Operators (Embratel, BrT, Neovia)
• Boom will be in 2009 after 3.5 GHz licitation
• Government will try to reserve some space to small business
Ma small business
Video and TV
• IPTV (VoD and Live): implantation by Operators
Source: http://www.teleco.com.br/en
• DTV: SBTVD developed - MPEG-4 (H.264):
• Japanese standard to transport system
• Brazilian middleware GINGA for interactivity

Software and Services Global Market – 2007 (US$ Billion) 12th position in the world ranking with
50
100 315
( $ ) • 12th position in the world ranking with domestic market (0.9 % of BR-GDP)
• Forecast of more than12% annual average growth rate by 2010
• Local development represents 34% of the
0
SA an UK ny ce da aly ds ia in na zil
en nd ea ld
Local development represents 34% of the market
• ~ 8,000 companies (94% are SMB)11
S f
US
Japa U
Ger
man
Fran
c
Cana
d
Ita
Net
herla
nd
Aust
ral
Spa
Chi n
Braz
Swed
e
Switz
erla
n
Kore
Rest
of W
or
Software RevenueMarket by Class
(US$ Million)
995
571 Parameterizable Software
Custom Developed Software
2,623Standard Software
Total : US$ 4.2 Billion
Source: http://www.abes.org.br/UserFiles/Image/PDFs/Mercado_BR2008.pdf

Telecom CRM and BusinessIT
Top 5 – Players
Telecom Infra-structure
ProvidersTop 5 – Players
CRM and Business Analytics Software
Top 5 – Players
ITInfra-structure
Providers
ERICSSON
Alcatel-Lucent
Siemens Nokia
SAS
ORACLE
SAP
Cisco
Juniper
Alcatel LucentSiemens-Nokia
Motorola
Nortel
Microsoft
Salesforce.com
Alcatel-Lucent
Huawei
NEC
Billing & Mediation
T 5 Pl
NMS
PSV T l
OSS/BSS ISV
Top 5 – Players
ERICSSON
Comptel
Top 5 – Players
IBM
HP
PSV-Telecom
VÍSENT
LivewareComptel
Convergys
Orga
Harrys
ERICSSON
ORACLE
Suntech
Objective
I lAmdocs ORACLE
Source: TIinside and IDG
Iclass

Macro economic i
Technologyscenario
• Uncertainties• TelCos/CelCos -reducing overall
• IP Consolidation• Convergence• NGN and IN• WiMaxg
investment, specially in infrastructure
• 3G• Digital TV and IPTV
1.Investment based strictly on ROI
(exception: meet demand)DemandDemand RegulatoryRegulatory
(exception: meet demand)
2.Prioritization of services in relation to
the infrastructure
3 S li di ifi i ( i ll f
• Competition
• Network’s Expansion
• Mobility
• Opened Market
• Rules Changed (LGT)
• New Licenses Licitation3.Suppliers diversification (specially for
services providers)
4.Network utilization by Content
• Broadband Applications
• Video and Images
• New Rules for: WiMax
and Digital TV
Providers
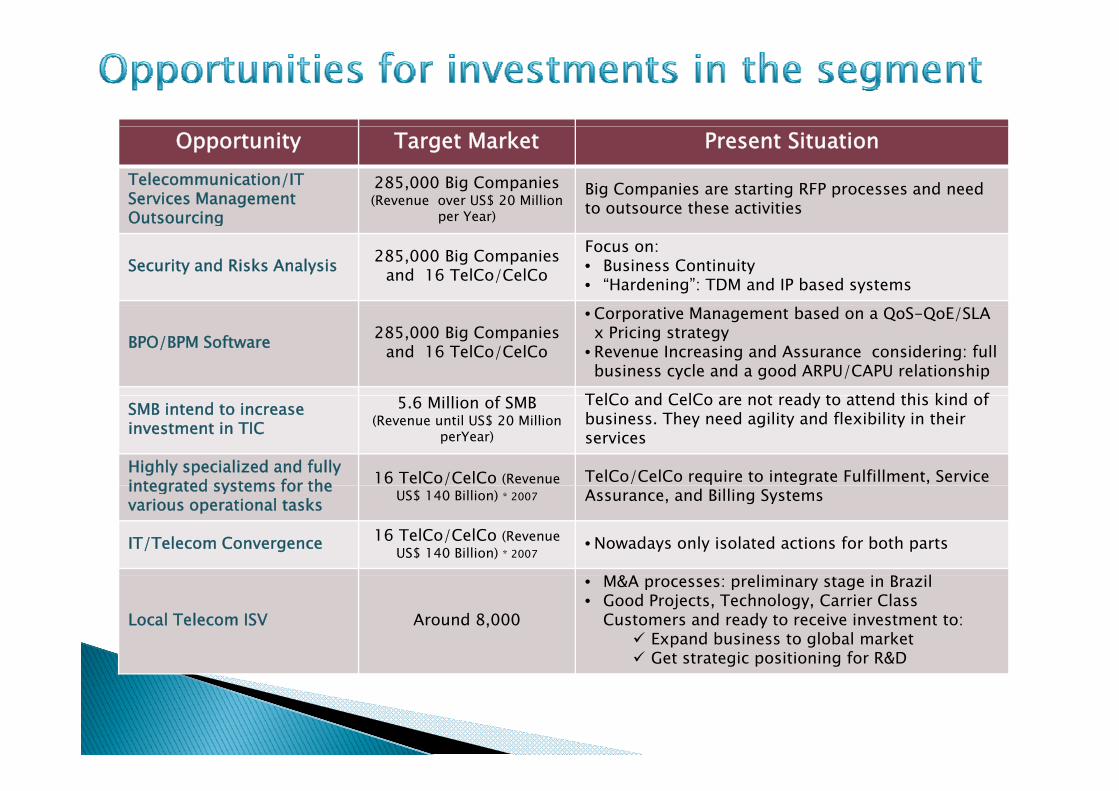
Opportunity Target Market Present SituationTelecommunication/IT Services Management Outsourcing
285,000 Big Companies(Revenue over US$ 20 Million
per Year)
Big Companies are starting RFP processes and need to outsource these activitiesOutsourcing per Year)
Security and Risks Analysis 285,000 Big Companies and 16 TelCo/CelCo
Focus on:• Business Continuity• “Hardening”: TDM and IP based systems
BPO/BPM Software 285,000 Big Companies and 16 TelCo/CelCo
• Corporative Management based on a QoS-QoE/SLAx Pricing strategy
• Revenue Increasing and Assurance considering: full business cycle and a good ARPU/CAPU relationship
T lC d C lC t d t tt d thi ki d fSMB intend to increase investment in TIC
5.6 Million of SMB (Revenue until US$ 20 Million
perYear)
TelCo and CelCo are not ready to attend this kind of business. They need agility and flexibility in their services
Highly specialized and fully integrated systems for the 16 TelCo/CelCo (Revenue TelCo/CelCo require to integrate Fulfillment, Service integrated systems for the various operational tasks
/US$ 140 Billion) * 2007 Assurance, and Billing Systems
IT/Telecom Convergence 16 TelCo/CelCo (RevenueUS$ 140 Billion) * 2007
• Nowadays only isolated actions for both parts
& l l
Local Telecom ISV Around 8,000
• M&A processes: preliminary stage in Brazil• Good Projects, Technology, Carrier Class
Customers and ready to receive investment to:Expand business to global marketGet strategic positioning for R&Dg p g
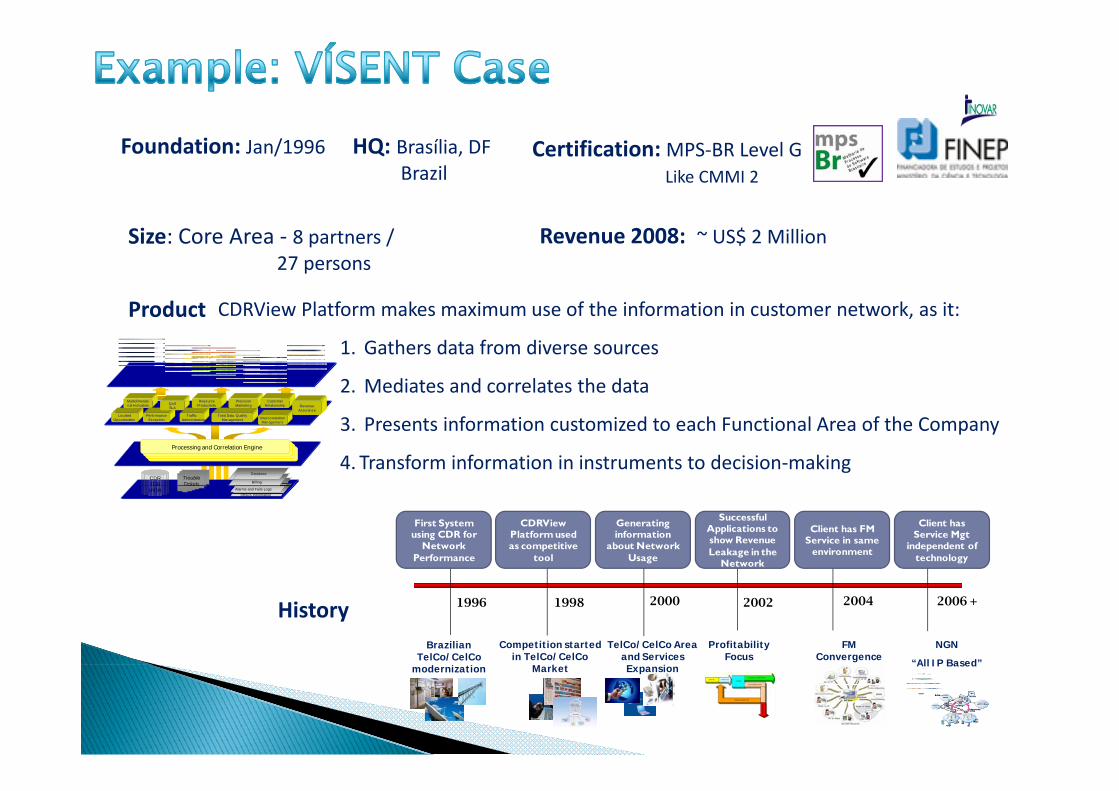
Foundation: Jan/1996 HQ: Brasília, DFBrazil
Certification: MPS‐BR Level GLike CMMI 2
Product CDRVie Platform makes ma im m se of the information in c stomer net ork as it
Size: Core Area ‐ 8 partners / 27 persons
Revenue 2008: ~ US$ 2 Million
Product CDRView Platform makes maximum use of the information in customer network, as it:
1. Gathers data from diverse sources
2. Mediates and correlates the data
3. Presents information customized to each Functional Area of the Company
4. Transform information in instruments to decision‐making
LocatedOpportunities
Multidimensional Indicators
PerformanceException
QoSSLA
Traffic Administration
ResourceProductivity
Processing Correlation Engine
Total Data QualityManagement
PrecisionMarketing
InterconnectionManagement
CustomerRelationship Revenue
Assurance
CDRTDR
TroubleTickets
Database
Billing
Processing and Correlation Engine
TDRIPDR
Tickets
Others InformationAlarms and Fails Logs
Utilizing Counters
Client has Service Mgt
independent of technology
First System using CDR for
Network Performance
CDRView Platform used as competitive
tool
Generating information
about Network Usage
Successful Applications to show Revenue Leakage in the
Network
Client has FM Service in same
environment
HistoryBrazilian
TelCo/CelCod i i
1996 1998
Profitability Focus
20022000
TelCo/CelCo Area and Services E i
FM Convergence
2004
Competition started in TelCo/CelCo
M k t
2006 +
NGN
“All IP Based”modernization ExpansionMarket All IP Based

Present Clients Area: Service Usage, Precision Marketing, Network Performance,
Revenue Assurance, CRM Back Office, and Quality of Service
for TelCo/CelCo: Voice, Data, Messages, and Video based Services
1,000
CDR/day(Million)
900
500
450
350
100
350
200
96 97 98 99 00 01 02 03 04 05 06 07 08 YearsIn production since ...
