brain areas underlying visual mental imagery and -
TRANSCRIPT

www.elsevier.com/locate/cogbrainres
Cognitive Brain Research 20 (2004) 226–241
Research report
Brain areas underlying visual mental imagery and visual perception:
an fMRI study
Giorgio Ganisa,b,c,*, William L. Thompsona, Stephen M. Kosslyna,d
aDepartment of Psychology, Harvard University, Cambridge, MA 02138, USAbDepartment of Radiology, Massachusetts General Hospital Martinos Center, Boston, MA 02114, USA
cHarvard Medical School, Boston, MA 02115, USAdDepartment of Neurology, Massachusetts General Hospital, Boston, MA 02114, USA
Accepted 15 February 2004
Available online 30 April 2004
Abstract
We used functional magnetic resonance imaging (fMRI) to assess the maximal degree of shared neural processing in visual mental
imagery and visual perception. Participants either visualized or saw faint drawings of simple objects, and then judged specific aspects of the
drawings (which could only be evaluated properly if they used the correct stimulus). The results document that visual imagery and visual
perception draw on most of the same neural machinery. However, although the vast majority of activated voxels were activated during both
conditions, the spatial overlap was neither complete nor uniform; the overlap was much more pronounced in frontal and parietal regions than
in temporal and occipital regions. This finding may indicate that cognitive control processes function comparably in both imagery and
perception, whereas at least some sensory processes may be engaged differently by visual imagery and perception.
D 2004 Elsevier B.V. All rights reserved.
Theme: Neural Basis of Behavior
Topic: Cognition
Keywords: Visual cognition; Visual imagery; Cognitive neuroscience; fMRI; Cognitive control processes
1. Introduction
During visual mental imagery, perceptual information is
retrieved from long-term memory, resulting in the subjective
impression of ‘‘seeing with the mind’s eye’’. The phenom-
enological similarity between visual imagery and visual
perception has been noted at least since the time of the
Greek philosophers. Plato, for instance, describes mental
imagery by using the metaphor of a mental artist painting
pictures in the soul (Philebus 39c). At least since the 1960s,
after the cognitive revolution that followed the behaviorist
years, ‘analog’ theories posited that visual mental imagery
and visual perception share numerous common representa-
tions and processes. This hypothesis led to many behavioral
0926-6410/$ - see front matter D 2004 Elsevier B.V. All rights reserved.
doi:10.1016/j.cogbrainres.2004.02.012
* Corresponding author. Department of Psychology, Harvard Univer-
sity, 33 Kirkland Street, Cambridge, MA 02138, USA. Tel.: +1-617-495-
3569; fax: +1-617-496-3112.
E-mail address: [email protected] (G. Ganis).
predictions, which typically bore fruit. For example, visual
imagery selectively interferes with visual perception more
than auditory perception (and vice versa [8,54]), more time
is required to scan greater distances across visualized
objects [9,34], and eye movements during imagery are
similar to those made during perception [42].
If we assume that cognitive processes arise from specific
patterns of brain activation, then the hypothesis that like-
modality imagery and perception share many common
representations and processes can also be tested using
neuroimaging. Specifically, this view leads us to predict
substantial overlap in neural activation during visual mental
imagery and visual perception.
To date, only one study [39] has been designed specif-
ically to (1) compare directly the pattern of brain activation
during visual mental imagery and visual perception across
most of the brain, and (2) quantify the degree of overlap.
This study was designed to compare stimuli and tasks that
differed on the surface but were hypothesized to share

Fig. 1. Schematic of the structure of a trial in the imagery and perception
conditions. In the imagery condition, participants kept their eyes closed
throughout the scan. Each trial began with the name of a previously studied
object, presented auditorily via headphones. In the imagery condition,
participants had to generate a visual mental image of the object. In the
perception condition, participants saw a faint picture of the named object. In
both cases, participants had to wait for the auditory probe (4.5 s later; ‘‘W’’,
meaning ‘‘wider than tall’’ in this schematic) specifying the judgment to be
performed. Upon hearing the probe, participants performed the judgment as
quickly and accurately as they could, and response times (RT) and accuracy
were recorded.
G. Ganis et al. / Cognitive Brain Research 20 (2004) 226–241 227
numerous underlying processes [35]. The perceptual task
required participants to decide whether names were appro-
priate for objects presented in canonical or non-canonical
views, and the imagery task required participants to visual-
ize upper case letters in grids and decide whether an X
would have fallen on each letter, if it were actually present.
Positron emission tomography (PET) was used to monitor
regional cerebral blood flow as participants performed these
tasks. The aim of the study was to establish a lower bound
on the amount of overlap between brain regions engaged
during visual mental imagery and perception. The main
finding was that approximately two thirds of the activated
regions were engaged by both tasks, suggesting a substantial
degree of overlap in the underlying processing.
However, this study [39] has two major limitations. The
first is that the amount of overlap was calculated on the
proportion of regions that were activated in common over a
threshold, ignoring the extent of activation. This can be
misleading; for example, a region in the dorsolateral pre-
frontal cortex activated in common might have been much
smaller than a region in the parietal lobe that was activated
only during one condition. A second limitation is that the
imagery and perception tasks differed in many ways, which
is likely to lead us to underestimate the amount of overlap
that would be found in imagery and perception tasks that are
more similar.
More recent studies have used stimuli and tasks that were
more similar to each other (i.e., perceiving vs. imaging
faces), but these studies have focused on occipito-temporal
regions per se and have quantified the degree of overlap only
in these regions. Moreover, these studies also had important
limitations. For example, consider the study reported by
Ishai et al. [27]; during the perception condition, the partic-
ipants passively viewed stimuli presented at a rate of 1 every
second, whereas during the imagery condition, they were
asked to visualize stimuli from the same stimulus category at
the same rate. Because no behavioral measurement was
collected, it is difficult to know what the participants were
actually doing in the two conditions. Furthermore, because it
is unlikely that people can image stimuli at the rate of 1
every second [37], it is not clear whether the observed
differences reflect intrinsic distinctions between visual men-
tal imagery and perception or instead reflect other differ-
ences between the two conditions. Additional studies have
examined the brain areas activated during mental navigation,
but these studies did not focus on a direct comparison
between actual navigation and mental navigation [20,47].
We designed the present study to compare the upper
bound of the similarity in processing between visual imagery
and visual perception. To do so, we devised a task that could
be used in both imagery and perception conditions so that
differences in the pattern of brain activation observed in
these two conditions could not be attributed to task differ-
ences. The visual mental imagery task consisted of forming a
mental image of a previously studied line drawing and then
evaluating a probed property (e.g., judging whether the
object was taller than it was wide). The visual perception
task was identical to the visual imagery task, with the only
difference being that a faint picture was presented on a
computer monitor throughout each trial and participants
evaluated the visible picture (Fig. 1).
In addition, we used functional magnetic resonance
imaging (fMRI), which allows us to quantify the amount
of overlap by comparing the number of voxels activated in
common during imagery and perception. This study allowed
us to assess precisely the pattern of similarities and differ-
ences in brain activation between the two activities.
Although the crucial comparisons are between the two
conditions, we nevertheless needed a baseline against
which to assess the degree of activation. We employed a
slow event-related fMRI paradigm and used a low-level
baseline estimated from the data during the interval be-
tween the response on each trial and the stimulus presen-
tation of the following trial. Because the purpose of this
study was to compare the overall brain areas involved in
imagery and perception, we wanted to minimize the
chance of subtracting out activation of interest (cf. Refs.
[17,57]), which may be more likely with more complex
baselines. Note that this type of baseline is different from
the ‘‘resting baseline’’ used in PET studies [24], where
participants are asked to spend several minutes simply
‘‘resting’’. In this paradigm, the baseline is embedded in
the task and, from the participant’s point of view, it feels
like a natural pause prior to the next experimental trial.
Both visual mental imagery and visual perception are the
product of the interplay of multiple cortical and subcortical

G. Ganis et al. / Cognitive Brain Research 20 (2004) 226–241228
regions (e.g., Refs. [35,41]). Thus, we expected both con-
ditions to engage large sets of brain areas. Moreover, based on
the study by Kosslyn et al. [39], we expected to find a
substantial amount of overlap between the conditions. Be-
cause we used two versions of the same task in the perception
and imagery conditions, thus equating many of the task
requirements in these two conditions, we expected the
overlap to be especially high in brain regions more heavily
involved in cognitive control, such as prefrontal cortex (e.g.,
Ref. [49]) and parietal cortex (e.g., Refs. [26,27,39]). Fur-
thermore, consistent with the results of previous studies, we
also expected imagery and perception to draw on many of the
same portions of occipital and temporal cortex, including
striate cortex [27,28,36,39,40,50].
2. Materials and methods
2.1. Participants
Twenty normal, right-handed volunteers (8 males, 12
females, mean age = 21 years) participated in the study. All
participants had normal or corrected-to-normal vision, were
right-handed, and had no history of neurological disease. All
participants gave written informed consent for the study
according to the protocols approved by Harvard University
and Massachusetts General Hospital Institutional Review
Boards.
Five of the twenty participants were not included in the
analyses because a large portion of their data was not
usable, either because of uncorrectable motion artifacts
(two participants) or because of equipment problems (three
participants). The demographics of these five participants
were comparable to those of the entire group. Thus, the
analyses reported here were on data from the remaining 15
participants.
2.2. Stimuli
We prepared 96 line drawings of common objects,
using a white foreground against a black background.
The visual contrast of the line drawings was 15% to
reduce brain activation that would be elicited by the
stimuli in visual cortex during the perception condition
[29]. An example of a stimulus is shown in Fig. 1.
Additional stimuli were prepared for the practice trials
(four for each block). We divided the objects into two
sets, and presented one in imagery blocks, the other in
perception blocks, counterbalanced across participants.
These sets, in turn, were divided into three subsets, each
used with a pair of judgments. The possible judgments
were: ‘‘taller than wide,’’ ‘‘wider than tall,’’ ‘‘contains
circular parts,’’ ‘‘contains rectangular parts,’’ ‘‘more on
top,’’ and ‘‘more on bottom.’’ Each judgment was asso-
ciated with an auditory probe cue (e.g., ‘‘W’’ for ‘‘wider
than tall’’).
2.3. Procedure
The tasks were administered by a Macintosh G3 Power-
book computer (Apple, Cupertino, CA), using Psyscope
software [45]. The stimuli were projected via a magnetically
shielded LCD video projector onto a translucent screen
placed behind the head of the participants. Participants
could see the stimuli via a front-surface mirror mounted
on the head coil.
Prior to the MRI session (3–7 days in advance), we gave
the participants a booklet with hard copies, white fore-
ground on black background, of all the stimuli, one per
page; we asked them to study the stimuli in preparation for
the MRI experiment. Prior to the MRI session, we also
administered the Vividness of Visual Imagery Questionnaire
(VVIQ, Ref. [46]) and Edinburgh Handedness Question-
naire [51], as well as a general health history questionnaire.
In this session, we did not describe the types of questions
that would be asked during the MRI session, to minimize
the possibility that object characteristics might be encoded
verbally during study.
Each MRI session consisted of six functional scans,
alternating imagery and perception conditions. The imag-
ery and perception conditions were administered in sepa-
rate scans to avoid potential artifacts due to the cognitive
demands associated with task switching [31–33]. More-
over, we were concerned about possible carry-over effects
if the two tasks were intermixed, which would inflate the
amount of apparent common activation. Because the
imagery and perception scans alternated, it is highly
unlikely that the results were contaminated by scanner
drift or other slow artifacts. Before the scans, we acquired
conventional anatomical MRIs; while these images were
being obtained, the participants listened to the names of all
the objects to be presented in the experiment, which was
intended to help them understand the words during the
noisy echoplanar imaging (EPI) session. Before each
functional scan, we gave each participant detailed instruc-
tions, which included teaching them how to make the
appropriate judgments for that block and the meanings of
the probe cue abbreviations. Following this, any questions
about the procedure were answered. We then presented
four practice trials.
The structure of each trial is illustrated in Fig. 1. In the
imagery scans, we turned off all room lights and asked
participants to keep their eyes closed, to eliminate any
residual light that might have been present in the room
(e.g., from equipment LEDs). Each trial began with the
name of a picture, presented auditorily, at which point
participants were to generate the corresponding visual
mental image. An auditory probe was presented 4.5 s later
and participants performed the corresponding judgment on
the visualized object. Two judgments were used in each
scan, randomly intermixed (out of six possible judgments),
to reduce the chance that participants performed the judg-
ment before the auditory probe. Participants responded by

G. Ganis et al. / Cognitive Brain Research 20 (2004) 226–241 229
pressing one of two keys with the dominant hand. We asked
the participants not to press either key if they could not
understand the name at the beginning of a trial, so that these
trials could be later identified and discarded. Participants
were instructed to avoid eye movements and to be ready for
the next trial while keeping their eyes closed during the
interval between trials.
In the perception scans, we asked participants to perform
the same task, but based on a visible picture instead of a
mental image. The structure of each trial was the same as in
the imagery condition, with the following differences: The
participants kept their eyes open, and a low-contrast line
drawing of the named object was presented on the screen
from the onset of the auditory name until the response was
made. Immediately after each trial, the participants were to
fixate on a small asterisk presented on the screen and to be
ready for the next trial.
In both conditions, participants were instructed to try
avoid ‘‘day dreaming’’ during the interval between trials and
to focus on being ready to process the next trial. They were
asked to make the appropriate judgment as quickly and
accurately as possible.
Each scan consisted of 16 trials, for a total of 48 trials per
condition. The inter-trial interval was 21 s. On average, the
interval between the end of one trial and the beginning of
the next was about 15 s.
2.4. MRI parameters
We used a 3-T Siemens Allegra scanner with a whole-
head coil. Blood oxygenation changes were monitored by
using a T2*-sensitive sequence (gradient echo, TR= 1500
ms, TE = 30 ms, FOV= 20 cm, flip angle = 90j, 64� 64
matrix, voxel size = 3.125� 3.125� 6 mm). Each scan
resulted in 234 volumes, each composed of 15, 6 mm,
oblique slices (slice gap = 1 mm). T1-weighted EPI
images acquired at the same locations as the subsequent
BOLD images were acquired just before the functional
scans to facilitate later coregistration of the functional
images with the high-resolution structural images. High-
resolution, full-volume structural images were collected
for all participants using SPGR imaging before and after
the functional scans (128, 1.3-mm-thick sagittal slices,
TR = 6.6 ms, TE = 2.9 ms, FOV= 25.6 cm, flip angle = 8j,256� 256 matrix). These high-resolution images were
used for spatial normalization.
2.5. MRI analyses
We preprocessed and analyzed the data with AFNI [7].
The BOLD time series were motion corrected using AFNI
program ‘‘3dvolreg’’. Next, we resampled the data to a
4� 4� 4-mm grid, smoothed slightly with a Gaussian filter
(full-width half-maximum = 4 mm, AFNI program
‘‘3dmerge’’) and spatially transformed to match the
MNI305 template [6]. Note that the same spatial transfor-
mation was applied to the functional time series from the
imagery and perception conditions.
We did not assume an a-priori hemodynamic response
function; instead, we used a finite impulse response (FIR)
model and estimated the fMRI response at each time point
independently using multiple linear regression (AFNI pro-
gram ‘‘3dDeconvolve’’). The multiple regression model
included an offset (i.e., mean) and a linear trend coefficient
for each scan, plus one coefficient for each time step in the
window of interest (from � 1.5 s before trial onset to 16.5 s
after trial onset). Correct, incorrect, and no-response trials
were modeled separately; only the data for trials where the
participant’s response was correct are reported here. Next,
for each voxel, we normalized the estimated hemodynamic
response by dividing each resulting value by the offset
coefficient (averaged across the three scans for each con-
dition). Maps of percent signal change for each participant
were obtained by computing the ‘‘area under the curve’’
(i.e., by taking the sum of the normalized regression
coefficients between 3 s and 12 s post-onset, which
included most of the hemodynamic response). Note that,
if the signal during the trials did not differ from the signal
between trials (baseline), then the offset and the linear trend
parameters would explain most of the variance throughout
the scan and the resulting area under the curve (i.e.,
estimated signal change) would be close to zero. Finally,
we performed one sample (imagery and perception con-
ditions) and paired (perception-imagery contrast) t-tests to
generate statistical parametric maps. We only retained
clusters of five or more contiguous voxels that were
significant at p < 0.0001, leading to an alpha of 0.05 for
the entire 3D image. This minimum cluster size was
determined using the Monte-Carlo approach described by
Xiong et al. [59] and implemented by programs
‘‘3dFWHM’’ and ‘‘AlphaSim’’ (with 1000 iterations) in
AFNI. This method (a) estimates the smoothing present in
the data based on a variant of the algorithm described by
Forman et al. [16], and (b) determines the number of
clusters of a given size that would be significant at a
particular threshold due to chance. The probability of a
false positive detection across the entire image is then
determined by the frequency counts of cluster sizes. Finally,
the t maps were converted to Z score maps.
It is important to note that, unlike some other studies
(e.g., Ref. [28]), we kept the map thresholds identical for the
imagery and perception conditions. Indeed, although acti-
vation was stronger during visual perception than imagery
in occipital cortex, which might justify using a different
threshold, that was not the case in many other brain regions
(e.g., frontal cortex).
We quantified the amount of overlap in terms of indi-
vidual voxels. First, we counted the number of ‘‘common’’
voxels (C), that is voxels for which the contrast Perception
vs. Imagery was not significant and that exhibited a signif-
icant activation change (relative to baseline) during both
imagery and perception. Next, we counted the number of

G. Ganis et al. / Cognitive Brain Research 20 (2004) 226–241230
‘‘different’’ voxels (D), that is voxels for which the contrast
Perception vs. Imagery was significant and that exhibited a
significant activation (relative to baseline), in at least one
condition. Finally, we calculated the percentage of shared
voxels (S) as:
S ¼ 100� C
C þ D:
This method of calculating C and D voxels is similar to
the conjunction analysis described by [53], but differs from
methods based on counting the number of voxels activated
in common in two conditions regardless of the significance
of the direct contrast between them.
To characterize better the pattern of similarity between
conditions, we performed the same calculations indepen-
dently for multiple brain regions. For example, we calcu-
lated the percentage of shared voxels within the inferior
frontal gyrus, the middle frontal gyrus, and so on. Because
precise localization of these regions was not crucial for the
issue at hand, we used ROIs defined using the Talairach
Daemon database [43], as implemented in AFNI, and
confirmed visually that these ROIs provided a reasonable
fit to individual brain structures.
3. Results
We first summarize the behavioral results, and then turn
to the fMRI results.
3.1. Performance data
On each trial, participants pressed one of two keys in
response to the probe question. Participants were instructed
not to press either key if they could not understand the name
at the beginning of a trial because of scanner noise. Overall,
the name was missed more often during the imagery than
during the perception blocks (20.6% vs. 5.2%, respectively,
F(1,14) = 22.32, p < 0.001). However, for the trials on which
a response was made, accuracy was very high and did not
differ between imagery and perception (96.2% vs. 97.3%
correct, respectively, F(1,14) = 0.78, p>0.1). The response
times (RTs) for correct trials were slower in the imagery
condition than in the perception condition (medians: 1384
vs. 1232 ms, respectively, F(1,14) = 6.3, p = 0.025). The
same analysis was performed on a subgroup of 12 (out of
15) participants, excluding the 3 participants with the highest
Imagery/Perception RT ratios. For this subgroup, there were
no reliable differences between the median RTs in the two
conditions (1299 vs. 1208 ms, respectively, F(1,14) = 2,
p = 0.18). After the main analysis of the brain activation data
with all 15 participants, we will report the results from this
subgroup of 12 participants in order to eliminate any possible
effects of differences in overall difficulty between the con-
ditions. Furthermore, we will report the results of a linear
regression analysis, also aimed at assessing the potential
effect of difficulty on the pattern of results. This analysis was
designed to identify brain regions for which activation could
be predicted by the RTs. Note that we will not report data
from individual participants (e.g., how many participants
showed activation in a particular brain region) because of the
limited power of such analyses in this study (i.e., with a
maximum of 48 trials per condition, it is likely that there are
many subthreshold activations, which would be missed) and
because the group analysis tells us all we need to know about
the reliability of the effects across participants.
3.2. fMRI data
Numerous brain regions were activated in the visual
perception and visual imagery conditions (Fig. 2 and Table
1). It is clear from Fig. 2 and Table 1 that the overall pattern
of activation in the two conditions is remarkably similar but,
nevertheless, this similarity is not uniform across brain
regions.
Table 1 shows that the overall proportion of overlap was
very high, about 92%. Note that there are numerous ‘‘un-
assigned’’ voxels (U), which could not be classified as C or
D voxels. For instance, some voxels were significantly
active in the imagery condition but not in the perception
condition and thus could not be classified as C voxels;
however, they also could not be classified as D voxels
because the contrast Imagery vs. Perception was not signif-
icant. The vast majority of the C voxels (4301 out of 4430)
increased activation during both imagery and perception,
whereas a small minority (129 out of 4430) decreased
activation in both conditions. Most of the D voxels (371
out of 392) significantly increased activation during the
perception condition (both relative to baseline and to the
imagery condition) but not during the imagery condition. A
few voxels (5 out of 392) increased activation in both
conditions (relative to baseline) but to a greater degree
during perception than imagery. Finally, a few voxels (16
out of 392) decreased activation during perception relative
to both baseline and the imagery condition.
3.2.1. Pattern of similarity across brain regions
Fig. 2 and Tables 2–4 show that the amount of common
activation during imagery and perception was not uniform
across brain regions: the similarity was greatest in the
frontal and parietal cortex and smallest in the occipital
cortex. Because most regions were activated bilaterally,
hereafter we will imply bilateral activation when discussing
specific anatomical structures unless explicitly stated other-
wise. Furthermore, hereafter we will use the term ‘‘activa-
tion’’ to indicate positive changes, whereas we will use
‘‘negative activation’’ to indicate negative changes in the
BOLD signal (relative to the inter-trial baseline).
3.2.1.1. Frontal cortex. Both imagery and perception eli-
cited reliable activation, and occasionally negative activation,

G. Ganis et al. / Cognitive Brain Research 20 (2004) 226–241 231
in frontal regions (Table 3 and Fig. 2A). Reliable activation
was present in the inferior frontal gyrus, the middle frontal
gyrus, the superior frontal gyrus, the medial frontal gyrus, the
insular cortex, the precentral gyrus, and the anterior cingulate
Fig. 2. Activation maps (N= 15) displayed on a normalized brain (coronal sections)
in frontal regions is illustrated with six sections. The exact position of each section
maps (Z scores) for the perception condition, the imagery condition, and the contra
frontal lobe (see also Table 2), as indicated by the lack of any active voxels in the t
illustrated with six sections. (C) The pattern of similarity in parietal and occipital
visible in the second row of panels from the bottom. The left side of the brain is
gyrus; there were small clusters of negative activation cen-
tered in the medial and superior frontal cortex and in the
anterior cingulate. There was complete overlap between
conditions in all frontal areas, as shown in Table 2.
; the left side of the brain is shown on the right. (A) The pattern of similarity
is shown on the sagittal view (top right). The three columns show activation
st perception minus imagery. Note that the pattern of overlap is 100% in the
hird column. (B) The pattern of similarity in parietal and temporal regions is
regions is illustrated with six sections. Portions of the calcarine cortex are
shown on the right.

continued ).
G. Ganis et al. / Cognitive Brain Research 20 (2004) 226–241232
3.2.1.2. Parietal cortex. Both imagery and perception
elicited reliable activation in parietal regions (Table 3 and
Fig. 2C). These regions included the left angular gyrus, the
supramarginal gyrus, the inferior parietal lobule, the superior
parietal lobule, the precuneus, the postcentral gyrus, and the
middle and posterior cingulate. Common negative activation
was present in the right supramarginal gyrus. There was
almost complete overlap in the activation of the precuneus,
Fig. 2 (
and there was complete overlap in the left angular gyrus, the
supramarginal gyrus, the inferior parietal lobule, the superior
parietal lobule, and the postcentral gyrus (Table 2). There was
a small cluster for which there was more negative activation
in the perception than in the imagery condition (Table 4). This
cluster encompassed portions of the posterior cingulate and
left rostro-medial portions of the precuneus. In addition,
activation was stronger in the perception than imagery
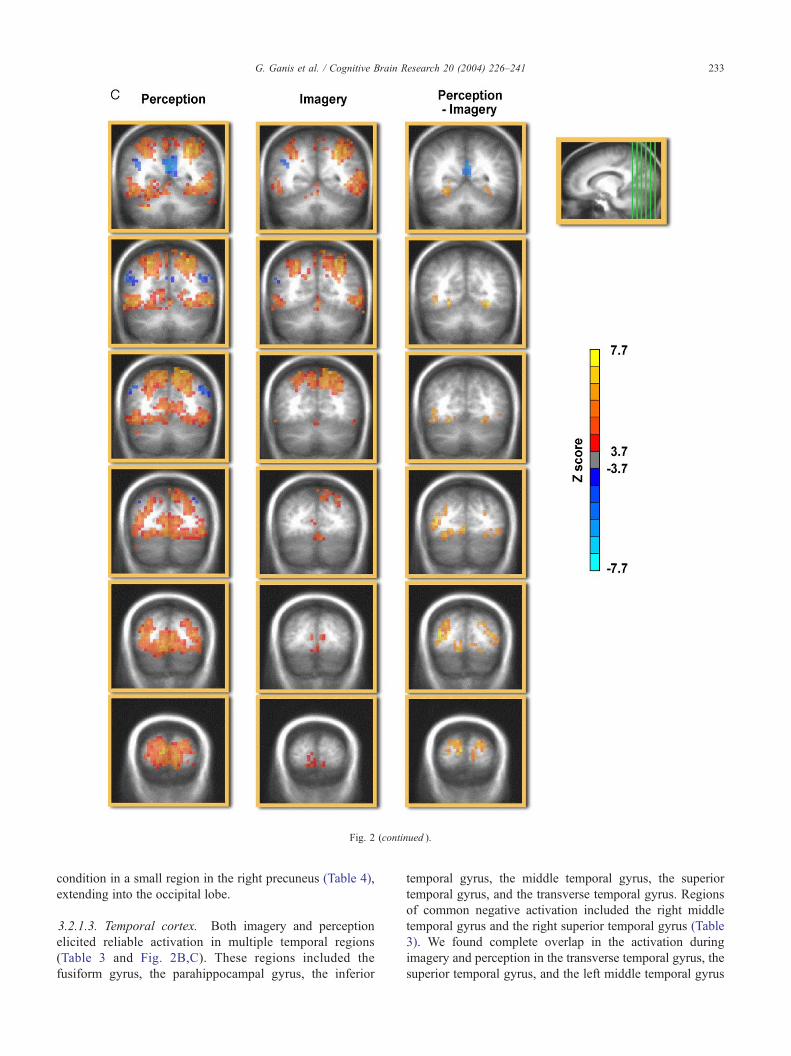
Fig. 2 (continued ).
G. Ganis et al. / Cognitive Brain Research 20 (2004) 226–241 233
condition in a small region in the right precuneus (Table 4),
extending into the occipital lobe.
3.2.1.3. Temporal cortex. Both imagery and perception
elicited reliable activation in multiple temporal regions
(Table 3 and Fig. 2B,C). These regions included the
fusiform gyrus, the parahippocampal gyrus, the inferior
temporal gyrus, the middle temporal gyrus, the superior
temporal gyrus, and the transverse temporal gyrus. Regions
of common negative activation included the right middle
temporal gyrus and the right superior temporal gyrus (Table
3). We found complete overlap in the activation during
imagery and perception in the transverse temporal gyrus, the
superior temporal gyrus, and the left middle temporal gyrus
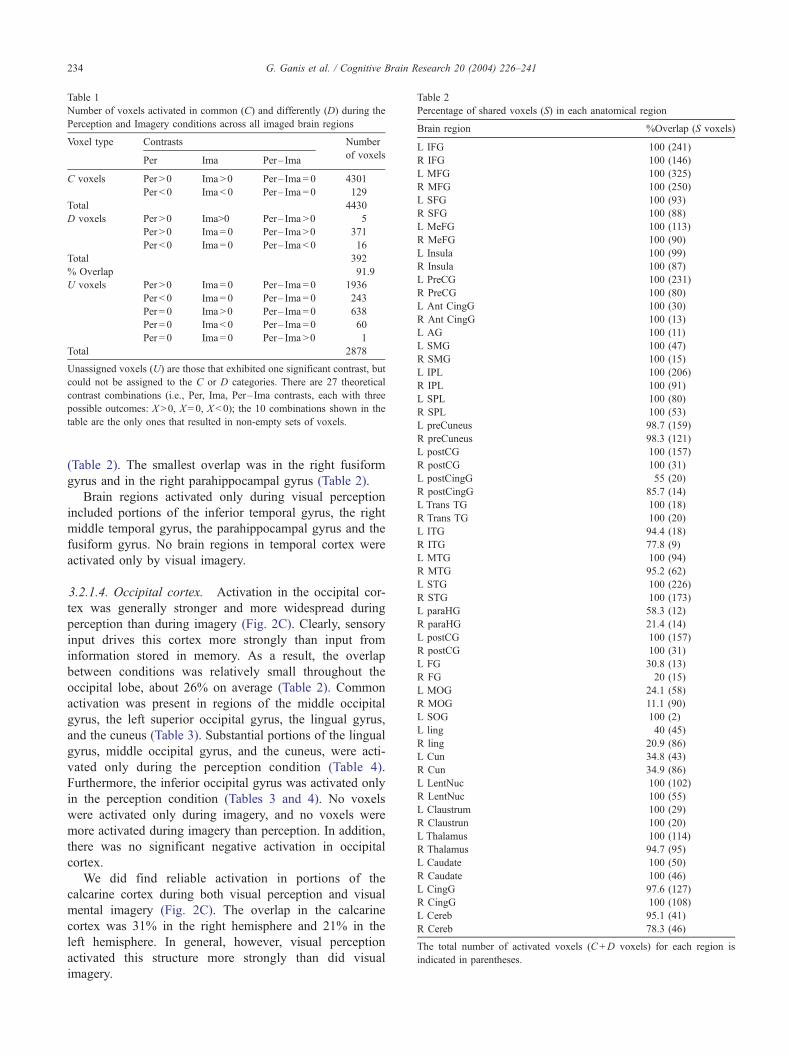
Table 1
Number of voxels activated in common (C) and differently (D) during the
Perception and Imagery conditions across all imaged brain regions
Voxel type Contrasts Number
Per Ima Per– Imaof voxels
C voxels Per >0 Ima >0 Per– Ima = 0 4301
Per < 0 Ima < 0 Per– Ima = 0 129
Total 4430
D voxels Per >0 Ima>0 Per– Ima >0 5
Per >0 Ima = 0 Per– Ima >0 371
Per < 0 Ima = 0 Per– Ima < 0 16
Total 392
% Overlap 91.9
U voxels Per >0 Ima = 0 Per– Ima = 0 1936
Per < 0 Ima = 0 Per– Ima = 0 243
Per = 0 Ima >0 Per– Ima = 0 638
Per = 0 Ima < 0 Per– Ima = 0 60
Per = 0 Ima = 0 Per– Ima >0 1
Total 2878
Unassigned voxels (U) are those that exhibited one significant contrast, but
could not be assigned to the C or D categories. There are 27 theoretical
contrast combinations (i.e., Per, Ima, Per– Ima contrasts, each with three
possible outcomes: X >0, X = 0, X < 0); the 10 combinations shown in the
table are the only ones that resulted in non-empty sets of voxels.
Table 2
Percentage of shared voxels (S) in each anatomical region
Brain region %Overlap (S voxels)
L IFG 100 (241)
R IFG 100 (146)
L MFG 100 (325)
R MFG 100 (250)
L SFG 100 (93)
R SFG 100 (88)
L MeFG 100 (113)
R MeFG 100 (90)
L Insula 100 (99)
R Insula 100 (87)
L PreCG 100 (231)
R PreCG 100 (80)
L Ant CingG 100 (30)
R Ant CingG 100 (13)
L AG 100 (11)
L SMG 100 (47)
R SMG 100 (15)
L IPL 100 (206)
R IPL 100 (91)
L SPL 100 (80)
R SPL 100 (53)
L preCuneus 98.7 (159)
R preCuneus 98.3 (121)
L postCG 100 (157)
R postCG 100 (31)
L postCingG 55 (20)
R postCingG 85.7 (14)
L Trans TG 100 (18)
R Trans TG 100 (20)
L ITG 94.4 (18)
R ITG 77.8 (9)
L MTG 100 (94)
R MTG 95.2 (62)
L STG 100 (226)
R STG 100 (173)
L paraHG 58.3 (12)
R paraHG 21.4 (14)
L postCG 100 (157)
R postCG 100 (31)
L FG 30.8 (13)
R FG 20 (15)
L MOG 24.1 (58)
R MOG 11.1 (90)
L SOG 100 (2)
L ling 40 (45)
R ling 20.9 (86)
L Cun 34.8 (43)
R Cun 34.9 (86)
L LentNuc 100 (102)
R LentNuc 100 (55)
L Claustrum 100 (29)
R Claustrun 100 (20)
L Thalamus 100 (114)
R Thalamus 94.7 (95)
L Caudate 100 (50)
R Caudate 100 (46)
L CingG 97.6 (127)
R CingG 100 (108)
L Cereb 95.1 (41)
R Cereb 78.3 (46)
The total number of activated voxels (C+D voxels) for each region is
indicated in parentheses.
G. Ganis et al. / Cognitive Brain Research 20 (2004) 226–241234
(Table 2). The smallest overlap was in the right fusiform
gyrus and in the right parahippocampal gyrus (Table 2).
Brain regions activated only during visual perception
included portions of the inferior temporal gyrus, the right
middle temporal gyrus, the parahippocampal gyrus and the
fusiform gyrus. No brain regions in temporal cortex were
activated only by visual imagery.
3.2.1.4. Occipital cortex. Activation in the occipital cor-
tex was generally stronger and more widespread during
perception than during imagery (Fig. 2C). Clearly, sensory
input drives this cortex more strongly than input from
information stored in memory. As a result, the overlap
between conditions was relatively small throughout the
occipital lobe, about 26% on average (Table 2). Common
activation was present in regions of the middle occipital
gyrus, the left superior occipital gyrus, the lingual gyrus,
and the cuneus (Table 3). Substantial portions of the lingual
gyrus, middle occipital gyrus, and the cuneus, were acti-
vated only during the perception condition (Table 4).
Furthermore, the inferior occipital gyrus was activated only
in the perception condition (Tables 3 and 4). No voxels
were activated only during imagery, and no voxels were
more activated during imagery than perception. In addition,
there was no significant negative activation in occipital
cortex.
We did find reliable activation in portions of the
calcarine cortex during both visual perception and visual
mental imagery (Fig. 2C). The overlap in the calcarine
cortex was 31% in the right hemisphere and 21% in the
left hemisphere. In general, however, visual perception
activated this structure more strongly than did visual
imagery.

Table 3
C voxels for each contrast
Contrast Brain region % (Total) x, y, z
P>0, I>0, P–I = 0 L IFG 99.6 (241) � 45, 20, 13
R IFG 100 (146) 45, 16, 14
L MFG 96.9 (325) � 37, 22, 30
R MFG 98.8 (250) 37, 21, 31
L SFG 83.9 (93) � 20, 34, 33
R SFG 81.8 (88) 20, 38, 30
L MeFG 75.2 (113) � 8, 10, 45
R MeFG 76.7 (90) 8, 12, 45
L Insula 100 (99) � 38, � 1, 11
R Insula 100 (87) 39, 4, 7
L PreCG 100 (231) � 43, � 5, 36
R PreCG 100 (80) 42, 0, 33
L Ant CingG 73.3 (30) � 9, 28, 20
R Ant CingG 92.3 (13) 8, 25, 23
L AG 100 (11) � 33, � 60, 34
L SMG 100 (47) � 47, � 44, 33
R SMG 60 (15) 40, � 43, 35
L IPL 100 (206) � 44, � 40, 40
R IPL 100 (91) 40, � 43, 43
L SPL 100 (80) � 28, � 61, 51
R SPL 100 (53) 28, � 61, 50
L preCuneus 98.7 (159) � 18, � 66, 43
R preCuneus 98.3 (121) 16, � 65, 44
L postCG 100 (157) � 49, � 23, 39
R postCG 100 (31) 47, � 24, 35
L postCingG 55 (20) � 4, � 36, 20
R postCingG 85.7 (14) 3, � 37, 20
L CingG 97.6 (127) � 7, 5, 35
R CingG 100 (108) 7, 6, 35
L Trans TG 100 (18) � 49, � 22, 12
R Trans TG 100 (20) 47, � 24, 12
L ITG 94.4 (18) � 55, � 57, � 6
R ITG 77.8 (9) 52, � 49, � 13
L MTG 100 (94) � 51, � 52, 3
R MTG 83.9 (62) 51, � 41, 0
L STG 100 (226) � 54, � 25, 9
R STG 94.2 (173) 52, � 24, 7
L paraHG 58.3 (12) � 17, � 34, 1
R paraHG 21.4 (14) 18, � 28, � 4
L FG 30.8 (13) � 51, � 54, � 14
R FG 20 (15) 46, � 53, � 12
L MOG 24.1 (58) � 51, � 63, 5
R MOG 11.1 (90) 49, � 62, 6
L SOG 100 (2) � 32, � 75, 30
L lingG 40 (45) � 4, � 86, � 5
R lingG 20.9 (86) 6, � 91, � 7
L Cun 34.9 (43) � 12, � 81, 14
R Cun 34.9 (86) 5, � 86, 9
L LentNuc 100 (102) � 23, � 2, 3
R LentNuc 100 (55) 22, 1, 3
L Claustrum 100 (29) � 30, 5, 3
R Claustrun 100 (20) 28, 16, 4
L Thalamus 100 (114) � 10, � 18, 8
R Thalamus 94.7 (95) 8, � 17, 8
L Caudate 100 (50) � 14, 0, 14
R Caudate 100 (46) 12, 3, 12
L CingG 97.6 (127) � 7, 5, 35
R CingG 100 (108) 7, 6, 35
L Cereb 95.1 (41) � 10, � 49, � 9
R Cereb 78.3 (46) 11, � 53, � 12
P < 0, I < 0, P– I = 0 L IFG 0.4 (241) � 54, 23, � 12
L MFG 3.1 (325) � 26, 28, 38
R MFG 1.2 (250) 49, 20, 40
Table 3 (continued)
Contrast Brain region % (Total) x, y, z
P < 0, I < 0, P– I = 0 L SFG 16.1 (93) � 17, 44, 37
R SFG 18.2 (88) 15, 44, 38
L MeFG 24.8 (113) � 4, 52, 7
R MeFG 23.3 (90) 4, 53, 16
L Ant CingG 26.7 (30) � 6, 33, 9
R Ant CingG 7.7 (13) 18, 35, 20
R AG 100 (3) 50, � 58, 33
R SMG 40 (15) 45, � 54, 31
R MTG 11.3 (62) 48, � 51, 16
R STG 5.8 (173) 45, � 56, 26
The first number indicates the percentage of voxels for which the contrasts
indicated on the left were significant. The number in parentheses indicates
the total number of voxels (C+D voxels in the region indicated on the left).
Talairach coordinates refer to the center of mass of clusters within the
indicated region. All contrasts are at p= 0.0001. ‘‘P’’ indicates ‘‘Percep-
tion’’; ‘‘I’’ indicates ‘‘Imagery’’.
G. Ganis et al. / Cognitive Brain Research 20 (2004) 226–241 235
The differences between imagery and perception were
not restricted to spatial extent; we also found that the time
course of the hemodynamic response in many occipital
regions (including the calcarine cortex) was different in
the two conditions. The hemodynamic response in the
imagery condition began 2 s after the onset of the trial,
peaked around 6 s, and began to decay 2 s after the end of
the trial. The hemodynamic response in the perception
condition showed the same initial peak, but also a later
peak about 4 s later, perhaps due to stimulus offset.
3.2.1.5. Subcortical nuclei. Several subcortical nuclei
were activated during imagery and perception, including
thalamic nuclei, the claustrum, the caudate, and the lenti-
form nucleus. In all cases, the overlap in activation during
the two conditions was almost complete. However, we
failed to observe any activation in the amygdala or in the
hippocampus proper.
3.2.1.6. Cerebellum. We also found substantial overlap in
the cerebellum, mainly in the culmen, declive and vermis.
The non-overlapping voxels were engaged more during
visual perception than visual mental imagery.
3.2.2. Additional analyses. As noted earlier, the same
analysis was carried out on a subset of 12 participants for
which there was no difference in RTs during imagery and
perception (reported in the Behavioral data section). The
same pattern of results was observed as in the analysis on all
15 participants. However, in this analysis, there were fewer
active voxels overall (6286 vs. 7700) because of the
decreased statistical power, and the overall percentage of
shared voxels, S, was slightly higher (96% vs. 91.9%). The
distribution of the amount of overlap across the brain was
essentially the same as in the analysis of all 15 participants.
We also performed a linear regression analysis to assess
further the effect of difficulty on the pattern of brain
activation. In this analysis, the RT difference between the
imagery and perception conditions for each participant was

Table 4
D voxels for each contrast
Contrast Brain region % (Total) x, y, z
P>0, I>0, P–I>0 R lingG 1.2 (86) 6, � 85, � 8
L Cun 4.7 (43) � 6, � 89, 10
R Cun 2.3 (86) 16, � 84, 20
P>0, I = 0, P– I>0 R preCuneus 1.7 (121) 24, � 79, 32
L ITG 5.6 (18) � 46, � 69, 0
R ITG 22.2 (9) 42, � 65, 0
R MTG 4.8 (62) 40, � 70, 12
L paraHG 41.7 (12) � 27, � 55, � 5
R paraHG 78.6 (14) 23, � 49, � 3
L FG 69.2 (13) � 28, � 60, � 8
R FG 80 (15) 25, � 62, � 9
L IOG 100 (43) � 42, � 79, � 4
R IOG 100 (23) 38, � 76, � 4
L MOG 75.9 (58) � 30, � 86, 9
R MOG 88.9 (90) 33, � 82, 9
L lingG 60 (45) � 19, � 76, � 3
R lingG 77.9 (86) 16, � 77, 3
L Cun 60.5 (43) � 19, � 89, 20
R Cun 62.8 (86) 18, � 88, 21
R Thalamus 5.3 (95) 17, � 30, 4
L Cereb 4.9 (41) � 30, � 49, � 12
R Cereb 21.7 (46) 21, � 48, � 10
P < 0, I = 0, P– I < 0 L preCuneus 1.3 (159) � 6, � 55, 26
L postCingG 45 (20) � 4, � 53, 19
R postCingG 14.3 (14) 2, � 53, 18
L CingG 2.4 (127) � 3, � 53, 28
The first number indicates the percentage of voxels for which the contrasts
indicated on the left were significant. The number in parentheses indicates
the total number of voxels (C+D voxels in the region indicated on the left).
Talairach coordinates refer to the center of mass of clusters within the
indicated region. All contrasts are at p= 0.0001. ‘‘P’’ indicates ‘‘Percep-
tion’’; ‘‘I’’ indicates ‘‘Imagery’’.
G. Ganis et al. / Cognitive Brain Research 20 (2004) 226–241236
used to predict the differential brain activation between
these two conditions. Thus, activation in regions identified
in this analysis could be due to the difference in difficulty
between the conditions. This analysis revealed no regions in
which activation was predicted by the RTs ( p = 0.001, 5
contiguous voxels), which suggests that task difficulty (as
quantified by response times) was not an important factor in
producing the results.
4. Discussion
In this study, we used fMRI to compare the neural
structures engaged during visual perception with those
engaged during visual mental imagery. We specifically
designed our imagery and perception tasks to be as similar
as possible, thereby allowing us to observe an upper bound
on the possible shared structures used in imagery and
perception. As anticipated, we found extensive overlap
between the brain areas engaged by visual perception and
visual mental imagery. However, the amount of overlap
varied across the brain, and was maximal in frontal and
parietal cortices. An important finding is that the regions
engaged by visual imagery across the brain were a subset of
those engaged during visual perception. Previous studies
may have failed to document this phenomenon because of
differences between the tasks employed.
Although the present study was not designed to reveal
the roles of specific brain regions in visual mental imagery
and visual perception, we can draw on relevant findings
from the literature to guide us in interpreting the data.
A number of the brain regions activated in common may
not be necessary to carry out imagery but instead may
support general-purpose aspects of the tasks. For instance,
there was a complete overlap of activation in the precentral
gyrus. At least portions of the precentral gyrus were
involved in the generation of the motor response, rather
than in visual imagery or perception per se, as suggested by
the late phasic activation observed, especially in the left
hemisphere (responses were made with the right hand).
Similarly, activation in the transverse temporal gyrus and
in the superior temporal gyrus was essentially identical in
the two conditions, which is not surprising because this
activation most likely reflects processing of the auditory
stimuli. Indeed, the time course of activation in these
regions showed two sharp peaks that closely follow the
auditory input. Note, however, that this point does not
undermine the observation that the set of voxels activated
in the visual mental imagery condition is a subset of that
activated in the visual perception condition: Eliminating
some common voxels from the total count (e.g., because
they reflect general-purpose processes) would not change
the fact that the voxels activated during visual imagery are a
subset of those activated during visual perception.
Imagery and perception activated frontal structures in
remarkably similar ways; in all of the regions we examined,
the spatial pattern of activation was identical. Although there
is still no agreement on the precise role of frontal regions in
perception and cognition, the prevalent view is that they are
involved in numerous types of cognitive control processes
[49]. Kosslyn [35] argued that frontal cortex implements an
information shunting system, which purportedly is involved
in multiple aspects of visual mental imagery and visual
perception. Numerous cognitive control processes would be
drawn upon in common in the perception and imagery
versions of the task, including those involved in the retrieval
of episodic information associated with the auditory probe,
the maintenance of information about the judgment to be
carried out during visual inspection, performing the visual
evaluation, and the generation of the motor response;
cognitive control processes, such as those involved in the
generation of visual images and the identification of faint
visual objects, are also likely to engage common frontal
regions [35]. The use of such processes may account for the
widespread activation in numerous prefrontal regions during
both imagery and perception. Note that some studies have
reported differences in prefrontal cortex between activation
elicited during visual imagery and visual perception (e.g.,
Refs. [27,28]). It is likely that such differences were due in
large part to differences between the tasks used in the two

G. Ganis et al. / Cognitive Brain Research 20 (2004) 226–241 237
conditions. Indeed, in these studies visual imagery was
usually compared with passive viewing of visual stimuli.
Our results suggest that, when appropriately matched, visual
perception and visual mental imagery activate the same
subset of prefrontal regions.
Visual mental imagery and perception elicited overlap-
ping activation in multiple parietal regions. These regions
included the superior parietal lobule and the precuneus, both
of which are thought to play crucial roles in the same
cognitive control network that includes frontal cortices
[44]. These regions have been implicated in attentional
processes [5] and spatial working memory [7,55]. A study
by Kosslyn et al. [39] comparing imagery and perception
reported common activation in these parietal regions (whose
Talaraich coordinates were very close to the coordinates of
the corresponding regions found in the present study).
Additional regions in parietal cortex were activated in
common, including the left angular gyrus, the supramarginal
gyrus, and the inferior parietal lobule. Many of these regions
have been implicated in visuospatial processing [11,22,48],
and thus, it is not surprising that they were activated during
our tasks, which had a spatial component (e.g., ‘‘is the
object taller than wide?’’). Common activation in the post-
central gyrus (especially in the left hemisphere) was prob-
ably related to somatosensory stimulation associated with
the motor response, but it could also be related to spatial
aspects of the task [56]. The only difference between
imagery and perception was found in a small cluster
encompassing portions of the posterior cingulate and rostral
portions of the precuneus. Within this cluster, activation
during visual perception was reliably more negative than
during visual imagery. However, because it is unclear
whether negative activation reflects an actual reduction of
neural activity or whether it reflects other factors not directly
related to neural activity [25], we will not speculate about
the meaning of this difference.
In addition, we also found activation in a region in the
parahippocampal gyrus during visual perception and found
activation in a subset of this region during imagery, which is
consistent with findings from the previous studies that have
compared activation in the ventral stream during imagery
and perception (e.g., Ref. [50]). Although this region has
been reported to respond more strongly to scenes depicting
places than to objects, it nevertheless also responds to visual
objects [10]. This medial temporal region may play a role in
encoding and storing memories of visual objects and events
[4,58]. We observed a similar pattern of activation in the
fusiform gyrus and in the inferior temporal gyrus, where a
subset of voxels was activated only during visual perception,
whereas another subset was activated both during visual
perception and visual mental imagery. This finding is con-
sistent with those from previous studies [27,28], and sug-
gests that these regions may be involved in storing memories
of visual objects that can be re-activated both by signals from
lower-level visual cortex and by signals from higher-level
cortices involved in cognitive control processes.
We did not observe any activation in the hippocampus,
which is not unusual for visual imagery tasks. Indeed, a
recent meta-analysis [36] examined 59 visual imagery
studies, and found that only five experiments reported
hippocampal activation [20,23,28,38,47]. It is not entirely
clear what aspects of the tasks are in common among these
studies, but two factors might be important to elicit hippo-
campal activation during visual imagery: the use of tasks
with a marked spatial component and/or the presentation of
to-be-visualized materials immediately before the scanning
session.
The inferior occipital gyrus and the right superior occip-
ital gyrus were engaged only during perception. In addition,
most of the voxels in the middle occipital gyrus, the left
superior occipital gyrus, the lingual gyrus, and the cuneus
were activated only during perception, but a minority was
activated also during imagery. The reason why large por-
tions of occipito-temporal cortex were activated during
visual perception but not during visual imagery may be that
these visual cortical regions are involved in mid-level
perceptual operations aimed at facilitating object detection
and/or identification (e.g., grouping, fast object categoriza-
tion based on surface properties, and so on). Such functions
are not required for visual mental images because these
images usually do not need to be detected or identified (one
knows what one is visualizing when one forms the image).
An interesting prediction of this hypothesis is that tasks that
require the identification of visual patterns in images, such
as in tasks involving the combination of elementary visual
shapes to form new objects [13–15], should elicit stronger
activation in these regions.
The partial overlap of activation in occipito-temporal
cortex during visual perception and visual mental imagery
is consistent with findings from the studies of neurological
patients. Indeed, findings from a number of studies have
shown that visual imagery can be preserved in the presence
of impaired perception in patients with damage to the
occipital and posterior temporal lobe (e.g., Refs. [1,3,18]).
Note, however, that several occipito-temporal voxels were
activated in common between perception and imagery,
which suggests that portions of occipito-temporal cortex
are used in both cases. Damage to such common neural
substrates could account for neurological cases who had
parallel pattern of deficits in visual imagery and visual
perception [12].
At least some of the differences we found between
imagery and perception may reflect the stimulus properties
of the visual stimuli. Although we used visual stimuli with
relatively low contrast (15%), it is known that even such
low-contrast levels elicit between 65% and 75% of the
maximum response in areas V1, V2, V3, V3A and V4 [29].
Some of the large areas of activation in visual cortex that
were present only during visual perception probably were
elicited by the abrupt stimulus onset, which did not occur
during the imagery condition. Most neurons in the primate
visual pathway exhibit very large responses to stimulus

G. Ganis et al. / Cognitive Brain Research 20 (2004) 226–241238
transients [19]. The second peak of activation in visual
cortex during perception is consistent with this conjecture;
such activation could be modeled reasonably well by
assuming two events that would coincide with stimulus
onset and offset.
We also found reliable activation of calcarine cortex
during both imagery and perception. This finding is con-
sistent with prior neuroimaging evidence [36] and with
evidence that rTMS of medial occipital cortex impairs both
perception and imagery [40]. Both the task used in that
study and the task used in the present study required
judging details in the visually imaged stimulus. In fact, a
recent meta-analysis [36] found that having to ‘‘inspect
details with high resolution’’ was one of the factors that
predicted when early visual cortex was activated during
visual imagery. Two other important factors were imaging
of non-spatial visual attributes (spatial attributes activate
posterior parietal cortex, but not medial occipital cortex)
and the sensitivity of the technique (3T fMRI being a
technique with high sensitivity).
One might ask whether and to what extent visual cortex
activation during visual imagery and visual perception
could be the result of eye movements. On the one hand,
during the perception condition, eye movements during
stimulus presentation may produce additional visual cortex
activation because at the end of each saccade there is a new
visual transient. This would not be a concern during the
visual imagery condition because there was no light stim-
ulating the retina. Although we did not measure eye move-
ments directly, we were able to estimate the amount of eye
movements present in the imagery and perception condi-
tions by looking at the coefficient of variation of the MRI
signal (standard deviation/mean) in the eye vitreous [2].
Overall, this coefficient was larger during perception than
during imagery [0.2 vs. 0.07, F(1,14) = 7.1, p < 0.05], sug-
gesting that participants made some eye movements during
the perception condition, and more than in the imagery
condition.
On the other hand, eye movements per se may have an
effect because some studies have suggested that visual
cortex activation is affected by eye movements [30,52].
Although there is good evidence for activation in the
frontal eye fields and in superior parietal cortex during
voluntary eye movements, the evidence regarding the
effects of eye movements on visual cortex activation is
mixed: the study by Paus et al. found deactivation in striate
cortex during voluntary saccades, whereas the study by
Kimmig et al. found increased activation in striate cortex.
However, the study by Kimmig et al. may have had a
confound: during the saccade condition, a small square
would appear in the periphery and participants had to
saccade to it every few seconds. The control condition
consisted in fixating the same square in the center of the
screen. Kimmig et al. reported activation in V5, as well as
in striate and extrastriate cortex during the saccade condi-
tion, relative to fixation. The activation in V5 could be, at
least in part, due to the apparent motion of the square
during the saccade conditions rather than to eye move-
ments; furthermore, activation in striate and extrastriate
cortex could be, at least in part, due to the transient
generated by the fovea ‘‘landing’’ on the target square
during the saccade condition. Thus, if we assume that
visual cortex is deactivated during saccades, as suggested
by Paus et al., then it is unlikely that eye movements per se
were responsible for the observed activation during visual
imagery or perception.
Many additional brain regions were engaged in common,
including the medial frontal cortex, the insular region,
thalamic nuclei, and the cerebellum, but we will not
speculate about the specific roles these regions may play
in imagery and perception. However, it is worth noting that
some of these brain regions may reflect aspects of process-
ing that relate to performing the judgments, and others to the
representation of the shapes per se. At first glance, this
might appear to be a problem: It is possible that our
estimates of overlap between imagery and perception are
inflated by the common judgment processes used in the two
conditions. We have three responses to this concern: First,
the fact that imagery activates a subset of the brain activated
by perception stands, even if we removed voxels that reflect
processing the judgments. Second, if the representations of
shape were qualitatively different in imagery and percep-
tion, it would not make sense to apply the same processes to
them. Thus, even if some of the common activation reflects
the task, this still attests to the similarity in the underlying
representations. Third, it is not entirely clear that the task
can be completely separated from the representation: The
mere requirement to extract certain information may cause
that information to be included in the representation. For
example, when asked to visualize a cat and then determine
whether it has curved front claws, most people report that
they only add the claws when asked the question; the task
partially determines what is represented.
One might also ask what effect task difficulty may have
on the pattern of results, given that the median RTs were
slower for visual imagery than for visual perception. How-
ever, differences in task difficulty cannot explain the results
because the percentage of shared voxels, S, actually in-
creased when we analyzed the data only from a subgroup of
12 participants for which the RTs were matched. Further-
more, a linear regression using the RTs to predict brain
activation indicated that the pattern of response times was
unlikely to be responsible for the observed pattern of brain
activation.
Finally, it is important to address potential issues in our
choice of the baselines. We chose a ‘‘no-task’’ baseline
because we wanted to minimize the chance of subtracting
out activation occurring during the experimental conditions.
This is reasonable, given that the emphasis of this study was
on the comparison between the activation across the brain
during visual perception and imagery. However, one could
argue that using such baselines is problematic because
G. Ganis et al. / Cognitive Brain Research 20 (2004) 226–241 239
participants may experience task-unrelated images and
thoughts (TUITs) when they are not processing external
information [21]: some voxels may not show activation
during the visual perception or imagery conditions simply
because a similar activation is elicited during the baselines.
Furthermore, this artifact may be more pronounced during
the visual imagery condition because participants kept their
eyes closed. Although it is possible that participants experi-
enced some TUITs during the interval between trials, thus
potentially reducing the apparent activation in the experi-
mental conditions, this is unlikely to be a major confound.
First, it is true that participants tend to experience TUITs
during extended resting conditions carried out in a separate
sessions, such as in PET studies that have examined brain
activation at ‘‘rest’’ [24]. However, TUITs are less likely to
occur in paradigms where the experimental conditions and
the baseline are intermixed and the ‘‘no-task’’ time is
relatively short. Second, the fact that we found robust
activation in a multitude of brain regions during both visual
imagery and perception (as reported, the overlap was over
90%) suggests that TUITs did not contaminate patterns of
activation in the imagery condition, even though it may seem
to have afforded a greater opportunity for such events than
the perception condition. Furthermore, the pattern of activa-
tion was generally consistent with that found in previous
visual imagery and perception studies. Third, TUITs during
the interval between trials may introduce some spurious
activation, but it is probably much weaker and less consistent
throughout the scan than that produced by the explicit visual
imagery task. TUITs do not occur each time there is a pause
between task stimuli [21]: most likely, the precise timing and
duration of occurrence vary throughout a scan and is not
time-locked with the experimental paradigm. The result is a
much weaker average signal than the time-locked one
elicited by the imagery/perception conditions. Fourth, the
use of any other baseline would encounter similar problems
because there are always processes in the experimental
condition which one could argue are the same as in the
baseline. For instance, a baseline condition involving decid-
ing whether numbers presented continuously are odd or even
may have a substantial cognitive control component that
might cancel out frontal activation. Fifth, the striking pattern
of similarity between the brain activation elicited by the two
conditions (relative to their respective baselines) suggests
that the baselines were reasonably similar. Indeed, artifactual
differences between baselines would tend to produce arti-
factual differences in the resulting brain activation patterns,
rather than coincidental similarities. Sixth, there is no evi-
dence that TUITs occur more often when people keep their
eyes closed as opposed to when they keep their eyes open
and fixate a faint dot in an otherwise completely dark room.
If it were true that keeping the eyes closed induces massive
increases in TUITs during the baseline condition, then one
would expect not to see striate cortex activation during visual
imagery experiments in which participants keep their eyes
closed. A recent meta-analysis [36] examining the effect of
this variable clearly shows this not to be the case: striate
cortex activation is not affected by whether participants
keep their eyes closed or open during the experiment.
Seventh, regions that tend to be active during ‘‘rest’’ are in
the medial frontal cortex, the posterior medial cortex, and
posterior lateral cortices [24]. In our study, there were
small regions of deactivation in the medial prefrontal
cortex and in the posterior medial cortex, both in visual
imagery and perception. It is possible that deactivations in
these specific regions may have to do with TUITs occur-
ring between trials.
In conclusion, the present results further document that
visual imagery and visual perception draw on most of the
same neural machinery. However, the overlap is neither
uniform nor complete; visual imagery and visual perception
appear to engage frontal and parietal regions in more similar
ways than occipital and temporal regions. This finding may
indicate that cognitive control processes function similarly in
both imagery and perception, but—perhaps counter-intui-
tively—at least some sensory processes may be engaged
differently by visual imagery and perception.
Acknowledgements
We wish to thank Dr. Haline Schendan and Dr. Nouchine
Hadjikhani for helpful discussion, Jennifer Shephard and
Deborah Bell for their assistance in stimulus selection, and
Lawrence White, Jennifer Holmes, and Mary Foley for
assistance during MRI data collection. This research was
supported by grants NIH: 5 R01 MH60734, NSF: REC-
0106760, and NIMA NMA201-01-C-0032. The MRI
infrastructure at MGH was supported in part by the National
Center for Research Resources (P41RR14075) and the
Mental Illness and Neuroscience Discovery (MIND)
Institute.
References
[1] P. Bartolomeo, A.C. Bachoud-Levi, B. De Gelder, G. Denes, G. Dalla
Barba, P. Brugieres, J.D. Degos, Multiple-domain dissociation be-
tween impaired visual perception and preserved mental imagery in
a patient with bilateral extrastriate lesions, Neuropsychologia 36
(1998) 239–249.
[2] M.S. Beauchamp, Detection of eye movements from fMRI data,
Magn. Reson. Med. 49 (2003) 376–380.
[3] M. Behrmann, M. Moscovitch, G. Winocur, Intact visual imagery and
impaired visual perception in a patient with visual agnosia, J. Exp.
Psychol. Hum. Percept. Perform. 20 (1994) 1068–1087.
[4] J.B. Brewer, Z. Zhao, J.E. Desmond, G.H. Glover, J.D. Gabrieli,
Making memories: brain activity that predicts how well visual expe-
rience will be remembered, Science 281 (1998) 1185–1187.
[5] R. Cabeza, F. Dolcos, S.E. Prince, H.J. Rice, D.H. Weissman, L.
Nyberg, Attention-related activity during episodic memory retrieval:
a cross-function fMRI study, Neuropsychologia 41 (2003) 390–399.
[6] D. Collins, P. Neelin, T. Peters, A. Evans, Automatic 3D intersubject
registration of MR volumetric data in standardized Talairach space,
J. Comput. Assist. Tomogr. 18 (1994) 192–205.

G. Ganis et al. / Cognitive Brain Research 20 (2004) 226–241240
[7] S.M. Courtney, L.G. Ungerleider, K. Keil, J.V. Haxby, Object and
spatial working memory activate separate neural systems in human
cortex, Cereb. Cortex, (1996) 39–49.
[8] C. Craver-Lemley, A. Reeves, How visual imagery interferes with
vision, Psychol. Rev. 99 (1992) 633–649.
[9] M. Denis, S.M. Kosslyn, Scanning visual images: a window on the
mind, Curr. Psychol. Cogn. 18 (1999) 409–465.
[10] R. Epstein, A. Harris, D. Stanley, N. Kanwisher, The parahippocam-
pal place area: recognition, navigation, or encoding? Neuron 23
(1999) 115–125.
[11] I. Faillenot, J. Decety, M. Jeannerod, Human brain activity related to
the perception of spatial features of objects, NeuroImage 10 (1999)
114–124.
[12] M.J. Farah, The neurological basis of mental imagery: a componential
analysis, Cognition 18 (1984) 245–272.
[13] R.A. Finke, Imagery, creativity, and emergent structure, Conscious.
Cogn. 5 (1996) 381–393.
[14] R.A. Finke, K. Slayton, Explorations of creative visual synthesis in
mental imagery, Mem. Cogn. 16 (1988) 252–257.
[15] R.A. Finke, S. Pinker, M.J. Farah, Reinterpreting visual patterns in
mental imagery, Cogn. Sci. 13 (1989) 51–78.
[16] S.D. Forman, J.D. Cohen, M. Fitzgerald, W.F. Eddy, M.A. Mintun,
D.C. Noll, Improved assessment of significant activation in functional
magnetic resonance imaging (fMRI): use of a cluster-size threshold,
Magn. Reson. Med. 33 (1995) 636–647.
[17] K.J. Friston, C.J. Price, P. Fletcher, C. Moore, R.S. Frackowiak, R.J.
Dolan, The trouble with cognitive subtraction, NeuroImage 4 (1996)
97–104.
[18] G. Ganis, W.L. Thompson, F.W. Mast, S.M. Kosslyn, Visual imagery
in cerebral visual dysfunction, Neurol. Clin. 21 (2003) 631–646.
[19] T.J. Gawne, J.M. Martin, Responses of primate visual cortical neurons
to stimuli presented by flash, saccade, blink, and external darkening,
J. Neurophysiol. 88 (2002) 2178–2186.
[20] O. Ghaem, E. Mellet, F. Crivello, N. Tzourio, B. Mazoyer, A.
Berthoz, M. Denis, Mental navigation along memorized routes acti-
vates the hippocampus, precuneus, and insula, NeuroReport 8 (1997)
739–744.
[21] L.M. Giambra, A laboratory method for investigating influences on
switching attention to task-unrelated imagery and thought, Conscious.
Cogn. 4 (1995) 1–21.
[22] S. Gobel, V. Walsh, M.F. Rushworth, The mental number line and the
human angular gyrus, NeuroImage 14 (2001) 1278–1289.
[23] G. Goldenberg, I. Podreka, F. Uhl, M. Steiner, K. Willmes, L.
Deecke, Cerebral correlates of imagining colours, faces and a map-I.
SPECT of regional cerebral blood flow, Neuropsychologia 27 (1989)
1315–1328.
[24] D.A. Gusnard, M.E. Raichle, Searching for a baseline: functional
imaging and the resting human brain, Nat. Rev., Neurosci. 2 (2001)
685–694.
[25] N. Harel, S.P. Lee, T. Nagaoka, D.S. Kim, S.G. Kim, Origin of
negative blood oxygenation level-dependent fMRI signals, J. Cereb.
Blood Flow Metab. 22 (2002) 908–917.
[26] J.B. Hopfinger, M.H. Buonocore, G.R. Mangun, The neural me-
chanisms of top-down attentional control, Nat. Neurosci. 3 (2000)
284–291.
[27] A. Ishai, L.G. Ungerleider, J.V. Haxby, Distributed neural systems for
the generation of visual images, Neuron 28 (2000) 979–990.
[28] A. Ishai, J.V. Haxby, L.G. Ungerleider, Visual imagery of famous
faces: effects of memory and attention revealed by FMRI, Neuro-
Image 17 (2002) 1729–1741.
[29] S. Kastner, D.H. O’Connor, M.M. Fukui, H.M. Fehd, U. Herwig,
M.A. Pinsk, Functional imaging of the human lateral geniculate nu-
cleus and pulvinar, J. Neurophysiol. 91 (2004) 438–448.
[30] H. Kimmig, M.W. Greenlee, M. Gondan, M. Schira, J. Kassubek,
T. Mergner, Relationship between saccadic eye movements and cor-
tical activity as measured by fMRI: quantitative and qualitative
aspects, Exp. Brain Res. 141 (2001) 184–194.
[31] S. Konishi, K. Nakajima, I. Uchida, M. Kameyama, K. Nakahara,
K. Sekihara, Y. Miyashita, Transient activation of inferior prefrontal
cortex during cognitive set shifting, Nat. Neurosci. 1 (1998) 80–84.
[32] S. Konishi, M. Kawazu, I. Uchida, H. Kikyo, I. Asakura, Y. Miya-
shita, Contribution of working memory to transient activation in hu-
man inferior prefrontal cortex during performance of the Wisconsin
Card Sorting Test, Cereb. Cortex 9 (1999) 745–753.
[33] S. Konishi, K. Nakajima, I. Uchida, H. Kikyo, M. Kameyama,
Y. Miyashita, Common inhibitory mechanism in human inferior
prefrontal cortex revealed by event-related functional MRI, Brain
122 (Pt. 5) (1999) 981–991.
[34] S.M. Kosslyn, Scanning visual images: some structural implications,
Percept. Psychophys. 14 (1973) 90–94.
[35] S.M. Kosslyn, Image and Brain, MIT Press, Cambridge, MA, 1994.
[36] S.M. Kosslyn, W.L. Thompson, When is early visual cortex acti-
vated during visual mental imagery? Psychol. Bull. 129 (2003)
723–746.
[37] S.M. Kosslyn, B.J. Reiser, M.J. Farah, S.L. Fliegel, Generating
visual images: units and relations, J. Exp. Psychol. Gen. 112 (1983)
278–303.
[38] S.M. Kosslyn, N.M. Alpert, W.L. Thompson, V. Maljkovic, S.B.
Weise, C.F. Chabris, Visual mental imagery activates topographically
organized visual cortex: PET investigations, J. Cogn. Neurosci. 5
(1993) 263–287.
[39] S.M. Kosslyn, W.L. Thompson, N.M. Alpert, Neural systems shared
by visual imagery and visual perception: a positron emission tomog-
raphy study, NeuroImage 6 (1997) 320–334.
[40] S.M. Kosslyn, A. Pascual-Leone, O. Felician, S. Camposano, J.P.
Keenan, W.L. Thompson, G. Ganis, K.E. Sukel, N.M. Alpert, The
role of area 17 in visual imagery: convergent evidence from PET
and rTMS, Science 284 (1999) 167–170.
[41] S.M. Kosslyn, G. Ganis, W.L. Thompson, Neural foundations of
imagery, Nat. Rev., Neurosci. 2 (2001) 635–642.
[42] B. Laeng, D.-S. Teodorescu, Eye scanpaths during visual imagery
reenact those of perception of the same visual scene, Cogn. Sci. 26
(2002) 207–231.
[43] J.L. Lancaster, M.G. Woldorff, L.M. Parsons, M. Liotti, C.S. Freitas,
L. Rainey, P.V. Kochunov, D. Nickerson, S.A. Mikiten, P.T. Fox,
Automated Talairach atlas labels for functional brain mapping,
Hum. Brain Mapp. 10 (2000) 120–131.
[44] E. Macaluso, M. Eimer, C.D. Frith, J. Driver, Preparatory states in
crossmodal spatial attention: spatial specificity and possible control
mechanisms, Exp. Brain Res. 149 (2003) 62–74.
[45] B. Macwhinney, J. Cohen, J. Provost, The PsyScope experiment-
building system, Spat. Vis. 11 (1997) 99–101.
[46] D.F. Marks, Visual imagery differences in the recall of pictures, Br. J.
Psychol. 64 (1973) 17–24.
[47] E. Mellet, S. Bricogne, N. Tzourio-Mazoyer, O. Ghaem, L. Petit,
L. Zago, O. Etard, A. Berthoz, B. Mazoyer, M. Denis, Neural corre-
lates of topographic mental exploration: the impact of route versus
survey perspective learning, NeuroImage 12 (2000) 588–600.
[48] E. Mellet, S. Bricogne, F. Crivello, B. Mazoyer, M. Denis, N.
Tzourio-Mazoyer, Neural basis of mental scanning of a topograph-
ic representation built from a text, Cereb. Cortex 12 (2002)
1322–1330.
[49] E.K. Miller, J.D. Cohen, An integrative theory of prefrontal cortex
function, Annu. Rev. Neurosci. 24 (2001) 167–202.
[50] K.M. O’Craven, N. Kanwisher, Mental imagery of faces and places
activates corresponding stimulus-specific brain regions, J. Cogn. Neu-
rosci. 12 (2000) 1013–1023.
[51] R.C. Oldfield, The assessment and analysis of handedness: the Edin-
burgh inventory, Neuropsychologia 9 (1971) 97–113.
[52] T. Paus, S. Marrett, K.J. Worsley, A.C. Evans, Extraretinal modula-
tion of cerebral blood flow in the human visual cortex: implications
for saccadic suppression, J. Neurophysiol. 74 (1995) 2179–2183.
[53] C.J. Price, K.J. Friston, Cognitive conjunction: a new approach to
brain activation experiments, NeuroImage 5 (1997) 261–270.

G. Ganis et al. / Cognitive Brain Research 20 (2004) 226–241 241
[54] S.J. Segal, V. Fusella, Influences of imagined pictures and sounds on
detection of visual and auditory signals, J. Exp. Psychol. 83 (1970)
458–464.
[55] K.M. Shafritz, J.C. Gore, R. Marois, The role of the parietal cortex in
visual feature binding, Proc. Natl. Acad. Sci. U. S. A. 99 (2002)
10917–10922.
[56] A.L. Shelton, J.D. Gabrieli, Neural correlates of encoding space from
route and survey perspectives, J. Neurosci. 22 (2002) 2711–2717.
[57] C.E. Stark, L.R. Squire, When zero is not zero: the problem of am-
biguous baseline conditions in fMRI, Proc. Natl. Acad. Sci. U. S. A.
98 (2001) 12760–12766.
[58] A.D. Wagner, D.L. Schacter, M. Rotte, W. Koutstaal, A. Maril, A.M.
Dale, B.R. Rosen, R.L. Buckner, Building memories: remembering
and forgetting of verbal experiences as predicted by brain activity,
Science 281 (1998) 1188–1191.
[59] J. Xiong, J.-H. Gao, J.L. Lancaster, P.T. Fox, Clustered analysis for
functional MRI activation studies of the human brain, Hum. Brain
Mapp. 3 (1995) 287–301.