boulder city, nevada
TRANSCRIPT
URBAN FOREST RESOURCE ANALYSIS OF INVENTORIED PUBLIC TREES
Boulder City, Nevada
June 2013

Boulder City, Nevada
Resource Analysis Of Inventoried Public trees
June 2013
Prepared for Nevada Division of Forestry
David Howlett Urban and Community Forestry Program Coordinator
Carson City, NV 89701
Prepared by Davey Resource Group
A Division of The Davey Tree Expert Company 7627 Morro Road
Atascadero, California 93422 Phone: 805-461-7500
Toll Free: 800-966-2021 Fax: 805-461-8501 www.davey.com/drg
Acknowledgements
While the specific reports and recommendations are attributed to this study, the basis for its structure and written content comes from the entire series of Municipal Forest Resource Analysis reports prepared and published by the USDA Forest Service, Pacific Southwest Research Station, Center for Urban Forest Research, and credit should be given to those authors. The Municipal Forest Resource Analysis Reports are companions to the regional Tree Guides and i-Tree’s STRATUM application developed by the USDA Forest Service, Pacific Southwest Research Station, Center for Urban Forest Research.

Boulder City, Nevada Resource Analysis i June 2013
Table of Contents Executive Summary ...................................................................................................................................... 1
Introduction.................................................................................................................................................... 2
Chapter 1: Urban Forest Resource Summary ............................................................................................. 4
Summary of Urban Forest Resource Structure ............................................................................... 4
Summary of Urban Forest Benefits .................................................................................................. 4
Urban Forest Resource Management .............................................................................................. 5
Chapter 2: Boulder City’s Urban Forest Resource ...................................................................................... 6
Population Composition ................................................................................................................... 6
Species Richness and Composition ................................................................................................ 7
Species Importance ....................................................................................................................... 10
Canopy Cover ................................................................................................................................ 11
Relative Age Distribution ................................................................................................................ 11
Urban Forest Condition and Relative Performance ....................................................................... 15
Replacement Value ........................................................................................................................ 17
Chapter 3: Urban Forest Resource Benefits .............................................................................................. 20
Energy Savings .............................................................................................................................. 20
Electricity and Natural Gas Reduction .............................................................................. 21
Atmospheric Carbon Dioxide Reduction ........................................................................................ 22
Sequestered Carbon Dioxide ............................................................................................ 24
Air Quality Improvement................................................................................................................. 26
Deposition and Interception .............................................................................................. 27
Avoided Pollutants ............................................................................................................ 27
BVOC Emissions ............................................................................................................... 27
Net Air Quality Improvement ............................................................................................. 27
Stormwater Runoff Reductions ...................................................................................................... 29
Aesthetic, Property Value and Socioeconomic Benefits ................................................................ 31
Conclusion................................................................................................................................................... 36
Appendix A: Methods and Procedures ...................................................................................................... 38
Appendix B: References ............................................................................................................................ 39
Boulder City, Nevada Resource Analysis ii June 2013
Figures Figure 1. Composition of Boulder City’s Public Tree Population .................................................................. 6 Figure 2. Frequency of Top 10 Species in Boulder City's Inventoried Tree Population ............................... 7 Figure 3. Overall Relative Age Distribution of Boulder City’s Public Tree Inventory .................................. 12 Figure 4. Relative Age Distribution of Boulder City’s Top 10 Inventoried Tree Species ............................ 14 Figure 5. Condition of Boulder City’s Inventoried Public Trees .................................................................. 15 Figure 6. Annual Electricity and Natural Gas Benefits - Top 5 Species ..................................................... 22 Figure 7. Annual Reduction of CO2 - Top 5 species ................................................................................... 24 Figure 8. Annual Improvement to Air Quality - Top 5 Species .................................................................... 27 Figure 9. Annual Reduction in Stormwater Runoff - Top 5 Species ........................................................... 29 Figure 10. Annual Increase in Property and Socioeconomic Values - Top 5 Species ............................... 32 Figure 11. Summary of Annual per Tree Benefits from .............................................................................. 33 Figure 12. Benefit Summary for Boulder City’s Tree Resource .................................................................. 35
Tables
Table 1. Population Distribution of Boulder City's Inventoried Public Trees ................................................. 8 Table 2. Importance Value (IV) of Boulder City's Most Abundant Tree Species ........................................ 10 Table 3. Relative Performance Index (RPI) for Boulder City’s Inventoried Public Trees............................ 16 Table 4. Replacement Value of Boulder City’s Most Common Public Tree Species.................................. 18 Table 5. Annual Electric and Natural Gas Benefits from Boulder City’s Tree Resource ............................ 22 Table 6. Annual CO2 Reduction Benefits Provided by Boulder City’s Inventoried Public Trees ................ 25 Table 7. Number of Days Exceeding Federal Ground Level Ozone Standard ........................................... 26 Table 8. Annual Air Quality Improvements Provided by Boulder City’s Inventoried Public Trees .............. 28 Table 9. Annual Stormwater Runoff Reduction Benefits ............................................................................ 30 Table 10. Annual Property Value, Aesthetic, and Socioeconomic Benefits ............................................... 32 Table 11. Summary of Current Annual Average per Tree Benefits ($/Tree) .............................................. 34 Table 12. Benefit Summary for Boulder City’s Inventoried Tree Resource ................................................ 35 Table 13. Boulder City Benefit Prices Used In This Analysis ..................................................................... 38

Boulder City, Nevada Resource Analysis 1 June 2013
Executive Summary Trees play a vital role in the community of Boulder City, Nevada. They provide numerous benefits both tangible and intangible, to residents, visitors, and neighboring communities. Recognized as a Tree City, USA by the National Arbor Day Foundation from 1990-2001 and every year since 2009, Boulder City has demonstrated that public trees are a valued community resource, an important component of the urban infrastructure, and a part of the City’s identity.
The Nevada Division of Forestry (NDF) has an interest in supporting urban forest management across the state. In 2012, NDF contracted with Davey Resource Group (DRG) to collect an inventory of public trees within an area designated as the Clark County Area of Interest (AOI). The AOI encompassed multiple entities, including the Clark County School District, the City of Las Vegas, North Las Vegas, Mesquite, Boulder City, unincorporated Clark County, and the University of Nevada, Las Vegas (UNLV). During the inventory, a certified arborist briefly inspected each tree and recorded information including species, size, condition, geographic location, and current maintenance needs. Arborists collected this information for nearly 100,000 individual tree sites across the AOI. For Boulder City, this included 1,383 individual sites. This inventoried population is estimated to be only approximately 35% of the public urban forest in Boulder City. Upon completion of the inventory for each entity, DRG developed a detailed and quantified analysis of the current structure, function, and value of this tree resource using the inventory data in conjunction with i-Tree benefit-cost modeling software.
The analysis determined that Boulder City’s inventoried tree population is a cost-effective resource that provides annual benefits of $108,669 ($79.03 per capita). These benefits include energy savings, air quality improvements, stormwater interception, atmospheric CO2 reduction, and aesthetic contributions to the social and economic health of the community.
Boulder City did not provide a maintenance budget for public trees. With that data, the following additional analysis can be provided:
A Benefit Investment Ratio (BIR -value of benefits vs. cost of maintenance)
The Overall Net Benefit of the tree population
An Average Net Benefit per Tree
Boulder City’s public urban forest is reducing annual electric energy consumption by 107 megawatt hours (MWh) and annual natural gas consumption by 720 therms, for a combined value of $4,476 annually. In addition, these trees are removing 0.27 ton of pollutants from the air, including ozone (O3), nitrogen dioxide (NO2), sulfur dioxide (SO2) and particulates (PM10) for an overall annual air quality benefit of $181,747. The tree canopy is reducing annual stormwater runoff volume by 673,573 gallons, protecting local water resources by reducing sediment and pollution loading.
Trees are a part of the community infrastructure. However, unlike other public assets, with proper maintenance, trees have the potential to increase in value over time. Boulder City’s public tree resource is a relatively young population in overall good condition. It is critical to maintain an adequate level of resources to protect and enhance this investment. With more than 41 different species, Boulder City is well positioned to realize a significant increase in environmental services as the tree population continues to mature. An ongoing commitment to maximizing and maintaining the health of the urban forest will ensure that the community continues to be a healthy, safe, and enjoyable place to live.

Boulder City, Nevada Resource Analysis 2 June 2013
Boulder City’s inventoried public tree resource is a relatively young population in overall good condition.
Introduction Boulder City, Nevada is located about 20 miles southeast of the Las Vegas metro area and just a few miles from the Hoover Dam. Encompassing an area of 202 square miles at an elevation of around 2,510 feet above sea level, Boulder City enjoys a mild but arid climate with an average rainfall around 11 inches per year. The population, currently 15,023, has grown about 20% since 1990. Incorporated in 1959, the community has been ranked as one of the best places to retire and features numerous recreational activities, including golf, hiking and outdoor life.
Individual trees and a healthy urban forest play important roles in the quality of life and the sustainability of every community. Research demonstrates that healthy urban trees can improve the local environment and lessen the impact of urbanization and industry (Center for Urban Forest Research, CUFR). Trees improve air quality by manufacturing oxygen and absorbing carbon dioxide (CO2), as well as filtering and absorbing airborne particulate matter such as smoke and dust. Urban trees reduce energy consumption by shading structures from solar energy and reducing the overall rise in temperature created through urban heat island effects (EPA). Trees slow and reduce stormwater runoff, helping to protect critical waterways from excess pollutants and particulates. In addition, urban trees provide critical habitat for wildlife and promote a connection to the natural world for residents.
In addition to these direct improvements, healthy urban trees increase the overall attractiveness of a community and have been proven to increase the value of local real estate by 7 to 10%, as well as promoting shopping, retail sales, and tourism (Wolf, 2007). Trees support a more livable community, fostering psychological health and providing residents with a greater sense of place (Ulrich, 1986; Kaplan, 1989). Community trees, both public and private, soften the urban hardscape by providing a green sanctuary and making Boulder City a more enjoyable place to live, work, and play. The City’s 1,375 inventoried public trees play a prominent role in the urban forest benefits afforded to the community. Boulder City residents rely on the City to protect and maintain this vital resource.
Acknowledged by the Arbor Day Foundation as a Tree City USA from 1990-2001 and every year since 2009, there is ample evidence that Boulder City values its trees. Boulder City participated in a Nevada Division of Forestry (NDF) sponsored project in 2012 to inventory public trees. By participating, Boulder City reflects the community’s appreciation, concern, and proactive stance on the management of public trees.
A team of International Society of Arboriculture (ISA) certified arborists from Davey Resource Group (DRG) mapped the location and collected data on publicly owned trees using global positioning system (GPS) technology. In addition to location, the arborists collected information about the species, size, condition, and current maintenance needs of each tree. An urban forest is a dynamic resource, constantly changing and growing in response to environment and care. It is critical for the city to update the inventory data, using asset management software, as maintenance needs are addressed and trees mature.

Boulder City, Nevada Resource Analysis 3 June 2013
The inventory data was analyzed with i-Tree’s Streets, a STRATUM Analysis Tool (Streets v5.0.1; i-Tree v5.0.6), to develop a resource analysis and report of the current condition of the urban forest. This report, unique to Boulder City, effectively quantifies the value of the community’s inventoried public trees in regards to actual benefits derived from the tree resource. In addition, the report provides baseline values that can be used to develop and update an urban forest management plan. Management plans help communities determine where to focus available resources and set benchmarks for measuring progress.
This urban forest resource analysis and report provides information on the structure, function, and value of a specific tree resource. With this information, managers and citizens can make informed decisions about tree management strategies. This report provides the following information:
A description of the current structure of Boulder City’s public tree resource and an established benchmark for future management decisions.
A quantified value of the environmental benefits provided by Boulder City’s public trees illustrating the relevance and relationship of the resource to local quality of life issues such as air quality, environmental health, economic development, and psychological health.
Data that may be used by resource managers in the pursuit of alternative funding sources and collaborative relationships with utility purveyors, non-governmental organizations, air quality districts, federal and state agencies, legislative initiatives, or local assessment fees.
Benchmark data that can be used in the development of a long-term urban forest management plan.
It is important to note that the inventory for Boulder City is incomplete. As the goal of the overall project was to gain an understanding of trends of the urban forest across the entire area of interest, funding for a complete inventory of trees in each entity was not available. This report should be used to help gain an understanding of the importance of the urban forest and the values it provides. It is estimated that the benefits shown in this report account for only 35% of the total tree population in Boulder City.

Boulder City, Nevada Resource Analysis 4 June 2013
Replacement of Boulder City’s 1,375 inventoried public trees
with trees of similar size, species, and condition would
cost more than $5 million.
Chapter 1: Urban Forest Resource Summary
Summary of Urban Forest Resource Structure Boulder City’s inventoried urban forest resource currently includes 1,375 publicly managed trees and 7 available planting sites. This represents only approximately 35% of the total tree population, so the benefits of Boulder City’s total tree population are likely far greater than those reported in this document.
A structural analysis is the first step towards understanding the benefits provided by these trees as well as their management needs. Considering species composition, diversity, age distribution, condition, canopy coverage, and replacement value, DRG determined that the following information characterizes Boulder City’s inventoried public tree resource:
Forty one (41) distinct tree species were identified in the inventory. The predominant tree species is Mondale pine (Pinus eldarica, 27.7%), Chinese elm (Ulmus parvifolia, 13.5%) and velvet ash (Fraxinus velutina, 11.9%).
The age structure of Boulder City’s inventoried public tree population is quite young, with 53.9% of trees measuring between 0 to 7 inches DBH (diameter at breast height, measured at 4 feet 6 inches above the ground) and 39.6% measuring between 7 and 19 inches DBH.
The majority of the inventoried trees (64.4%) are in good or excellent condition, with an additional 30.8% graded as fair.
To date, the inventoried public tree population has sequestered 466 tons of carbon (CO2), valued at approximately $6,998.
Replacement of Boulder City’s 1,375 inventoried public trees with trees of similar size, species, and condition would cost more than $5 million.
Summary of Urban Forest Benefits Annually, Boulder City’s public trees provide cumulative benefits to the community at an average value of $79.03 per tree, for a total gross value of $108,669 per year. These annual benefits include:
Trees reduce electricity and natural gas use in Boulder City through shading and climate effects for an overall benefit of $8,439, an average of $6.14 per tree.
Trees sequester 39.1 tons of atmospheric CO2 per year. An additional 53.6 tons is avoided by reducing energy generation, resulting in a net value of $1,328 and an average of $0.97 per tree.
Net air quality improvements provided by public trees through the removal and avoidance1 of air pollutants are valued at $4,476, an average per tree benefit of $3.26.
1 Avoided pollution is a result of reducing energy consumption. The avoided value represents pollution that would have resulted from the generation of additional energy.

Boulder City, Nevada Resource Analysis 5 June 2013
Boulder City’s inventoried public trees intercept an estimated 673,573 gallons of stormwater annually for a total value of $3,233 per year, an average of $2.35 per tree.
The benefit contributed by Boulder City’s public trees to property value increases, aesthetics, and socioeconomics equals $91,192, an average of $66.32 per tree.
Urban Forest Resource Management Boulder City’s public tree population is a dynamic resource that is worth continued investment to maintain and extend its full benefit potential. Community trees are one of the few assets that have the potential to increase in value with time and proper management. Appropriate and timely tree care can substantially increase lifespan. When trees live longer, they provide greater benefits. As individual trees continue to mature, and aging trees are replaced, the overall value of the community forest and the amount of benefits provided grow as well. This vital, living resource is, however, vulnerable to a host of stressors and requires ecologically sound and sustainable best management practices to ensure a continued flow of benefits for future generations.
Boulder City has the benefit of a relatively young urban forest in good condition. The City should focus resources on maximizing the flow of benefits from the current tree population and maintaining a forward-thinking approach. Based on the resource analysis, DRG recommends the following:
Continue annual tree planting efforts to stock the available planting sites identified by the inventory.
Maintain an appropriate age distribution by planting new trees to improve long-term resource sustainability and greater canopy coverage. Focus on suitable large-stature trees where conditions are sustainable to maximize benefits.
Maximize the benefits of the existing tree resource through comprehensive tree maintenance and a cyclical pruning schedule.
Implement a structural pruning program for young and establishing trees to promote healthy structure, extend life expectancy, and reduce future costs and liability.
Inventory the remaining tree population and maintain and update the inventory database.
Avoid planting over-represented species and increase species diversity by planting under-used and new (desert adapted) species to promote sustainability.
Use the entire tree inventory and City budget data to perform a complete i-tree Streets Resource Analysis to better determine the current condition, structure, function and needs of the entire public urban forest.
The value of Boulder City’s public tree resource will continue to increase as existing trees mature and new trees are planted. As the resource grows, investment in management is critical to ensuring that residents will continue receiving a high return on investment in the future. It is not as simple as planting more trees to increase canopy cover and benefits. Planning and funding for tree care and tree management must complement planting efforts in order to ensure the long-term success and health of Boulder City’s urban forest. Existing mature trees should be maintained and protected whenever possible since the greatest benefits accrue from the continued growth and longevity of the existing canopy. Boulder City can take pride in knowing that street trees improve the quality of life in the City.

Boulder City, Nevada Resource Analysis 6 June 2013
Chapter 2: Boulder City’s Urban Forest Resource A city’s urban forest resource is more thoroughly understood through examination of its composition and species richness (diversity). Inferences based on this data can help managers understand the importance of individual tree species to the overall forest as it exists today. Consideration of stocking level (trees per available space), canopy cover, age distribution, condition and performance helps to project the potential of the forest resource.
Population Composition Boulder City’s inventoried tree population is almost split evenly between broadleaf and conifer species. Broadleaf hardwood species are the majority of Boulder City’s tree population, comprising 54% of the total inventory. Broadleaf trees typically have larger canopies than coniferous trees of the same size. Since many of the measurable benefits derived from trees are directly related to leaf surface area, broadleaf trees generally provide the highest level of benefits to a community. Larger-statured broadleaf tree species provide greater benefits than smaller-statured trees, independent of diameter (DBH). Deciduous broadleaf species make up approximately 61% of Boulder City’s public tree population, including 8% large-stature, 42% medium-stature, and 12% small-stature trees. Small-stature evergreen broadleaf trees comprise 2% of the population. Large-stature conifers represent 35% of the overall population, while small conifers represent 1% (Figure 1).
Figure 1. Composition of Boulder City’s Public Tree Population
Broadleaf Deciduous
Large 8%
Broadleaf Deciduous Medium
42%
Broadleaf Deciduous
Small 12%
Broadleaf Evergreen Small
2%
Conifer Evergreen Large
35%
Conifer Evergreen Small
1%

Boulder City, Nevada Resource Analysis 7 June 2013
Species Richness and Composition Boulder City’s inventoried public tree population (Table 1) includes a mix of 41 unique species. This is slightly less than that of the mean of 53 species reported by McPherson and Rowntree (1989) in their nationwide survey of street tree populations in 22 U.S. cities.In Boulder City, he top ten species represent 84.4% of the total population (Figure 2 and Table 1). The predominant tree species are Mondale pine (Pinus eldarica, 27.7%), Chinese elm (Ulmus parvifolia, 13.5%) and velvet ash (Fraxinus velutina, 11.9%).
There is a widely accepted rule that no single species should represent greater than 10% of the total population, and no single genus more than 20% (Clark Et al, 1997). The genera Pinus (31.4%) and Fraxinus (22.4%) are each over-represented and Mondale Pine (Pinus eldarica, 27.7%), Chinese Elm (Ulmus parvifolia 13.5%), and Velvet Ash (Fraxinus velutina, 11.9%) exceed the 10% species rule. Table 1 includes a complete summary of all populations.
Figure 2. Frequency of Top 10 Species in Boulder City's Inventoried Tree Population
0% 5% 10% 15% 20% 25% 30%
Afghan pine
Chinese elm
Velvet ash
Evergreen ash
Chinese pistache
White mulberry
Raywood ash
Italian cypress
Aleppo pine
Chitalpa
OTHER SPECIES
27.7%
13.5%
11.9%
6.2%
5.8%
4.7%
4.4%
3.8%
3.3%
3.1%
15.6%
Mondale pine

Boulder City, Nevada Resource Analysis 8 June 2013
It is important to maintain a diverse population within an urban forest. Dominance of any single species or genus can have detrimental consequences in the event of storms, drought, disease, pests, or other stressors that can severely affect an urban forest and the flow of benefits and costs over time. Catastrophic pathogens, such as Dutch Elm Disease (Ophiostoma ulmi), Emerald Ash Borer (Agrilus planipennis), Asian Longhorned Beetle (Anoplophora glabripennis), and Sudden Oak Death (SOD) (Phytophthora ramorum) are some examples of unexpected, devastating, and costly pests and pathogens that highlight the importance of diversity and the balanced distribution of species and genera.
Table 1. Population Distribution of Boulder City's Inventoried Public Trees
Species
DBH Class (in) % of
Pop. 0-4 4-7 7-13 13-19
19-25
25-31
31-37
37-42 >42 Total
Broadleaf Deciduous Large (BDL) Evergreen ash 6 12 32 24 7 4 0 0 0 85 6.2 Honeylocust 0 3 5 0 0 0 0 0 0 8 0.6 Siberian elm 0 0 2 1 0 1 0 0 0 4 0.3 Fremont cottonwood 0 0 1 1 1 0 0 0 0 3 0.2 Black Locust 0 2 0 0 0 0 0 0 0 2 0.1 Arizona sycamore 0 0 0 1 0 0 0 0 0 1 0.1 Total 6 17 40 27 8 5 0 0 0 103 7.5
Broadleaf Deciduous Medium (BDM) Chinese elm 50 109 23 4 0 0 0 0 0 186 13.5 Velvet ash 57 45 23 14 17 7 0 0 0 163 11.9 Chinese pistache 24 46 9 1 0 0 0 0 0 80 5.8 White mulberry 0 1 12 23 11 10 6 1 1 65 4.7 Raywood ash 20 31 6 3 0 0 0 0 0 60 4.4 Blue paloverde 10 0 0 0 0 0 0 0 0 10 0.7 Algarrobo 1 4 1 0 0 0 0 0 0 6 0.4 Mimosa 0 1 0 1 0 0 0 0 0 2 0.1 Jerusalem thorn 1 0 1 0 0 0 0 0 0 2 0.1 Total 163 237 75 46 28 17 6 1 1 574 41.7
Broadleaf Deciduous Small (BDS) Chitalpa 22 20 1 0 0 0 0 0 0 43 3.1 Velvet mesquite 1 7 19 9 1 0 0 0 0 37 2.7 Chaste tree 17 0 0 0 0 0 0 0 0 17 1.2 Western honey mesquite 3 9 3 1 0 0 0 0 0 16 1.2 Desert willow 13 2 0 0 0 0 0 0 0 15 1.1 Common crapemyrtle 12 0 0 0 0 0 0 0 0 12 0.9 Honey mesquite 11 0 0 0 0 0 0 0 0 11 0.8 Sweet acacia 0 2 0 0 0 0 0 0 0 2 0.1 Cherry plum 1 1 0 0 0 0 0 0 0 2 0.1 Pomegranate 2 0 0 0 0 0 0 0 0 2 0.1

Boulder City, Nevada Resource Analysis 9 June 2013
Species
DBH Class (in) % of
Pop. 0-4 4-7 7-13 13-19
19-25
25-31
31-37
37-42 >42 Total
Sweet almond 0 0 1 0 0 0 0 0 0 1 0.1 Total 82 41 24 10 1 0 0 0 0 158 11.5 Broadleaf Evergreen Medium (BEM) Live oak 0 0 1 2 0 0 0 0 0 3 0.2 Total 0 0 1 2 0 0 0 0 0 3 0.2
Broadleaf Evergreen Small (BES) Olive 0 4 12 1 0 0 0 0 0 17 1.2 Oriental arborvitae 0 1 2 3 0 0 0 0 0 6 0.4 Mediterranean fan palm 0 3 1 0 0 0 0 0 0 4 0.3 Evergreen pear 0 3 1 0 0 0 0 0 0 4 0.3 Chinese privet 2 0 0 0 0 0 0 0 0 2 0.1 Shoestring acacia 0 1 0 0 0 0 0 0 0 1 0.1 Total 2 12 16 4 0 0 0 0 0 34 2.5
Conifer Evergreen Large (CEL) Mondale pine 10 160 171 34 6 0 0 0 0 381 27.7 Italian cypress 0 0 52 0 0 0 0 0 0 52 3.8 Aleppo pine 0 1 12 17 13 2 0 0 0 45 3.3 Chir pine 0 0 0 6 0 0 0 0 0 6 0.4 Total 10 161 235 57 19 2 0 0 0 484 35.2
Conifer Evergreen Small (CES) Yew Pine 8 2 0 0 0 0 0 0 0 10 0.7 Juniper 0 0 0 4 0 0 0 0 0 4 0.3 Total 8 2 0 4 0 0 0 0 0 14 1.0
Palm Evergreen Small (PES) Mexican fan palm 0 0 3 0 0 0 0 0 0 3 0.2 California palm 0 0 0 0 0 2 0 0 0 2 0.1 Total 0 0 3 0 0 2 0 0 0 5 0.4
Citywide Total 271 470 394 150 56 26 6 1 1 1,375 100%

Boulder City, Nevada Resource Analysis 10 June 2013
Species Importance To quantify the significance of any one particular species found in Boulder City’s inventoried public tree population, an importance value (IV) is derived for each of the most common species in the inventory. Importance values are particularly meaningful to urban forest managers because they indicate a community’s reliance on the functional capacity of particular species. i-Tree Streets calculates importance value based on the mean of three values: percentage of total population, percentage of total leaf area, and percentage of total canopy cover. Importance value goes beyond tree numbers alone to suggest reliance on specific species based on the benefits they provide. The importance value can range from zero (which implies no reliance) to 100 (suggesting total reliance).
No single species should dominate the composition in the City’s urban forest population. Since importance value goes beyond population numbers alone, it can help managers to better comprehend the resulting loss of benefits from a catastrophic loss of any one species. When importance values are comparatively equal among the 10 to 15 most abundant species, the risk of major reductions to benefits is significantly reduced. Of course, suitability of the dominant species is another important consideration. Planting short-lived or poorly adapted species can result in short rotations and increased long-term management costs.
The 15 most abundant species each represent greater than 1% of the total population. Together, these 15 species represent 91.8% of the total population, 93.5% of the total leaf area, and 94.2% of the total canopy cover for a combined importance value of 93.1 (Table 2). Of these species, Boulder City relies most on the Mondale pine (Pinus eldarica, IV=21.2), followed by Chinese elm (Ulmus parvifolia, IV=13.5) and velvet ash (Fraxinus velutina, IV=12.4).
Boulder City’s white mulberry (Morus alba) account for 4.7% of the population, yet have an importance value of 10.7 and are providing the greatest per-tree functional capacity. Aleppo pine (Pinus halepensis) is also providing a relatively high per-tree functional capacity, representing 3.3% of the population with an importance value of 6.2. These populations are established large-stature trees.
Table 2. Importance Value (IV) of Boulder City's Most Abundant Tree Species
Species
Number of Trees
% of Total Trees
Leaf Area (ft2)
% of Total
Leaf Area
Canopy Cover (ft2)
% of Total Canopy Cover
Importance Value
Mondale pine 381 27.7 304,990 17.7 102,004 18.3 21.2 Chinese elm 186 13.5 184,554 10.7 91,300 16.4 13.5 Velvet ash 163 11.9 230,828 13.4 67,495 12.1 12.4 Evergreen ash 85 6.2 253,603 14.7 54,848 9.8 10.2 Chinese pistache 80 5.8 39,841 2.3 17,638 3.2 3.8 White mulberry 65 4.7 235,731 13.6 76,208 13.7 10.7 Raywood ash 60 4.4 39,855 2.3 17,967 3.2 3.3 Italian cypress 52 3.8 67,784 3.9 16,255 2.9 3.5 Aleppo pine 45 3.3 154,997 9.0 35,741 6.4 6.2 Chitalpa 43 3.1 10,243 0.6 6,004 1.1 1.6 Velvet mesquite 37 2.7 66,739 3.9 27,265 4.9 3.8 Olive 17 1.2 9,700 0.6 4,214 0.8 0.9 Chaste tree 17 1.2 1,754 0.1 1,216 0.2 0.5 Western honey mesquite 16 1.2 13,414 0.8 6,050 1.1 1.0 Desert willow 15 1.1 1,736 0.1 808 0.1 0.4 Other species 113 8.2 111,842 6.5 32,574 5.8 6.8 Total 1,375 100% 1,727,610 100% 557,588 100% 100%

Boulder City, Nevada Resource Analysis 11 June 2013
An unevenly aged tree population assures continuity in overall tree canopy coverage and associated benefits.
Canopy Cover The amount and distribution of leaf surface area is the driving force behind the urban forest’s ability to produce benefits for the community (Clark, 1997). As canopy cover increases, so do the benefits afforded by leaf area. Overall, the inventoried trees provide 12.8 acres of tree canopy cover. Mondale pine (Pinus eldarica) and Chinese elm (Ulmus parvifolia) provide the largest proportion of canopy, accounting for 18% and 16% respectively.
Relative Age Distribution Age distribution can be approximated by considering the DBH) range of the overall population and of individual species. Trees with smaller diameters tend to be younger. It is important to note that palms do not increase in DBH over time, so they are not considered in this analysis. In palms, height more accurately correlates to age
The distribution of individual tree ages within a tree population influences present and future costs as well as the flow of benefits. An ideal-aged population allows managers to allocate annual
maintenance costs uniformly over many years and assures continuity in overall tree canopy coverage and associated benefits. A desirable distribution has a high proportion of young trees to offset establishment and age related mortality as the percentage of older trees declines over time (Richards, 1982/83). This ideal, albeit uneven, distribution suggests a large fraction of trees (+/-40% of the total) should be young with diameters at breast height (DBH) less than eight inches, while only 10% should be in the large diameter classes (>24 inches).
Boulder City’s inventoried public tree population is positively weighted in young trees (Figure 3), with 53.9% of the population consisting of trees with a DBH) of seven inches or smaller and 43.6% established trees (8-25 inches DBH). Trees greater than 25 inches DBH make up only 2.5% of the overall population (Table 1 and Figure 3). This may be, at least in part, a result of the arid environment rather than the overall age of the street tree population. Trees in the older age classes provide greater benefits due to their high leaf surface area. Emphasis should be placed on preserving older trees.
.

Boulder City, Nevada Resource Analysis 12 June 2013
Figure 3. Overall Relative Age Distribution of Boulder City’s Public Tree Inventory
Of Boulder City’s top ten public tree species (Figure 4), chitalpa (X Chitalpa tashkentensis, 97.7%), Chinese elm (Ulmus parvifolia, 85.5%), Chinese pistache (Pistacia chinensis, 87.5%), and Raywood ash (Fraxinus angustifolia ‘Raywood’, 85%) have significant representation in the small size class (< 7 inches DBH), indicating that recent plantings have focused on these species.
Considering large and medium-statured trees, only white mulberry (Morus alba, 27.7%), evergreen ash (Fraxinus uhdei, 4.7%), Aleppo pine (Pinus halepensis, 4.4%), and velvet ash (Fraxinus velutina, 4.3%) have measurable representation in the large class range (> 25" DBH).
Aleppo pine (Pinus halepensis, 93.3%), evergreen ash (Fraxinus uhdei, 74.1%), and white mulberry (Morus alba, 70.8%) are well-established populations with the greatest representation between 7 and 25 inches in diameter. Italian cypress (Cupressus sempervirens, 95%) and Mondale pine (Pinus eldarica, 55.4%) are weighted heavily in 7-13 inch size class and will grow to bolster the numbers in the medium size classes.
Of Boulder City’s top ten species, Mondale pine (Pinus eldarica) demonstrates an age distribution indicative of a long-standing key species, with 42% less than 7 inches in diameter and 55.4% between 7 and 25 inches. Considering this age distribution and that 79.5% of Mondale pines were rated as good during the inventory, this appears to be a species that is performing well for Boulder City. However, as this species is more than adequately represented in the population, future plantings should avoid Mondale pine. Although evergreen ash also approximates this young age distribution, their condition ratings trend toward fair, and may not be the best suited species for extensive planting in Boulder City.
0
10
20
30
40
50
60
70 Citywide total
Ideal
%
DBH Class (in)
Boulder City, Nevada Resource Analysis 13 June 2013
As young populations mature and eventually grow old, their maintenance needs are likely to increase. Future plantings should adequately represent long-standing and high-performing species. Sufficient replacements should be planted to ensure the functional capacity and benefit streams from these populations, even as individuals begin to decline.
With a relatively young urban forest and continued proactive management, Boulder City can expect greater benefits as this vital resource matures. New installations should carefully consider species selection, increasing the use of underused and well-performing species. For example, Mondale pine is overrepresented in the population and should be avoided in future plantings. Rather than replant Mondale pines, they could be replaced with species not currently seen in Boulder City’s landscape to boost species diversity.
In addition to planting, it is critical that long-term resources be dedicated to ensuring proper maintenance as trees mature. A long-term, sustainable management plan, including regular inspection and reasonable pruning cycles, can ensure Boulder City’s urban forest remains healthy and well-structured, thereby maximizing environmental services to the community, reducing risk, and promoting a consistent flow of benefits for many generations to come.

Boulder City, Nevada Resource Analysis 14 June 2013
Figure 4. Relative Age Distribution of Boulder City’s Top 10 Inventoried Tree Species
0
10
20
30
40
50
60
70 Mondale pine
Chinese elm
Fan-Tex ash
Evergreen ash
Chinese pistache
Ideal %
DBH Class (in)
0
10
20
30
40
50
60
70
80
90
100 White mulberry
Raywood ash
Italian cypress
Aleppo pine
Chitalpa
Ideal %
DBH Class (in)

Boulder City, Nevada Resource Analysis 15 June 2013
Good 64%
Fair 31%
Poor 4%
Dead or Dying
1%
Urban Forest Condition and Relative Performance Tree condition is an indication of how well trees are managed and how well they are performing in a given site-specific environment (e.g., street median, parking lot, etc.). Each inventoried tree was rated for overall condition, including consideration for structure, foliage, and the root collar. When trees are performing at their peak, the benefits they provide are maximized.
The inventory found 64% of Boulder City’s inventoried trees in good condition and 30.8% in fair condition, and 4.7% of the population was found to be in poor, dying, or dead condition. Removal or mitigation of dead and failing trees is recommended as soon as possible to reduce liability exposure.
The relative performance index (RPI) is one way to further analyze the condition and suitability of specific tree species. The RPI provides an urban forest manager with a detailed perspective on how one species’ performance compares to that of another. The index compares the condition ratings of each tree species with the condition ratings of every other tree species within a given urban forest population. An RPI value of 1.0 or better indicates that the species is performing as well or better than average when compared to other species. An RPI value below 1.0 indicates that the species is not performing as well in comparison to the rest of the population.
Among the 15 most common species in the inventory, nine have an RPI of 1.0 or greater (Table 3). Of these, Italian cypress (Cupressus sempervirens) and desert willow (Chilopsis linearis) have the highest RPI of 1.14, followed by Chinese pistache (Pistacia chinensis, RPI=1.13. Olive (Olea europaea) has the lowest rating of 0.82. Mondale pine (Pinus eldarica, RPI=1.06) is a population with a close to ideal age distribution, an indicator that the RPI value is an honest measure of performance.
The RPI can be a useful tool for urban forestry managers. For example, if a city has been planting two or more new species in their urban forest, the RPI can be used to compare their relative performance. If the RPI indicates that one is performing relatively poorly, a municipality may decide to reduce or even stop planting that species and subsequently save money on both planting stock and replacement costs. The RPI enables managers to look at the performance of long-standing species as well. Species planted for many years that have an RPI of 1.00 or greater have performed well when compared to the population as a whole. These top performers should be retained as a significant portion of the urban forest population. It is important to keep in mind that, because RPI is based on condition, it may not reflect cosmetic or nuisance issues, especially seasonal issues that are not threatening the health or structure of the trees.
An RPI value less than 1.00 may be indicative of a species that is not well adapted to local conditions. Poorly adapted species are more likely to present increased safety and maintenance issues. Species with an RPI less than 1.00 should receive careful consideration before being selected for future planting choices. Prior to selecting or deselecting trees on the basis of RPI alone, managers are encouraged to take into account the age distribution of the species, among other factors. A species that has a RPI of less than 1.00, but has a significant number of trees in larger DBH classes, may just be exhibiting signs of population senescence. The individuals of this species may have produced substantial benefits over the years and should continue to be considered when making species selection determinations for future planting.
Figure 5. Condition of Boulder City’s Inventoried Public Trees

Boulder City, Nevada Resource Analysis 16 June 2013
Table 3. Relative Performance Index (RPI) for Boulder City’s Inventoried Public Trees
Species
Dead or
Dying Poor Fair Good RPI # of
Trees % of Pop.
Mondale pine 1.0 1.3 18.1 79.5 1.06 381 27.7 Chinese elm 0.0 5.9 39.8 54.3 0.96 186 13.5 Velvet ash 2.5 10.4 53.4 33.7 0.86 163 11.9 Evergreen ash 0.0 3.5 60.0 36.5 0.91 85 6.2 Chinese pistache 0.0 0.0 2.5 97.5 1.13 80 5.8 White mulberry 0.0 4.6 63.1 32.3 0.90 65 4.7 Raywood ash 0.0 1.7 35.0 63.3 1.01 60 4.4 Italian cypress 0.0 0.0 0.0 100.0 1.14 52 3.8 Aleppo pine 0.0 2.2 35.6 62.2 1.00 45 3.3 Chitalpa 0.0 4.7 25.6 69.8 1.02 43 3.1 Velvet mesquite 0.0 2.7 40.5 56.8 0.98 37 2.7 Olive 0.0 11.8 70.6 17.6 0.82 17 1.2 Chaste tree 0.0 5.9 5.9 88.2 1.08 17 1.2 Western honey mesquite 0.0 6.3 6.3 87.5 1.07 16 1.2 Desert willow 0.0 0.0 0.0 100.0 1.14 15 1.1 Common crapemyrtle 0.0 0.0 0.0 100.0 1.14 12 0.9 Honey mesquite 0.0 0.0 9.1 90.9 1.11 11 0.8 Yew Pine 0.0 0.0 0.0 100.0 1.14 10 0.7 Blue paloverde 10.0 0.0 30.0 60.0 0.94 10 0.7 Honeylocust 0.0 37.5 12.5 50.0 0.84 8 0.6 Oriental arborvitae 0.0 33.3 33.3 33.3 0.80 6 0.4 Algarrobo 0.0 0.0 33.3 66.7 1.03 6 0.4 Chir pine 0.0 0.0 16.7 83.3 1.08 6 0.4 Siberian elm 0.0 0.0 50.0 50.0 0.97 4 0.3 Juniper 0.0 0.0 0.0 100.0 1.14 4 0.3 Evergreen pear 0.0 25.0 0.0 75.0 0.97 4 0.3 Mediterranean fan palm 0.0 0.0 0.0 100.0 1.14 4 0.3 Live oak 0.0 0.0 0.0 100.0 1.14 3 0.2 Fremont cottonwood 0.0 0.0 66.7 33.3 0.91 3 0.2 Mexican fan palm 0.0 0.0 0.0 100.0 1.14 3 0.2 Jerusalem thorn 0.0 0.0 50.0 50.0 0.97 2 0.1 Mimosa 0.0 0.0 100.0 0.0 0.80 2 0.1 Cherry plum 0.0 0.0 50.0 50.0 0.97 2 0.1 Black Locust 0.0 0.0 50.0 50.0 0.97 2 0.1 Chinese privet 0.0 100.0 0.0 0.0 0.47 2 0.1 Pomegranate 0.0 0.0 0.0 100.0 1.14 2 0.1 California palm 0.0 0.0 0.0 100.0 1.14 2 0.1 Sweet acacia 0.0 0.0 100.0 0.0 0.80 2 0.1 Arizona sycamore 0.0 0.0 100.0 0.0 0.80 1 0.1 Shoestring acacia 0.0 0.0 0.0 100.0 1.14 1 0.1 Sweet almond 0.0 0.0 100.0 0.0 0.80 1 0.1 All trees 0.7 4.1 30.8 64.4 1.00 1375 100%

Boulder City, Nevada Resource Analysis 17 June 2013
Replacement of the Mondale pine population in Boulder City’s
inventoried trees would cost almost $1.3 million.
The RPI value can help identify underused species that are demonstrating good performance. Trees with an RPI value greater than 1.00 and an established age distribution may be indicating their suitability in the local environment and should receive consideration for additional planting. However, due to the size of the tree population sampled, the age class distribution for Boulder City’s trees is not varied enough to allow for species performance decisions to be based solely on RPI values. Apart from existing species in Boulder City, future tree plantings can enhance species diversity by adding new species with desert proven hardiness, including:
Acacia species (not currently planted; e.g., A. stenophylla, A. willardiana)
Australian pine (Casuarina equisetifolia)
Bottlebrush tree (Callistemon spp.)
Kurrajong (Brachychiton populneus)
Texas ebony (Ebenopsis ebano)
Thornless cascalote (Caesalpinia cacalaco)
Tipuana (Tipuana tipu)
Replacement Value The current value of Boulder City’s public tree resource is approximately $5.1 million. The community forest is a public asset which, when properly cared for, has the potential to appreciate in value as the trees mature over time. Replacement value accounts for the historical investment in trees over their lifetime, Replacement value is also a way of describing the value of a tree population (and/or average value per tree) at a given time. The replacement value reflects current population numbers, stature, placement, and condition. There are several methods available for obtaining a fair and reasonable perception of a tree’s value (CTLA, 1992; Watson, 2002). The cost approach, trunk formula method used in this analysis assumes the value of a tree is equal to the cost of replacing the tree in its current state (Cullen, 2002).
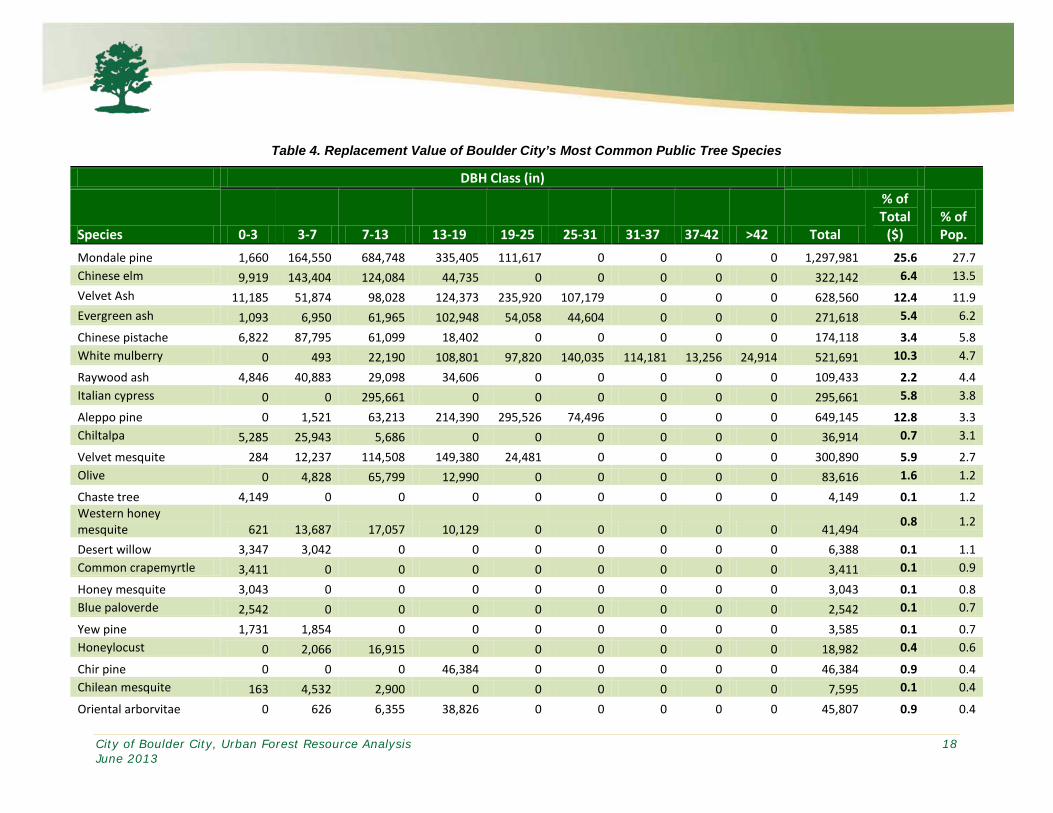
To replace Boulder City’s current inventoried public tree population of 1,375 trees with trees of similar size, species, and condition would cost more than $5 million (Table 4 and Appendix C). The average replacement value per tree is $3,659.
Mondale pine (Pinus eldarica) account for 25.6% of the total estimated replacement value, followed by Aleppo pine (Pinus halepensis, 12.8%), and velvet ash (Fraxinus velutina, 12.4%). The high value of each of these species reinforces their importance to the City. Many of the highest valued species are large and medium-stature trees with large canopies and are therefore likely to have high importance values as well.
Boulder City’s inventoried public trees represent a vital component of the City’s infrastructure and a public asset valued at approximately $5.1 million—an asset that, with proper care and maintenance, will increase in value over time. Distinguishing replacement value from the value of annual benefits produced by Boulder City’s public trees is very important. Annual benefits are discussed in Chapter 3.
City of Boulder City, Urban Forest Resource Analysis 18 June 2013
Table 4. Replacement Value of Boulder City’s Most Common Public Tree Species
DBH Class (in)
% of Pop. Species 0-3 3-7 7-13 13-19 19-25 25-31 31-37 37-42 >42 Total
% of Total
($) Mondale pine 1,660 164,550 684,748 335,405 111,617 0 0 0 0 1,297,981 25.6 27.7 Chinese elm 9,919 143,404 124,084 44,735 0 0 0 0 0 322,142 6.4 13.5 Velvet Ash 11,185 51,874 98,028 124,373 235,920 107,179 0 0 0 628,560 12.4 11.9 Evergreen ash 1,093 6,950 61,965 102,948 54,058 44,604 0 0 0 271,618 5.4 6.2
Chinese pistache 6,822 87,795 61,099 18,402 0 0 0 0 0 174,118 3.4 5.8 White mulberry 0 493 22,190 108,801 97,820 140,035 114,181 13,256 24,914 521,691 10.3 4.7
Raywood ash 4,846 40,883 29,098 34,606 0 0 0 0 0 109,433 2.2 4.4 Italian cypress 0 0 295,661 0 0 0 0 0 0 295,661 5.8 3.8
Aleppo pine 0 1,521 63,213 214,390 295,526 74,496 0 0 0 649,145 12.8 3.3 Chiltalpa 5,285 25,943 5,686 0 0 0 0 0 0 36,914 0.7 3.1
Velvet mesquite 284 12,237 114,508 149,380 24,481 0 0 0 0 300,890 5.9 2.7 Olive 0 4,828 65,799 12,990 0 0 0 0 0 83,616 1.6 1.2
Chaste tree 4,149 0 0 0 0 0 0 0 0 4,149 0.1 1.2 Western honey mesquite 621 13,687 17,057 10,129 0 0 0 0 0 41,494 0.8 1.2
Desert willow 3,347 3,042 0 0 0 0 0 0 0 6,388 0.1 1.1 Common crapemyrtle 3,411 0 0 0 0 0 0 0 0 3,411 0.1 0.9
Honey mesquite 3,043 0 0 0 0 0 0 0 0 3,043 0.1 0.8 Blue paloverde 2,542 0 0 0 0 0 0 0 0 2,542 0.1 0.7
Yew pine 1,731 1,854 0 0 0 0 0 0 0 3,585 0.1 0.7 Honeylocust 0 2,066 16,915 0 0 0 0 0 0 18,982 0.4 0.6
Chir pine 0 0 0 46,384 0 0 0 0 0 46,384 0.9 0.4 Chilean mesquite 163 4,532 2,900 0 0 0 0 0 0 7,595 0.1 0.4
Oriental arborvitae 0 626 6,355 38,826 0 0 0 0 0 45,807 0.9 0.4

City of Boulder City, Urban Forest Resource Analysis 19 June 2013
DBH Class (in)
% of Pop. Species 0-3 3-7 7-13 13-19 19-25 25-31 31-37 37-42 >42 Total
% of Total
($) Mediterranean fan palm 0 691 262 0 0 0 0 0 0 954 0.0 0.3
Juniper species 0 0 0 57,396 0 0 0 0 0 57,396 1.1 0.3 Evergreen pear 0 2,733 4,108 0 0 0 0 0 0 6,841 0.1 0.3
Siberian elm 0 0 9,699 14,349 0 30,826 0 0 0 54,874 1.1 0.3 Fremont cottonwood 0 0 1,489 2,525 4,680 0 0 0 0 8,694 0.2 0.2
Live oak 0 0 5,686 28,698 0 0 0 0 0 34,384 0.7 0.2 Mexican fan palm 0 0 796 0 0 0 0 0 0 796 0.0 0.2
Sweet acacia 0 2,694 0 0 0 0 0 0 0 2,694 0.1 0.1 Mimosa 0 800 0 7,268 0 0 0 0 0 8,068 0.2 0.1
Chinese privet 212 0 0 0 0 0 0 0 0 212 0.0 0.1 Jerusalem thorn 192 0 1,675 0 0 0 0 0 0 1,866 0.0 0.1
Cherry plum 163 1,133 0 0 0 0 0 0 0 1,296 0.0 0.1 Pomegranate 515 0 0 0 0 0 0 0 0 515 0.0 0.1
Black locust 0 2,594 0 0 0 0 0 0 0 2,594 0.1 0.1 California palm 0 0 0 0 0 1,784 0 0 0 1,784 0.0 0.1
Shoestring acacia 0 1,521 0 0 0 0 0 0 0 1,521 0.0 0.1 Arizona sycamore 0 0 0 5,738 0 0 0 0 0 5,738 0.1 0.1
Sweet almond 0 0 5,127 0 0 0 0 0 0 5,127 0.1 0.1 Citywide total 61,183 578,454 1,698,147 1,357,342 824,102 398,924 114,181 13,256 24,914 $5,070,504 100% 100%

Boulder City, Urban Forest Resource Analysis 20 June 2013
Trees and other vegetation within an urban environment help reduce the urban heat island effect.
Chapter 3: Urban Forest Resource Benefits Trees are important to Boulder City. Environmentally, they help conserve and reduce energy use, reduce local and global carbon dioxide (CO2) levels, improve air quality, and mitigate stormwater runoff. Additionally, trees provide a wealth of well-documented psychological, social, and economic benefits related primarily to their aesthetic effects. Considering these environmental benefits, trees make good sense, working ceaselessly to provide benefits back to the community. However, the question remains, are the collective benefits worth the costs of management? In other words, are trees a good investment for Boulder City? To answer this question, the benefits must be quantified in financial terms.
The i-Tree Streets analysis model allows benefits to be quantified based on regional reference cities and local community attributes, such as median home values and local energy prices. This analysis provides a snapshot of the annual benefits (along with the value of those benefits) produced by Boulder City’s inventoried urban forest. While the annual benefits produced by the urban forest can be substantial, it is important to recognize that the greatest benefits from the urban forest are derived from the benefit stream that results over time, from a mature forest where trees are well managed, healthy, and long-lived.
This analysis used Boulder City’s current public tree inventory, an estimated 35% of the urban forest, and i-Tree’s Streets model to assess and quantify the beneficial functions of this public tree resource and to place a dollar value on the annual environmental benefits these trees provide. These estimates provide first-order approximations of tree value. While i-Tree Streets only generally accounts for the benefits produced by Boulder City’s public tree population, it is an accounting based on the best available and current scientific research with an accepted degree of uncertainty. The data returned from i-Tree Streets can provide a platform from which management decisions can be made (Maco and McPherson, 2003). A discussion on the methods used to quantify and put a monetary value on these benefits can be found in Appendix A.
Energy Savings Trees modify climate and conserve energy in three principal ways:
Shading reduces the amount of radiant energy absorbed and stored by hardscape surfaces, thereby reducing the heat island effect.
Transpiration converts moisture to water vapor, thereby cooling the air by using solar energy that would otherwise result in heating of the air.

Boulder City, Urban Forest Resource Analysis 21 June 2013
Reduction of wind speed and the movement of outside air into interior spaces and conductive heat loss where thermal conductivity is relatively high (e.g., glass windows) (Simpson, 1998).
The heat island effect describes the increase in urban temperatures in relation to surrounding suburban and rural areas. Heat islands are associated with an increase in hardscape and impervious surfaces. Trees and other vegetation within an urbanized environment help reduce the heat island effect by lowering air temperatures 5°F (3°C) compared with outside the green space (Chandler, 1965). On a larger, citywide scale, temperature differences of more than 9°F (5°C) have been observed between city centers without adequate canopy coverage and more vegetated suburban areas (Akbari and others, 1992). The relative importance of these effects depends upon the size and configuration of trees and other landscape elements (McPherson, 1993). Tree spacing, crown spread, and vertical distribution of leaf area each influence the transport of warm air and pollutants along streets and out of urban canyons.
Trees reduce conductive heat loss from buildings by reducing air movement into buildings and against conductive surfaces (e.g., glass, metal siding). Trees can reduce wind speed and the resulting air infiltration by up to 50%, translating into potential annual heating savings of 25% (Heisler, 1986).
Electricity and Natural Gas Reduction Electricity and natural gas saved annually in Boulder City from both the shading and climate effects of public trees is equal to 107 MWh ($7,966) and 720 therms ($472), for a total retail savings of approximately $8,439 and an average of $6.14 per tree (Table 5). Mondale pine (Pinus eldarica), which represents 27.7% of the population is providing 20.1% of the total energy savings with an average of $4.46 per tree. Chinese elm (Ulmus parvifolia, 16.1%) and white mulberry (Morus alba, 12.4%) provide the next greatest contribution towards total energy savings, due in part to their leaf and canopy size and prevalence within the overall population.
Raywood ash (Fraxinus angustifolia ‘Raywood’), which represents 4.4% of the total population, is contributing only 3.2% of the total energy savings because of the relatively young age distribution of this population (85% of trees <7” DBH). As this population of medium-stature trees matures, the benefits can be expected to increase substantially. The same can be said for some of Boulder City’s other top 20 species, including velvet ash (Fraxinus velutina), Chinese pistache (Pistacia chinensis) and Chinese elm (Ulmus parvifolia), which are also rather young populations.
Examining average energy savings on a per tree basis (Figure 6), white mulberry (Morus alba, $16.11), Aleppo pine (Pinus halepensis, $11.69), and velvet mesquite (Prosopis velutina, $10.88), are currently the greatest contributors, primarily due to their relatively mature age distribution as compared to the rest of the tree population.
Small-stature trees are less able to provide electricity and natural gas reductions. On a per-tree basis, trees such as desert willow (Chilopsis linearis, $0.79) and chaste tree (Vitex agnus-castus, $1.03), are contributing energy-saving benefits well below the average of $6.14/tree.

Boulder City, Urban Forest Resource Analysis 22 June 2013
Figure 6. Annual Electricity and Natural Gas Benefits - Top 5 Species
Table 5. Annual Electric and Natural Gas Benefits from Boulder City’s Tree Resource
Species Total
Electricity (MWh)
Electricity ($)
Total Natural
Gas (Therms)
Natural Gas ($) Total ($) % of
Pop. % of
Total $ Avg.
$/tree
Mondale pine 22 1,609 137 90 1,698 27.7 20.1 4.46 Chinese elm 17 1,286 116 76 1,362 13.5 16.1 7.32 Velvet ash 12 927 88 58 985 11.9 11.7 6.04 Evergreen ash 10 779 70 46 825 6.2 9.8 9.71 Chinese pistache 3 254 26 17 271 5.8 3.2 3.38 White mulberry 13 989 89 58 1,047 4.7 12.4 16.11 Raywood ash 3 251 25 16 267 4.4 3.2 4.46 Italian cypress 3 253 23 15 268 3.8 3.2 5.15 Aleppo pine 7 499 41 27 526 3.3 6.2 11.69 Chitalpa 1 84 9 6 90 3.1 1.1 2.09 Velvet mesquite 5 380 34 22 403 2.7 4.8 10.88 Olive 1 62 6 4 66 1.2 0.8 3.87 Chaste tree 0 16 2 1 17 1.2 0.2 1.03 Western honey mesquite 1 85 8 5 90 1.2 1.1 5.65 Desert willow 0 11 1 1 12 1.1 0.1 0.79 Other species 6 482 45 30 512 8.2 6.1 4.53 All trees 107 7,966 720 472 8,439 1.0 1.0 $6.14
$0 $5 $10 $15 $20
Chinese elm
Evergreen ash
Velvet mesquite
Aleppo pine
White mulberry
$7.32
$9.71
$10.88
$11.69
$16.11

Boulder City, Urban Forest Resource Analysis 23 June 2013
Boulder City’s public trees provide air quality improvements and a significant reduction in atmospheric carbon dioxide.
Atmospheric Carbon Dioxide Reduction As environmental awareness continues to increase, governments are paying particular attention to global warming and the effects of greenhouse gas emissions. Two national policy options are currently under debate: the establishment of a carbon tax, and a greenhouse gas cap-and-trade system, aimed at the reduction of atmospheric carbon dioxide (CO2) and other greenhouse gases. A carbon tax would place a tax burden on each unit of greenhouse gas emission and would require regulated entities to pay for their level of emissions. Alternatively, in a cap-and-trade system, an upper limit (or cap) is placed on global (federal, regional, or other jurisdiction) levels of greenhouse gas emissions and the regulated entities would be required to either reduce emissions to required limits or purchase emissions allowances in order to meet the cap (Williams, 2007).
The idea that carbon credits are a commodity that can be exchanged for financial gain is based on the growth of emerging carbon markets. The Center for Urban Forest Research (CUFR) recently led the development of Urban Forest Project Reporting Protocol. The protocol, which incorporates methods of the Kyoto Protocol and Voluntary Carbon Standard (VCS), establishes methods for calculating reductions, provides guidance for accounting and reporting, and guides urban forest managers in developing tree planting and stewardship projects that could be registered for greenhouse gas (GHG) reduction credits (offsets). The protocol can be applied to urban tree planting projects within municipalities, campuses, and utility service areas anywhere in the United States.
While Boulder City’s urban forest resource may or may not qualify for carbon offset credits or be traded in the open market, the City’s public trees are nonetheless providing a significant reduction in atmospheric carbon dioxide (CO2) for a positive environmental and financial benefit to the community.
Urban trees reduce atmospheric carbon dioxide (CO2) in two ways:
Directly, through growth and the sequestration of CO2 as wood and foliar biomass.
Indirectly, by lowering the demand for heating and air conditioning, thereby reducing the emissions associated with electric power generation and natural gas consumption.
At the same time, vehicles and other combustion engines used to plant and care for trees release CO2 during operation. Additionally, when a tree dies, most of the CO2 that accumulated as woody biomass is released back into the atmosphere during decomposition, except in cases where the wood is recycled. Each of these factors must be considered when calculating the net CO2 benefits of trees.

Boulder City, Urban Forest Resource Analysis 24 June 2013
Sequestered Carbon Dioxide To date, Boulder City’s inventoried urban forest has sequestered a total of 466.6 tons of carbon dioxide (CO2) valued at $6,998.462. Annually, this tree resource directly sequesters 39.1 tons of CO2, valued at $587, into woody and foliar biomass. Accounting for estimated CO2 emissions from tree decomposition (-3.7 tons), tree related maintenance activity (-0.46 tons), and avoided CO2 (53.6 tons), Boulder City's trees provide an annual net reduction in atmospheric CO2 of 88.5 tons, valued at $1,328 with an average of $0.97 per tree (Table 6).
White mulberry (Morus alba, $2.15), Aleppo pine (Pinus halepensis, $1.97), and evergreen ash (Fraxinus uhdei, $1.95) are currently providing the highest per tree benefit (Figure 7). Mondale pine (Pinus eldarica) are providing the greatest percentage of overall benefits at 18.2% due to their prevalence in the population and large stature (only $0.63 per tree).
Figure 7. Annual Reduction of CO2 - Top 5 species
2 Based on i-Tree Streets default value of $15 per ton. Market value may vary.
$0 $1 $2 $3
Velvet ash
Velvet mesquite
Evergreen ash
Aleppo pine
White mulberry
$1.17
$1.60
$1.95
$1.97
$2.15

City of Boulder City, Urban Forest Resource Analysis 25 June 2013
Table 6. Annual CO2 Reduction Benefits Provided by Boulder City’s Inventoried Public Trees
Species Sequestered (lb)
Sequestered ($)
Decomposition Release(lb)
Maintenance Release (lb)
Total Release
($)
Avoided (lb)
Avoided ($)
Net Total (lb)
Total ($)
% of Pop.
% of Total
$
Avg. $/tree
Mondale pine 11,993 90 - 1,133 - 257 - 10 21,638 162 32,242 242 27.7 18.2 0.63 Chinese elm 7,345 55 - 383 - 78 - 3 17,300 130 24,185 181 13.5 13.7 0.98 Velvet ash 14,300 107 - 1,161 - 109 - 10 12,466 93 25,497 191 11.9 14.4 1.17 Evergreen ash 12,781 96 - 1,051 - 82 - 8 10,484 79 22,133 166 6.2 12.5 1.95 Chinese pistache 1,612 12 - 87 - 32 - 1 3,412 26 4,906 37 5.8 2.8 0.46 White mulberry 7,423 56 - 2,026 - 102 - 16 13,299 100 18,594 139 4.7 10.5 2.15 Raywood ash 2,188 16 - 95 - 25 - 1 3,379 25 5,447 41 4.4 3.1 0.68 Italian cypress 3,290 25 - 145 - 41 - 1 3,402 26 6,508 49 3.8 3.7 0.94 Aleppo pine 5,728 43 - 582 - 58 - 5 6,715 50 11,803 89 3.3 6.7 1.97 Chitalpa 1,263 9 - 57 - 13 - 1 1,127 8 2,320 17 3.1 1.3 0.40 Velvet mesquite 3,030 23 - 216 - 31 - 2 5,118 38 7,901 59 2.7 4.5 1.60 Olive 534 4 - 46 - 12 0 831 6 1,307 10 1.2 0.7 0.58 Chaste tree 206 2 - 4 - 3 0 217 2 416 3 1.2 0.2 0.18 Western honey mesquite 717 5 - 34 - 8 0 1,144 9 1,819 14 1.2 1.0 0.85 Desert willow 80 1 0 - 3 0 148 1 224 2 1.1 0.1 0.11 Other species 5,787 43 - 446 - 61 - 4 6,482 49 11,761 88 8.2 6.6 0.78 All trees 78,279 587 - 7,465 - 914 - 63 107,162 804 177,062 1,328 100% 100% $0.97

Boulder City, Nevada Resource Analysis 26 June 2013
Year Ozone > Federal 2012
8-hour Standard
2012 19
2011 9
2010 1
2009 5
2008 10
2007 17
2006 8
2005 8
2004 4
2003 10
Average 9.1
Air Quality Improvement Urban trees improve air quality in five fundamental ways:
Absorption of gaseous pollutants such as ozone (O3), sulfur dioxide (SO2), and nitrogen dioxide (NO2) through leaf surfaces,
Interception of particulate matter (PM10), such as dust, ash, dirt, pollen, and smoke,
Reduction of emissions from power generation by reducing energy consumption,
Increase of oxygen levels through photosynthesis, and
Transpiration of water and shade provision, resulting in lower local air temperatures, thereby reducing ozone (03) levels.
The Clark County Department of Air Quality (CCDAQ) measures air pollution and provides data on the number of days per year that federal pollution standards are exceeded.
PM10 is particulate matter in the air that measures less than 10 micrometers, Smaller than the width of a single human hair. PM10 pollution and can cause respiratory problems for local residents. CCDAQ reports that air quality in Clark County exceeded the state 8-hour PM10 standard of 150 μg/m3 for only 1 day in 2012.
Ozone (O3) is another air pollutant that is harmful to human health. Between 2003 and 2012, the Federal 8-hour standard (0.075 ppm) for ground level (O3) was exceeded 91 days, an average of 9.1 days per year (Table 8) (CCDAQ, 2013).
In the absence of cooling effects provided by trees, higher temperatures contribute to ozone (O3) formation. Additionally, short-term increases in ozone concentrations are statistically associated with increased tree mortality for 95 large US cities (Bell and others, 2004).
However, it should be noted that while trees do a great deal to absorb air pollutants (especially ozone and particulate matter); they also negatively contribute to air pollution. Trees emit various biogenic volatile organic compounds (BVOCs), such as isoprene’s and monoterpenes, which can also contribute to ozone formation. i-Tree Streets analysis accounts for these BVOC emissions in the air quality net benefit.
Table 7. Number of Days Exceeding Federal Ground Level Ozone Standard

Boulder City, Nevada Resource Analysis 27 June 2013
Deposition and Interception Each year, approximately 360 pounds of nitrogen dioxide (NO2), sulfur dioxide (SO2), small particulate matter (PM10), and ozone (O3) are intercepted or absorbed by the public trees in Boulder City, for a value of $1,864 (Table 8). As a population, Mondale pine (Pinus eldarica, 73.4 lbs.), white mulberry (Morus alba, 57.9 lbs.), velvet ash (Fraxinus velutina, 46.2 lbs.) and evergreen ash (Fraxinus uhdei, 44.5 lbs.) are the greatest contributors to air quality improvements, accounting for approximately 65% of total benefits.
Avoided Pollutants The energy savings provided by trees have the additional indirect benefit of reducing air pollutant emissions (NO2, PM10, SO2, and VOCs) that result from energy production Altogether, 365 pounds of pollutants, valued at $3,389.96, are avoided annually through the shading effects of Boulder City’s public trees. The populations of Mondale pine (75 lbs.), Chinese elm (Ulmus parvifolia, 59 lbs.), and white mulberry (Morus alba, 45 lbs.) provide a combined 51% of the total benefits and have the greatest impact on reducing energy needs and therefore avoiding the additional generation of pollutants.
BVOC Emissions Biogenic volatile organic compound (BVOC) emissions from trees, which negatively affect air quality, must also be considered. Approximately 194 pounds of BVOCs are annually emitted from Boulder City’s public trees, offsetting the total air quality benefit by -$777.89. White mulberry (Morus alba) are the heaviest per tree emitters of BVOCs (0.63 lbs.), accounting for 17.5% (40.9 lbs.) of the total BVOC emissions, while representing only 4.7% of the total population. However, white mulberry still has a positive net benefit of $8.46 per tree.
Net Air Quality Improvement The net value of air pollutants removed, avoided, and released by Boulder City’s inventoried public tree population are valued at $4,475.66 annually. The average net benefit per tree is $3.26. Trees vary dramatically in their ability to produce net air quality benefits. Typically, large-canopied trees with large leaf surface areas that are not high emitters of BVOCs produce the greatest benefits. On a per tree basis, white mulberry (Morus alba, $8.46), evergreen ash (Fraxinus uhdei, $6.68), and velvet mesquite (Prosopis velutina, $6.06) currently produce the greatest per tree net air quality improvements (Figure 8). Due in part to their prevalence in the population, Mondale pine (Pinus eldarica) account for the greatest air quality improvements (24.4%) in terms of total benefits by species. These populations collectively remove a net of 117 pounds of pollutants with a net value of $960 annually.
Figure 8. Annual Improvement to Air Quality - Top 5 Species
$0 $2 $4 $6 $8 $10
Chinese elm
Aleppo pine
Velvet mesquite
Evergreen ash
White mulberry
$4.03
$5.04
$6.06
$6.68
$8.46

City of Boulder City, Urban Forest Resource Analysis 28 June 2013
Table 8. Annual Air Quality Improvements Provided by Boulder City’s Inventoried Public Trees
Species Deposition O3 (lb)
Deposition NO2 (lb)
Deposition PM10 (lb)
Deposition SO2 (lb)
Total Deposition
($)
Avoided NO2 (lb)
Avoided PM10 (lb)
Avoided VOC (lb)
Avoided SO2 (lb)
Total Avoided
($)
BVOC Emissions
(lb)
BVOC Emissions
($)
Total (lb)
Total ($)
% of Pop.
Avg. $/tree
Mondale pine 28.32 15.45 29.61 3.11 402 39.00 1.99 0.35 33.40 694 - 33.92 - 135.66 117.31 960 27.71 2.52
Chinese elm 15.91 6.15 15.24 1.28 200 30.93 1.58 0.28 26.44 549 0.00 0.00 97.79 749 13.53 4.03
Velvet ash 20.80 8.05 17.35 1.67 246 22.03 1.12 0.20 18.81 391 0.00 0.00 90.03 637 11.85 3.91
Evergreen ash 19.23 8.41 16.84 1.66 238 18.61 0.95 0.17 15.91 331 0.00 0.00 81.77 568 6.18 6.68
Chinese pistache 4.19 1.62 3.72 0.34 51 6.13 0.31 0.06 5.23 109 - 36.60 - 146.42 - 15.00 13 5.82 0.17
White mulberry 30.23 8.25 19.40 1.84 299 23.33 1.19 0.21 19.94 414 - 40.93 - 163.74 63.47 550 4.73 8.46
Raywood ash 3.19 1.53 3.44 0.32 45 6.03 0.31 0.05 5.15 107 - 5.65 - 22.61 14.37 129 4.36 2.15
Italian cypress 1.00 0.54 1.75 0.11 18 6.15 0.31 0.05 5.26 109 - 8.58 - 34.30 6.60 93 3.78 1.80
Aleppo pine 6.46 3.53 7.53 0.71 96 11.76 0.60 0.10 10.07 209 - 19.61 - 78.44 21.15 227 3.27 5.04
Chitalpa 1.27 0.61 1.31 0.13 17 2.02 0.10 0.02 1.72 36 - 4.25 - 16.99 2.93 36 3.13 0.84
Velvet mesquite 7.59 3.65 7.33 0.75 101 9.08 0.46 0.08 7.77 161 - 9.47 - 37.87 27.25 224 2.69 6.06
Olive 0.98 0.54 1.07 0.11 14 1.49 0.08 0.01 1.27 26 - 0.61 - 2.44 4.94 38 1.24 2.25
Chaste tree 0.11 0.05 0.15 0.01 2 0.39 0.02 0.00 0.33 7 - 0.73 - 2.91 0.35 6 1.24 0.34
Western honey mesquite 1.15 0.55 1.22 0.11 16 2.04 0.10 0.02 1.74 36 - 1.90 - 7.61 5.05 45 1.16 2.79
Desert willow 0.04 0.01 0.06 0.00 1 0.26 0.01 0.00 0.23 5 - 1.16 - 4.62 - 0.54 1 1.09 0.04
Other species 8.84 4.37 8.74 0.88 119 11.56 0.59 0.10 9.88 205 - 31.07 - 124.27 13.89 200 8.22 1.77
All trees 149.32 63.31 134.76 13.03 1,864 190.81 9.73 1.71 163.15 3,390 - 194.47 -$777.89 531.35 4,476 100% $3.26

Boulder City, Nevada Resource Analysis 29 June 2013
Stormwater Runoff Reductions Rainfall interception by trees can reduce the amount of stormwater that enters collection and treatment facilities during large storm events. Trees intercept rainfall in their canopy, acting as mini-reservoirs, controlling runoff at the source. Healthy urban trees can reduce the amount of runoff and pollutant loading in receiving waters in three primary ways:
Leaves and branch surfaces intercept and store rainfall, thereby reducing runoff volumes and delaying the onset of peak flows.
Root growth and decomposition increase the capacity and rate of soil infiltration by rainfall and reduce overland flow.
Tree canopies reduce soil erosion and surface flows by diminishing the impact of raindrops on barren surfaces.
Boulder City’s inventoried public trees intercept 673,573 gallons of stormwater annually for an average of 490 gallons per tree (Table 9). The total annual value of this benefit to the City is $3,233, an average of $2.35 per tree. Aleppo pine (Pinus halepensis) are currently providing the greatest per tree benefit of $7.50 and the greatest percentage of overall stormwater benefits of 24% (Figure 9). Evergreen ash (Fraxinus uhdei) provide the second greatest per tree benefit of $4.55.
As trees grow, their stormwater benefits often improve, but some species will realize more substantial benefits than others will. Many of the species currently demonstrating very low benefits, including desert willow (Chilopsis linearis, $0.16/tree), chaste tree (Vitex agnus-castus, $0.32/tree), and chitalpa (Chitalpa tashkentensis, $0.67/tree) are immature populations of small and medium-growing trees. With appropriate maintenance, benefits from stormwater runoff reductions as well as for energy, air quality, carbon sequestration, and aesthetics will continue to increase significantly as these species mature.
Figure 9. Annual Reduction in Stormwater Runoff - Top 5 Species
$0 $2 $4 $6 $8
Italian cypress
Velvet mesquite
White mulberry
Evergreen ash
Aleppo pine
$2.88
$4.16
$4.28
$4.55
$7.50

Boulder City, Nevada Resource Analysis 30 June 2013
Table 9. Annual Stormwater Runoff Reduction Benefits Provided by Boulder City's Inventoried Public Trees
Species
Total Rainfall
Interception (Gal)
Total ($)
% of Pop.
% of Total
$
Avg. $/tree
Mondale pine 159,157 764 27.7 23.6 2.01
Chinese elm 74,603 358 13.5 11.1 1.93
Velvet ash 65,986 317 11.9 9.8 1.94
Evergreen ash 80,514 387 6.2 12.0 4.55
Chinese pistache 14,858 71 5.8 2.2 0.89
White mulberry 57,986 278 4.7 8.6 4.28
Raywood ash 20,128 97 4.4 3.0 1.61
Italian cypress 31,207 150 3.8 4.6 2.88
Aleppo pine 70,268 337 3.3 10.4 7.50
Chitalpa 5,960 29 3.1 0.9 0.67
Velvet mesquite 32,060 154 2.7 4.8 4.16
Olive 5,554 27 1.2 0.8 1.57
Chaste tree 1,121 5 1.2 0.2 0.32
Western honey mesquite 6,779 33 1.2 1.0 2.03
Desert willow 491 2 1.1 0.1 0.16
Other species 46,902 225 8.2 7.0 1.99
All trees 673,573 3,233 100% 100% $2.35

Boulder City, Nevada Resource Analysis 31 June 2013
Urban trees promote retail shopping by stimulating more frequent visits and a willingness to pay more for goods and
services (Wolf 1999).
Trees provide beauty in the urban landscape.
Aesthetic, Property Value and Socioeconomic Benefits Trees provide beauty in the urban landscape, privacy to homeowners, improved human health, a sense of comfort and place, and habitat for urban wildlife. Research shows that trees promote better business by stimulating more frequent and extended shopping and a willingness to pay more for goods and parking (Wolf, 1999). Some of these benefits are captured as a percentage of the value of the property on which a tree stands. To determine the value of these less tangible benefits, i-Tree Streets uses research that compares differences in sales
prices of homes to estimate the contribution associated with trees. Differences in housing prices in relation to the presence (or lack) of a
street tree help define the aesthetic value of street trees in the urban environment.
Tree location and land use impact the value a tree may add to a property. For example, street trees located in front of a multi-family home will not increase the property value at the same rate as trees in front of a single-family home. Furthermore, street trees located adjacent to commercial and nonresidential properties do not have the same resale potential as residential areas. These factors are taken into consideration and the value of those trees is adjusted accordingly.
The calculation of annual aesthetic and other benefits corresponds with a tree’s annual increase in leaf area. When a tree is actively growing, leaf area may increase dramatically. Once a tree is mature, there may be little or no net increase in leaf area from one year to the next; thus, there is little or no incremental annual aesthetic benefit for that year, although the cumulative benefit over the course of the entire life of the tree may be large. Since this report represents a one-year sample snapshot of the public tree population, aesthetic benefits reflect the increase in leaf area for each species population over the course of a single year.
The total annual benefit associated with property value increases and other less tangible benefits is $91,193, an average of $66.32 per tree (Table 10). Tree species that produced the highest average per tree aesthetic benefits include evergreen ash ($150.02), Aleppo pine (Pinus halepensis, $139.30), and velvet mesquite (Prosopis velutina, $109.33).
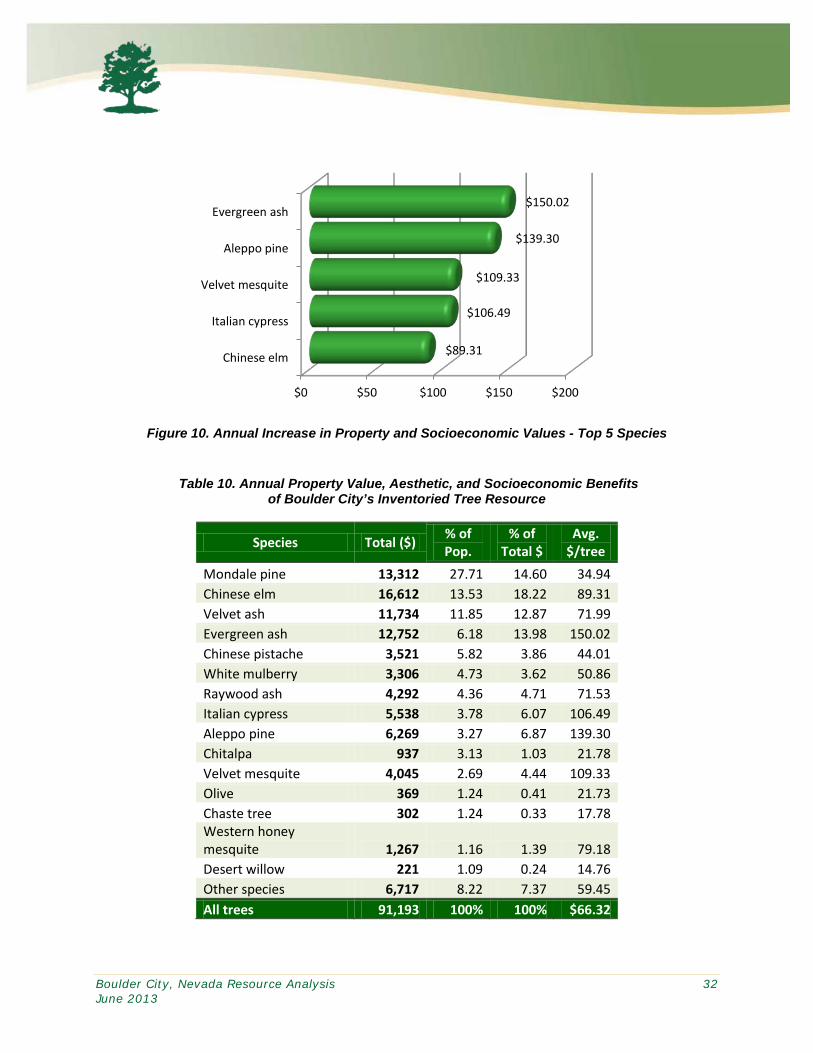
Boulder City, Nevada Resource Analysis 32 June 2013
Figure 10. Annual Increase in Property and Socioeconomic Values - Top 5 Species
Table 10. Annual Property Value, Aesthetic, and Socioeconomic Benefits of Boulder City’s Inventoried Tree Resource
Species Total ($) % of Pop.
% of Total $
Avg. $/tree
Mondale pine 13,312 27.71 14.60 34.94 Chinese elm 16,612 13.53 18.22 89.31 Velvet ash 11,734 11.85 12.87 71.99 Evergreen ash 12,752 6.18 13.98 150.02 Chinese pistache 3,521 5.82 3.86 44.01 White mulberry 3,306 4.73 3.62 50.86 Raywood ash 4,292 4.36 4.71 71.53 Italian cypress 5,538 3.78 6.07 106.49 Aleppo pine 6,269 3.27 6.87 139.30 Chitalpa 937 3.13 1.03 21.78 Velvet mesquite 4,045 2.69 4.44 109.33 Olive 369 1.24 0.41 21.73 Chaste tree 302 1.24 0.33 17.78 Western honey mesquite 1,267 1.16 1.39 79.18 Desert willow 221 1.09 0.24 14.76 Other species 6,717 8.22 7.37 59.45 All trees 91,193 100% 100% $66.32
$0 $50 $100 $150 $200
Chinese elm
Italian cypress
Velvet mesquite
Aleppo pine
Evergreen ash
$89.31
$106.49
$109.33
$139.30
$150.02

Boulder City, Nevada Resource Analysis 33 June 2013
Figure 11. Summary of Annual per Tree Benefits from
Boulder City’s Most Prevalent Tree Species
$0 $50 $100 $150 $200
Other species
Desert willow
Chaste tree
Chitalpa
Olive
Afghan pine
Chinese pistache
Raywood ash
White mulberry
Velvet ash
Western honey mesquite
Chinese elm
Italian cypress
Velvet mesquite
Aleppo pine
Evergreen ash
$68.52
$15.87
$19.64
$25.79
$29.99
$44.55
$48.91
$80.43
$81.85
$85.05
$90.50
$103.56
$117.26
$132.03
$165.50
$172.92
Energy
CO2
Air Quality
Stormwater
Aesthetic/Other
Mondale pine

Boulder City, Nevada Resource Analysis 34 June 2013
Table 11. Summary of Current Annual Average per Tree Benefits ($/Tree)
from Boulder City's Inventoried Tree Resource
Species Energy Air Quality Stormwater CO2
Aesthetic/ Other
% of Pop. Total
Mondale pine 4.46 2.52 2.01 0.63 34.94 27.7 44.55 Chinese elm 7.32 4.03 1.93 0.98 89.31 13.5 103.56 Velvet ash 6.04 3.91 1.94 1.17 71.99 11.9 85.05 Evergreen ash 9.71 6.68 4.55 1.95 150.02 6.2 172.92 Chinese pistache 3.38 0.17 0.89 0.46 44.01 5.8 48.91 White mulberry 16.11 8.46 4.28 2.15 50.86 4.7 81.85 Raywood ash 4.46 2.15 1.61 0.68 71.53 4.4 80.43 Italian cypress 5.15 1.80 2.88 0.94 106.49 3.8 117.26 Aleppo pine 11.69 5.04 7.50 1.97 139.30 3.3 165.50 Chitalpa 2.09 0.84 0.67 0.40 21.78 3.1 25.79 Velvet mesquite 10.88 6.06 4.16 1.60 109.33 2.7 132.03 Olive 3.87 2.25 1.57 0.58 21.73 1.2 29.99 Chaste tree 1.03 0.34 0.32 0.18 17.78 1.2 19.64 Western honey mesquite 5.65 2.79 2.03 0.85 79.18 1.2 90.50 Desert willow 0.79 0.04 0.16 0.11 14.76 1.1 15.87 Other species 4.53 1.77 1.99 0.78 59.45 8.2 68.52 Citywide Average $6.14 $6.14 $2.35 $0.97 $66.32 100% $79.03
Benefit Summary Boulder City’s trees have substantial environmental and aesthetic benefits. Annual increases in property value, socioeconomic, and other aesthetic values are substantial benefits, account for 84% of the total benefits.
Approximately 16% ($17,476) of the total annual benefits quantified in this study are environmental services (Table 12). Energy savings ($8,438) account for 48% of the annual environmental benefits and 7.7% of all annual benefits. Air quality benefits ($4,476) account for 26% of annual environmental benefits and 4% of all annual benefits. Stormwater benefits ($3,233) account for 18.5% of the annual environmental benefits and 3% of all benefits. Carbon reduction benefits, valued at $1,327, account for 7.6% of environmental benefits and 1% of all benefits.
The estimated sum of benefits provided by Boulder City’s public tree resource is $108,668, a value of $79.03 per tree and $7.23 per capita. These benefits are realized on an annual basis. It is important to acknowledge that this is not a full accounting of the benefits provided by this tree resource, as some benefits are intangible and/or difficult to quantify, such as impacts on psychological health, crime, and violence. Empirical evidence of these benefits does exist (Wolf, 2007; Kaplan, 1989; Ulrich, 1986), but there is limited knowledge about the physical processes at work and their interactions make quantification imprecise. Tree growth and mortality rates are highly variable. A true and full accounting of benefits and costs must consider variability among sites (e.g., tree species, growing conditions, maintenance practices) throughout the City, as well as variability in tree growth. In other words, trees are worth far more than what one can ever quantify!

Boulder City, Nevada Resource Analysis 35 June 2013
Figure 12. Benefit Summary for Boulder City’s Tree Resource
Total Annual Benefits from Boulder City's Tree Resource: $108,669 Average Annual per Tree Benefits: $79.03 Annual Value of Benefits Per Capita: $7.23
Table 12. Benefit Summary for Boulder City’s Inventoried Tree Resource
Benefits Total ($) $/tree $/capita Energy 8,439 6.14 0.56 CO2 1,328 0.97 0.09 Air Quality 4,476 3.26 0.30 Stormwater 3,233 2.35 0.22 Aesthetic/Other 91,193 66.32 6.07 Total Benefits 108,669 79.03 7.23
$0
$20,000
$40,000
$60,000
$80,000
$100,000
$120,000
CO2
Stormwater
Air Quality
Energy
Aesthetic/Other

Boulder City, Nevada Resource Analysis 36 June 2013
Conclusion This analysis describes the current structural characteristics of Boulder City’s inventoried public tree resource using established tree sampling, numerical modeling, and statistical methods to provide a general accounting of the benefits produced by this public tree resource. The analysis provides a “snapshot” of this resource at its current population and condition level. Rather than examining each individual tree as an inventory does, the resource analysis examines trends and performance measures over the entire urban forest and each of the major species populations within.
Again, it is important to note that these benefits result from only an estimated 35% of Boulder City’s entire Urban Forest. Should the City endeavor to perform a complete inventory of the remaining tree assets, these benefits will only increase.
Mesquite’s public trees are providing quantifiable benefits including energy savings, stormwater runoff reduction, reduction in atmospheric CO2, and aesthetic benefits. The City’s inventoried public trees are providing $108,668 in gross benefits. That is an average of $79 per tree and $7.23 per capita.
The trees inventoried in this project are fairly young and in good condition with 41 different species. It is critical to maintain an adequate level of resources to protect and nurture this resource. With adequate maintenance, Boulder City’s public trees can be expected to provide even greater benefits in the future and for many generations to come. The City can focus resources on maximizing the flow of benefits from the current tree population and maintaining a forward-thinking approach. Based on the resource analysis, Davey Resource Group recommends the following:
Continue annual tree planting efforts to stock the available planting sites identified by the inventory.
Maintain an appropriate age distribution by planting new trees to improve long-term resource sustainability and greater canopy coverage. To maximize benefits, focus on suitable large-stature trees where conditions are sustainable to maximize benefits.
Maximize the benefits of the existing tree resource through comprehensive tree maintenance and a cyclical pruning schedule.
Implement a structural pruning program for young and establishing trees to promote healthy structure, extend life expectancy, and reduce future costs and liability.
Inventory the remaining tree population and maintain and update the inventory database.
Avoid planting over-represented species and increase species diversity by planting under-used and new (desert adapted) species to promote sustainability.
Use the entire tree inventory and City budget data to perform a complete i-tree Streets Resource Analysis to better determine the current condition, structure, function and needs of the entire public urban forest.
Urban forest managers can better anticipate future trends with an understanding of the current status of the City’s tree population. Managers can also anticipate challenges and devise plans to increase the current level of benefits. Performance data from the analysis can be used to make determinations regarding species selection, distribution, and maintenance policies. Documenting current structure is necessary for establishing goals and performance objectives and can serve as a benchmark for measuring future success. Information from the urban forest resource analysis can be referenced in development of an urban forest management or master plan. An urban forest master plan is a critical tool

Boulder City, Nevada Resource Analysis 37 June 2013
for successful urban forest management, inspiring commitment and providing vision for communication with key decision-makers both inside and outside the organization.
As a Tree City, USA with a forward-looking approach to urban forest management, Boulder City, Nevada is a community that recognizes the vital importance of trees to the environmental, social, and economic well-being of the City. Boulder City has demonstrated that public trees are a valued community resource, a vital component of the urban infrastructure, and an important part of the City’s history and identity. The City takes a proactive approach to caring for the community’s trees, as evidenced by the condition and structure of this public resource. As additional trees are inventoried and maintenance is performed, updates should be incorporated into the inventory. Current and complete inventory data will help staff to more efficiently track maintenance activities and tree health and will provide a strong basis for making informed management decisions. With additional tree planting and continued proactive management, Boulder City’s urban forest can be expected to produce an even greater flow of benefits as this resource continues to mature. If Boulder City maintains a commitment to planting, maintaining and preserving these trees, the community will continue to be a healthy, safe, and enjoyable place to live.

Boulder City, Nevada Resource Analysis 38 June 2013
Appendix A: Methods and Procedures Certified arborists collected Boulder City’s tree inventory, using ArcPad software to assist the inventory arborist in locating the trees on the ground and inputting tree attributes (details about each tree’s species, size, and condition). The data was formatted for use in i-Tree’s public tree population assessment tool, i-Tree Streets, a STRATUM Analysis Tool (Streets v 5.0.1; i-Tree v 5.0.6). i-Tree Streets assesses tree population structure and the function of those trees, such as their role in building energy use, air pollution removal, stormwater interception, carbon dioxide removal, and property value increases. In order to analyze the economic benefits of Boulder City’s trees, i-Tree Streets calculates the dollar value of annual resource functionality and compares that to annual program expenditures. This analysis combines the results of the City’s tree inventory with benefit-cost modeling data to produce information regarding resource structure, function, and value for use in determining management recommendations. i-Tree Streets regionalizes the calculations of its output by incorporating detailed reference City project information for 17 climate zones across the United States (Boulder City is located in the Southwest Desert Climate Zone).
An annual resource unit was determined on a per tree basis for each of the modeled benefits. Resource units are measured as MWh of electricity saved per tree; MBtu of natural gas conserved per tree, pounds of atmospheric CO2, pounds of O3, pounds of SO2, pounds of NO2, PM10, and VOCs reduced per tree; cubic feet of stormwater runoff reduced per tree; and square feet of leaf area added per tree to increase property values.
Price values assigned to each resource unit were generated based on economic indicators of society’s willingness to pay for the environmental benefits trees provide. The city did not provide a budget for the planting, irrigation, and maintenance of public trees.
Estimates of benefits are initial approximations as some benefits are difficult to quantify (e.g., impacts on psychological health, crime, and violence). In addition, limited knowledge about the physical processes at work and their interactions makes estimates imprecise (e.g., fate of air pollutants trapped by trees and then washed to the ground by rainfall). Therefore, this method of quantification provides first-order approximations based on current research. It is intended to be a general accounting of the benefits produced by urban trees.
Table 13. Boulder City Benefit Prices Used In This Analysis
Benefits Price Unit Source Electricity $0.0743 $/Kwh BCNV.org Residential Rates Natural Gas $0.6557 $/Therm Southwest Gas Residential Rates CO2 $0.0075 $/lb Streets default – Southwest Desert PM10 $6 $/lb Streets default – Southwest Desert NO2 $4 $/lb Streets default – Southwest Desert SO2 $15.70 $/lb Streets default – Southwest Desert VOC $4 $/lb Streets default – Southwest Desert Stormwater Interception $0.0048 $/gallon Streets default – Southwest Desert Median Home Value $235,989 $ City-Data.com
i-Tree Streets default values (Table 13) from the Southwest Desert Climate Zone were used for all benefit prices except for median home values and electric and natural gas rates. Electric rates are 2012 rates obtained from the Boulder City, Nevada web site (http://www.bcnv.org/?q=resrates). Natural gas rates are 2012 rates obtained from the Southwest Gas web site (http://www.swgas.com/tariffs/nevada_rates_and_tariffs.php). Median home value (2009) for Boulder City was verified at City-Data.com (http://www.city-data.com/city/Boulder-City-Nevada.html). Using these rates, the magnitude of the benefits provided by the public tree resource was calculated using i-Tree Streets. Program budget values used in benefit versus investment ratio calculations were not supplied by Boulder City.

Boulder City, Nevada Resource Analysis 39 June 2013
Appendix B: References Akbari, H., D. Kurn, et al. 1997. Peak power and cooling energy savings of shade trees. Energy and Buildings 25:139–148.
Bell ML, McDermott A, Zeger SL, Samet JM, Dominici F. 2004. Ozone and short-term mortality in 95 US urban communities, 1987-2000. J Amer Med Assoc 292:2372-2378.
Chandler TJ. 1965. The Climate of London. London:Hutchinson.
Clark County Department of Air Quality, Nevada. Air Quality Current Rules and Regulations. http://www.clarkcountynv.gov/Depts/AirQuality/Pages/Rules_CurrentRulesandRegulations.aspx
Clark County Department of Air Quality, Nevada. Air Quality In Clark County. http://ccaqapps5m.co.clark.nv.us/
Clark JR, Matheny NP, Cross G, Wake V. 1997. A model of urban forest sustainability. J Arbor 23(1):17-30.
CTLA. 1992. Guide for Plant Appraisal. 8th ed. Savoy, IL: ISA. 103 p.
CUFR. Center For Urban Forest Research Pacific Southwest Research Station. http://www.fs.fed.us/psw/programs/cufr/
Cullen S. 2002. Tree appraisal: can depreciation factors be rated greater than 100%? J Arbor 28(3):153-158.
EPA, US Environmental Protection Agency. Heat Island Effect. www.epa.gov/heatisland/about/index.htm
EPA, US Environmental Protection Agency. National Ambient Air Quality Standards (NAAQS). http://www.epa.gov/air/criteria.html
Huang, J., H. Akbari, and H. Taha. 1990. The Wind-Shielding and Shading Effects of Trees on Residential Heating and Cooling Requirements. ASHRAE Winter Meeting, American Society of Heating, Refrigerating and Air-Conditioning Engineers. Atlanta, Georgia.
Heisler GM. 1986. Energy savings with trees. J Arbor 12(5):113–125.
i-Tree, STRATUM, http://www.itreetools.org/
Kaplan, Rachel and Stephen. 1989. The Experience of Nature: A Psychological Perspective. Cambridge: Cambridge University Press.
Kurn, D., S. Bretz, B. Huang, and H. Akbari. 1994. The Potential for Reducing Urban Air Temperatures and Energy Consumption through Vegetative Cooling (PDF) (31 pp, 1.76MB). ACEEE Summer Study on Energy Efficiency in Buildings, American Council for an Energy Efficient Economy. Pacific Grove, California.
Maco SE, McPherson EG. 2002. Assessing canopy cover over streets and sidewalks in street tree populations. J Arbor 28(6):270-276.
Maco SE, McPherson EG. 2003. A practical approach to assessing structure, function, and value of street tree populations in small communities. J Arbor 29(2):84-97.

Boulder City, Nevada Resource Analysis 40 June 2013
McPherson EG, Rowntree RA. 1989. Using structural measures to compare twenty two US street tree populations. Land J 8:13-23.
McPherson EG. 1993. Evaluating the cost-effectiveness of shade trees for demand-side management. Elec J 6(9):57-65.
McPherson, E.G., J. R. Simpson, P. J. Peper, S. E. Maco, and Q. Xiao. 2005. Municipal forest benefits and costs in five US cities (PDF) (6 pp, 267K). Journal of Forestry 103(8):411–416.
McPherson et al. 2008. Urban Forest Greenhouse Gas Reporting Protocol
Miller RW. 1997. Urban forestry: planning and managing urban greenspaces. 2nd ed.
Moll G, Kollin C. 1993. A new way to see our City forests. American Forests 99(9-10): 29-31.
Richards NA. 1982/83. Diversity and stability in a street tree population. Urban Ecology. 7:159–171.
Ulrich, Roger S. 1986. Human Responses to Vegetation and Landscapes. Landscape and Urban Planning, 13, 29-44.
Watson G. 2002. Comparing formula methods of tree appraisal. Journal of Arboriculture. 28(1): 11-18.
Williams E, Lotstein R, Galik C, Knuffman H. 2007. A Convenient Guide to Climate Change Policy and Technology. Vol2: 134 p
Wolf, K.L. 2007. The Environmental Psychology of Trees. International Council of Shopping Centers Research Review. 14, 3:39-43.