both topography and climate affected forest and · pdf filetopography and climate affected...
TRANSCRIPT

Both topography and climate affected forest and woodlandburn severity in two regions of the western US, 1984 to 2006
GREGORY K. DILLON,1,� ZACHARY A. HOLDEN,2 PENELOPE MORGAN,3 MICHAEL A. CRIMMINS,4
EMILY K. HEYERDAHL,1 AND CHARLES H. LUCE5
1USDA Forest Service, Rocky Mountain Research Station, Fire Sciences Laboratory, Missoula, Montana 59808 USA2USDA Forest Service, Northern Region, Missoula, Montana 59807 USA
3Wildland Fire Program and College of Natural Resources, University of Idaho, Moscow, Idaho 83844-1133 USA4Department of Soil, Water, and Environmental Science, The University of Arizona,
Tucson, Arizona 85721 USA5USDA Forest Service, Rocky Mountain Research Station, Boise, Idaho 83702 USA
Citation: Dillon, G. K., Z. A. Holden, P. Morgan, M. A. Crimmins, E. K. Heyerdahl, and C. H. Luce. 2011. Both
topography and climate affected forest and woodland burn severity in two regions of the western US, 1984 to 2006.
Ecosphere 2(12):130. doi: 10.1890/ES11-00271.1
Abstract. Fire is a keystone process in many ecosystems of western North America. Severe fires kill and
consume large amounts of above- and belowground biomass and affect soils, resulting in long-lasting
consequences for vegetation, aquatic ecosystem productivity and diversity, and other ecosystem properties.
We analyzed the occurrence of, and trends in, satellite-derived burn severity across six ecoregions in the
Southwest and Northwest regions of the United States from 1984 to 2006 using data from the Monitoring
Trends in Burn Severity project. Using 1,024 fires from the Northwest (4,311,871 ha) and 497 fires from the
Southwest (1,434,670 ha), we examined the relative influence of fine-scale topography and coarse-scale
weather and climate on burn severity (the degree of change from before the fire to one year after) using the
Random Forest machine learning algorithm. Together, topography, climate, and weather explained severe
fire occurrence with classification accuracies ranging from 68% to 84%. Topographic variables were
relatively more important predictors of severe fire occurrence than either climate or weather variables.
Predictability of severe fire was consistently lower during years with widespread fires, suggesting that
local control exerted by topography may be overwhelmed by regional climatic controls when fires burn in
dry conditions. Annually, area burned severely was strongly correlated with area burned in all ecoregions
(Pearson’s correlation 0.86–0.97; p , 0.001), while the proportion of area burned severely was significantly
correlated with area burned only in two ecoregions (p � 0.037). During our short time series, only
ecoregions in the Southwest showed evidence of a significant increase (p � 0.036) in annual area burned
and area burned severely, and annual proportion burned severely increased in just one of the three
Southwest ecoregions. We suggest that predictive mapping of the potential for severe fire is possible, and
will be improved with climate data at the scale of the topographic and Landsat-derived burn severity data.
Although severity is a value-laden term implying negative ecosystem effects, we stress that severity can be
objectively measured and recognize that high severity fire is an important ecological process within the
historical range of variability in some ecosystems.
Key words: ecological change detection; fire ecology; Landsat TM; northwestern United States; Random Forests;
relative differenced normalized burn ratio (RdNBR); remote sensing; southwestern United States; wildland fire.
Received 9 September 2011; revised 14 October 2011; accepted 17 October 2011; final version received 18 November
2011; published 12 December 2011. Corresponding Editor: D. P. C. Peters.
Copyright: � 2011 Dillon et al. This is an open-access article distributed under the terms of the Creative Commons
Attribution License, which permits restricted use, distribution, and reproduction in any medium, provided the original
author and sources are credited.
� E-mail: [email protected]
v www.esajournals.org 1 December 2011 v Volume 2(12) v Article 130

INTRODUCTION
Fire is a keystone process in many ecosystemsof western North America. High severity firesconsume large amounts of above- and below-ground biomass (Keeley 2009). The resultingecological effects have long-term consequencesfor vegetation structure and composition (Hold-en et al. 2006, Lentile et al. 2007), severity ofsubsequent fires (Holden et al. 2010), soil erosionand mass wasting (Istanbulluoglu et al. 2002,Cannon et al. 2010, Robichaud et al. 2010), carbonand nutrient cycling (Hurteau and Brooks 2011),and other soil properties (Certini 2005). Aquaticecosystems are both dependent on episodicsevere fire for mass wasting and log inputs andseverely disrupted in the short term by theresultant temperature and sediment changes(Bisson et al. 2003), yielding a strong dependenceon scaling and synchrony of severe fire occur-rence within a basin (Miller et al. 2003). Recentclimate-driven increases in the extent and fre-quency of wildland fire in the western UnitedStates have received much attention (Westerlinget al. 2006, Morgan et al. 2008, Littell et al. 2009,Littell et al. 2010), but much less is known aboutthe degree of ecological change (i.e., burnseverity) caused by wildfires (Lentile et al. 2006,Lentile et al. 2007, Keane et al. 2008, Keeley 2009).Millions of dollars are spent on postfire-rehabil-itation to limit erosion and weed invasionfollowing severe fires (Parsons et al. 2010) andon fuel treatments implemented to alter thebehavior and severity of subsequent fires (Wim-berly et al. 2009, Hudak et al. 2011). For thesereasons, it is particularly important that weincrease our understanding of the landscapeand climate controls of burn severity to betterpredict the ecological effects of wildfires.
Researchers have recently focused on charac-terizing the controls of spatial variation in burnseverity at the fire- or landscape-scale (Broncanoand Retana 2004, Chafer et al. 2004, Odion et al.2004, Bigler et al. 2005, Lentile et al. 2006, Holdenet al. 2009, Miller et al. 2009b, Bradstock et al.2010). However, the severity of multiple fires atregional and sub-continental scales has not beenanalyzed. In the United States, wildfires, espe-cially severe ones, retain a largely negativestigma, despite our growing awareness of theirvital role in maintaining structure and function in
ecosystems around the world (Bond and Keeley2005). In many respects, it is the severity ofwildland fire, rather than whether or not alocation burned that has greatest effect onecological processes.
Topography and climate are likely importantdrivers of burn severity
Spatial variation in burn severity reflectsvariation in both the intensity and duration offire activity across the landscape. The primaryfactors typically thought to control fire intensityand duration are topography, weather, and fuels(Pyne et al. 1996). Many have argued thataccumulation of fuels from fire suppressionduring the past century is influencing theoccurrence of high severity fire today (Keane etal. 2002), while others have argued that weatheris the primary driver of fire behavior (Bessie andJohnson 1995). Evaluating the effect of fuels onseverity across regional scales is confounded bywide variation in land use and disturbancehistory, for which information is incomplete.However, topography and weather (and morebroadly, climate) have indirect influences on thespatial variability of fuels, as well as directinfluence over the biophysical conditions thatmay affect fire intensity and duration. Theavailability of spatially comprehensive data ontopography (Gesch 2007) and historical climate(Mesinger et al. 2006, Rehfeldt 2006), thereforeenables regional evaluation of topography andclimate as drivers of burn severity.
Topography and site conditions influencevegetation distribution and productivity (Whit-taker 1970, Barbour et al. 1999) across landscapesand regions, with implications for where andwhy fires burn severely. The effects of topogra-phy on fire behavior (ignition, spread, intensity)have been the subject of much research (Pyne etal. 1996), and some studies have focused on burnseverity relative to topography (e.g., Kushla andRipple 1997, Broncano and Retana 2004, Holdenet al. 2009). Topography affects energy and waterbalances that control vegetation development,and therefore the accumulation of biomass thatfuels fires when it is sufficiently dry. Further-more, elevation, aspect, latitude, longitude, topo-graphic position, and surrounding topographiccontext all influence microclimatic conditions(temperature, precipitation, direct solar radiation,
v www.esajournals.org 2 December 2011 v Volume 2(12) v Article 130
DILLON ET AL.
wind exposure, etc.) that influence the moisturecontent of fuel. Physical properties of fires suchas combustion rate, fuel consumption, total heat,and soil heating in turn cause changes tovegetation and soils that form the basis fordescribing or estimating burn severity (Pyne etal. 1996, Keane et al. 2010).
In the western United States during thetwentieth century, climate was a strong driverof fire extent (Littell et al. 2009) and of thefrequency of large fires (Westerling et al. 2006).Dendroecological studies have similarly demon-strated the strong influence of climate on pre-twentieth century fires (Kitzberger et al. 2007).There are several reasons to expect that climateinfluences burn severity as well. First, drierconditions generally increase the net energyreleased from fuel during burning. In NewMexico, for example, area burned severely wascorrelated with the duration of rain-free periodsin the spring preceding the fire (Holden et al.2007). Second, more fuel, including logs, duff,and tree crowns, is likely to be consumed if fuelsare dry than if they are not (Pyne et al. 1996), andsignificant consumption of crown fuels can leadto severe fire effects. Third, Pierce and Meyer(2008) hypothesized that multidecadal climateinfluenced the occurrence of large, severe fires inpast millennia.
In regions of complex mountainous topogra-phy, such as the western United States, topogra-phy and climate interact to create steepbiophysical gradients that influence not only fireextent (Taylor and Skinner 2003), but also burnseverity. With climate variations between years ofwidespread fire and other years, the relativeinfluence of climate versus topography on burnseverity is likely to vary as well. Bigler et al.(2005) hypothesized that the local effects of fuelsand topography decline with increasingly severefire weather, particularly across short elevationgradients. However, the importance of topo-graphic controls on burn severity, relative toclimate and weather, is largely unexplored.
Availability of west-wide burn severity datamake regional-scale studies possible
Quantifying burn severity across large regionsrequires the acquisition and processing of largeamounts of remotely-sensed imagery. Whilepoint-based measurements of severity are possi-
ble on the ground, use of satellite imagery isrequired to gain a landscape perspective onspatial patterns of severity (Key and Benson2006). Fortunately, the Monitoring Trends inBurn Severity project (MTBS, public communica-tion, http://www.mtbs.gov) has used Landsatsatellite imagery to map burn severity for alllarge wildfires (.405 ha) across the westernUnited States from 1984 to present (Eidenshink etal. 2007), covering most of the area burnedduring this time period. Because these data havehigh spatial resolution (30 m) and broad extent(the western United States), they provide aunique opportunity to study the topographicand climatic controls of burn severity at asubcontinental scale. MTBS characterizes burnseverity with two closely-related indices: thedifferenced normalized burn ratio (dNBR; Keyand Benson 2006) and the relative differencednormalized burn ratio (RdNBR; Miller andThode 2007). Calculated from pre- and post-fireLandsat TM and ETMþ imagery, dNBR andRdNBR both use light reflected from earth innear-infrared (Landsat band 4) and mid-infrared(Landsat band 7) wavelengths to capture fire-induced changes in vegetation cover and soilcharacteristics. While dNBR provides a measureof absolute change, RdNBR is adjusted toaccount for pre-fire conditions at each pixel. Assuch, RdNBR provides a more consistent mea-sure of burn severity than dNBR when evaluat-ing severity across broad regions and diversevegetation (Miller et al. 2009a, Norton et al. 2009),including sites with low preburn biomass. As anindirect measure of biomass loss, RdNBR can beused to accurately identify stand-replacing fire inforests and woodlands (Miller and Thode 2007).We define burn severity, therefore, as the degreeof change one year post-fire relative to pre-fireconditions (Lentile et al. 2006) as measured byRdNBR.
Burn severity may have increased recently butthis hasn’t been well documented
Annual area burned by wildfires increased inthe western United States during the last half ofthe twentieth century (Littell et al. 2009) as hasthe the number of large fires (Westerling et al.2006), and the total area burned is expected toincrease with climate warming (Running 2006,NWCG 2009). More area has burned in recent
v www.esajournals.org 3 December 2011 v Volume 2(12) v Article 130
DILLON ET AL.

decades, compared to the middle 20th century, inforests in the US Northern Rockies (Morgan et al.2008), southwestern United States (Swetnam andBetancourt 1998), and western United States as awhole (Westerling et al. 2006, Littell et al. 2009,Littell et al. 2010). When more area burns, morearea burns severely (Holden et al. 2011), but it ispossible that the proportion of area burnedseverely could be increasing as well in someareas (Miller et al. 2009b). Although the MTBSrecord of severe fires is quite short for assessingsuch trends, it has proven useful in detectingincreases in severity for some forest types inCalifornia’s Sierra Nevada mountains in recentdecades (Miller et al. 2009b). Comparing MTBSobservations across different regions with di-verse vegetation, topography, climate, and land-use histories will help us understand recenttrends and forecast future trends in wildfireextent and severity—both important elements offire regimes (Morgan et al. 2001).
ObjectiveOur objective was to assess the influence of
topography, climate, and weather on burnseverity in forests and woodlands across theNorthwest and Southwest regions of the UnitedStates. We also assessed whether there was anincreasing trend in burn severity from 1984 to2006. We used burn severity inferred from 1,521remotely sensed fires (Eidenshink et al. 2007) thatburned in forests and woodlands. We analyzedthe influence of fine-scale topography andcoarse-scale climate and weather on burn sever-ity using the Random Forests machine learningalgorithm (Breiman 2001).
METHODS
Study areaOur study area encompasses two broad regions
of the western United States: 63 million ha in theNorthwest and 77 million ha in the Southwest(Fig. 1). The Northwest covers portions of LAND-FIRE map zones 1, 2, 7, 8, 9, 10, 18, 19, and 21,while the Southwest covers all of map zones 14,15, 16, 23, 24, 25, and 28 ( public communication,http://landfire.cr.usgs.gov/viewer/). Rather thancover all areas in the western United States, wechose these two regions because: (1) fire plays anactive role in the ecology of forests and woodlands
in both regions; and (2) the Northwest andSouthwest represent two centers of action in aclimatic dipole characterized by out-of-phaseinterannual precipitation variability and demon-strated links to multicentury fire history (Kitz-berger et al. 2007), potentially leading todifferences in the influence of climate on burnseverity. A similar analysis of burn severity trendsand causes has already been conducted forCalifornia (Miller et al., in press), and additionalwork is underway to examine the potentialinfluences of topography, climate, and vegetationon burn severity across the entire western UnitedStates (Dillon et al. 2011).
In addition to different influences on burnseverity between the Northwest and Southwestregions, we also expected the relative influence oftopography, climate, and weather to vary withineach region. Therefore, we subdivided ouranalysis into six ecoregions, using groupings ofexisting ecological regions (CEC 2007). Ourecoregions are: (1) Pacific; (2) Inland Northwest;(3) Northern Rockies; (4) Southern Rockies; (5)Colorado Plateau; and (6) Mogollon Rim (Fig. 1).
To identify forests and woodlands, we usedenvironmental site potential (ESP; Rollins 2009;public communication, http://www.landfire.gov/NationalProductDescriptions19.php). ESP is apotential vegetation classification that depicts thevegetation capable of being supported at a site,based on biophysical site characteristics such asclimate, topography, and substrate. We combinedESP into eight broad groups but only analyzed thefour groups with the potential for forest andwoodland vegetation (.10% tree cover): wood-land, dry forest, mesic forest, and cold forest(Appendix A).We used ESP instead of a classifi-cation of existing vegetation primarily because wewanted to capture sites that supported forest orwoodland vegetation before fire. While consistentexisting vegetation data exist for our study area( public communication, http://www.landfire.gov/NationalProductDescriptions21.php), they repre-sent a static point in time and would in manycases depict non-forest vegetation on sites thatwere forest or woodland prior to disturbance.Conversely, we acknowledge that using ESP toidentify forests and woodlands may have causedsome fires that burned in non-forest vegetation tobe included in our analysis, but we felt that thiswas the best approach given the lack of consistent
v www.esajournals.org 4 December 2011 v Volume 2(12) v Article 130
DILLON ET AL.

pre-fire vegetation data.
Burn severity dataWe acquired satellite-derived severity data
(RdNBR) for forest and woodland fires in ourstudy area that burned from 1984 to 2006 (1,024fires in the Northwest, acquired 25 February2010; 750 fires in the Southwest, acquired 6 July
2009; public communication http://www.mtbs.gov). We determined a fire to be in forest andwoodland if the majority of area inside the fireperimeter was mapped as one of the four forestand woodland ESP groups (Appendix A). Keep-ing with our definition of burn severity (degreeof change from pre-fire to one year post-fire), weevaluated the timing of pre- and post-fire
Fig. 1. Location of the study area showing the Northwest and Southwest regions, six ecoregions, and the 1,521
fires (red) included in our analysis. Fires excluded from our study (gray) were either in non-forest settings or did
not meet criteria for imagery timing. A burn severity map (RdNBR) for one fire shows an example of spatial
variation in severity (inset).
v www.esajournals.org 5 December 2011 v Volume 2(12) v Article 130
DILLON ET AL.

imagery for all fires to ensure that post-fireimagery was taken six to 18 months post-fire andthat pre- and post-fire images were taken in thesame season (660 days). In the Northwest,relatively few fires (13%; 6% of area mapped infires) were outside these parameters. However, inthe Southwest, where 34% of fires (25% of areamapped in fires) did not meet these criteria, weeliminated 253 fires (502,093 ha) from ouranalyses. Of the fires that were eliminated, 93%had post-fire imagery less than six months afterthe fire, indicating initial assessments of severitythat are typically done on non-forested sites.Further, the proportion of area burned eliminat-ed in any one year ranged from 0% in 1984 (thesmallest fire year) to 100% in 1991 (the secondsmallest fire year), with an average in all otheryears of 29% (range: 3–64%; sd¼ 17). In general,we felt that eliminating fires from our analysisbased on image timing in the Southwest helpedto refine our dataset to truly forest and woodlandfires and did not bias our analysis of annualtrends.
By using satellite imagery from approximatelyone year post-fire, we inherently included somedelayed effects of fire such as plant mortality andresprouting, which can be influenced by factorsother than fire (Keeley 2009). Managementactions such as salvage logging, reseeding, andplanting can also occur during the first year afterfire, potentially influencing RdNBR values. Weaccepted the inclusion of these ecosystem re-sponses and management influences as necessaryto evaluate questions relating to burn severity ina consistent manner across broad geographic andtemporal scales.
We analyzed 1,024 fires from the Northwest(4,311,871 ha) and 497 fires from the Southwest(1,434,670 ha; Fig. 2). Most fires (92%) were .405ha, but they ranged from 20 ha to 228,966 ha. Forareas that burned more than once from 1984 to2006 (199,739 ha in the Northwest; 108,402 ha inthe Southwest), we used only the RdNBR of thefirst fire because burn severity can be affected bythe severity of previous fires (Holden et al. 2010,Halofsky et al. 2011).
For all fires, we classified the continuous
Fig. 2. Area burned (total) and burned severely
within that total (hatched) by potential vegetation
group, divided by ecoregion: (A) Pacific, (B) Inland
Northwest, (C) Northern Rockies, (D) Southern
Rockies, (E) Colorado Plateau, and (F) Mogollon
Rim. Number of fires (solid line with the right side
y-axis) reflects the assignment of each fire to a
potential vegetation group based on majority. Small
areas of non-forest (nonveg, grass, dry shrub, and
mesic shrub) were included in selected fires, but
account for less than 5% of total area burned.
v www.esajournals.org 6 December 2011 v Volume 2(12) v Article 130
DILLON ET AL.

RdNBR into discrete classes of severely burnedversus not severely burned using field measure-ments of burn severity (composite burn index,CBI; Key and Benson 2006) from 565 plots inGrand Canyon National Park (E. Gdula, personalcommunication). Using methods similar to Millerand Thode (2007), we used a non-linear equationto regress RdNBR against CBI (R2 ¼ 0.69) andcalculate a threshold for severely burned equiv-alent to CBI values above 2.25 (RdNBR � 695;Fig. 3). Field-measured CBI values of 2.25represent the midpoint between moderate andhigh severity for rating factors such as surfacefuel consumption, soil heating, plant mortality,and alteration of foliage at different heightsabove the soil surface (Key and Benson 2006).Our calculated threshold of 695 between moder-ate and high severity was very similar to athreshold derived independently from anotherstudy using Grand Canyon field data (RdNBR¼698; Pabst 2010), and to others calculated for theSierra Nevada (RdNBR ¼ 641; Miller and Thode2007), the Gila Wilderness, New Mexico (RdNBR¼ 677; Holden et al. 2009), and the NorthCascades (RdNBR ¼ 703; Cansler 2011).
In each ecoregion, we determined years ofwidespread fires (‘‘big years’’) based on annual
area burned. The distribution of annual areaburned is positively skewed in all ecoregions,characterized by relatively low area burned inmost years, punctuated by a few big years. In theNorthwest, the Pacific and Northern Rockiesecoregions had particularly skewed distributions(skewness . 2), so we selected big years as thosewith area burned greater than the upper quartileplus 1.5 times the inter-quartile range (resultingin three big years in the Pacific and five in theNorthern Rockies; Fig. 4). In the Inland North-west, the distribution was less skewed (skewness¼ 1.1), so we selected big years as those with areaburned greater than 0.5 standard deviation abovethe mean (resulting in five big years). In theSouthwest, we selected the six big years in theupper quartile of annual area burned for eachecoregion. Big years accounted for over half ofthe total area burned from 1984 to 2006 in everyecoregion (Pacific ¼ 82%, Inland Northwest ¼57%, Northern Rockies ¼ 81%, Southern Rockies¼ 85%, Colorado Plateau¼ 71%, Mogollon Rim¼72%). Big years are climatically distinct fromother years; in all ecoregions, temperatures wereabove normal and precipitation was belownormal during fire seasons in big years (Appen-dix A). In contrast, temperature and precipitationduring other years were both close to long-termaverages.
Fine-scale topography dataWe considered elevation (acquired from
LANDFIRE, public communication, http://landfire.cr.usgs.gov/viewer/) and a suite of topo-graphic indices derived from elevation, all at 30-m2 spatial resolution (Appendix A). We calculat-ed indices covering three broad categories oftopographic information: slope and aspect, slopeposition and curvature, and topographic com-plexity. Our indices of slope and aspect werepercent slope, heat load index (McCune andKeon 2002, Eq. 3), solar radiation aspect index(Roberts and Cooper 1989), and an indexcombining slope and cosine-transformed aspect(Stage 1976). Indices of slope position andcurvature were hierarchical slope position (Mur-phy et al. 2010), compound topographic index(Moore et al. 1993), and a topographic positionindex (Weiss 2001) that we calculated at threespatial scales (annular neighborhoods with 150m, 300 m, and 2,000 m outer radii ). Indices of
Fig. 3. Non-linear regression model of the relative
differenced normalized burn ratio (RdNBR) versus 565
field-measured composite burn index (CBI) plots from
Grand Canyon National Park, Arizona. Dashed lines
show the threshold for high severity (CBI ¼ 2.25;
RdNBR ¼ 695).
v www.esajournals.org 7 December 2011 v Volume 2(12) v Article 130
DILLON ET AL.
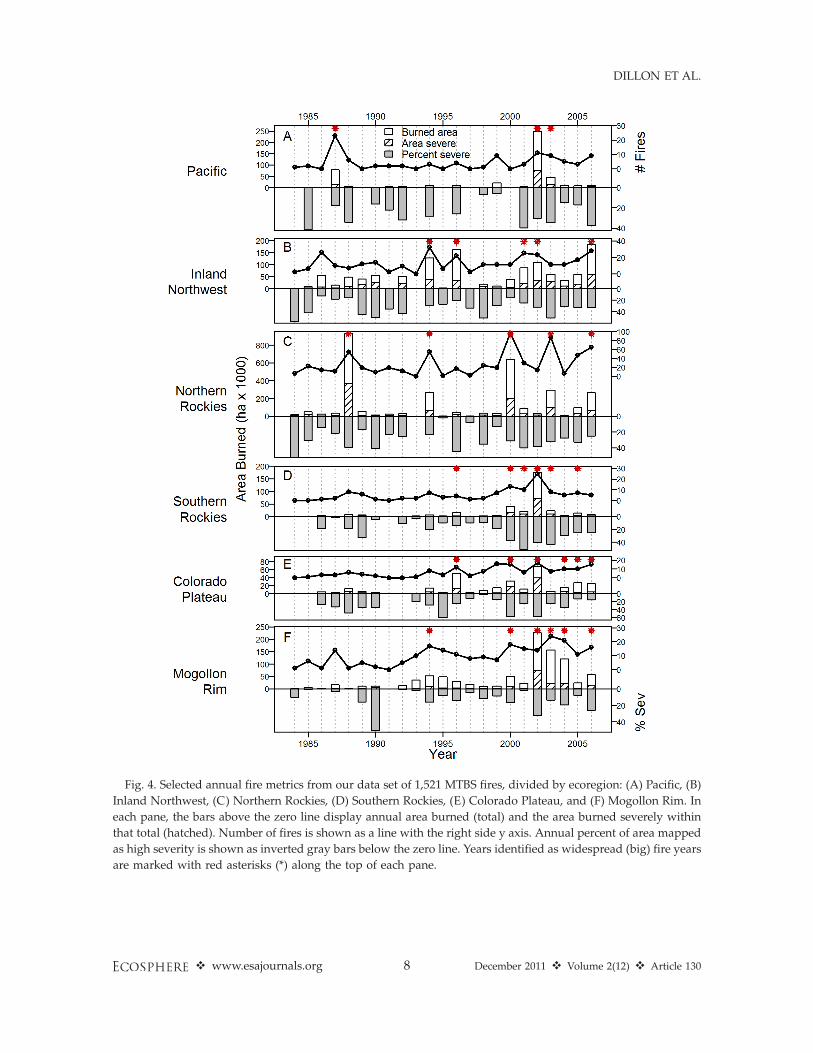
Fig. 4. Selected annual fire metrics from our data set of 1,521 MTBS fires, divided by ecoregion: (A) Pacific, (B)
Inland Northwest, (C) Northern Rockies, (D) Southern Rockies, (E) Colorado Plateau, and (F) Mogollon Rim. In
each pane, the bars above the zero line display annual area burned (total) and the area burned severely within
that total (hatched). Number of fires is shown as a line with the right side y axis. Annual percent of area mapped
as high severity is shown as inverted gray bars below the zero line. Years identified as widespread (big) fire years
are marked with red asterisks (*) along the top of each pane.
v www.esajournals.org 8 December 2011 v Volume 2(12) v Article 130
DILLON ET AL.
topographic complexity, also calculated at threespatial scales (circular neighborhoods with 90 m,450 m, and 810 m radii ), were Martonne’smodified dissection coefficient (Evans 1972) andelevation relief ratio (Pike and Wilson 1971).Prior to modeling, we eliminated variables thatwere highly correlated with others (Spearman’srho . 0.75). From our 16 candidate topographicpredictor variables, we retained between 12 and14 variables in each ecoregion (Appendix A).
Coarse-scale climate and weather dataWe considered three categories of climate and
weather variables, computed for each fire:normalized monthly temperature and precipita-tion, soil moisture, and fire weather (AppendixA). We used Rehfeldt’s (2006) thin plate splinemodel and 56-year climate record (1950–2006) tointerpolate monthly minimum, maximum, andaverage temperature, and monthly precipitationfor the approximate central latitude and longi-tude and mean elevation of each of the 1,521fires. To capture the departure from averageconditions at each fire location, we took themonthly values for the year of fire and theprevious year, and normalized them by subtract-ing the 56-year mean for that month and locationand dividing by the standard deviation. Fromnormalized temperature and precipitation, weselected variables that capture both climatedepartures in the month of fire ignition and theprevious month, and antecedent seasonal condi-tions. In the Northwest, we defined antecedentseasons as: spring (March through May), winter(December through February), fall (Septemberthrough November; previous year) and summer(June through August; previous year). In theSouthwest, we shifted seasons later by onemonth (spring ¼ April through June, winter ¼January through March, fall ¼ October throughDecember, summer ¼ July through September)due to earlier warming and shifts in seasonalprecipitation due the North American Monsoon(Sheppard et al. 2002).
We derived soil moisture from a modeled timeseries produced by the surface water monitor(SWM; Wood 2008), a real-time hydrologicsimulation system that incorporates the variableinfiltration capacity (VIC) hydrologic model(Liang et al. 1994). For each fire, we identifiedthe VIC half-degree (latitude and longitude) grid
cell containing the approximate center of the fire,and extracted daily soil moisture values at threedepths (0–10 cm, 10–40 cm, 40–100 cm). At eachof these depths, for the 10-day period startingwith the detection date for each fire, wecalculated both 30-year percentiles (with respectto 1960–1999) and 30-day seasonal percentiles(with respect to the previous 30 days).
We acquired fire weather variables for each firefrom the 32-km2 North American RegionalReanalysis (NARR) dataset (Mesinger et al.2006; Appendix A). For the 10-day periodstarting on the detection date of each fire, wedetermined the maximum and mean values ofthe Fosberg fire weather index (FFWI; Fosberg1978) and wind speed, and the number of dayswith FFWI above the 90th percentile and windspeed above 20 miles per hour.
Prior to modeling, we eliminated variables thatwere highly correlated with others (Spearman’srho . 0.75). From the 36 candidate climate andweather variables, we retained between 22 and26 in each ecoregion (Appendix A).
Influence of topography, climate, and weatheron burn severity: statistical analysis
We used Random Forests (Breiman 2001), anextension of classification and regression trees, toinvestigate the influence of topographic, climatic,and fire weather variables on burn severity, usingthe Random Forest package (Liaw and Wiener2002) for R (R Development Core Team 2010). Asa data-mining algorithm, Random Forest hasseveral advantages over other statistical meth-ods. It has been increasingly advocated in recentyears for ecological questions that require non-parametric techniques and involve complexinteractions between many variables (e.g., Prasadet al. 2006, Cutler et al. 2007, Holden et al. 2009).Random Forest excels at uncovering inherentrelationships and structure in data that may havehierarchical or non-additive variables (Prasad etal. 2006), and is specifically designed to produceaccurate predictions that do not overfit the data(Breiman 2001). Using a binary response variable(RdNBR classified as high severity versus not),we tested our ability to explain whether or notindividual pixels burned as high severity. For allcombinations of our six ecoregions and our threecategories of fire year (all, big, other), weconstructed one set of models using just topo-
v www.esajournals.org 9 December 2011 v Volume 2(12) v Article 130
DILLON ET AL.

graphic predictors and another set with topo-graphic, climatic, and weather predictors. Thisenabled us to measure whether the addition ofcoarse-scale climate and weather data couldimprove our ability to predict the spatial occur-rence of severe fire from topography alone.
Our independent observations were a randomsubset of 2 million pixels (1 million each from theNorthwest and Southwest), from which we drewstratified random samples for each ecoregion.Our target was 24,000 pixels per ecoregion: 3,000pixels in each of eight strata (four potentialvegetation (ESP) groups by two burn severityclasses, all resolved to the pixel level). The actualnumber of pixels ranged from 18,163 to 24,000because some ecoregions include only smallareas of certain ESP groups (Fig. 2). For eachsample pixel, we extracted fine-scale topographicdata (derived in or surrounding that pixel) andcoarse-scale climate and weather data (one valuefor each weather and climate variable across anentire fire), as described above.
To assess the relative influence of individualpredictors on burn severity, we examined vari-able importance rankings from Random Forestmodels. Within each model, Random Forestcalculates variable importance by randomlypermuting the values of each variable, one at atime, and calculating the change in overall modelperformance (mean decrease in accuracy forbinary models) as a result. In each of ourmodeling scenarios (i.e., given combination ofecoregion, fire years, and predictors) we pro-duced stable rankings of predictor variables byrunning 10 replicate Random Forest models withall predictors (each with 2,000 classificationtrees). We used the median of Random Forest’spermutation variable importance measure acrossall 10 replicate models to: (1) assign a finalimportance ranking to each variable; and (2)place variables into 10 importance groups (1 ¼most important variables; 10 ¼ least importantvariables), using k-means clustering based uponimportance values.
In each modeling scenario, we identified theoptimal model (i.e., fewest predictors that couldbest predict the occurrence of severe fire) byrunning a model selection routine that tested theperformance of models with successively fewerpredictor variables, starting with all 10 groups(from k-means clustering) and at each successive
round eliminating the least important group. Weused five replications of five-fold cross-validationat each round of model selection to avoidproblems of overfitting that can occur from usingRandom Forest’s out-of-bag error to comparemodels in this type of iterative performanceassessment (Svetnik et al. 2004). In all cases, weused 2,000 classification trees per model. We thenidentified the optimal model as the one with thesmallest set of predictors that resulted in modelerror within one standard error of the minimum(Breiman et al. 1984, De’ath and Fabricius 2000).Our approach to model selection is similar toother efforts (Diaz-Uriarte and Alvarez deAndres 2006, Murphy et al. 2010), but unique inusing cross-validation and variable groupingsderived from k-means clustering.
To assess the relative performance of ourmodel results, we used three measures ofaccuracy, averaged across the cross-validatedreplicates of the optimal models: overall percent-age correctly classified (PCC), kappa, and areaunder the receiver operating characteristic curve(AUC). Given that our models have a binaryresponse with relatively balanced samples ineach response category (high severity versusnot), we expected PCC and AUC values to rangefrom 0.5 (50% accuracy expected at random) to1.0 (perfect accuracy). We assumed that AUCvalues of .0.7, 0.8, and 0.9 indicate fair, good, orexcellent accuracy, respectively (Swets 1988). Weused kappa values to indicate the degree towhich correct classifications are due to chancealone, with 0.0 being pure chance and 1.0 being aperfect classification (Cohen 1960).
To evaluate the influence of specific variableson burn severity, we generated partial depen-dence plots from our optimal Random Forestmodels. These plots display the relationshipbetween individual predictors and the likelihoodof high severity fire, showing how differentvalues of each predictor affect the response whileholding other variables constant at their average(Cutler et al. 2007).
Did fire extent and severity increasefrom 1984 to 2006?
Given recent increases reported in wildfirearea burned (Littell et al. 2009) and burn severity(Miller et al. 2009b), we tested our MTBS datasetfor trends in area burned, area burned severely,
v www.esajournals.org 10 December 2011 v Volume 2(12) v Article 130
DILLON ET AL.
and proportion of area burned severely. We log-transformed area burned and area burnedseverely to satisfy the normality assumptions ofour statistical tests. We first assessed whethertwo annual measures of severity, area burnedseverely and proportion of area burned severely,were significantly correlated with area burned inyears that had fire (Pearson’s correlation, a ¼0.05). We then tested for significant trends (a ¼0.05) in all three measures over the period ofrecord (1984 to 2006) using the p-value of theslope estimate from a simple linear regression ofeach measure against year. In cases whereresiduals from simple linear models were auto-correlated (Durbin-Watson test, a ¼ 0.05), weused generalized least squares regression in-stead, with a first-order autoregressive movingaverage correlation structure.
RESULTS
Influence of topography, climate, and weatheron burn severity
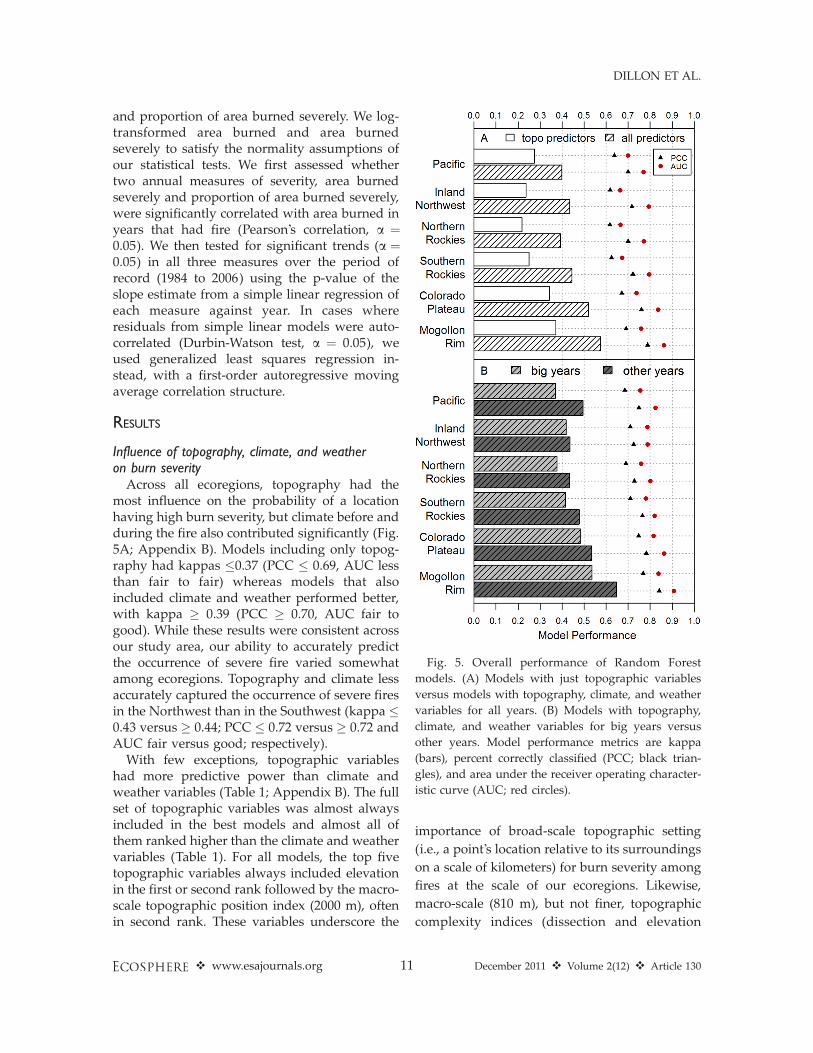
Across all ecoregions, topography had themost influence on the probability of a locationhaving high burn severity, but climate before andduring the fire also contributed significantly (Fig.5A; Appendix B). Models including only topog-raphy had kappas �0.37 (PCC � 0.69, AUC lessthan fair to fair) whereas models that alsoincluded climate and weather performed better,with kappa � 0.39 (PCC � 0.70, AUC fair togood). While these results were consistent acrossour study area, our ability to accurately predictthe occurrence of severe fire varied somewhatamong ecoregions. Topography and climate lessaccurately captured the occurrence of severe firesin the Northwest than in the Southwest (kappa �0.43 versus � 0.44; PCC � 0.72 versus � 0.72 andAUC fair versus good; respectively).
With few exceptions, topographic variableshad more predictive power than climate andweather variables (Table 1; Appendix B). The fullset of topographic variables was almost alwaysincluded in the best models and almost all ofthem ranked higher than the climate and weathervariables (Table 1). For all models, the top fivetopographic variables always included elevationin the first or second rank followed by the macro-scale topographic position index (2000 m), oftenin second rank. These variables underscore the
importance of broad-scale topographic setting
(i.e., a point’s location relative to its surroundings
on a scale of kilometers) for burn severity among
fires at the scale of our ecoregions. Likewise,
macro-scale (810 m), but not finer, topographic
complexity indices (dissection and elevation
Fig. 5. Overall performance of Random Forest
models. (A) Models with just topographic variables
versus models with topography, climate, and weather
variables for all years. (B) Models with topography,
climate, and weather variables for big years versus
other years. Model performance metrics are kappa
(bars), percent correctly classified (PCC; black trian-
gles), and area under the receiver operating character-
istic curve (AUC; red circles).
v www.esajournals.org 11 December 2011 v Volume 2(12) v Article 130
DILLON ET AL.
relief ratio) were among the top five variables inall but the models from the Inland Northwestand the Northern Rockies. Pixel-scale slope andaspect variables were also included in the topfive variables in all models, indicating animportant influence of finer-scale topography aswell. Climate variables were included in all of thebest models, and always included conditionsboth before and during fires. However, two fireweather variables (wind speed and FFWI) wererarely important, and were included only inmodels for the Inland Northwest and NorthernRockies. Antecedent temperature and precipita-tion variables were included in the best modelsfor all ecoregions. The models for every ecor-egion also included event-proximal climate var-iables, but the specific variables selected variedamong regions.
We were better able to predict burn severityduring years other than big years across allecoregions (Fig. 5B). Models using topography,climate, and weather variables had kappas �0.44(PCC � 0.72, AUC generally good to excellent)for other years, compared to kappas �0.37 (PCC� 0.68, AUC fair to good) for big years. However,this difference was greater in some ecoregions(Pacific and Mogollon Rim), consistent with thelarge difference in area burned during otherversus big years in these ecoregions compared tothe other ecoregions (Fig. 4). Overall, the
importance of individual variables was similaramong models constructed for big, other, and allyears, with topographic variables consistentlymore important than climate or weather vari-ables (Table 1; Appendix B).
The specific influence of individual topograph-ic variables on burn severity was fairly consistentamong ecoregions but varied between big yearsversus other years (Fig. 6). With the exception ofthe Inland Northwest ecoregion, the probabilityof severe fire is generally higher across the fullrange of topographic variables in big years thanin other years. In most ecoregions, the highestprobability of severe fire in other years is oftenconstrained to upper elevations, but shifts to-ward lower elevations (and covers a broaderelevation range) in big years. This shift inelevation is strongest in the Mogollon Rim andSouthern Rockies ecoregions, is most subtle inthe Pacific ecoregion, and is reversed in theInland Northwest. Regardless of year, severe fireis generally more likely at sites with low tomoderate heat load (generally northwest throughsoutheast aspects). The influence of heat load,however, is reversed for other years in the Pacificecoregion, where the probability of high severityis greatest on the warmest southwest aspects.
Among ecoregions, the role of climate vari-ables is inconsistent in other years, but we didobserve some consistent patterns in big years
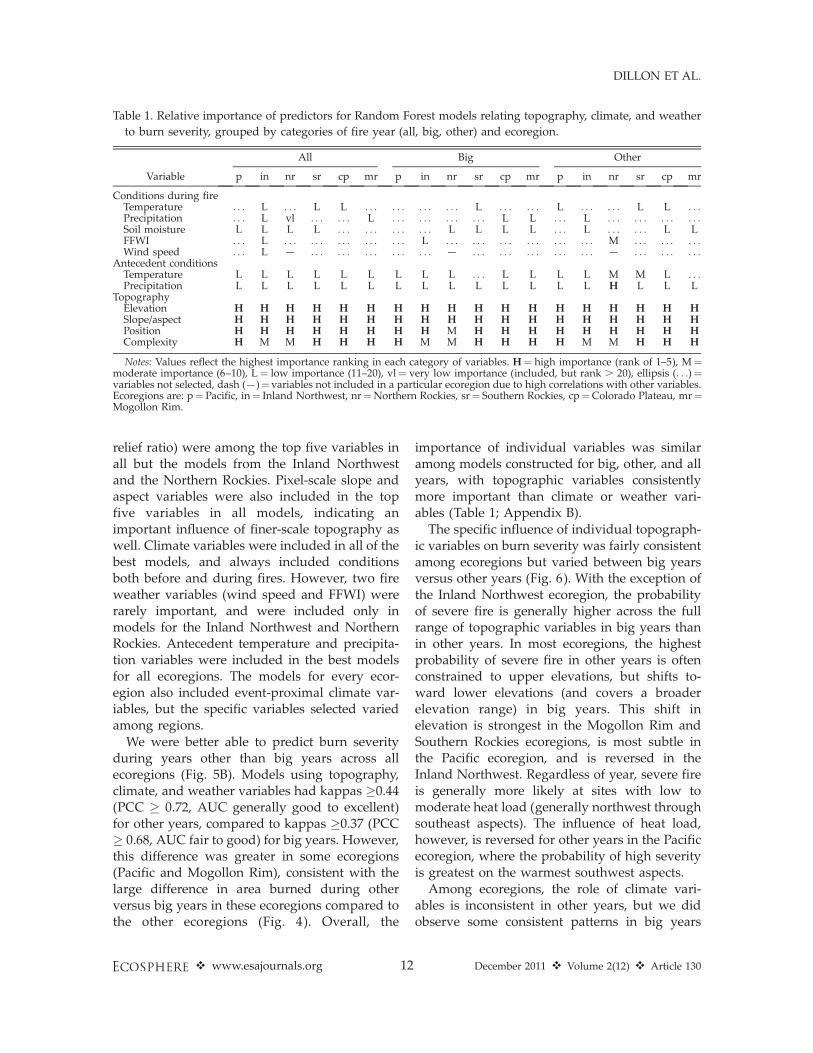
Table 1. Relative importance of predictors for Random Forest models relating topography, climate, and weather
to burn severity, grouped by categories of fire year (all, big, other) and ecoregion.
Variable
All Big Other
p in nr sr cp mr p in nr sr cp mr p in nr sr cp mr
Conditions during fireTemperature . . . L . . . L L . . . . . . . . . . . . L . . . . . . L . . . . . . L L . . .Precipitation . . . L vl . . . . . . L . . . . . . . . . . . . L L . . . L . . . . . . . . . . . .Soil moisture L L L L . . . . . . . . . . . . L L L L . . . L . . . . . . L LFFWI . . . L . . . . . . . . . . . . . . . L . . . . . . . . . . . . . . . . . . M . . . . . . . . .Wind speed . . . L — . . . . . . . . . . . . . . . — . . . . . . . . . . . . . . . — . . . . . . . . .
Antecedent conditionsTemperature L L L L L L L L L . . . L L L L M M L . . .Precipitation L L L L L L L L L L L L L L H L L L
TopographyElevation H H H H H H H H H H H H H H H H H HSlope/aspect H H H H H H H H H H H H H H H H H HPosition H H H H H H H H M H H H H H H H H HComplexity H M M H H H H M M H H H H M M H H H
Notes: Values reflect the highest importance ranking in each category of variables. H¼ high importance (rank of 1–5), M¼moderate importance (6–10), L¼ low importance (11–20), vl¼ very low importance (included, but rank . 20), ellipsis (. . .) ¼variables not selected, dash (—)¼variables not included in a particular ecoregion due to high correlations with other variables.Ecoregions are: p¼ Pacific, in¼ Inland Northwest, nr¼Northern Rockies, sr¼ Southern Rockies, cp¼Colorado Plateau, mr¼Mogollon Rim.
v www.esajournals.org 12 December 2011 v Volume 2(12) v Article 130
DILLON ET AL.

(Fig. 7). In the Mogollon Rim and Southern
Rockies, severe fire is much more likely under
hot and dry conditions, with below normal
precipitation before the fire (previous month or
spring) and higher than normal temperatures just
before or during the fire. We also found higher
Fig. 6. Random Forest partial dependence plots for selected topographic variables. Plots indicate the
dependence of the probability of severe fire on one predictor after holding all other predictors in the model at
their average. Solid lines represent models for widespread (big) fire years, and dotted lines represent models for
other years. See Cutler et al. 2007 for an explanation of the y-axis metric.
v www.esajournals.org 13 December 2011 v Volume 2(12) v Article 130
DILLON ET AL.
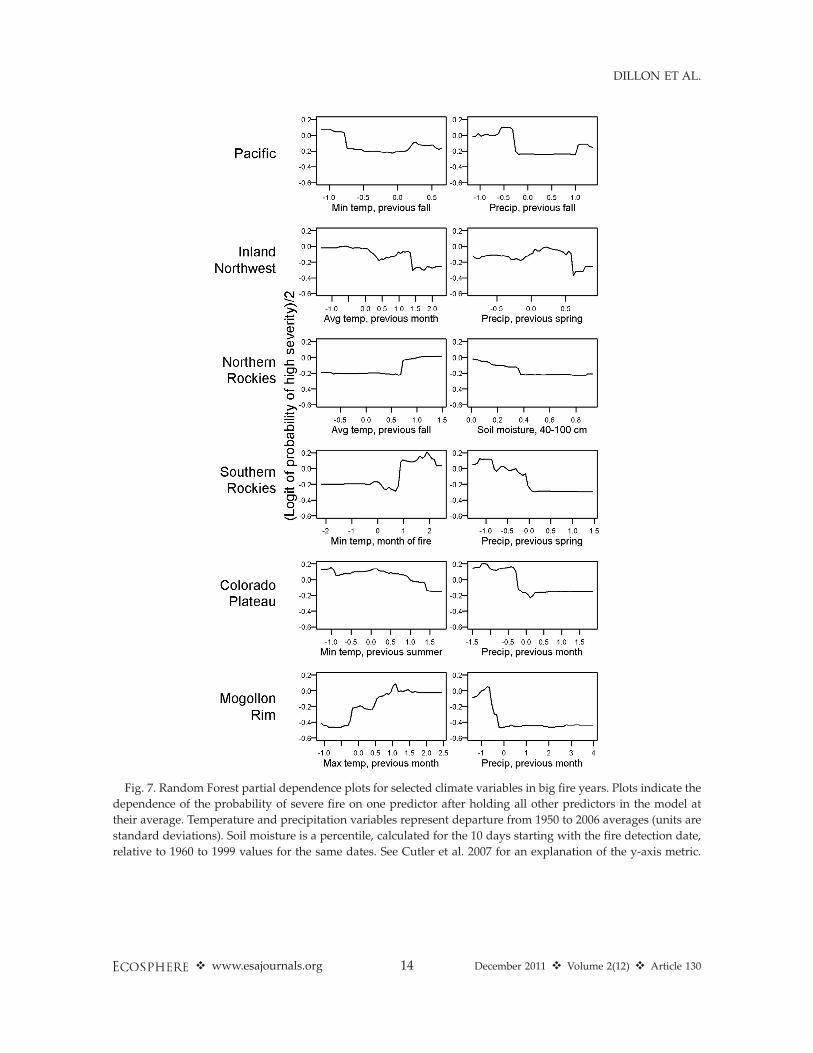
Fig. 7. Random Forest partial dependence plots for selected climate variables in big fire years. Plots indicate the
dependence of the probability of severe fire on one predictor after holding all other predictors in the model at
their average. Temperature and precipitation variables represent departure from 1950 to 2006 averages (units are
standard deviations). Soil moisture is a percentile, calculated for the 10 days starting with the fire detection date,
relative to 1960 to 1999 values for the same dates. See Cutler et al. 2007 for an explanation of the y-axis metric.
v www.esajournals.org 14 December 2011 v Volume 2(12) v Article 130
DILLON ET AL.

probabilities of severe fire related to dry condi-tions in the Colorado Plateau and NorthernRockies, indicated by below normal precipitationin the previous month and deep soil moisturedeficits at the time of fire, respectively. In othercases, antecedent climate may be contributing togrowth of fine and herbaceous fuels. For exam-ple, in the Inland Northwest we found increasedprobability of severe fire with cooler tempera-tures in the previous month and slightly aboveaverage precipitation in the previous spring. Forall variables (topography and climate), relation-ships between individual predictors and burnseverity are generally non-linear and indicatepossible thresholds.
Did fire extent and severity increasefrom 1984 to 2006?
Annual area burned severely is closely relatedto area burned (Fig. 4, top half of panels), whilethe proportion of area burned severely isgenerally more independent of area burned(Fig. 4, bottom half of panels). Annual area
burned and area burned severely were signifi-cantly correlated in all ecoregions, with Pearson’scorrelation ranging from 0.86 to 0.97 (p , 0.001;Table 2). However, we found significant correla-tions between area burned and the proportion ofarea burned severely only in the NorthernRockies (r ¼ 0.45, p ¼ 0.037) and SouthernRockies (r ¼ 0.81, p , 0.001).
Generally, only ecoregions in the Southwestshowed evidence of an increase in annual areaburned and area burned severely, and firestrended toward higher severity (i.e., higherproportion burned severely) in just one of thethree Southwest ecoregions. From 1984 to 2006,the increasing trend in annual area burned andarea burned severely was only significant in theSouthern Rockies, Mogollon Rim, and ColoradoPlateau ecoregions (p � 0.036; Table 2). Theincreasing trend in proportion burned severelywas only significant in the Southern Rockies (p¼0.011). We found no significant temporal trendsin area burned or area burned severely for thethree Northwest ecoregions during this period
Table 2. Results from the analysis of temporal trends in annual fire metrics from selected MTBS fires by ecoregion,
1984–2006.
Parameter
Linear trend Correlation with area burned
Slope p r p
PacificArea burned 0.17 0.206 — —Area high severity 0.19 0.110 0.91 ,0.001Proportion high severity 0.42 0.390 0.28 0.280
Inland NorthwestArea burned 0.11 0.209 — —Area high severity 0.11 0.166 0.97 ,0.001Proportion high severity �0.05 0.906 �0.24 0.278
Northern RockiesArea burned 0.05 0.566 — —Area high severity 0.05 0.582 0.97 ,0.001Proportion high severity 0.04 0.923 0.45 0.037
Southern RockiesArea burned 0.30 0.002 — —Area high severity 0.31 ,0.001 0.96 ,0.001Proportion high severity� 1.14 0.011 0.81 ,0.001
Colorado PlateauArea burned� 0.30 0.036 — —Area high severity� 0.28 0.036 0.86 ,0.001Proportion high severity 0.47 0.444 0.34 0.141
Mogollon RimArea burned 0.21 0.006 — —Area high severity 0.31 ,0.001 0.90 ,0.001Proportion high severity 0.53 0.174 0.39 0.071
Notes: Evidence for linear trend is suggested by the p-value of the slope estimate from linear regressions against year. Weused Pearson’s correlations to test for correlation with annual area burned in years that experienced fire. For the two areametrics, we performed a log transformation prior to statistical tests. Bold typeface indicates significant results at a¼ 0.05.
� These series displayed autocorrelation in the residuals from a simple linear regression (p , 0.05 in Durbin-Watson test),and we used a generalized least squares regression instead, with a first-order autoregressive moving average correlationstructure.
v www.esajournals.org 15 December 2011 v Volume 2(12) v Article 130
DILLON ET AL.

(Table 2). We found very similar results when werepeated these analyses using more conservativenon-parametric methods (Kendall’s tau for cor-relations; Mann-Kendall test for trends; resultsnot shown).
DISCUSSION
Both topography and climate were driversof burn severity
Topographic variables were consistently im-portant in modeling where fires burned severelyfrom 1984 to 2006 in the Northwest andSouthwest United States, despite the greatdiversity in vegetation and land use across theselarge regions. Topography affects the spatialdistribution of fuels at the fine spatial scale atwhich fire interacts with the landscape, and alsoaffects local wind and weather patterns whichare poorly represented in our temporally andspatially coarse weather and climate variables.Climate associated with individual fires, whilesomewhat less important than topography, in-creased the predictive ability of our models in allcases. While our results varied considerablyamong ecoregions, it is remarkable that together,topography and climate variables alone predict-ed the occurrence of high severity fire withoverall accuracies ranging from 68% in the Pacificto 84% in the Mogollon Rim, despite the lack ofdata on fine-scale weather, fuels, and vegetation.Our findings are consistent with Holden et al.(2009), who predicted the occurrence of highseverity fire with 65–74% accuracy on the GilaNational Forest in New Mexico, using onlytopographic indices. While these accuracies aremarginal for predictive modeling with a binaryresponse, they suggest that with better integra-tion of topography, climate, weather, and fuels,there is strong potential for the development ofpredictive burn severity models.
Across ecoregions, the influence of topographyon burn severity seen in our models wasgenerally consistent with our expectations, withsome exceptions. For example, in average yearsin most ecoregions, sites at higher elevations thatsupport cold and mesic forest species have a highprobability of burning severely (Fig. 6), consis-tent with findings from the Southwest UnitedStates (Holden et al. 2009), the Rocky Mountains(Bigler et al. 2005), and the Pacific Northwest
United States (Pickford et al. 1980, Kushla andRipple 1997). Likewise, previous studies havefound high burn severity more on north-facingslopes than south-facing slopes in Southwest andRocky Mountain ecosystems (Bigler et al. 2005,Holden et al. 2009: Fig. 3), and we generallyfound the highest probability of severe fire onsites with cooler aspects as well. The relativelycool and wet environment of upper elevationsand northerly aspects can result in more totalbiomass available to burn than in more openforests and woodlands at lower elevations andwarmer aspects. Although the cooler and wettersites burn less often, when they do burn they aremore likely to experience crown fires, resulting ina higher degree of change. However, there areexceptions. For example, extreme weather condi-tions found in widespread fire years can increasethe probability of high severity fire at lowerelevations in most ecoregions (Fig. 6). Also, in thePacific ecoregion the probability of severe fire issometimes highest on the warmest aspects,consistent with a fire history from the KlamathMountains of California that also found thatsouth- and west-facing slopes historically expe-rienced more severe fires than other aspects(Taylor and Skinner 1998). In relatively mesicenvironments, such as the Pacific ecoregion andNorthern California, productivity can be high onall aspects and fuel is not a limiting factor.Therefore, when all slope aspects are available toburn during the summer droughts characteristicof the Mediterranean climate there, it is likelythat the drier conditions found on warmeraspects can lead to an increased probability ofsevere fire on those sites.
Our models indicate that weather and climateat the time of fire, as well as antecedenttemperature and precipitation, exert some influ-ence on burn severity. Likely, the type of coarse-scale weather and climate variables we analyzedcondition fuels and make them available forburning (i.e., relatively wet conditions that leadto an abundance of fine fuels or relatively warmand dry conditions that decrease fuel moistures).This idea is supported by partial dependenceplots, which isolate the influence of individualclimate variables and indicate non-linear shifts inthe probability of severe fire with weather andclimate (Fig. 7). A good example is the SouthernRockies ecoregion, where the probability for
v www.esajournals.org 16 December 2011 v Volume 2(12) v Article 130
DILLON ET AL.

severe fire is relatively low until the minimumtemperature in the month of fire approaches onestandard deviation above normal. At that point,fuels have presumably become dry enough tocarry fire, and the probability of severe fireincreases and stays high as temperatures in-crease. Similarly, the probability of high severityincreases sharply in all Southwest ecoregionswhen precipitation during the previous month orspring drops below average, consistent with thesuggestion from Holden et al. (2007) that thelikelihood of high severity in the Gila Wilderness,New Mexico increases with longer rain-freeperiods. In our three Northwest ecoregions,where the maritime influence on climate changesfrom west to east, the direct effects of weatherand climate on severity are more variable anddifficult to interpret. Some variables, such asdeep soil moisture in the Northern Rockiesindicate higher probability for severe fire duringperiods of drought, while variables in the InlandNorthwest suggest an association between in-creased severity and relatively cool, moist condi-tions in the months prior to fire, and variables inthe Pacific ecoregion suggest that climatic condi-tions during to the previous fall may influenceseverity.
The non-linear relationships of topographyand climate to burn severity observed in ouranalysis may be due to tipping points. Fortopographic variables, non-linear relationshipsobserved in partial dependence plots may simplyreflect that relatively small changes in topogra-phy can result in sharp transitions betweenecosystems. Alternatively, the non-linear relation-ships may be due to the multi-modal distributionof some topographic variables. For climatevariables, our observation of thresholds is con-sistent with the notion that critical shifts in fuelmoisture conditions can directly influence fireoccurrence and behavior (Holden et al. 2007),evident in climatologically-based fire dangerrating indices used in predicting the probabilityof fire occurrence (Andrews et al. 2003).
Some of the topographic variables in ouranalysis may act as indirect proxies for moredirect, physically-based variables that wouldbetter capture interactions among topography,climate, and weather and their effects on firebehavior and burn severity. For example, thetopographic dissection indices used here have
been related to the location of snow drifts, as wellas patterns of nocturnal air temperatures (e.g.,cold air drainage) and relative humidity in thenorthern Rockies (Holden et al. 2011). Many fine-scale topoclimatic and biophysical variables (e.g.,snowmelt timing, snow drifts, nocturnal airtemperatures, and wind fields) influence fuelmoistures, fire behavior, and fire intensity at finespatial scales in mountainous terrain, but data onthese are not currently available at the resolutionneeded to compare directly with 30-m burnseverity data across broad regions. We attemptedto account for the complex interactions amongterrain, climate and burn severity by combiningclimate and weather variables with topographiccomplexity and position indices in a machinelearning environment. Although specific inter-pretations about mechanistic processes are diffi-cult from this modeling approach, it has someutility in fingerprinting the conditions or situa-tions that yield high severity fire in a givenlocation. Future analyses and development ofpredictive models of burn severity will benefitfrom having physically-based variables related tosoil and fuel moisture prior to and during the fire(Keane et al. 2010). In regions of complextopography, additional data and models will beneeded to capture topographic variation intemperature, humidity and snowmelt timing atthe scale of terrain (Holden and Jolly 2011).Additionally, vegetation type and structure clear-ly influence burn severity (Bigler et al. 2005,Thompson and Spies 2010). Although reconstruc-tion of pre-fire vegetation and fuel conditions iscurrently difficult over the large spatial andtemporal domains assessed here, these could beinferred using remote sensing indices such as thenormalized differenced vegetation index (Rouseet al. 1973). Our ability to forecast the severity offuture fires will likely improve when ouranalyses include climate and weather data ofmuch higher spatial resolution, along withvariables describing pre-fire vegetation condi-tions (e.g., local fuels, vegetation type, and priordisturbances).
Severe fire is more likely,and spatial occurrence is less predictable,in widespread fire years
Our ability to predict whether a pixel burnedseverely was consistently lower during years of
v www.esajournals.org 17 December 2011 v Volume 2(12) v Article 130
DILLON ET AL.

widespread fire, or framed another way, fireburned more indiscriminately in big years.Consistent with that finding, the probability ofsevere fire occurrence in all ecoregions is higheracross a range of topographic conditions duringthose years (Fig. 6). The probability of a locationburning or burning severely, in reality, is condi-tional on many factors including ignition, ante-cedent climate, and weather, interacting withtopography, fuels, and vegetation. Decisionsabout fire management and availability ofsuppression resources also play an importantrole. Based on our results, we speculate that indry years, landscape and topographic controls onfire spread and intensity are diminished, withregional-scale climatic variation overwhelminglocal-scale biophysical and topographic con-straints, as has been reconstructed for the extentof past fires elsewhere (Taylor and Skinner 2003).In relatively cool, wet fire seasons for example,north-facing slopes at high elevation are unlikelyto burn due to delayed snowmelt timing, lowsolar insolation, low vapor pressure deficit, andlow surface air temperatures (Holden and Jolly2011). Thus, until climatic and moisture condi-tions become conducive to fire spread on a largeenough portion of the landscape, as occurs in bigyears, terrain can impose spatial constraints onfire spread and intensity, limiting the influence ofshort term weather and climate factors.
While somewhat intuitive, our finding thattopography exerts strong control on burn sever-ity under moderate climatic conditions hasprofound implications for how we managewildfires in the future. Under current firemanagement practices, suppression tactics areemployed on most fires. As a consequence, mostwildfire area burned occurs during extremeclimatic conditions, likely with higher probabilityof severe fire occurrence. While extensive, severefires are within the range of historical variabilityin cold forest ecosystems, they would haveoccurred less frequently in woodlands and mesicforests with mixed-severity fire regimes, andwere rare in dry forest ecosystems (Schoennagelet al. 2004, Keane et al. 2008). Our results suggestthat if more fires ignited under moderateconditions in ecosystems that historically didnot sustain extensive, severe fires are allowed toburn within topographic constraints, those fireswould have greater potential for serving benefi-
cial ecological roles and potentially reduce theseverity of subsequent fires that could burnunder more extreme conditions (Holden et al.2010, Halofsky et al. 2011, Hurteau and Brooks2011). In years that are not widespread fire years,climatic conditions will be closer to long termaverages (Appendix A), and fires that areallowed to burn during those years will likelybehave in a way consistent with expectationsbased on local vegetation and fire regimes andwithin the historical range of variation. Incontrast, in years of widespread fire, climaticconditions will likely be further from normal andfire behavior and effects will likely be moreuncharacteristic relative to historical regimes inlow-mid elevation forests and woodlands thatdid not historically sustain extensive, severe fires(Fig. 6).
These results also have important implicationsfor resilience of terrestrial and aquatic ecosys-tems. If during the big years, during which mostarea is burned, severely burned areas are notregulated by fine-scale topographic features,disturbance patches may be more continuousand homogeneous than they were historically.Uncharacteristically large severe patches canmore effectively disrupt both terrestrial (Turneret al. 1997) and aquatic systems (Dunham et al.2003) for longer periods of time. If the futurebrings more big fire years, the proportion of areaseverely burned may not increase, but how it isarranged on the landscape may become a criticalecological issue.
Has the extent of severe fire increased inrecent decades, and are fires becomingmore severe?
We found statistically significant increases inthe annual extent of severe fire from 1984 to 2006in only the three Southwest ecoregions, and nonein the Northwest. By definition, more areaburned in the big fire years than in the otheryears, and we observed a corresponding rise inarea burned severely during big years (Pearson’scorrelation 0.86–0.97). In the Southwest ecore-gions, big years were concentrated in the laterportion of our time series, with five out of six bigyears in each ecoregion occurring from 2000 to2006 (Fig. 4). As a result, we see increases inannual area burned severely during our timeperiod for these ecoregions. In the Northwest,
v www.esajournals.org 18 December 2011 v Volume 2(12) v Article 130
DILLON ET AL.

where some big fire years occurred earlier in thetime series, we do not see significant trends. It isimportant to note that these results are specific toour relatively short time series and could bedifferent if data for a longer time period wereavailable.
Only in the Southern Rockies ecoregion did wefind evidence that fires are becoming moresevere. The majority of area burned in thisecoregion was in the dry and mesic forest ESPgroups (Fig. 2) that would have generallyexperienced low-severity and mixed-severity fireregimes historically. Increased fuel loads in someportions of these landscapes due to fire suppres-sion and land use during the 20th century (Keaneet al. 2002, Schoennagel et al. 2004, Keane et al.2008), combined with a shift toward drierclimatic conditions that began in 1998 (Hoerlingand Kumar 2003) could account for increasedburn severity in the Southern Rockies.
Based on the analyses from this study, we canonly speculate on the possible mechanismsbehind our observed trends. The shift towardgenerally increased fire activity since approxi-mately 2000 in the Southwest ecoregions (Fig. 4)appears tied to low-frequency climatologicalchanges (decades to years) related to the ElNino-Southern Oscillation (ENSO) and the Pacif-ic Decadal Oscillation (PDO; Crimmins 2010).Time series of ENSO and PDO indices indicate ashift from positive to negative PDO in 1998,coinciding with a shift from roughly two decadesdominated by higher frequency of El Nino eventsto a period with stronger and more frequent LaNinas (Hoerling and Kumar 2003, Crimmins2010: Fig. 4). Consequently, the entire Southwestregion generally experienced much drier condi-tions after about 1999, which could have contrib-uted to the trends we observed for the Southwestecoregions. Conversely in the Northwest, activefire years have historically been associated with apositive PDO phase, sometimes aligned with ElNino conditions (i.e., years when the Northwest-Southwest precipitation dipole is strongest, withwarm dry conditions in the Northwest and wetconditions in the Southwest; Heyerdahl et al.2008, Morgan et al. 2008). Although thesehistorical fire-climate relationships are somewhatweaker in the Northwest than the Southwest,particularly during the 20th century in someplaces (Hessl et al. 2004), they provide some
explanation for the lack of trends we observed inthe Northwest.
It is difficult to determine whether the annualextent or proportion of severe fire is within thehistorical range of variability for any of ourecoregions. Our data span only 23 years. Fromthis short time series alone, we cannot saywhether the increases in extent and severity thatwe observed in the Southwest exceed historicalpatterns. In the context of longer-term recon-structive studies, however, it appears that ourresults are consistent with others that haveshown increases in annual area burned in theSouthwest in recent decades that are unprece-dented in the last century (Swetnam and Betan-court 1998). Likewise, in open ponderosa pineforests in the Southern Rockies, where severe firewas historically limited by fuel availability, theincrease we observed in proportion of severe firelikely represents a departure from historical fireregimes (Schoennagel et al. 2004). In forests witha historically mixed-severity fire regime (e.g.,Douglas-fir), however, the occurrence of highseverity fire may be within the historical range ofvariability, but the extent of high severity patchesmay not be (Schoennagel et al. 2004, Schoennagelet al. 2011). In the Northwest, the fact that wefound no apparent increases in extent or propor-tion of severe fire corroborates previous workdemonstrating that fire dynamics from recentdecades are within historical ranges there (Keaneet al. 2008, Morgan et al. 2008).
Scope and limitationsInferring burn severity from remotely sensed
data is appealing because we can compare manyfires over multiple vegetation types and regions,each with a range of land use and history.However, there are some important limitationsto our study. First, there is great variation in thetiming of the satellite imagery from which burnseverity was estimated. We imposed somewhatbroad constraints on timing of imagery to ensurethat pre- and post-fire images were comparedthat were one year apart (6–18 months) andwhen vegetation was in the same phenologicalcondition pre- and post-fire (660 days). Theseconstraints resulted in the elimination of 253 fires(502,095 ha) from our analysis. We could haveused tighter constraints, but this would haveresulted in still fewer fires to analyze. Second, in
v www.esajournals.org 19 December 2011 v Volume 2(12) v Article 130
DILLON ET AL.

some ecoregions, most of the area burned in justa few individual fires that may have exerted astrong influence on our results. For example, the2002 Biscuit fire in Oregon accounted for;147,000 ha, or 38% of burned area in the Pacificecoregion. Likewise, the greater Yellowstone firesof 1988 burned ;660,000 ha (25% of area burnedin the Northern Rockies), the 2002 Rodeo-Chedeski fire in Arizona burned ;172,500 ha(21% of area burned in the Mogollon Rim), andthe 2002 Hayman Fire in Colorado burned;53,500 ha (16% of area burned in the SouthernRockies). Excluding these large single fire eventswould have greatly decreased the pixels avail-able for our analysis. Third, we do not know theaccuracy of the burn severity classification acrossall events. The thresholds we used for definingsevere fires are based on geographically limitedfield data. Further field testing and assessment ofthe value of RdNBR as an indicator of ecologicalchange is needed. Hudak et al. (2007) found thatdNBR and post-fire NBR were reasonable metricsof burn severity when using data on vegetationand soil effects immediately and one year post-fire in eight different large fires from Montana,California, and Alaska. More such studies areneeded for longer-term assessment of fire effects.Keeley et al. (2008) found that RdNBR accuracy islimited in shrublands where resprouting occurs,but RdNBR has been tested successfully inforests, woodlands, and sagebrush shrublandsin California (Miller and Thode 2007, Miller et al.2009a) and sagebrush steppe in Idaho (Norton etal. 2009). Fourth, it is possible that the consis-tently higher performance of topographic vari-ables in the Random Forest models is an artifactof the difference in spatial scale. Topographicvariables were at the same spatial resolution (30-m) as the fire data, while the climatic variableswere coarser. Also, by not including maps ofactual vegetation type, structure, and fuels weignore many landscape factors (e.g., previousfires, thinning, timber harvest, and insect-in-duced tree mortality) that would likely influencesatellite-inferred burn severity. Not accountingfor these variables likely contributed additionalnoise to our data. It is possible that some areasburned severely in part because they haveexperienced few fires in recent decades, orbecause prior and existing land uses affect thelikelihood that they burn, somewhat obscuring
the influence of the particular topographic andclimate conditions under which those firesburned. Finally, many of these fires representthose that escaped initial suppression efforts.Thousands more were successfully stoppedbefore reaching mapable size. We may neverknow how spatial burn severity patterns of thosefires, potentially burning under more moderateclimatic conditions would have differed fromthose fires that did burn.
Implications for future researchWe expected and found that the influences of
climate and topography on burn severity differedfrom their influences on fire occurrence andextent. This is consistent with our hypothesisthat while climate strongly influences areaburned, topography, vegetation, land use, andother local conditions are relatively more impor-tant than climate in determining how fires burn.
The effects of warming climate and lengthen-ing fire seasons are likely to increase the numberof large fires (Westerling et al. 2006). Conse-quently, the area burned severely could increase,with potentially great but not well understoodecological consequences for severity of subse-quent fires, vegetation structure and composi-tion, carbon, acquatic ecosystems, and otherecosystem services. Until we develop an under-standing of the relative influence of topography,climate, vegetation, fuels and land use on fireextent and burn severity, our response to theselarge fires will be driven by the perception offires as largely detrimental. Understanding therole of topography will be particularly important.To the extent that topography directly influencesburn severity, burn severity will be relativelystable even as climate changes. In so far astopography is acting indirectly by shaping fuelsand vegetation productivity, our managementactions will have potential to alter the way firesburn across the landscape (Wimberly et al. 2009,Hudak et al. 2011), perhaps moreso in someenvironments than others (Schoennagel et al.2004).
Our study is one of many recent efforts usingsatellite-derived data to address questions aboutburn severity (e.g., Holden et al. 2009, Wimberlyet al. 2009; Miller et al., in press). Although fireoccurrence, synchrony, and extent have beenrelated to climate at regional and sub-continental
v www.esajournals.org 20 December 2011 v Volume 2(12) v Article 130
DILLON ET AL.
scales (Kitzberger et al. 2007, Littell et al. 2009,Littell et al. 2010), relatively few studies havefocused on burn severity at these scales (but seeMiller et al. 2009a). Moving forward, studies suchas ours that include information on pre-fire fuelsand vegetation, as well as finer-scale climate andweather, will be important. Analyses for partic-ular vegetation types and/or elevation rangesmay also be useful, as both recent trends anddrivers of burn severity may differ amongecosystems (Miller et al. 2009b), just as driversof fire occurrence differ with vegetation type(Littell et al. 2009). Further, future investigationsof burn severity across broad spatial andtemporal scales may be improved by evaluatingshifts in the statistical distribution of continuousRdNBR and dNBR values, rather than assessingseverity as a binary or ordinal phenomenon(Holden et al. 2010, Lutz et al. 2011). Compara-tive studies among regions are needed, as arelocal case studies that help advance understand-ing of the ways that climate, topography, landuse, vegetation and prior disturbance interact toinfluence ecological effects of fire.
ACKNOWLEDGMENTS
This research was supported in part by fundsprovided by the Rocky Mountain Research Station,Forest Service, U.S. Department of Agriculture,through Research Joint Venture Agreement 06-JV-11221648-191, and by the Joint Fire Science Program(Project 09-1-07-4). We appreciate the assistance ofJennifer Lecker and others at the USDA Forest ServiceRemote Sensing Applications Center with MTBS data,Eric Gdula at Grand Canyon National Park with fielddata, and Andy Wood at the NOAA-NWS ColoradoBasin River Forecast Center with soil moisture data.We appreciate the statistical advice of David Affleck atthe University of Montana and L. Scott Baggett at theUSDA Forest Service Rocky Mountain ResearchStation. Andrew Hudak, Bob Keane, and two anony-mous reviewers provided useful comments.
LITERATURE CITED
Andrews, P. L., D. O. Loftsgaarden, and L. S.Bradshaw. 2003. Evaluation of fire danger ratingindexes using logistic regression and percentileanalysis. International Journal of Wildland Fire12:213–226.
Barbour, M. G., J. H. Burk, W. D. Pitts, F. S. Gillam, andM. W. Schwartz. 1999. Terrestrial plant ecology.Third edition. Adison Wesley Longman, New York,
New York, USA.Bessie, W. C. and E. A. Johnson. 1995. The relative
importance of fuels and weather on fire behavior insubalpine forests. Ecology 76:747–762.
Bigler, C., D. Kulakowski, and T. T. Veblen. 2005.Multiple disturbance interactions and droughtinfluence fire severity in Rocky Mountain subal-pine forests. Ecology 86:3018–3029.
Bisson, P. A., B. E. Rieman, C. Luce, P. F. Hessburg,D. C. Lee, J. L. Kershner, G. H. Reeves, and R. E.Gresswell. 2003. Fire and aquatic ecosystems of thewestern USA: current knowledge and key ques-tions. Forest Ecology and Management 178:213–229.
Bond, W. J. and J. E. Keeley. 2005. Fire as a global‘herbivore’: the ecology and evolution of flamma-ble ecosystems. Trends in Ecology and Evolution20:387–394.
Bradstock, R., K. Hammill, L. Collins, and O. Price.2010. Effects of weather, fuel and terrain on fireseverity in topographically diverse landscapes ofsouth-eastern Australia. Landscape Ecology25:607–619.
Breiman, L. 2001. Random forests. Machine Learning45:5–32.
Breiman, L., J. Freidman, R. Olshen, and C. Stone.1984. Classification and regression trees. Wads-worth, Belmont, California, USA.
Broncano, M. and J. Retana. 2004. Topography andforest composition affecting the variability in fireseverity and post-fire regeneration occurring after alarge fire in the Mediterranean basin. InternationalJournal of Wildland Fire 13:209–216.
Cannon, S. H., J. E. Gartner, M. G. Rupert, J. A.Michael, A. H. Rea, and C. Parrett. 2010. Predictingthe probability and volume of postwildfire debrisflows in the intermountain western United States.Geological Society of America Bulletin 122:127–144.
Cansler, C. A. 2011. Drivers of burn severity in thenorthern Cascade Range, Washington, USA. The-sis. University of Washington, Seattle, Washington,USA.
CEC. 2007. Ecological regions of North America:toward a common perspective. Commission forEnvironmental Cooperation, Montreal, Quebec,Canada.
Certini, G. 2005. Effects of fire on properties of forestsoils: a review. Oecologia 143:1–10.
Chafer, C., M. Noonan, and E. Macnaught. 2004. Thepost-fire measurement of fire severity and intensityin the Christmas 2001 Sydney wildfires. Interna-tional Journal of Wildland Fire 13:227–240.
Cohen, J. 1960. A coefficient of agreement for nominalscales. Educational and Psychological Measure-ment 20:37–46.
Crimmins, M. A. 2006. A synoptic climatologicalanalysis of extreme fire weather conditions across
v www.esajournals.org 21 December 2011 v Volume 2(12) v Article 130
DILLON ET AL.

the Southwest United States. International Journalof Climatology 26:1001–1016.
Crimmins, M. A. 2010. Interannual to decadal changesin extreme fire weather event frequencies across thesouthwestern United States. International Journalof Climatology 31:1573–1583.
Cutler, D. R., T. C. Edwards, K. H. Beard, A. Cutler,K. T. Hess, J. Gibson, and J. J. Lawler. 2007.Random forests for classification in ecology. Ecol-ogy 88:2783–2792.
De’ath, G. and K. E. Fabricius. 2000. Classification andregression trees: a powerful yet simple techniquefor ecological data analysis. Ecology 81:3178–3192.
Diaz-Uriarte, R. and S. Alvarez de Andres. 2006. Geneselection and classification of microarray datausing random forest. BMC Bioinformatics 7:3.
Dillon, G., P. Morgan, and Z. A. Holden. 2011.Mapping the potential for high severity wildfirein the western United States. Fire ManagementToday 71(2):25–28.
Dunham, J. B., M. K. Young, R. E. Gresswell, and B. E.Rieman. 2003. Effects of fire on fish populations:landscape perspectives on persistence of nativefishes and nonnative fish invasions. Forest Ecologyand Management 178:183–196.
Eidenshink, J., B. Schwind, K. Brewer, Z. Zhu, B.Quayle, and S. Howard. 2007. A project formonitoring trends in burn severity. Fire Ecology3:3–21.
Evans, I. S. 1972. General geomorphometry, derivativesof altitude, and descriptive statistics. Pages 17–90 inR. J. Chorley, editor. Spatial analysis in geomor-phology. Harper & Row, New York, New York,USA.
Fosberg, M. A. 1978. Weather in wildland firemanagement: The fire weather index. Conferenceon Sierra Nevada Meteorology. American Meteo-rological Society, Lake Tahoe, California, USA.
Gesch, D. B. 2007. The national elevation dataset. Pages99–118 in D. Maune, editor. Digital elevationalmodel technologies and applications: The DEMusers manual. Second edition. American Society ofPhotogrammetry and Remote Sensing, Bethesda,Maryland, USA.
Goodrick, S. L. 2002. Modification of the Fosberg fireweather index to include drought. InternationalJournal of Wildland Fire 11:205–211.
Hall, B. L. and T. J. Brown. 2007. Comparison ofweather data from the Remote Automated WeatherStation network and the North American RegionalReanalysis. 14th Symposium on MeteorologicalObservation and Instrumentation. American Mete-orological Society, San Antonio, Texas, USA.
Halofsky, J. E. et al. 2011. Mixed-severity fire regimes:lessons and hypotheses from the Klamath-SiskiyouEcoregion. Ecosphere 2:art40.
Hessl, A. E., D. McKenzie, and R. Schellhaas. 2004.
Drought and Pacific Decadal Oscillation linked tofire occurrence in the Inland Pacific Northwest.Ecological Applications 14:425–442.
Heyerdahl, E. K., D. McKenzie, L. D. Daniels, A. E.Hessl, J. S. Littell, and N. J. Mantua. 2008. Climatedrivers of regionally synchronous fires in theinland Northwest (1651-1900). International Jour-nal of Wildland Fire 17:40–49.
Hoerling, M. and A. Kumar. 2003. The perfect oceanfor drought. Science 299:691–694.
Holden, Z. A., M. A. Crimmins, S. A. Cushman, andJ. S. Littell. 2011. Empirical modeling of spatial andtemporal variation in warm season nocturnal airtemperatures in two North Idaho mountain ranges,USA. Agricultural and Forest Meteorology151:261–269.
Holden, Z. A. and W. M. Jolly. 2011. Modelingtopographic influences on fuel moisture and firedanger in complex terrain to improve wildland firemanagement decision support. Forest Ecology andManagement [doi: 10.1016/j.foreco.2011.08.002]
Holden, Z. A., C. Luce, M. Crimmins, and P. Morgan.In press. Wildfire extent and severity correlatedwith annual streamflow distribution and timing inthe Pacific Northwest, USA (1984-2005). Ecohy-drology [doi: 10.1002/eco.257]
Holden, Z. A., P. Morgan, M. A. Crimmins, R. K.Steinhorst, and A. M. S. Smith. 2007. Fire seasonprecipitation variability influences fire extent andseverity in a large southwestern wilderness area,United States. Geophysical Research Letters34:L16708.
Holden, Z. A., P. Morgan, and J. S. Evans. 2009. Apredictive model of burn severity based on 20-yearsatellite-inferred burn severity data in a largesouthwestern US wilderness area. Forest Ecologyand Management 258:2399–2406.
Holden, Z. A., P. Morgan, and A. T. Hudak. 2010. Burnseverity of areas reburned by wildfires in the GilaNational Forest, New Mexico, USA. Fire Ecology6:77–85.
Holden, Z. A., P. Morgan, M. G. Rollins, and R. G.Wright. 2006. Ponderosa pine snag densities fol-lowing multiple fires in the Gila Wilderness, NewMexico. Forest Ecology and Management 221:140–146.
Hudak, A. T., P. Morgan, M. J. Bobbitt, A. M. S. Smith,S. A. Lewis, L. B. Lentile, P. R. Robichaud, J. T.Clark, and R. A. McKinley. 2007. The relationshipof multispectral satellite imagery to immediate fireeffects. Fire Ecology 3(1):64–90.
Hudak, A. T., I. Rickert, P. Morgan, E. Strand, S. A.Lewis, P. R. Robichaud, C. Hoffman, and Z. A.Holden. 2011. Review of fuel treatment effective-ness in forests and rangelands and a case studyfrom the 2007 megafires in central Idaho, USA.General Technical Report RMRS-GTR-252. USDA
v www.esajournals.org 22 December 2011 v Volume 2(12) v Article 130
DILLON ET AL.
Forest Service, Rocky Mountain Research Station,Fort Collins, Colorado, USA.
Hurteau, M. D. and M. L. Brooks. 2011. Short- andlong-term effects of fire on carbon in US drytemperate forest systems. BioScience 61:139–146.
Istanbulluoglu, E., D. G. Tarboton, R. T. Pack, and C.Luce. 2002. A probabilistic approach for channelinitiation. Water Resouces Research 38:1325.
Keane, R. E., J. Agee, P. Fule, J. E. Keeley, C. Key, S.Kitchen, R. Miller, and L. Schulte. 2008. Ecologicaleffects of large fires on US landscapes: benefit orcatastrophe? International Journal of Wildland Fire17:696–712.
Keane, R. E., S. A. Drury, E. C. Karau, P. F. Hessburg,and K. M. Reynolds. 2010. A method for mappingfire hazard and risk across multiple scales and itsapplication in fire management. Ecological Model-ling 221:2–18.
Keane, R. E., K. C. Ryan, T. T. Veblen, C. D. Allen, J.Logan, and B. Hawkes. 2002. Cascading effects offire exclusion in Rocky Mountain ecosystems: Aliterature review. General Technical Report RMRS-GTR-91. USDA Forest Service, Rocky MountainResearch Station, Fort Collins, Colorado, USA.
Keeley, J. E. 2009. Fire intensity, fire severity and burnseverity: a brief review and suggested usage.International Journal of Wildland Fire 18:116–126.
Keeley, J. E., T. Brennan, and A. H. Pfaff. 2008. Fireseverity and ecosystem responses following crownfires in California shrublands. Ecological Applica-tions 18:1530–1546.
Key, C. H. and N. C. Benson. 2006. Landscapeassessment: sampling and analysis methods. InD. C. Lutes, R. E. Keane, J. F. Caratti, C. H. Key,N. C. Benson, S. Sutherland, and L. J. Gangi,editors. FIREMON: Fire Effects Monitoring andInventory System. General Technical ReportRMRS-GTR-164-CD. USDA Forest Service, RockyMountain Research Station, Fort Collins, Colorado,USA.
Kitzberger, T., P. M. Brown, E. K. Heyerdahl, T. W.Swetnam, and T. T. Veblen. 2007. ContingentPacific-Atlantic Ocean influence on multicenturywildfire synchrony over western North America.Proceedings of the National Academy of Sciences104:543–548.
Kushla, J. D. and W. J. Ripple. 1997. The role of terrainin a fire mosaic of a temperate coniferous forest.Forest Ecology and Management 95:97–107.
Lentile, L. B., Z. A. Holden, A. M. S. Smith, M. J.Falkowski, A. T. Hudak, P. Morgan, S. A. Lewis,P. E. Gessler, and N. C. Benson. 2006. Remotesensing techniques to assess active fire characteris-tics and post-fire effects. International Journal ofWildland Fire 15:319–345.
Lentile, L. B., P. Morgan, A. T. Hudak, M. J. Bobbitt,S. A. Lewis, A. M. S. Smith, and P. R. Robichaud.
2007. Post-fire burn severity and vegetation re-sponse following eight large wildfires across thewestern United States. Fire Ecology 3(1):91–101.
Liang, X., D. P. Lettenmaier, E. F. Wood, and S. J.Burges. 1994. A simple hydrologically based modelof land surface water and energy fluxes for generalcirculation models. Journal of Geophysical Re-search 99:14415–14428.
Liaw, A. and M. Wiener. 2002. Classification andregression by random forest. R News: the News-letter of the R Project 2(3):18–22.
Littell, J., E. Oneil, D. McKenzie, J. Hicke, J. Lutz, R.Norheim, and M. Elsner. 2010. Forest ecosystems,disturbance, and climatic change in WashingtonState, USA. Climatic Change 102:129–158.
Littell, J. S., D. McKenzie, D. L. Peterson, and A. L.Westerling. 2009. Climate and wildfire area burnedin western U.S. ecoprovinces, 1916-2003. EcologicalApplications 19:1003–1021.
Lutz, J. A., C. H. Key, C. A. Kolden, J. T. Kane, and J. W.van Wagtendonk. 2011. Fire frequency, areaburned, and severity: a quantitative approach todefining a normal fire year. Fire Ecology 7:51–65.
McCune, B. and D. Keon. 2002. Equations for potentialannual direct incident radiation and heat load.Journal of Vegetation Science 13:603–606.
Mesinger, F. et al. 2006. North American regionalreanalysis. Bulletin of the American MeteorologicalSociety 87:343–360.
Miller, D., C. Luce, and L. Benda. 2003. Time, space,and episodicity of physical disturbance in streams.Forest Ecology and Management 178:121–140.
Miller, J. D., E. E. Knapp, C. H. Key, C. N. Skinner, C. J.Isbell, R. M. Creasy, and J. W. Sherlock. 2009a.Calibration and validation of the relative differ-enced Normalized Burn Ratio (RdNBR) to threemeasures of fire severity in the Sierra Nevada andKlamath Mountains, California, USA. RemoteSensing of Environment 113:645–656.
Miller, J., H. Safford, M. Crimmins, and A. Thode.2009b. Quantitative evidence for increasing forestfire severity in the Sierra Nevada and SouthernCascade Mountains, California and Nevada, USA.Ecosystems 12:16–32.
Miller, J., C. Skinner, H. Safford, E. Knapp, and C.Ramirez. In press. Trends and causes of severity,size, and number of fires in northwestern Califor-nia, USA. Ecological Applications [doi: 10.1890/10-2108.1]
Miller, J. D. and A. E. Thode. 2007. Quantifying burnseverity in a heterogeneous landscape with arelative version of the delta normalized burn ratio(dNBR). Remote Sensing of Environment 109:66–80.
Moore, I. D., P. Gessler, G. A. Nielsen, and G. A.Peterson. 1993. Terrain attributes: estimation meth-ods and scale effects. Pages 189–214 in A. J.
v www.esajournals.org 23 December 2011 v Volume 2(12) v Article 130
DILLON ET AL.

Jakeman, M. B. Beck, and M. McAleer, editors.Modeling change in environmental systems. Wiley,London, UK.
Morgan, P., C. C. Hardy, T. W. Swetnam, M. G. Rollins,and D. G. Long. 2001. Mapping fire regimes acrosstime and space: Understanding coarse and fine-scale fire patterns. International Journal of Wild-land Fire 10:329–342.
Morgan, P., E. K. Heyerdahl, and C. E. Gibson. 2008.Multi-season climate synchronized forest firesthroughout the 20th century, Northern Rockies,USA. Ecology 89:717–728.
Murphy, M. A., J. S. Evans, and A. Storfer. 2010.Quantifying Bufo boreas connectivity in YellowstoneNational Park with landscape genetics. Ecology91:252–261.
Norton, J., N. Glenn, M. Germino, K. Weber, and S.Seefeldt. 2009. Relative suitability of indices de-rived from Landsat ETMþ and SPOT 5 fordetecting fire severity in sagebrush steppe. Inter-national Journal of Applied Earth Observation andGeoinformation 11:360–367.
NWCG [National Wildfire Coordinating Group]. 2009.Quadrennial fire review. National Association ofState Foresters, Washington, D.C., USA.
Odion, D. C., E. J. Frost, J. R. Strittholt, H. Jiang, D. A.Dellasala, and M. A. Moritz. 2004. Patterns of fireseverity and forest conditions in the westernKlamath Mountains, California. Conservation Biol-ogy 18:927–936.
Pabst, K. L. 2010. Quantifying burn severity in aheterogeneous landscape: a comparison of thedifferenced normalized burn ratio and the relativedifferenced normalized burn ratio in the GrandCanyon National Park, Arizona. Thesis. SouthDakota State University, Brookings, South Dakota,USA.
Parsons, A., P. R. Robichaud, S. A. Lewis, C. Napper,and J. T. Clark. 2010. Field guide for mapping post-fire soil burn severity. General Technical ReportRMRS-GTR-243. USDA Forest Service, RockyMountain Research Station, Fort Collins, Colorado,USA.
Pickford, S. G., G. R. Fahnestock, and R. Ottmar. 1980.Weather, fuel, and lightening fires in OlympicNational Park. Northwest Science 54:92–105.
Pierce, J. and G. Meyer. 2008. Long-term fire historyfrom alluvial fan sediments: the role of droughtand climate variability, and implications for man-agement of Rocky Mountain forests. InternationalJournal of Wildland Fire 17:84–95.
Pike, R. J. and S. E. Wilson. 1971. Elevation relief ratio,hypsometric integral and geomorphic area altitudeanalysis. Bulletin of the Geological Society ofAmerica 82:1079–1084.
Prasad, A., L. Iverson, and A. Liaw. 2006. Newerclassification and regression tree techniques: bag-
ging and random forests for ecological prediction.Ecosystems 9:181–199.
Pyne, S. J., P. L. Andrews, and R. D. Laven. 1996.Introduction to wildland fire. Second edition. JohnWiley & Sons, New York, New York, USA.
R Development Core Team. 2010. R: A language andenvironment for statistical computing. R Founda-tion for Statistical Computing, Vienna, Austria.
Rehfeldt, G. E. 2006. A spline model of climate for thewestern United States. General Technical ReportRMRS-GTR-165. USDA Forest Service, RockyMountain Research Station, Fort Collins, Colorado,USA.
Roberts, D. W. and S. V. Cooper. 1989. Concepts andtechniques of vegetation mapping. Pages 90–96 inP. Ferguson, P. Morgan, and F. D. Johnson, editors.Land classifications based on vegetation: applica-tions for resource management. General TechnicalReport INT-GTR-257. USDA Forest Service, Inter-mountain Research Station, Ogden, Utah, USA.
Robichaud, P. R., J. W. Wagenbrenner, and R. E.Brown. 2010. Rill erosion in natural and disturbedforests: 1. Measurements. Water Resources Re-search 46:W10506.
Rollins, M. G. 2009. LANDFIRE: a nationally consis-tent vegetation, wildland fire, and fuel assessment.International Journal of Wildland Fire 18:235–249.
Rouse, J. W., R. H. Haas, J. A. Schell, and D. W.Deering. 1973. Monitoring vegetation systems inthe great plains with ERTS. Pages 48–62. inProceedings, Third ERTS Symposium.
Running, S. W. 2006. Climate change: is globalwarming causing more, larger wildfires? Science313:927–928.
Schoennagel, T., R. L. Sherriff, and T. T. Veblen. 2011.Fire history and tree recruitment in the ColoradoFront Range upper montane zone: implications forforest restoration. Ecological Applications 21:2210–2222.
Schoennagel, T., T. T. Veblen, and W. H. Romme. 2004.The interaction of fire, fuels, and climate acrossRocky Mountain forests. BioScience 54:661–676.
Sheppard, P. R., A. C. Comrie, G. D. Packin, K.Angersbach, and M. K. Hughes. 2002. The climateof the US Southwest. Climate Research 21:219–238.
Stage, A. R. 1976. Notes: An expression for the effect ofaspect, slope, and habitat type on tree growth.Forest Science 22:457–460.
Svetnik, V., A. Liaw, C. Tong, and T. Wang. 2004.Application of Breiman’s Random Forest to mod-eling structure-activity relationships of pharmaceu-tical molecules. Pages 334–343 in F. Roli, J. Kittler,and T. Wineatt, editors. Multiple classifier systems.Springer, Berlin, Germany.
Swetnam, T. W. and J. L. Betancourt. 1998. Mesoscaledisturbance and ecological response to decadalclimatic variability in the American Southwest.
v www.esajournals.org 24 December 2011 v Volume 2(12) v Article 130
DILLON ET AL.

Journal of Climate 11:3128–3147.Swets, J. 1988. Measuring the accuracy of diagnostic
systems. Science 240:1285–1293.Taylor, A. H. and C. N. Skinner. 1998. Fire history and
landscape dynamics in a late-successional reserve,Klamath Mountains, California, USA. Forest Ecol-ogy and Management 111:285–301.
Taylor, A. H. and C. N. Skinner. 2003. Spatial patternsand controls on historical fire regimes and foreststructure in the Klamath Mountains. EcologicalApplications 13:704–719.
Thompson, J. and T. Spies. 2010. Factors associatedwith crown damage following recurring mixed-severity wildfires and post-fire management insouthwestern Oregon. Landscape Ecology 25:775–789.
Turner, M. G., W. H. Romme, R. H. Gardner, and W. W.Hargrove. 1997. Effects of fire size and pattern onearly succession in Yellowstone National Park.
Ecological Monographs 67:411–433.Weiss, A. 2001. Topographic position and landform
analysis. Poster presentation, ESRI User Confer-ence, San Diego, California, USA.
Westerling, A. L., H. G. Hidalgo, D. R. Cayan, andT. W. Swetnam. 2006. Warming and earlier springincrease western US forest wildfire activity. Science313:940–943.
Whittaker, R. H. 1970. Communities and ecosystems.Macmillan, New York, New York, USA.
Wimberly, M. C., M. A. Cochrane, A. D. Baer, and K.Pabst. 2009. Assessing fuel treatment effectivenessusing satellite imagery and spatial statistics. Eco-logical Applications 19:1377–1384.
Wood, A. W. 2008. The University of Washingtonsurface water monitor: An experimental platformfor national hydrologic assessment and prediction.In Proceedings of the AMS 22nd Conference onHydrology, New Orleans, Louisiana, USA.
SUPPLEMENTAL MATERIAL
APPENDIX A
DETAILS REGARDING INPUTS TO THE ANALYSIS
The four potential vegetation (ESP) groups weused to identify forest and woodland sites forthis study include numerous LANDFIRE ESPmap units. A complete listing of the specific ESPunits within each group, and their total areawithin burned areas, is provided for the North-west (Table A1) and Southwest (Table A2).
For Random Forest modeling, we considered atotal of 16 topographic variables and 36 climateand weather variables as predictors. Prior torunning Random Forest models, we evaluatedthe correlation between individual variables ineach ecoregion, to eliminate redundancy. Weprovide complete lists of all candidate topo-graphic variables (Table A3), and climate andweather variables (Table A4), with details aboutwhich ones were retained for modeling in eachecoregion and source information for specificdatasets.
In designating years as widespread (big) fireyears, we evaluated monthly normalized tem-perature and precipitation data. Within eachcategory of years, we averaged the monthlynormalized values of minimum temperature,maximum temperature, and precipitation forthe year of fire and the preceding year (Fig. A1).
Fire weather variables including daily maxi-
mum windspeed, minimum relative humidity(RH) and the maximum temperature were ex-tracted from the North American Regional Re-analysis (NARR) data. The NARR is long-term,internally consistent data produced through theassimilation of observational and modeled climatedata to a gridded domain (32-km2 grid resolution)at three hourly timesteps (Mesinger et al. 2006).Hall and Brown (2007) compared NARR data toobservations collected by Remote AutomatedWeather Stations (RAWS) across the westernUnited States and found that most meteorologicalvariables were well correlated, suggesting thatNARR data could be useful in wildfire researchand management applications.
We used NARR data to evaluate wildfire eventweather conditions by extracting time series fromthe grid cell that matched the initial location andstart date for each fire as specified in the MTBSdata. Fire weather conditions were evaluatedwithin a 10-day window from the initial firediscovery date consistent with our assumputionthat extreme conditions were occuring at somepoint during this period. Westerling et al. (2006)reported that the average time between thediscovery and control of large wildfire eventsacross the western United States was 37.1 daysduring the period of 1987 to 2003. It is likely thatmost of the fires we included in our analysis were
v www.esajournals.org 25 December 2011 v Volume 2(12) v Article 130
DILLON ET AL.
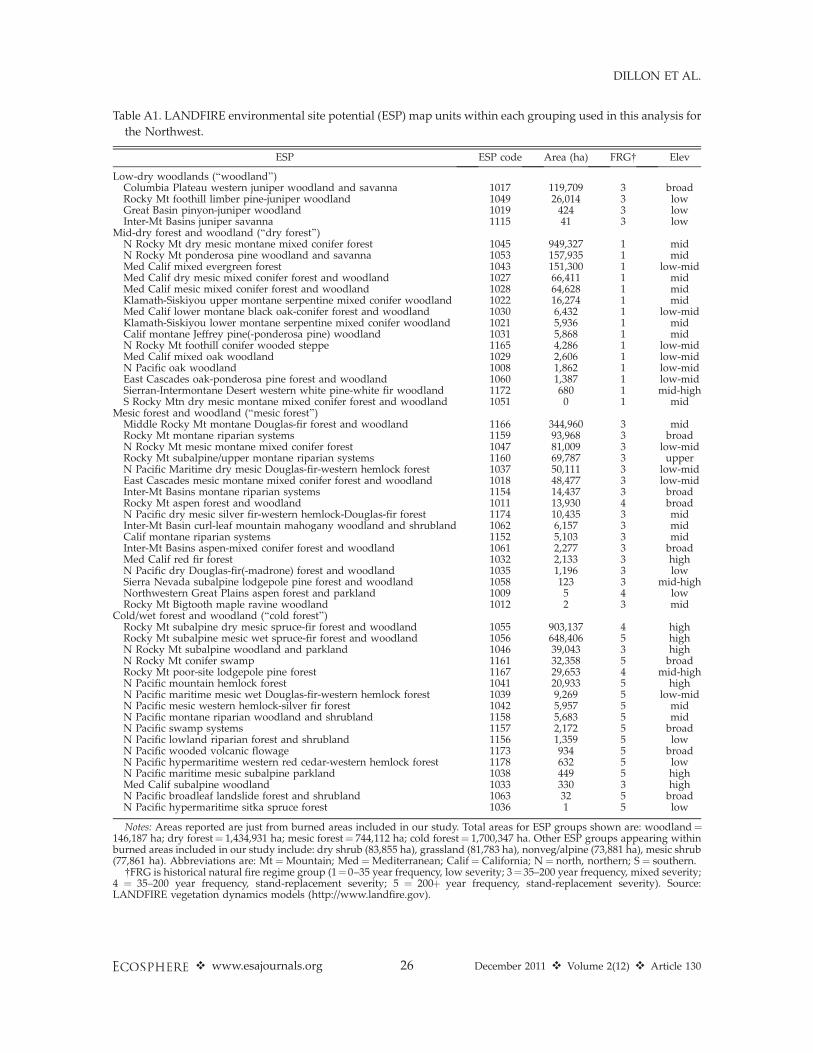
Table A1. LANDFIRE environmental site potential (ESP) map units within each grouping used in this analysis for
the Northwest.
ESP ESP code Area (ha) FRG� Elev
Low-dry woodlands (‘‘woodland’’)Columbia Plateau western juniper woodland and savanna 1017 119,709 3 broadRocky Mt foothill limber pine-juniper woodland 1049 26,014 3 lowGreat Basin pinyon-juniper woodland 1019 424 3 lowInter-Mt Basins juniper savanna 1115 41 3 low
Mid-dry forest and woodland (‘‘dry forest’’)N Rocky Mt dry mesic montane mixed conifer forest 1045 949,327 1 midN Rocky Mt ponderosa pine woodland and savanna 1053 157,935 1 midMed Calif mixed evergreen forest 1043 151,300 1 low-midMed Calif dry mesic mixed conifer forest and woodland 1027 66,411 1 midMed Calif mesic mixed conifer forest and woodland 1028 64,628 1 midKlamath-Siskiyou upper montane serpentine mixed conifer woodland 1022 16,274 1 midMed Calif lower montane black oak-conifer forest and woodland 1030 6,432 1 low-midKlamath-Siskiyou lower montane serpentine mixed conifer woodland 1021 5,936 1 midCalif montane Jeffrey pine(-ponderosa pine) woodland 1031 5,868 1 midN Rocky Mt foothill conifer wooded steppe 1165 4,286 1 low-midMed Calif mixed oak woodland 1029 2,606 1 low-midN Pacific oak woodland 1008 1,862 1 low-midEast Cascades oak-ponderosa pine forest and woodland 1060 1,387 1 low-midSierran-Intermontane Desert western white pine-white fir woodland 1172 680 1 mid-highS Rocky Mtn dry mesic montane mixed conifer forest and woodland 1051 0 1 mid
Mesic forest and woodland (‘‘mesic forest’’)Middle Rocky Mt montane Douglas-fir forest and woodland 1166 344,960 3 midRocky Mt montane riparian systems 1159 93,968 3 broadN Rocky Mt mesic montane mixed conifer forest 1047 81,009 3 low-midRocky Mt subalpine/upper montane riparian systems 1160 69,787 3 upperN Pacific Maritime dry mesic Douglas-fir-western hemlock forest 1037 50,111 3 low-midEast Cascades mesic montane mixed conifer forest and woodland 1018 48,477 3 low-midInter-Mt Basins montane riparian systems 1154 14,437 3 broadRocky Mt aspen forest and woodland 1011 13,930 4 broadN Pacific dry mesic silver fir-western hemlock-Douglas-fir forest 1174 10,435 3 midInter-Mt Basin curl-leaf mountain mahogany woodland and shrubland 1062 6,157 3 midCalif montane riparian systems 1152 5,103 3 midInter-Mt Basins aspen-mixed conifer forest and woodland 1061 2,277 3 broadMed Calif red fir forest 1032 2,133 3 highN Pacific dry Douglas-fir(-madrone) forest and woodland 1035 1,196 3 lowSierra Nevada subalpine lodgepole pine forest and woodland 1058 123 3 mid-highNorthwestern Great Plains aspen forest and parkland 1009 5 4 lowRocky Mt Bigtooth maple ravine woodland 1012 2 3 mid
Cold/wet forest and woodland (‘‘cold forest’’)Rocky Mt subalpine dry mesic spruce-fir forest and woodland 1055 903,137 4 highRocky Mt subalpine mesic wet spruce-fir forest and woodland 1056 648,406 5 highN Rocky Mt subalpine woodland and parkland 1046 39,043 3 highN Rocky Mt conifer swamp 1161 32,358 5 broadRocky Mt poor-site lodgepole pine forest 1167 29,653 4 mid-highN Pacific mountain hemlock forest 1041 20,933 5 highN Pacific maritime mesic wet Douglas-fir-western hemlock forest 1039 9,269 5 low-midN Pacific mesic western hemlock-silver fir forest 1042 5,957 5 midN Pacific montane riparian woodland and shrubland 1158 5,683 5 midN Pacific swamp systems 1157 2,172 5 broadN Pacific lowland riparian forest and shrubland 1156 1,359 5 lowN Pacific wooded volcanic flowage 1173 934 5 broadN Pacific hypermaritime western red cedar-western hemlock forest 1178 632 5 lowN Pacific maritime mesic subalpine parkland 1038 449 5 highMed Calif subalpine woodland 1033 330 3 highN Pacific broadleaf landslide forest and shrubland 1063 32 5 broadN Pacific hypermaritime sitka spruce forest 1036 1 5 low
Notes: Areas reported are just from burned areas included in our study. Total areas for ESP groups shown are: woodland¼146,187 ha; dry forest¼ 1,434,931 ha; mesic forest¼ 744,112 ha; cold forest¼ 1,700,347 ha. Other ESP groups appearing withinburned areas included in our study include: dry shrub (83,855 ha), grassland (81,783 ha), nonveg/alpine (73,881 ha), mesic shrub(77,861 ha). Abbreviations are: Mt ¼Mountain; Med¼Mediterranean; Calif¼ California; N¼ north, northern; S¼ southern.
�FRG is historical natural fire regime group (1¼0–35 year frequency, low severity; 3¼35–200 year frequency, mixed severity;4 ¼ 35–200 year frequency, stand-replacement severity; 5 ¼ 200þ year frequency, stand-replacement severity). Source:LANDFIRE vegetation dynamics models (http://www.landfire.gov).
v www.esajournals.org 26 December 2011 v Volume 2(12) v Article 130
DILLON ET AL.
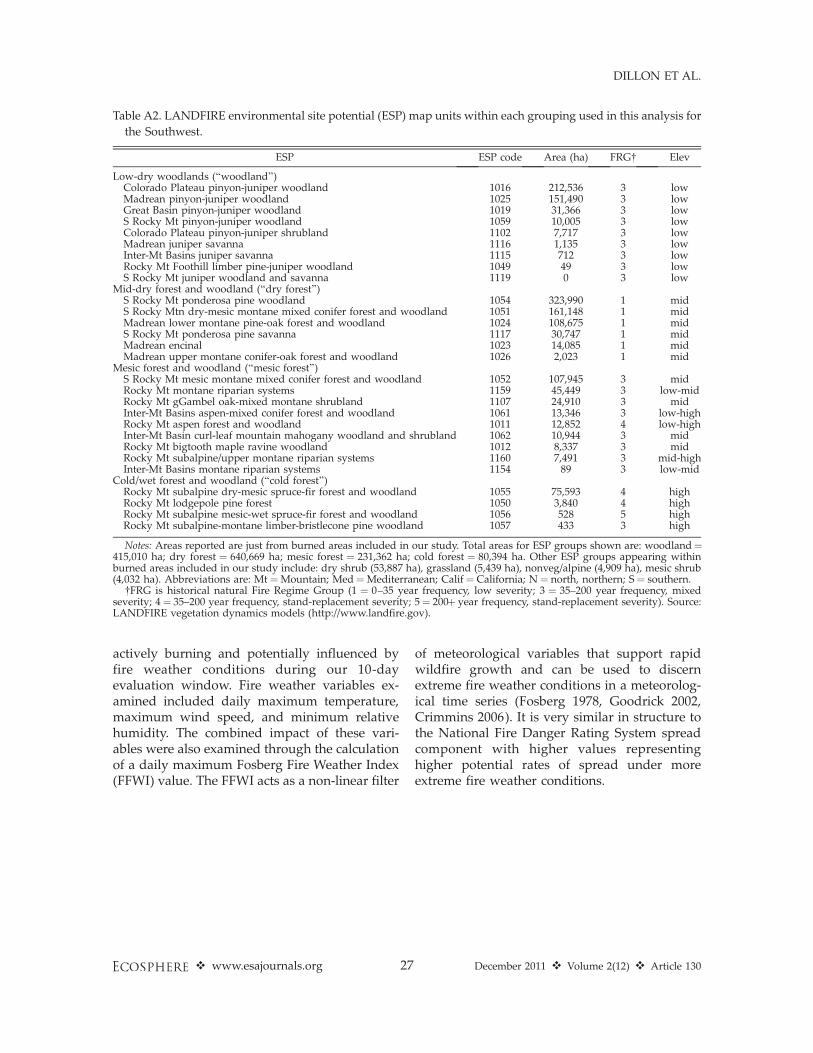
actively burning and potentially influenced byfire weather conditions during our 10-dayevaluation window. Fire weather variables ex-amined included daily maximum temperature,maximum wind speed, and minimum relativehumidity. The combined impact of these vari-ables were also examined through the calculationof a daily maximum Fosberg Fire Weather Index(FFWI) value. The FFWI acts as a non-linear filter
of meteorological variables that support rapidwildfire growth and can be used to discernextreme fire weather conditions in a meteorolog-ical time series (Fosberg 1978, Goodrick 2002,Crimmins 2006). It is very similar in structure tothe National Fire Danger Rating System spreadcomponent with higher values representinghigher potential rates of spread under moreextreme fire weather conditions.
Table A2. LANDFIRE environmental site potential (ESP) map units within each grouping used in this analysis for
the Southwest.
ESP ESP code Area (ha) FRG� Elev
Low-dry woodlands (‘‘woodland’’)Colorado Plateau pinyon-juniper woodland 1016 212,536 3 lowMadrean pinyon-juniper woodland 1025 151,490 3 lowGreat Basin pinyon-juniper woodland 1019 31,366 3 lowS Rocky Mt pinyon-juniper woodland 1059 10,005 3 lowColorado Plateau pinyon-juniper shrubland 1102 7,717 3 lowMadrean juniper savanna 1116 1,135 3 lowInter-Mt Basins juniper savanna 1115 712 3 lowRocky Mt Foothill limber pine-juniper woodland 1049 49 3 lowS Rocky Mt juniper woodland and savanna 1119 0 3 low
Mid-dry forest and woodland (‘‘dry forest’’)S Rocky Mt ponderosa pine woodland 1054 323,990 1 midS Rocky Mtn dry-mesic montane mixed conifer forest and woodland 1051 161,148 1 midMadrean lower montane pine-oak forest and woodland 1024 108,675 1 midS Rocky Mt ponderosa pine savanna 1117 30,747 1 midMadrean encinal 1023 14,085 1 midMadrean upper montane conifer-oak forest and woodland 1026 2,023 1 mid
Mesic forest and woodland (‘‘mesic forest’’)S Rocky Mt mesic montane mixed conifer forest and woodland 1052 107,945 3 midRocky Mt montane riparian systems 1159 45,449 3 low-midRocky Mt gGambel oak-mixed montane shrubland 1107 24,910 3 midInter-Mt Basins aspen-mixed conifer forest and woodland 1061 13,346 3 low-highRocky Mt aspen forest and woodland 1011 12,852 4 low-highInter-Mt Basin curl-leaf mountain mahogany woodland and shrubland 1062 10,944 3 midRocky Mt bigtooth maple ravine woodland 1012 8,337 3 midRocky Mt subalpine/upper montane riparian systems 1160 7,491 3 mid-highInter-Mt Basins montane riparian systems 1154 89 3 low-mid
Cold/wet forest and woodland (‘‘cold forest’’)Rocky Mt subalpine dry-mesic spruce-fir forest and woodland 1055 75,593 4 highRocky Mt lodgepole pine forest 1050 3,840 4 highRocky Mt subalpine mesic-wet spruce-fir forest and woodland 1056 528 5 highRocky Mt subalpine-montane limber-bristlecone pine woodland 1057 433 3 high
Notes: Areas reported are just from burned areas included in our study. Total areas for ESP groups shown are: woodland¼415,010 ha; dry forest ¼ 640,669 ha; mesic forest ¼ 231,362 ha; cold forest ¼ 80,394 ha. Other ESP groups appearing withinburned areas included in our study include: dry shrub (53,887 ha), grassland (5,439 ha), nonveg/alpine (4,909 ha), mesic shrub(4,032 ha). Abbreviations are: Mt ¼Mountain; Med¼Mediterranean; Calif¼ California; N¼ north, northern; S¼ southern.
�FRG is historical natural Fire Regime Group (1 ¼ 0–35 year frequency, low severity; 3 ¼ 35–200 year frequency, mixedseverity; 4¼ 35–200 year frequency, stand-replacement severity; 5¼ 200þ year frequency, stand-replacement severity). Source:LANDFIRE vegetation dynamics models (http://www.landfire.gov).
v www.esajournals.org 27 December 2011 v Volume 2(12) v Article 130
DILLON ET AL.

Table A3. Candidate topographic predictor variables for all Random Forest models.
Variable PacificInland
NorthwestNorthernRockies
SouthernRockies
ColoradoPlateau Mogollon Rim
Elevation � X X X X X XSlope and aspect indices
Slope X X X X X XHeat load index X X X X X XSolar radiation aspect index X X X X X XSlope cosine aspect index X X X X X X
Slope position indicesHierarchical slope position X X X X X XCompound topographic index X X X X X XTopographic position index150 m X X X X X X300 m . . . . . . . . . . . . . . . . . .2000 m X X X X X X
Topographic complexity indicesDissection90 m X X X . . . . . . . . .450m . . . . . . . . . . . . . . . . . .810 m X X X X X X
Elevation relief ratio90 m X X X X X X450 m X X X . . . . . . . . .810 m X X X X X X
Note: For each ecoregion, an X indicates that the variable was used in Random Forest models, and an ellipsis (...) indicatesthat the variable was eliminated prior to modeling due to high correlation (Spearman’s rho . 0.75) with other candidatevariables.
� 30 m2 digital elevation models acquired from LANDFIRE (http://landfire.cr.usgs.gov/viewer/), originally produced by theUSGS Elevation Data for National Applications program (http://edna.usgs.gov/).
v www.esajournals.org 28 December 2011 v Volume 2(12) v Article 130
DILLON ET AL.
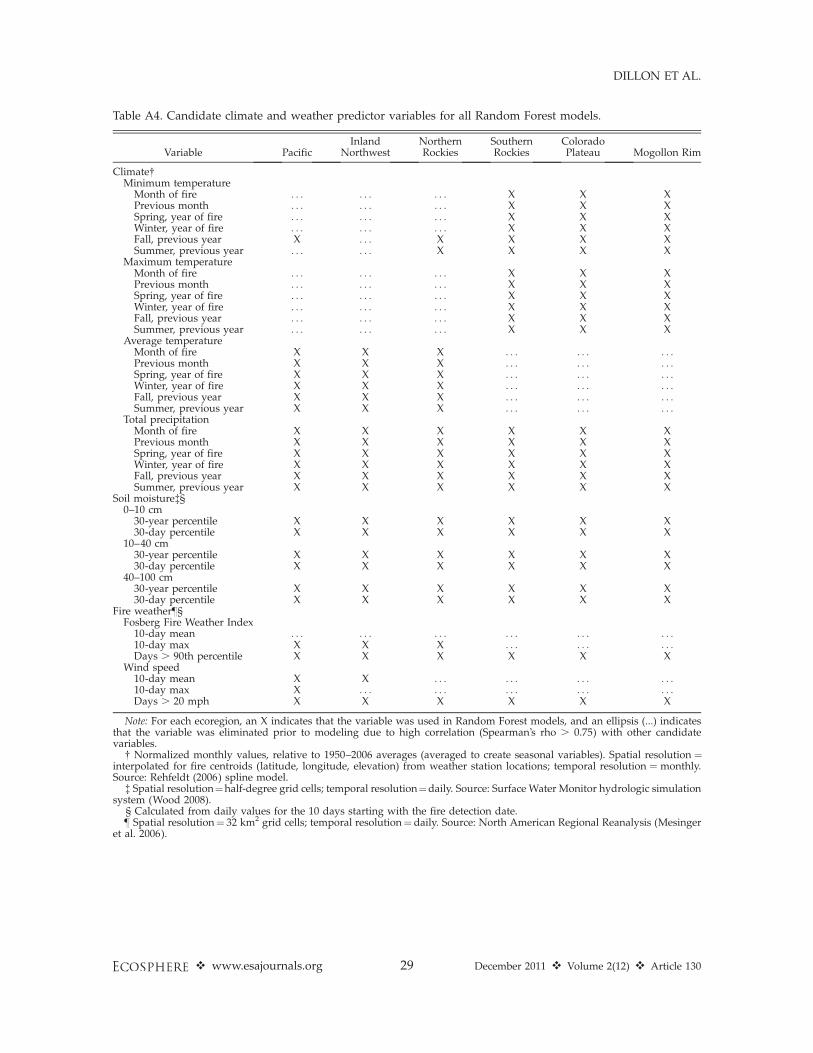
Table A4. Candidate climate and weather predictor variables for all Random Forest models.
Variable PacificInland
NorthwestNorthernRockies
SouthernRockies
ColoradoPlateau Mogollon Rim
Climate�Minimum temperatureMonth of fire . . . . . . . . . X X XPrevious month . . . . . . . . . X X XSpring, year of fire . . . . . . . . . X X XWinter, year of fire . . . . . . . . . X X XFall, previous year X . . . X X X XSummer, previous year . . . . . . X X X X
Maximum temperatureMonth of fire . . . . . . . . . X X XPrevious month . . . . . . . . . X X XSpring, year of fire . . . . . . . . . X X XWinter, year of fire . . . . . . . . . X X XFall, previous year . . . . . . . . . X X XSummer, previous year . . . . . . . . . X X X
Average temperatureMonth of fire X X X . . . . . . . . .Previous month X X X . . . . . . . . .Spring, year of fire X X X . . . . . . . . .Winter, year of fire X X X . . . . . . . . .Fall, previous year X X X . . . . . . . . .Summer, previous year X X X . . . . . . . . .
Total precipitationMonth of fire X X X X X XPrevious month X X X X X XSpring, year of fire X X X X X XWinter, year of fire X X X X X XFall, previous year X X X X X XSummer, previous year X X X X X X
Soil moisture�§0–10 cm30-year percentile X X X X X X30-day percentile X X X X X X
10–40 cm30-year percentile X X X X X X30-day percentile X X X X X X
40–100 cm30-year percentile X X X X X X30-day percentile X X X X X X
Fire weather}§Fosberg Fire Weather Index10-day mean . . . . . . . . . . . . . . . . . .10-day max X X X . . . . . . . . .Days . 90th percentile X X X X X X
Wind speed10-day mean X X . . . . . . . . . . . .10-day max X . . . . . . . . . . . . . . .Days . 20 mph X X X X X X
Note: For each ecoregion, an X indicates that the variable was used in Random Forest models, and an ellipsis (...) indicatesthat the variable was eliminated prior to modeling due to high correlation (Spearman’s rho . 0.75) with other candidatevariables.
� Normalized monthly values, relative to 1950–2006 averages (averaged to create seasonal variables). Spatial resolution ¼interpolated for fire centroids (latitude, longitude, elevation) from weather station locations; temporal resolution ¼ monthly.Source: Rehfeldt (2006) spline model.
� Spatial resolution¼half-degree grid cells; temporal resolution¼daily. Source: Surface Water Monitor hydrologic simulationsystem (Wood 2008).
§ Calculated from daily values for the 10 days starting with the fire detection date.} Spatial resolution¼ 32 km2 grid cells; temporal resolution¼ daily. Source: North American Regional Reanalysis (Mesinger
et al. 2006).
v www.esajournals.org 29 December 2011 v Volume 2(12) v Article 130
DILLON ET AL.

Fig. A1. Departure from normal climate conditions for each month in the year of fire and previous year. Lines
in each figure represent normalized climate data (standard deviations above or below 1950 to 2006 averages)
from individual fire events, averaged across all fires in a given ecoregion and year subset.
v www.esajournals.org 30 December 2011 v Volume 2(12) v Article 130
DILLON ET AL.

APPENDIX BDETAILED RANDOM FOREST MODELING RESULTS
Table B1. Variable importance rankings for Northwest Random Forest models relating topography, climate, and
weather to burn severity, grouped by ecoregion and categories of fire year (all, big, other).
Variable
Pacific Inland Northwest Northern Rockies
All Big Other All Big Other All Big Other
Conditions during fireAverage temperature, month of fire� . . . . . . 16 18 . . . . . . . . . . . . . . .Precipitation, month of fire� . . . . . . . . . 11 . . . 17 23 . . . . . .Soil moisture0–10 cm (30yr%)� . . . . . . . . . 20 . . . . . . 21 20 . . .10–40 cm (30yr%)� 16 . . . . . . 19 . . . 16 . . . . . . . . .40–100 cm (30yr%)� . . . . . . . . . 21 . . . . . . 18 13 . . .
Maximum Fosberg Fire Weather Index� . . . . . . . . . 16 12 . . . . . . . . . 9Average wind speed� . . . . . . . . . 17 . . . . . . — — —
Antecedent conditionsMinimum temperaturePrevious fall (SON)� 15 14 17 — — — 22 . . . 8Previous summer (JJA)� — — — — — — 15 18 10
Average temperaturePrevious month� . . . . . . 19 13 11 10 17 17 . . .Previous spring (MAM)� . . . . . . . . . 24 . . . . . . 20 22 . . .Previous winter (DJF)� . . . . . . . . . . . . . . . . . . . . . 21 . . .Previous fall (SON)� . . . . . . 18 12 15 13 14 11 . . .Previous summer (JJA)� . . . . . . . . . . . . . . . . . . 16 19 . . .
PrecipitationPrevious spring (MAM)� . . . . . . 14 23 13 . . . 12 14 6Previous winter (DJF)� . . . . . . 13 14 14 . . . . . . . . . . . .Previous fall (SON)� 14 16 11 22 . . . 15 19 15 . . .Previous summer (JJA)� . . . 15 15 . . . . . . 14 11 16 5
TopographyElevation 1 1 1 3 1 1 1 1 1Slope 8 7 8 4 6 5 3 5 4Heat load index 5 6 6 1 3 2 2 2 3Solar radiation aspect index 11 11 10 6 5 7 6 4 . . .Slope cosine aspect index 4 5 4 5 4 4 4 3 11Hierarchical slope position 7 4 9 9 10 9 9 8 . . .Compound topographic index 17 17 . . . . . . . . . . . . . . . . . . . . .Topographic position index150 m 9 9 12 15 . . . 12 13 12 . . .2000 m 2 2 2 2 2 3 5 6 2
Dissection90 m 13 13 . . . . . . . . . . . . . . . . . . . . .810 m 3 3 3 7 8 6 7 7 . . .
Elevation relief ratio90 m 12 10 . . . . . . . . . . . . . . . . . . . . .450 m 10 12 7 10 9 11 10 10 . . .810 m 6 8 5 8 7 8 8 9 7
Notes: Values reflect each variable’s ranking (1¼most important) based on its contribution to overall model accuracy in theoptimal Random Forest model. Columns are separate models for all years, big years, and other years in each ecoregion.Variables not selected by a particular model are indicated with an ellipsis (...), and variables not selected in any models areomitted from this table. Dashes indicate variables that were not used in a particular ecoregion due to high correlation with othervariables.
� Normalized monthly values, relative to 1950–2006 averages (averaged to create seasonal variables).� Calculated from daily values for the 10 days starting with the fire detection date.
v www.esajournals.org 31 December 2011 v Volume 2(12) v Article 130
DILLON ET AL.

Table B2. Variable importance rankings for Southwest Random Forest models relating topography, climate, and
weather to burn severity, grouped by ecoregion and categories of fire year (all, big, other).
Variable
Mogollon Rim Colorado Plateau Southern Rockies
All Big Other All Big Other All Big Other
Conditions during fireMinimum temperature, month of fire� . . . . . . . . . 17 . . . 11 11 11 16Maximum temperature, month of fire� . . . . . . . . . . . . . . . . . . . . . . . . 15Precipitation, month of fire� 15 15 . . . . . . 13 . . . . . . . . . . . .Soil moisture0–10 cm (30yr%)� . . . . . . 12 . . . . . . . . . 16 15 . . .0–10 cm (30day%)� . . . 16 . . . . . . . . . . . . . . . . . . . . .10–40 cm (30yr%)� . . . . . . 13 . . . 19 15 . . . . . . . . .
Antecedent conditionsMinimum temperaturePrevious month� . . . . . . . . . 16 . . . . . . 14 . . . 10Previous spring (AMJ)� . . . . . . . . . . . . 18 . . . . . . . . . . . .Previous fall (OND)� . . . . . . . . . 15 . . . . . . . . . . . . 13Previous summer (JAS)� 17 17 . . . . . . 15 . . . . . . . . . . . .
Maximum temperaturePrevious month� . . . 14 . . . . . . . . . 14 17 . . . 14Previous spring (AMJ)� . . . . . . . . . . . . 16 . . . 18 . . . . . .Previous winter (JFM)� . . . . . . . . . . . . . . . . . . 19 . . . . . .Previous summer (JAS)� . . . 18 . . . 14 20 13 . . . . . . . . .
PrecipitationPrevious month� 13 13 . . . . . . 14 . . . 20 . . . . . .Previous spring (AMJ)� 14 . . . 11 . . . . . . . . . . . . 14 . . .Previous winter (JFM)� . . . . . . . . . . . . . . . 12 . . . 16 12Previous fall (OND)� 16 . . . 14 13 17 . . . 15 . . . . . .
TopographyElevation 2 2 1 1 1 1 1 1 1Slope 7 6 8 6 7 4 6 6 6Heat load index 6 5 6 7 5 7 7 4 4Solar radiation aspect index 9 9 7 9 9 8 8 8 8Slope cosine aspect index 5 4 4 3 2 5 3 3 7Hierarchical slope position 8 8 9 8 8 9 9 9 9Compound topographic index 12 12 . . . 12 12 . . . 13 13 . . .Topographic position index150 m 10 10 10 10 10 16 10 10 112000 m 1 1 2 2 3 2 2 2 2
Dissection, 810 m 3 3 5 5 4 6 4 5 5Elevation relief ratio90 m 11 11 . . . 11 11 10 12 12 . . .810 m 4 7 3 4 6 3 5 7 3
Notes: Values reflect each variable’s ranking (1¼most important) based on its contribution to overall model accuracy in theoptimal Random Forest model. Columns are separate models for all years, big years, and other years in each ecoregion.Variables not selected by a particular model are indicated with an ellipsis (...), and variables not selected in any models areomitted from this table.
� Normalized monthly values, relative to 1950–2006 averages (averaged to create seasonal variables).� Calculated from daily values for the 10 days starting with the fire detection date.
v www.esajournals.org 32 December 2011 v Volume 2(12) v Article 130
DILLON ET AL.

Table B3. Results from optimal Random Forest models for the Northwest.
Metric
Pacific Inland Northwest Northern Rockies
All Big Other All Big Other All Big Other
Topographic predictors onlyPCC 0.64 0.64 0.66 0.62 0.63 0.64 0.62 0.62 0.65Kappa 0.27 0.28 0.32 0.24 0.26 0.26 0.22 0.23 0.26AUC 0.70 0.70 0.73 0.66 0.69 0.67 0.67 0.67 0.69Number of pixels 18,163 13,220 4,943 24,000 14,198 9,802 21,794 16,722 5,072
Topographic, climatic and weather predictorsPCC 0.70 0.68 0.75 0.72 0.71 0.72 0.70 0.69 0.73Kappa 0.40 0.37 0.49 0.43 0.42 0.44 0.39 0.38 0.44AUC 0.77 0.76 0.82 0.79 0.79 0.79 0.77 0.76 0.80Number of pixels 17,389 13,099 4,290 23,664 14,156 9,508 21,729 16,720 5,009
Notes: Columns are separate models for all years, big years, and other years in each ecoregion. PCC is percent correctlyclassified. AUC is area under the receiver operating characteristic curve.
Table B4. Results from optimal Random Forest models for the Southwest.
Metric
Mogollon Rim Colorado Plateau Southern Rockies
All Big Other All Big Other All Big Other
Topographic predictors onlyPCC 0.69 0.68 0.77 0.67 0.69 0.71 0.62 0.63 0.69Kappa 0.37 0.37 0.48 0.34 0.36 0.34 0.25 0.26 0.29AUC 0.76 0.75 0.82 0.74 0.75 0.77 0.67 0.68 0.72Number of pixels 21,808 15,679 6,129 19,099 13,154 5,945 24,000 19,475 4,525
Topographic, climatic, and weather predictorsPCC 0.79 0.77 0.84 0.76 0.75 0.78 0.72 0.71 0.76Kappa 0.58 0.54 0.65 0.52 0.48 0.53 0.44 0.42 0.48AUC 0.86 0.84 0.91 0.84 0.82 0.86 0.80 0.78 0.82Number of pixels 21,637 15,671 5,966 18,511 12,951 5,560 23,235 19,153 4,082
Notes: Columns are separate models for all years, big years, and other years in each ecoregion. PCC is percent correctlyclassified. AUC is area under the receiver operating characteristic curve.
v www.esajournals.org 33 December 2011 v Volume 2(12) v Article 130
DILLON ET AL.