borough of edgewater school district · is accurate in all material respects and is reported ......
TRANSCRIPT

BOROUGH OF EDGEWATER
SCHOOL DISTRICT
Borough of Edgewater Board of Education County of Bergen
New Jersey
Comprehensive Annual Financial Report For the Year Ended
June 30, 2018

BOROUGH OF EDGEWATER
SCHOOL DISTRICT
Borough of Edgewater Board of Education County of Bergen
New Jersey
Comprehensive Annual Financial Report For the Year Ended
June 30, 2018

Borough of Edgewater School District
Comprehensive Annual Financial Report and
Report on Internal Control and Compliance
Year Ended June 30, 2018

i
Table of Contents INTRODUCTORY SECTION – Other Information Page Letter of Transmittal ................................................................................................. 1 Organizational Chart ................................................................................................ 4 Roster of Officials ..................................................................................................... 5 Consultants and Advisors ........................................................................................ 6 FINANCIAL SECTION Independent Auditors’ Report ................................................................................... 7 Required Supplementary Information - Part I Management’s Discussion and Analysis ......................................................... 10 Basic Financial Statements Government-wide Financial Statements:
A-1 Statement of Net Position ...................................................................... 20 A-2 Statement of Activities ........................................................................... 21
Fund Financial Statements: Governmental Funds: B-1 Balance Sheet ....................................................................................... 22 B-2 Statement of Revenues, Expenditures, and Changes in Fund Balances 23 B-3 Reconciliation of the Statement of Revenues, Expenditures and Changes in Fund Balances of Governmental Funds to the Statement of Activities . 24 Proprietary Funds: B-4 Statement of Net Position ...................................................................... 25 B-5 Statement of Revenues, Expenses and Changes in Fund Net Position 26 B-6 Statement of Cash Flows ...................................................................... 27 Fiduciary Funds: B-7 Statement of Fiduciary Net Position ...................................................... 28 B-8 Statement of Changes in Fiduciary Net Position .................................... 29 Notes to the Basic Financial Statements ........................................................ 30

ii
Table of Contents
(Continued)
FINANCIAL SECTION (continued) Page
Required Supplementary Information - Part II Schedules and Notes Related to Accounting and Reporting for Pensions and OPEBs (GASB 68 and 75)
Schedule of the District’s Proportionate Share of the Net Pension
Liability – Public Employee’s Retirement System (PERS) And Notes to Required Supplementary Information ...................................... 65 Schedule of District Contributions – Public Employee’s
Retirement System (PERS)………………………………………………………… 66
Schedule of the State’s Proportionate Share of the Net Pension
Liability Associated with the District – Teacher’s Pension
and Annuity Fund (TPAF) and Notes to Required Supplementary Information ........................................................................... 67 Schedule of the State’s Proportionate Share of the OPEB Liability Associated with the District – State Health Benefit Local Education Retired Employees Plan…………………………………………………………… 68 Notes to Required Supplementary Information……………………………………… .. 69 Required Supplementary Information – Part III Budgetary Comparison Schedules:
C-1 Budgetary Comparison Schedule - General Fund ................................. 70 C-2 Budgetary Comparison Schedule – Special Revenue Fund .................. 75
C-3 Budget to GAAP Reconciliation ............................................................. 76
Supplementary Information School Level Schedules: D School Level Schedules – Not Applicable ............................................. N/A Special Revenue Fund: E-1 Combining Schedule of Revenues and Expenditures ............................ 78 E-2 Pre-school Education Schedule of Expenditures ................................... 80 Capital Projects Fund: F-1 Summary Schedule of Project Expenditures ......................................... 81 F-2 Summary Schedule of Revenues, Expenditures and Changes in Fund Balance ................................................................... 82
F-2a Schedule of Project Revenues, Expenditures, Project Status, and Project Balance ................................................................................... 83 F-2b Schedule of Project Revenues, Expenditures, Project Status, and Project Balance ................................................................................... 84

iii
Table of Contents (Continued)
Page Fiduciary Funds:
H-1 Combining Statement of Net Position .................................................. 85 H-2 Combining Statement of Change in Net Position ................................ 86 H-3 Student Activity Agency Fund Statement of Activity............................. 87 H-4 Payroll Agency Fund Schedule of Receipts and Disbursements .......... 88 Long-Term Debt: I-1 Schedule of Serial Bonds ..................................................................... 89 I-2 Schedule of Obligations Under Capital Leases .................................... 90 I-3 Schedule of Revenues, Expenditures and Changes in Fund Balance – Budget and Actual – Debt Service Fund .............................................. 91 STATISTICAL SECTION – Other Information (Unaudited)
Financial Trends: J-1 Net Position by Component ................................................................. 92 J-2 Net Position by Component ................................................................. 93 J-3 Net Position by Component ................................................................. 95 J-4 Change in Fund Balances - Governmental Funds ................................ 96 J-5 General Fund – Other Local Revenue by Source ................................. 97 Revenue Capacity: J-6 Assessed Value and Estimated Actual Value of Taxable Property ....... 98 J-7 Direct and Overlapping Tax Rates ....................................................... 99 J-8 Principal Property Taxpayers ............................................................... 100 J-9 Property Tax Levies and Collections .................................................... 101 Debt Capacity: J-10 Ratios of Outstanding Debt by Type .................................................... 102 J-11 Ratios of General Bonded Debt Outstanding ....................................... 103 J-12 Ratios of Overlapping Governmental Activities Debt ............................ 104 J-13 Legal Debt Margin Information ............................................................. 105 Demographic and Economic Information: J-14 Demographic and Economic Statistics ................................................. 106 J-15 Principal Employers ............................................................................. 107 J-16 Full-Time Equivalent District Employees by Function/Program ............ 108 Operating Information: J-17 Operating Statistics .............................................................................. 109 J-18 School Building Information ................................................................. 110 J-19 Schedule of Required Maintenance for School Facilities ...................... 111 J-20 Insurance Schedule ............................................................................. 112

iv
Table of Contents (Continued)
SINGLE AUDIT SECTION Page K-1 Report on Internal Control Over Financial Reporting and on Compliance and Other Matters Based on an Audit of Financial Statements Performed in Accordance with Government Auditing Standards ............................. 113 K-2 Report on Compliance for Each Major State Program and on Internal Control Over Compliance Required by New Jersey OMB Circular 15-08........ 115 K-3 Schedule A - Schedule of Expenditures of Federal Awards – Supplementary Information ................................................................ 118
K-4 Schedule B - Schedule of Expenditures of State Financial Assistance - Supplementary Information ............................................................... 119
K-5 Notes to the Schedules of Expenditures of Federal Awards and State Financial Assistance ......................................................................... 120
K-6 Schedule of Findings and Questioned Costs – Part I – Summary ....... of Auditors’ Results ........................................................................... 123
K-7 Schedule of Findings and Questioned Costs – Parts II and III – Schedule of Financial Statement Findings and Schedule of State Financial Assistance Findings and Questioned Costs .............. 125 K-8 Summary Schedule of Prior Year Audit Findings ............................... 128

INTRODUCTORY SECTION

March 15, 2019 The Honorable President and Members of the Board of Education Borough of Edgewater School District County of Bergen, New Jersey Dear Board Members: The comprehensive annual financial report of the Borough of Edgewater School District (the "District") for the fiscal year ended June 30, 2018, is hereby submitted. Responsibility for both the accuracy of the data and completeness and fairness of the presentation, including all disclosures, rests with the management of the Board of Education (the "Board"). To the best of our knowledge and belief, the data presented in this report is accurate in all material respects and is reported in a manner designed to present fairly the basic financial statements and results of operations of the District. All disclosures necessary to enable the reader to gain an understanding of the District's financial activities have been included. The comprehensive annual financial report is presented in four sections: introductory, financial, statistical and single audit. The introductory section includes this transmittal letter, the District's organizational chart and a list of principal officials. The financial section includes the Independent Auditors’ Report, management’s discussion and analysis, the basic financial statements and notes providing an overview of the District’s financial position and operating results, and supplementary schedules providing detailed budgetary information. The statistical section includes selected economic and demographic information, financial trends and the fiscal capacity of the District, generally presented on a multi- year basis. The District is required to undergo an annual single audit in conformity with the provisions of Title 2 U.S. Code of Federal Regulations (CFR) Part 200 Uniform Administrative Requirements Costs Principles and Audit Requirements for federal award, and New Jersey OMB Circular NJOMB 15-08, Single Audit Policy for Recipients of Federal Grants, State Grants and State Aid. It is noted that a federal single audit was not required for their audit year. Information related to this single audit, including the auditors' reports on the internal control and compliance with applicable laws, regulations, contracts and grants along with findings and questioned costs, is included in the single audit section of this report. 1) REPORTING ENTITY AND ITS SERVICES: The Borough of Edgewater School District is an independent reporting entity within the criteria adopted by the Government Accounting Standards Board (“GASB”) in codification section 2100. All funds of the District are included in this report. The Edgewater Public School System, including the Eleanor Van Gelder Elementary School and the George Washington School, constitute the District's reporting entity. 2) EDUCATIONAL PROGRAM: The Edgewater Public School System is comprised of two elementary schools (Special Education Pre-K to Grade 6), serving approximately 976 students. The public schools are accredited by the New Jersey State Department of Education. The District is served by 68.8 (FTE) teachers and 4 (FTE) administrators. Approximately 61% of the faculty has earned Masters’ degrees. The District provides a full range of educational services appropriate to levels Pre-K through Grade 6. These include reading, language arts, social studies, mathematics, science, computer education, remedial instruction, special education, resource room instruction, family life, physical and health education, career education, world languages and enrichment. The curriculum is aligned with the New Jersey Core Curriculum Content Standards, the Common Core Standards as required and that of the Leonia Public School System where Edgewater students attend Grades 7-12.
1

The District’s Spring 2018 results for Language Arts Literacy (LAL) and Mathematics are as follows: ___Language Arts Literacy (LAL) Mathematics________ Advanced Partially Advanced Partially Proficient Proficient Proficient Proficient Proficient Proficient Grade 3 11.0% 53.0% 36.0% 18.0% 41.0% 41.0% Grade 4 14.0% 38.0% 48.0% 9.0% 44.0% 48.0% Grade 5 16.0% 46.0% 38.0% 12.0% 31.0% 57.0% Grade 6 20.0% 34.0% 40.0% 16.0% 36.0% 48.0% The District completed the 2017-18 fiscal year with Pre-K through Grade 6 enrollment of 976 students and Grade 7-12 enrollment of 414 students in Leonia Public Schools, for an overall total of 1,390 students, which is an increase of students from the previous year’s enrollment. The following table details the changes in the District’s average daily enrollment for grade levels Pre-K through 6 as of October 15 over the last five years: _____________________Average Daily Enrollment____________________________ Fiscal Year Pre K-6 Enrollment Percent Change 2017-2018 976 8.08 % 2016-2017 903 <0.33>% 2015-2016 906 0.11 % 2014-2015 905 12.00 % 3) ECONOMIC CONDITIONS AND OUTLOOK: The District’s primary funding source is property tax revenue. Overall tax revenue for the General Fund was increased for the 2017-18 school year, but the projected increase in expenditures from inflationary pressures and the enrollment growth has outpaced the additional revenue. As a result, the District, along with many other public school systems in the State, faces some difficult economic situations in the future. The District’s administration continues to closely monitor the cost of operations and continues to look for innovative ways to cut costs in addition to finding new funding sources in order to maintain the quality educational services that the District has been accustomed to providing. 4) MAJOR INITIATIVES: Specific initiatives for the 2017-2018 school year include the following accomplishments:
• Curriculum articulation continued between Edgewater and Leonia Schools
• Continuation of music classes after school
• Continuation of after school clubs to include scholarships for economically disadvantaged
• Continued to expand our technology program by purchasing additional hardware and software
• Continued partnership with Teachers College Reading and Writing Project to strengthen literacy instruction in Grades K-6
• Launched Pearson Interactive Science curriculum in Grades K-6
• Launched Grade 5 & Grade 6 Chromebook Initiative 5) INTERNAL ACCOUNTING CONTROLS: Management of the District is responsible for establishing and maintaining an internal control system designed to ensure that the assets of the District are protected from loss, theft or misuse and to ensure that adequate accounting data are compiled to allow for the preparation of financial statements in conformity with accounting principles generally accepted in the United States of America ("GAAP"). The internal control system is designed to provide reasonable, but not absolute, assurance that these objectives are met. The concept of reasonable assurance recognizes that: (1) the cost of a control should not exceed the benefits likely to be derived; and (2) the valuation of costs and benefits requires estimates and judgments by management. As a recipient of federal and state awards, the District also is responsible for ensuring that an adequate internal control system is in place to ensure compliance with applicable laws and regulations related to those programs. This internal control system is also subject to periodic evaluation by the District's management.
2

3

BOROUGH OF EDGEWATER SCHOOL DISTRICT ORGANIZATIONAL CHART
Board of Education
Chief School Administrator Superintendent
Business Adm./
Bd. Secretary
Faculty
Staff
Vice Principal
CST
Chairperson
Custodial Staff
Child Study
Team
4

BOROUGH OF EDGEWATER SCHOOL DISTRICT ROSTER OF OFFICALS
JUNE 30, 2018
Members of the Board of Education Term Expires Thomas Quinton, President 12/31/2020 Cristina Stefani-Rackow, Vice President 12/31/2018 Barbara Bartolomeo 12/31/2019 Sandy Klein 12/31/2018 Christina Ling 12/31/2020 Other Officials Title Kerry Postma Chief School Administrator Gary J. Grembowiec School Business Administrator/Board Secretary Dennis McKeever Board Attorney
5

BOROUGH OF EDGEWATER SCHOOL DISTRICT Consultants and Advisors
Attorney
Dennis McKeever Counselor at Law 53 Cardinal Drive
P.O. Box 2369 Westfield, NJ 07091-2369
Audit Firm
PKF O’Connor Davies, LLP 20 Commerce Drive, Suite 301
Cranford, NJ 07016
Official Depositories
TD Bank 1400 Palisade Avenue
Fort Lee, NJ 07024
6

FINANCIAL SECTION

PKF O’CONNOR DAVIES, LLP 20 Commerce Drive, Suite 301, Cranford, NJ 07016 I Tel: 908.272.6200 I Fax: 908.272.2416 I www.pkfod.com
PKF O’Connor Davies, LLP is a member firm of the PKF International Limited network of legally independent firms and does not accept any responsibility or liability for the actions or inactions on the part of any other individual member firm or firms.
Independent Auditors’ Report The Honorable President and Members of the Board of Education Borough of Edgewater School District County of Bergen Edgewater, New Jersey Report on the Financial Statements We have audited the accompanying financial statements of the governmental activities, the business-type activities, each major fund and the aggregate remaining fund information of the Borough of Edgewater School District, in the County of Bergen, State of New Jersey (the “District”), as of and for the year ended June 30, 2018, and the related notes the financial statements, which collectively comprise the District’s basic financial statements as listed in the table of contents. Management’s Responsibility for the Financial Statements Management is responsible for the preparation and fair presentation of these financial statements in accordance with accounting principles generally accepted in the United States of America; this includes the design, implementation, and maintenance of internal control relevant to the preparation and fair presentation of financial statements that are free from material misstatement, whether due to fraud or error. Auditor’s Responsibility Our responsibility is to express opinions on these financial statements based on our audit. We conducted our audit in accordance with auditing standards generally accepted in the United States of America and the standards applicable to financial audits contained in Government Auditing Standards, issued by the Comptroller General of the United States; and audit requirements as prescribed by the Office of School Finance, Department of Education, State of New Jersey. Those standards and requirements require that we plan and perform the audit to obtain reasonable assurance about whether the financial statements are free of material misstatement. An audit involves performing procedures to obtain audit evidence about the amounts and disclosures in the financial statements. The procedures selected depend on the auditor’s judgment, including the assessment of the risks of material misstatement of the financial statements, whether due to fraud or error. In making those risk assessments, the auditor considers internal control relevant to the entity’s preparation and fair presentation of the financial statements in order to design audit procedures that are appropriate in the circumstances, but not for the purpose of expressing an opinion on the effectiveness of the entity’s internal control. Accordingly, we express no such opinion. An audit also includes
7

The Honorable President and Members of the Board of Education Borough of Edgewater School District Page 2 evaluating the appropriateness of accounting policies used and the reasonableness of significant accounting estimates made by management, as well as evaluating the overall presentation of the financial statements. We believe that the audit evidence we have obtained is sufficient and appropriate to provide a basis for our audit opinions. Opinions
In our opinion, the financial statements referred to above present fairly, in all material respects,
the respective financial position of the governmental activities, the business-type activities, each
major fund and the aggregate remaining fund information of the District as of June 30, 2018,
and the respective changes in financial position, and, where applicable, cash flows, thereof for
the year then ended in accordance with accounting principles generally accepted in the United
States of America.
Other Matters Required Supplementary Information Accounting principles generally accepted in the United States of America require that management’s discussion and analysis, schedule of the District’s proportionate share of the net pension liability-PERS, schedule of District contributions-PERS, schedule of the State’s proportionate share of the net pension liability associated with the District-TPAF, schedule of State’s proportionate share of the OPEB liability associated with the District and budgetary comparison information as presented in the table of contents be presented to supplement the basic financial statements. Such information, although not a part of the basic financial statements, is required by the Governmental Accounting Standards Board who considers it to be an essential part of financial reporting for placing the basic financial statements in an appropriate operational, economic, or historical context. We have applied certain limited procedures to the required supplementary information in accordance with auditing standards generally accepted in the United States of America, which consisted of inquiries of management about the methods of preparing the information and comparing the information for consistency with management’s responses to our inquiries, the basic financial statements, and other knowledge we obtained during our audit of the basic financial statements. We do not express an opinion or provide any assurance on the information because the limited procedures do not provide us with sufficient evidence to express an opinion or provide any assurance.
Other Information
Our audit was conducted for the purpose of forming opinions on the financial statements that collectively comprise the District’s basic financial statements. The introductory section, combining and individual fund financial statements, long-term debt schedules and statistical section, are presented for purposes of additional analysis and are not a required part of the basic financial statements. The schedules of expenditures of federal awards and state financial assistance are presented for purposes of additional analysis, as required by the Office of School
8

The Honorable President and Members of the Board of Education Borough of Edgewater School District Page 3 Finance, Department of Education, State of New Jersey and New Jersey OMB Circular 15-08, Single Audit Policy for Recipients of Federal Grants, State Grants and State Aid, respectively, and are also not a required part of the basic financial statements. The combining and individual fund financial statements and long-term debt schedules and the schedules of expenditures of federal awards and state financial assistance are the responsibility of management and were derived from and relate directly to the underlying accounting and other records used to prepare the basic financial statements. Such information has been subjected to the auditing procedures applied in the audit of the basic financial statements and certain additional procedures, including comparing and reconciling such information directly to the underlying accounting and other records used to prepare the basic financial statements or to the basic financial statements themselves, and other additional procedures in accordance with auditing standards generally accepted in the United States of America. In our opinion, the combining and individual fund financial statements and long-term debt schedules and the schedules of expenditures of federal awards and state financial assistance are fairly stated, in all material respects, in relation to the basic financial statements as a whole. The introductory and statistical sections have not been subjected to the auditing procedures applied in the audit of the basic financial statements and, accordingly, we do not express an opinion or provide any assurance on them. Other Reporting Required by Government Auditing Standards
In accordance with Government Auditing Standards, we have also issued our report dated March 15, 2019 on our consideration of the District’s internal control over financial reporting and on our tests of its compliance with certain provisions of laws, regulations, contracts and grant agreements and other matters. The purpose of that report is to describe the scope of our testing of internal control over financial reporting and compliance and the results of that testing, and not to provide an opinion on the effectiveness of the District’s internal control over financial reporting or on compliance. That report is an integral part of an audit performed in accordance with Government Auditing Standards in considering the District’s internal control over financial reporting and compliance.
March 15, 2019 Cranford, New Jersey
Michael J. Andriola, CPA
Licensed Public School Accountant
No. 2429
9

REQUIRED SUPPLEMENTARY INFORMATION – PART I
MANAGEMENT’S DISCUSSION AND ANALYSIS

Borough of Edgewater School District
Management’s Discussion and Analysis
Year Ended June 30, 2018
As management of the Borough of Edgewater School District, we offer readers of the District’s financial statements this narrative discussion, overview, and analysis of the financial activities of the District for the fiscal year ended June 30, 2018. We encourage readers to consider the information presented, in conjunction with additional information that we have furnished in our letter of transmittal.
Management’s Discussion and Analysis (MD&A) is Required Supplementary Information specified in the Governmental Accounting Standard Board’s (GASB) Statement No. 34, Basic Financial Statements – and Management’s Discussion and Analysis – for State and Local Governments. Certain comparative information between the current fiscal year (2017 - 2018) and the prior fiscal year (2016 - 2017) is presented in the MD&A.
Overview of the Financial Statements
This discussion and analysis is intended to serve as an introduction to the District’s basic financial statements. The District’s basic financial statements comprise three components: 1) government-wide financial statements, 2) fund financial statements, and 3) notes to the basic financial statements. This document also contains required and other supplementary information in addition to the basic financial statements themselves.
Government-wide financial statements. The government-wide financial statements are designed to provide readers with a broad overview of the District’s finances, in a manner similar to a private-sector business.
The statement of net position presents information on all of the assets, deferred outflows of resources, deferred inflows of resources and liabilities of the District, with the difference between the four reported as net position. Over time, increases or decreases in net position may serve as a useful indicator of whether the financial position of the District is improving or deteriorating. The statement of activities presents information showing how the net position of the District changed during the most recent fiscal year. All changes in net position are reported as soon as the underlying event giving rise to the change occurs, regardless of the timing of related cash flows. Thus, revenues and expenses are reported in this statement for some items that will only result in cash flows in future fiscal periods. The government-wide financial statements can be found on pages 20 - 21 of this report. Fund financial statements. A fund is a group of related accounts that is used to maintain control over resources that have been segregated for specific activities or objectives. The District, like other state and local governments, uses fund accounting to ensure and demonstrate compliance with finance-related legal requirements. All of the funds of the District can be divided into three categories: governmental funds, proprietary funds, and fiduciary funds.
10

Governmental funds. Governmental funds are used to account for essentially the same functions reported as governmental activities in the government-wide financial statements. However, unlike the government-wide financial statements, governmental fund financial statements focus on near-term inflows and outflows of spendable resources, as well as on balances of spendable resources available at the end of the fiscal year. Such information may be useful in evaluating government’s near-term financing requirements.
Because the focus of governmental funds is narrower than that of the government-wide financial statements, it is useful to compare the information presented for governmental funds with similar information presented for governmental activities in the government-wide financial statements. By doing so, readers may better understand the long-term impact of the government’s near-term financing decisions. Both the governmental fund balance sheet and the governmental fund statement of revenues, expenditures, and changes in fund balance provide a reconciliation to facilitate this comparison between governmental funds and governmental activities.
The District maintains four individual governmental funds. Information is presented separately in the governmental fund balance sheet and in the governmental fund statement of revenues, expenditures, and changes in fund balance for the general fund, special revenue fund, capital projects fund and debt service fund, all of which are considered to be major funds.
The District adopts an annual appropriated budget for its general fund, special revenue fund and debt service fund. Budgetary comparison statements have been provided as required supplementary information for the general fund and special revenue fund to demonstrate compliance with this budget and supplementary information for the debt service fund.
The basic governmental fund financial statements can be found on pages 22 - 24 of this report.
Proprietary funds. The District maintains two proprietary fund types. Proprietary funds
are used to report the same functions presented as business-type activities in the
government-wide financial statements. The District uses enterprise funds to account for
the operations of its food service and Pre-K Education programs, both of which are
considered major funds of the District. Proprietary funds provide the same type of
information as the government-wide financial statements, only in more detail.
The basic proprietary fund financial statements can be found on pages 25 - 27 of this report. Fiduciary funds. Fiduciary funds are used to account for resources held for the benefit of parties outside the governmental entity. Fiduciary funds are not reflected in the government-wide financial statements because the resources of those funds are not available to support the District’s own programs.
The District uses agency funds to account for resources held for student activities and groups, and payroll related liabilities. The basic fiduciary fund financial statements can be found on pages 28 - 29 of this report.
11

Notes to the basic financial statements. The notes provide additional information that is essential for a full understanding of the data provided in the government-wide and fund financial statements. The notes to the basic financial statements can be found on pages 30 -64 of this report. Other information. The combining statements referred to earlier in connection with governmental funds, enterprise funds and internal service funds are presented immediately following the notes to the basic financial statements. Combining and individual fund statements and schedules can be found on pages 70 - 91 of this report. Financial Highlights Government-wide Financial Analysis
As noted earlier, net position may serve over time as a useful indicator of a government’s financial position. The following table provides a summary of net position relating to the District’s governmental and business-type activities at June 30, 2018 and 2017:
Business Business
Governmental Type- Governmental Type-
Activities Activities Total Activities Activities Total
Current and other assets $ 1,532,045 $ 105,036 $ 1,637,081 $ 2,496,098 $ 405,090 $ 2,901,188
Capital assets, net 28,457,731 751 28,458,482 29,246,113 967 29,247,080
Total assets 29,989,776 105,787 30,095,563 31,742,211 406,057 32,148,268
Deferred outflows 813,697 813,697 1,282,783 1,282,783
Liabilities
Current liabilities 1,479,044 6,127 1,485,171 2,609,479 7,732 2,617,211
Net pension liability 2,268,605 2,268,605 3,543,778 3,543,778
Long Term Liabilities 30,105,036 30,105,036 28,603,181 28,603,181
Total liabilities 33,852,685 6,127 33,858,812 34,756,438 7,732 34,764,170
Deferred inflows 1,099,504 1,099,504 335,876 335,876
Net position
Net Investment in ,
Capital Assets 751 751 967 967
Restricted 1,264,330 1,264,330 1,390,349 1,390,349
Unrestricted (deficit) (5,413,046) 98,909 (5,314,137) (3,457,669) 397,358 (3,060,311)
Total net position $ (4,148,716) $ 99,660 $ (4,049,056) $ (2,067,320) $ 398,325 $ (1,668,995)
2018 2017
Key financial highlighted for the 2017-2018 fiscal year include the following:
Net position decreased $2,380,061 resulting from an increase in instructional and
support service expenses in Governmental Activities. There was also an increase in
Business-type activities expenses resulting from increased costs of running the food
service and Pre-K functions.
Consistent with the prior year, the State withheld the school district’s fiscal 2017-
2018 last two state aid payments until July 2018.
12

Significant changes to deferred outflows and deferred inflows of resources pertain
primarily to the impact of the changes in the GASB 68 net pension liability calculation
performed in the schedule of employer allocations and schedule of pension amounts by
employer. The changes in 2018 from the prior year resulted from changes in
assumptions calculated by the actuary in conjunction with the net pension liability
calculation for the measurement date of June 30, 2017 and rolled forward to June 30,
2018. The net pension liability associated with the District’s governmental activities at
June 30, 2018 amounted to $2,268,605, a decrease of $1,275,173 resulting from
changes in the actuarial calculation. Long-term liabilities decreased by bond principal
payments made in the amount of $1,220,000 partially offset by the $70,246 increase in
compensated absences payable.
A portion of the District’s net position (restricted) represents resources that are subject to
external restrictions on how they may be used, including funds reserved for future
maintenance service, capital reserve, excess surplus – prior year – designated for
subsequent years’ expenditures and capital projects. Restricted net position decreased
by $126,019 during the year ended June 30, 2018 mostly as a result of the decrease in
excess surplus – prior year – designated for subsequent year’s expenditures of
$199,498 offset by an increase of the maintenance reserve of $10 and increase of
restricted for debt service of $73,469. The remaining deficit balance ($5,413,046) of unrestricted net position reflects long-term
obligations, such as compensated absences and the net pension liability. Unrestricted
net position decreased mainly due to pension expense of $63,612 and correlating
pension deferrals. In addition, the District had a ($298,665) change in net position
relative to the enterprise funds of the District.
13

District activities. The key elements of the District’s changes in net position for the
years ended June 30, 2018 and 2017 are as follows:
Property tax revenue increased $374,198 as a result of the current year tax levy
increase.
State and federal aid not restricted to a specific purpose increased by $2,835,302, in
large part as a result of the increase in the reported amount of TPAF on-behalf amounts.
Instructional services increased by $2,194,288 due to an increase in regular programs
and special education instruction.
Interest on long-term debt increased by $1,756,263 in the current year based on
additional payment made in conjunction with the debt refunding.
Financial Analysis of the District’s Funds As noted earlier, the District uses fund accounting to ensure and demonstrate compliance with finance-related legal requirements. Governmental funds. The focus of the District’s governmental funds is to provide information on near-term inflows, outflows, and balances of spendable resources. Such information is useful in assessing the District’s financing requirements. The District’s fund balance amounts are classified as either restricted, committed, assigned or unassigned. As demonstrated by the various statements and schedules included in the financial section of this report, the District continues to meet its responsibility for sound financial management. The following schedule presents a summary of the General Fund, Special
Business Business
Governmental Type- Governmental Type-
Activities Activities Total Activities Activities Total
Revenues:
Program revenues:
Charges for services $ 717,259 $ 717,259 $ 636,769 $ 636,769
Operating grants and contributions $ 763,994 95,788 859,782 $ 1,049,682 94,502 1,144,184
Capital grants and contributions 29,336 29,336
General revenues:
Property taxes 20,957,674 20,957,674 20,583,476 20,583,476
State and federal aid not restricted to a
specific purpose 5,348,605 5,348,605 2,513,303 2,513,303
Investment Income 293 6,433 6,726 88 88
Miscellaneous 113,183 113,183 46,712 46,712
Total revenue 27,183,749 819,480 28,003,229 24,222,597 731,271 24,953,868
Expenses:
Instructional services 10,325,399 10,325,399 8,131,111 8,131,111
Support services 15,963,329 15,963,329 15,689,339 15,689,339
Interest on long term debt 2,976,417 2,976,417 1,220,154 1,220,154
Business Type Activities 1,118,145 1,118,145 878,173 878,173
Total expenses 29,265,145 1,118,145 30,383,290 25,040,604 878,173 25,918,777
Increase (decrease) in net position (2,081,396) (298,665) (2,380,061) (818,007) (146,902) (964,909)
Net position - beginning (2,067,320) 398,325 (1,668,995) (1,249,313) 545,227 (704,086)
Net position–ending $ (4,148,716) $ 99,660 $ (4,049,056) $ (2,067,320) $ 398,325 $ (1,668,995)
2018 2017
14

Revenue Fund and Debt Service Fund revenues for the fiscal year ended June 30, 2018, and the increases in relation to the prior year:
Percent Increase Percent of
Revenue Amount of Total from 2017 Increase
Local sources $ 21,070,857 85.15% $ 440,669 2.14%
State sources 3,189,381 12.89% 103,858 3.37%
Federal sources 483,985 1.96% 8,774 1.85%
Total $ 24,744,223 100.00% $ 553,301
The following schedule presents a summary of General Fund, Special Revenue Fund and Debt Service Fund expenditures for the fiscal year ended June 30, 2018 and the increases and (decreases) in relation to the prior year:
Increase Percent of
Percent (Decrease) Increase
Expenditures Amount of Total From 2017 (Decrease)
Current expenditures:
Instruction $ 5,534,696 22.05% 231,107$ 4.36%
Support services 17,297,435 68.91% 202,003 1.18%
Capital Outlay 186,258 0.74% 159,215 588.75%
Debt service:
Principal 1,220,000 4.86% 470,000 62.67%
Interest and Other Charges 682,074 2.72% (544,268) -44.38%
Cost of issuance 181,308 0.72% 181,308 100.00%
Total $ 25,101,771 100.00% 518,057$
Capital outlay increase by $159,215 due to purchases related to new school building
construction. Debt services principal increased by $395,000 and interest decreased by
$469,268 due to the effect of the current year debt refunding.
General Fund Fund balance in the General Fund decreased by $250,073 mostly due to a decrease in unassigned compared to prior year. Of the $1,284,313 fund balance in the General Fund, $1,022,523 is restricted in the capital reserve account, $100,010 is restricted in the maintenance reserve, $6,479 of encumbrances is assigned to other purposes, and $155,311 is unassigned. Special Revenue Fund
Expenditures in the Special Revenue Fund decreased as a result of a decrease in instruction and support services. The District has an undesignated deficit fund balance of $1,594 in the Special Revenue Fund as of June 30, 2018 as a result of the State deferring the payment of the final two state aid payments until July 2018.
For intergovernmental transactions, GASB Statement No. 33 requires that recognition
15

(revenue, expenditures, asset, and liability) should be in symmetry, i.e. if one government recognizes an asset, the other government recognizes a liability.
Capital Projects Fund The capital projects fund is used to account for financial resources to be used for the acquisition or construction of major capital facilities (other than those financed by proprietary funds). The fund balance in the Capital Projects Fund of $68,337 is the result of the unspent proceeds from transfers from capital reserve and state grant money that is being used for ongoing capital projects throughout the District.
Business Type Activities. The focus of the District’s business type activities is to provide information on near-term inflows, outflows, and balances of spendable resources related to the operations of its food service and adult and child care programs.
As demonstrated by the various statements and schedules included in the financial section of this report, the District continues to meet its responsibility for sound financial management. The following schedule presents a summary of the Enterprise funds revenues for the fiscal year ended June 30, 2018, and the increases in relation to the prior year:
Increase Percent of
Percent (Decrease) Increase
Revenue Amount of Total from 2017 (Decrease)
Local sources $ 723,692 88.31% $ 85,137 13.33%
State sources 4,263 0.52% 761 21.73%
Federal sources 91,525 11.17% (7,388) -7.47%
Total $ 819,480 100.00% $ 78,510
The increase in local sources is mainly attributable to an increase in the participation in the Pre K education programs as well as an increase in daily sales revenue for the food service program. The decrease in federal sources is mainly attributable to the decrease in the federal school lunch program reimbursements.
16

The following schedule presents a summary of the Enterprise fund operating expenses for the fiscal year ended June 30, 2018, and the increases in relation to the prior year:
Increase Percent of
Percent (Decrease) Increase
Expenditures Amount of Total From 2017 (Decrease)
Salaries $ 520,701 46.56% 210,571$ 67.9%
Employee benefits 182,330 16.31% (88,109) -32.6%
Supplies and materials 61,579 5.51% 22,844 59.0%
Cost of sales program 145,555 13.02% 15,385 11.8%
Other 207,980 18.60% 69,582 50.3%
$ 1,118,145 100.00% $ 230,273 25.9%
The increase in salaries is mainly attributable to the increase in salaries attributable to the Pre-K Fund. The increase in supplies and materials, employee benefits and other expenses is attributable to the as a result of increased staffing (salaries and ancillary benefits) related to the expanded Pre-K programs.
Food Service Fund The food service enterprise fund operated at a $55,411 deficit this year. Total revenues from daily food sales increased from the prior year by $24,340 as a result of increase in students which increase the meal claims from the prior year. Total operating expenses increased from the prior year by $61,567 or 19.3% due to an increase in cost of sales – nonreimbursable programs, supplies and materials and miscellaneous expenses. The net position of the food service fund, $99,660 is comprised of net position - investment in capital assets of $751 and unrestricted net position of $98,909. Pre K Education Fund The Pre K education fund realized operating revenue of $489,950 for the year ended June 30, 2018. Current year tuition revenues increased from the prior year by $56,150 as a result of increased participation in our preschool program, while operating expenses increased from the prior year by $168,706 as a result of increased staffing (salaries and ancillary benefits) related to the expanded programs. As a result, the fund generated net operating loss of $243,254. The net position of Pre K education fund is $0. Capital Assets and Debt Administration
Capital Assets. At June 30, 2018, the District’s governmental activities had capital
assets of $28,457,731 (net of accumulated depreciation), including land, construction in
progress, school buildings, machinery, equipment and vehicles.
17

The District’s governmental funds’ capital assets, net of depreciation consisted of the
following at June 30, 2018 and 2017:
The decrease in total capital assets is a result of the deprecation exceeding the
additions to construction by $788,382 in the current year.
Debt Administration. During the 2018 fiscal year, the District had outstanding long-term
liabilities of $31,003,180 of which $898,144 was classified as the current portion.
At June 30, 2018 and 2017, the District’s long-term liabilities consisted of:
Long-term liabilities increased mainly due to the bond premium on refunding which was
recorded during the year of $1,876,786. In addition, the increase in compensated
absences payable is due to employees of the district accruing more days at year end
than in the previous year. In addition, the District did not have any payouts during the
year. More detailed information about the District’s long-term liabilities and outstanding
debt can be found in Note 5 to the basic financial statements. General Fund Budgetary Highlights
The District budget is prepared according to New Jersey Statutes. The most significant
budgeted fund is the general fund. During the fiscal year, there were several differences
between the original budget and the final amended budget as a result of transfers being
applied to certain line items. These transfers were made between line items as part of the
normal process as permitted by State guidelines. Readers should refer to Section C of the
financial report for comparisons between actual and budgeted amounts.
Described below are explanations for variations in realized revenues and expenditures for those lines where the final budgeted amounts differ from the actual amounts by more than
2018 2017
Land $ 179,988 $ 179,988
Construction in progress 73,340 73,340
Site improvements, net 371,347 402,651
Buildings and building improvements, net 26,903,681 27,757,784
Machinery, equipment, and vehicles, net 929,375 832,350
Total capital assets, net $ 28,457,731 $ 29,246,113
June 30,
2018 2017
Bonds payable $ 28,860,000 $ 29,553,000
Unamortized premium on bonds 1,802,753
Compensated absences payable 340,427 270,181
Total long-term liabilities $ 31,003,180 $ 29,823,181
June 30
18

$300,000 and 5%. All other fluctuations less than $300,000 and 5% are considered immaterial.
On-behalf TPAF pension and reimbursed social security contributions are unbudgeted revenue sources. Consequently, actual revenues as well as the related expenditures exceeded the final budgeted amount by 100.0%.
Requests for Information
This financial report is designed to provide a general overview of the Borough of
Edgewater District’s finances for all those with an interest in the government’s finances.
Questions concerning any of the information provided in this report or requests for
additional financial information should be addressed to the Office of the School Business
Administrator, 251 Undercliff Avenue, Edgewater, New Jersey 07020.
19

BASIC FINANCIAL STATEMENTS

GOVERNMENT-WIDE FINANCIAL STATEMENTS

Borough of Edgewater School District
Statement of Net Position
June 30, 2018
A-1
Governmental Business-type
Assets Activities Activities Total
Cash and cash equivalents 149,016$ 132,955$ 281,971$
Accounts receivable 377,229 6,048 383,277
Inventories 4,673 4,673
Internal balances 38,640 (38,640) -
Restricted assets:
Cash and cash equivalents 967,160 967,160
Capital assets, non-depreciable 253,328 253,328
Capital assets, depreciable, net 28,204,403 751 28,205,154
Total Assets 29,989,776 105,787 30,095,563
Deferred outflows of resources
Pension deferrals 813,697 813,697
Liabilities
Accounts payable 180,431 180,431
Payable to state government 4,157 4,157
Accrued interest payable 368,162 368,162
Unearned revenue 28,150 6,127 34,277
Net pension liability 2,268,605 2,268,605
Current portion of long-term obligations 898,144 898,144
Noncurrent portion of long-term obligations 30,105,036 30,105,036
Total liabilities 33,852,685 6,127 33,858,812
Deferred inflows of resources
Pension deferrals 1,099,504 1,099,504
Net position
Net investment in capital assets 751 751
Restricted for:
Capital projects 68,337 68,337
Debt service 73,470 73,470
Excess Surplus - prior year - designated for
subsequent year's expenditures
Maintenance reserve 100,010 100,010
Capital reserve 1,022,513 1,022,513
Unrestricted (deficit) (5,413,046) 98,909 (5,314,137)
Total net position (4,148,716)$ 99,660$ (4,049,056)$
See Accompanying Notes to Financial Statements
20

Borough of Edgewater School District
Statement of Activities
For The Year Ended June 30, 2018
A-2
Operating
Charges for Grants and Governmental Business-type
Functions/Programs Expenses Services Contributions Activities Activities Total
Governmental activities:
Instruction:
Regular 7,937,022$ 668,349$ (7,268,673)$ (7,268,673)$
Special education 1,848,632 (1,848,632) (1,848,632)
Other special instruction 512,939 (512,939) (512,939)
Other instruction 26,806 (26,806) (26,806)
Support Services:
Tuition 8,169,206 (8,169,206) (8,169,206)
Student & instruction related services 2,354,975 95,645 (2,259,330) (2,259,330)
General administration 636,341 (636,341) (636,341)
School administration 659,510 (659,510) (659,510)
Central admin and inform technology 590,283 (590,283) (590,283)
Required maintenance of plant services 1,618,067 (1,618,067) (1,618,067)
Student transportation 1,934,947 (1,934,947) (1,934,947)
Interest and other charges on long term obligations 2,976,417 (2,976,417) (2,976,417)
Total Governmental Activities 29,265,145 763,994 (28,501,151) (28,501,151)
Business-type activities:
Food Service 380,658 227,309$ 95,788 (57,561)$ (57,561)
Preschool Education 737,487 489,950 (247,537) (247,537)
Total Business-Type Activities 1,118,145 717,259 95,788 (305,098) (305,098)
Total Primary Government 30,383,290 717,259 859,782 (28,501,151) (305,098) (28,806,249)
General revenues
Property taxes, levied for general purposes 19,069,096 19,069,096
Taxes levied for debt service 1,888,578 1,888,578
State and federal sources 5,348,605 5,348,605
Interest and miscellaneous income 113,476 6,433 119,909
Total general revenues 26,419,755 6,433 26,426,188
Change in net position (2,081,396) (298,665) (2,380,061)
Net position - beginning (2,067,320) 398,325 (1,668,995)
Net position - ending (4,148,716)$ 99,660$ (4,049,056)$
Net (Expense) Revenue and Changes in Net PositionProgram Revenues
See Accompanying Notes to Financial Statements
21

FUND FINANCIAL STATEMENTS

GOVERNMENTAL FUNDS

Borough of Edgewater School District
Balance Sheet
Governmental Funds
June 30, 2018 B-1
Special Capital Debt Total
General Revenue Projects Service Government
ASSETS Fund Fund Fund Fund Funds
Cash and Cash Equivalents 72,418$ 3,128$ 73,470$ 149,016$
Accounts Receivable:
Federal 37,847 37,847
State 170,722$ 166,152 336,874
Other 8 8
Interfund 231,245 231,245
Restricted Cash and Cash Equivalents 967,160 967,160
Total Assets 1,369,135$ 110,265$ 169,280$ 73,470$ 1,722,150$
LIABILITIES AND FUND BALANCES:
Liabilities:
Accounts Payable 75,212$ 75,212$
Interfunds Payable 9,610 79,552$ 100,943$ 190,105
Payable to State Government 4,157 4,157
Unearned Revenue 28,150 28,150
Total Liabilities 84,822 111,859 100,943 297,624
FUND BALANCE:
Restricted for:
Maintenance reserve 100,010 100,010
Capital reserve 1,022,513 1,022,513
Debt service 73,470$ 73,470
Capital projects 68,337 68,337
Assigned to:
Other purposes 6,479 6,479
Unassigned 155,311 (1,594) 153,717
Total Fund Balance 1,284,313 (1,594) 68,337 73,470 1,424,526
Total Liabilities and Fund Balance 1,369,135$ 110,265$ 169,280$ 73,470$
Amounts reported for governmental activities in the statement ofnet position (A-1) are different because:
Capital assets used in governmental activities are not financial
resources and therefore are not reported in the funds. The cost
of the Capital assets are $37,676,884. and the accumulated depreciation
is $9,219,153. 28,457,731
Deferred pension costs in governmental activities are not financial
resources and are therefore not reported in the funds. (285,807)
Net pension liability is not due and payable in the current period and
therefore is not reported as a liability in the funds. (2,268,605)
Accrued pension contributions for the June 30, 2018 plan year are
not paid with current economic resources and are therefore not
reported as a liability in the funds, but are included in accounts
payable in the government-wide statement of net position. (105,219)
Accrued interest on long-term debt is not due and payable in the
current period and therefore is not reported as a liability in the funds. (368,162)
Long-term liabilities, including bonds payable and compensated absences,
are not due and payable in the current period and therefore are not reported
as liabilities in the funds (See Note 7). (31,003,180)
Net position of governmental activities (4,148,716)$
See Accompanying Notes to Financial Statements
22

Borough of Edgewater School District
Statement of Revenues, Expenditures and Changes in Fund Balance
Governmental Funds
June 30, 2018
B-2
Special Capital Debt Total
General Revenue Projects Service Government
Fund Fund Fund Fund Funds
Revenues
Local Services:
Local Tax Levy 19,069,096$ 1,888,578$ 20,957,674$
Miscellaneous 113,183 293$ 113,476
Total - Local Services 19,182,279 293 1,888,578 21,071,150
State Sources 2,822,407 280,009$ 86,965 3,189,381
Federal Sources 483,985 483,985
Total Revenues 22,004,686 763,994 293 1,975,543 24,744,516
Expenditures
Current:
Instruction 4,867,004 667,692 5,534,696
Support Services-current:
Instruction 8,169,206 8,169,206
Attendance and Social Work Services 31,298 31,298
Health services 138,700 138,700
Support services 1,147,459 95,645 1,243,104
School library 105,361 105,361
Instructional staff training 65,711 65,711
General administration 379,775 379,775
School administration 340,354 340,354
Central services and information
technology 323,158 323,158
Required maintenance of plant services 283,320 283,320
Operation of plant 729,515 729,515
Student transportation 1,659,064 1,659,064
Unallocated benefits 2,224,237 2,224,237
On-behalf pension
contributions 1,210,365 1,210,365
Reimbursed TPAF social security
contributions 394,267 394,267
Capital outlay 186,258 - 186,258
Debt Service:
Principal 1,220,000 1,220,000
Interest 682,074 682,074
Cost of issuance 181,308 181,308
Total Expenditures 22,255,052 763,337 - 2,083,382 25,101,771
Deficiency of revenues under expenditures (250,366) 657 293 (107,839) (357,255)
Other financing sources (uses):
Refunding bonds issued 26,565,000 26,565,000
Transfers in 293 293
Transfers out (293) (293)
Premium on bonds issued 1,876,786 1,876,786
Payment to refunding bond escrow agent (28,260,478) (28,260,478)
Total Other Financing Sources (Uses) 293 - (293) 181,308 181,308
Net change in fund balances (250,073) 657 - 73,469 (175,947)
Fund balances, beginning 1,534,386 (2,251) 68,337 1 1,600,473 Fund balances, ending 1,284,313$ (1,594)$ 68,337$ 73,470$ 1,424,526$
The reconciliation of the fund balances of governmental funds to the net position of governmental activities in the statement of activities is
presented in an accompanying schedule (B-3).
23

B-3
Total net change in fund balances - governmental funds (from B-2) (175,947)$
Amounts reported for governmental activities in the statement of activities (A-2) are
different because:
Capital outlays are reported in governmental funds as expenditures. However, in the
statement of activities, the cost of those assets is allocated over their estimated
useful lives as depreciation expense. This is the amount by which depreciation
exceeded capital outlays in the period.
Depreciation Expense (944,459)$
Capital Outlays 156,077 (788,382)
Governmental fund report the effect of premiums and similar items when debt is first
issued, whereas these amounts are deferred and amortized in the statement of
activities. This amount is the net effect of these differences.
Amortization on Premium on Bonds 74,033
Premium on Bonds Received (1,876,786) (1,802,753)
The issuance of long-term debt for general and refunding purposes provides current
financial resources to governmental funds, however has no effect on net position.
Refunding Bonds Issued (26,565,000)
Bonds refunded 26,038,000 (527,000)
Repayments of bond principal are expenditure in the governmental funds, but the
repayment reduces long-term liabilities in statement of net position and is not reported
in the statement of activities.
Serial bonds payable 1,220,000
In the statement of activities, interest on long-term debt in the statement of activities
is accrued, regardless of when accrued, regardless of when due. In the governmental
funds, interest is reported when due. When accrued interest exceeds the interest
paid, the difference is a reduction in the reconciliation (-); when the interest paid
exceeds the accrued interest, the difference is an addition to the reconciliation (+). 35,410
Certain expenses reported in the Statement of Activities do not require the use of
current financial resources and therefore are not reported as expenditures in the
governmental funds
Pension expense 27,522
In the statement of activities, certain operating expenses, e.g. compensated
absences (vacations), are measured by the amounts earned during the year. In the
governmental funds, however, expenditures for these items are reported in the
amount of financial resources used (paid). When the earned amount exceeds the
paid amount, the difference is a reduction in the reconciliation (-); when the paid
amount exceeds the earned amount, the difference is an addition to the reconciliation
(+). (70,246)
Change in Net Position of Governmental Activities (Exhibit A-2) (2,081,396)$
Borough of Edgewater School District
Reconciliation of Statement of Revenues, Expenditures
and Changes in Fund Balances of Governmental Funds
To The Statement of Activities
For The Year Ended June 30, 2018
See Accompanying Notes to Financial Statements
24

PROPRIETARY FUNDS

Borough of Edgewater School District
Proprietary Fund
Statement of Net Position
As of June 30, 2018B-4
Food Service Pre - K Total
Assets
Current Assets:
Cash and cash equivalents 84,705$ 48,250$ 132,955$
Accounts receivable:
Federal 5,520 5,520
State 380 380
Other 148 148
Interfunds receivable 9,610 50,404 60,014
Inventories 4,673 4,673
Total current assets 105,036 98,654 203,690
Capital assets:
Depreciable buildings and equipment 65,248 65,248
Accumulated depreciation (64,497) (64,497)
Total capital assets, net 751 751
Total assets 105,787 98,654 204,441
Liabilities
Current liabilities:
Interfunds payable 98,654 98,654
Unearned revenue 6,127 6,127
Total current liabilities 6,127 98,654 104,781
Total liabilities 6,127 98,654 104,781
Net position
Net Investment in capital assets 751 751
Unrestricted 98,909 98,909
Total net position 99,660$ -$ 99,660$
See Accompanying Notes to Financial Statements
25

Borough of Edgewater School District
Proprietary Fund
Statement of Revenues, Expenses
and Changes in Fund Net Position
For The Year Ended June 30, 2018
B-5
Food Service Pre - K Total
Operating revenues:
Local sources:
Daily sales - reimbursable programs 208,915$ 208,915$
Daily sales - non-reimbursable programs 18,394 18,394
Tuition 489,950$ 489,950
Total operating revenues 227,309 489,950 717,259
Operating expenses:
Cost of sales - reimbursable programs 135,744 135,744
Cost of sales - non-reimbursable programs 9,811 9,811
Salaries 104,187 416,514 520,701
Employee benefits 23,988 158,342 182,330
General supplies 17,134 44,445 61,579
Transportation 36,826 36,826
Miscellaneous 80,917 81,360 162,277
Depreciation 216 216
Management fee 8,661 8,661
Total operating expenses 380,658 737,487 1,118,145
Operating (loss) income (153,349) (247,537) (400,886)
Nonoperating revenues:
State sources:
State school lunch program 4,263 4,263
Federal sources:
National school lunch program 59,311 59,311
PB lunch - HHFKA 5,044 5,044
School breakfast program 1,113 1,113
Food distribution program 26,057 26,057
Interest and investment revenue 2,150 4,283 6,433
Total nonoperating revenues 97,938 4,283 102,221
Change in net position (55,411) (243,254) (298,665)
Total net position, beginning of year 155,071 243,254 398,325
Total net position, end of year 99,660$ -$ 99,660$
See Accompanying Notes to Financial Statements
26

Borough of Edgewater School District
Proprietary Fund
Statement of Cash Flows
For The Year Ended June 30, 2018
B-6
Food Service Pre - K Total
Cash flows from operating activities
Receipts from customers 226,033$ 489,950$ 715,983$
Payments to operating personnel (112,848) (416,514) (529,362)
Payments for operating personnel benefits (23,988) (158,342) (182,330)
Payments to suppliers (472,832) (659,051) (1,131,883)
Net cash used in operating activities (383,635) (743,957) (1,127,592)
Cash flows from noncapital financing activities
Cash received from state and federal reimbursements 94,956 94,956
Net cash provided by noncapital financing activities 94,956 94,956
Cash flows from investing activities
Interest revenue 2,150 4,283 6,433
Net cash provided by investing activities 2,150 4,283 6,433
Net decrease in cash and cash equivalents (286,529) (739,674) (1,026,203)
Cash and cash equivalents, beginning of year 371,234 787,924 1,159,158
Cash and cash equivalents, end of year 84,705$ 48,250$ 132,955$
Reconciliation of operating loss to net cash used in operating
activities:
Operating (loss) (153,349)$ (247,537)$ (400,886)$
Adjustments to reconcile operating (loss) to net cash
used in operating activities:
Depreciation 216 216
Changes in assets and liabilities:
Decrease in accounts receivable 329 329
Decrease in inventories 272 272
(Decrease) in interfund payable (219,888) (446,016) (665,904)
(Increase) in interfund receivable (9,610) (50,404) (60,014)
(Decrease) in unearned revenue (1,605) (1,605)
Net cash used in operating activities (383,635)$ (743,957)$ (1,127,592)$
Noncash capital financing activities
The District received $26,057 of food commodities from the U.S. Department of Agriculture for the year ended June 30, 2018.
See Accompanying Notes to Financial Statements
27

FIDUCIARY FUNDS

Borough of Edgewater School District
Statement of Fiduciary Net Position
Fiduciary Funds
June 30, 2018
B-7
Agency Fund
Assets
Cash and cash equivalents 76,531$
Total assets 76,531$
Liabilities
Accounts payable 5,394$
Payroll deductions and withholdings payable 43,967
Interfund payable 2,500
Due to student groups 24,670
Total liabilities 76,531$
See Accompanying Notes to Financial Statements
28

B-8
Borough of Edgewater School District
Statement of Changes in Fiduciary Net Position
Fiduciary Funds
For The Year Ended June 30, 2018
NOT APPLICABLE
See Accompanying Notes to Financial Statements
29

NOTES TO THE BASIC FINANCIAL STATEMENTS

Borough of Edgewater School District
Notes to the Basic Financial Statements
Year ended June 30, 2018 1. Summary of Significant Accounting Policies
The financial statements of the Borough of Edgewater School District (the “District”) have been prepared
in conformity with accounting principles generally accepted in the United States (GAAP) as applied to
governmental units. The Governmental Accounting Standards Board (GASB) is the accepted standard-
setting body for establishing governmental accounting and financial reporting principles. The more
significant of the District’s accounting policies are disclosed below:
A. Reporting Entity
The financial reporting entity consists of (a) the primary government, (b) organizations for which the
primary government is financially accountable, and (c) other organizations for which the nature and
significance of their relationship with the primary government are such that exclusion would cause the
reporting entity’s financial statements to be misleading or incomplete.
The definition of the reporting entity is based primarily on the notion of financial accountability. A primary
government is financially accountable for the organizations that make up its legal entity. It is also
financially accountable for legally separate organizations if its officials appoint a voting majority of an
organization’s governing body and either it is able to impose its will on that organization or there is a
potential for the organization to provide specific financial benefits to, or to impose specific financial
burdens on, the primary government. A primary government may also be financially accountable for
governmental organizations that are fiscally dependent on it.
The District, as the primary government for financial reporting entity purposes, has oversight
responsibility and control over all activities related to the Borough of Edgewater School District in
Manchester Township, New Jersey. The District receives funding from local, state, and federal
government sources and must comply with the requirements of these funding source entities.
The District has no component units that are required to be included within the reporting entity, as set
forth in Section 2100 of the GASB Codification of Governmental Accounting and Financial Reporting
Standards.
B. Government-wide and Fund Financial Statements
The government-wide financial statements (i.e., the statement of net position and the statement of
activities) report information on all of the nonfiduciary activities of the District. For the most part, the effect
of interfund activity has been removed from these statements. Governmental activities, which
30

Borough of Edgewater School District
Notes to the Basic Financial Statements
Year ended June 30, 2018
1. Summary of Significant Accounting Policies (continued)
normally are supported by taxes and intergovernmental revenues, are reported separately from
business-type activities, which rely to a significant extent on fees and charges for support.
The statement of activities demonstrates the degree to which the direct expenses of a given function or
segments are offset by program revenues. Direct expenses are those that are clearly identifiable with a
specific function. Program revenues include (1) charges to students or applicants who purchase, use, or
directly benefit from goods, services, or privileges provided by a given function and (2) grants and
contributions that are restricted to meeting the operational or capital requirements of a particular function.
Taxes and other items not properly included among program revenues are reported instead as general
revenues.
Separate financial statements are provided for governmental funds, proprietary funds, and fiduciary
funds, even though the latter are excluded from the government-wide financial statements. Major
individual governmental funds and major individual proprietary funds are reported as separate columns
in the fund financial statements. The New Jersey Department of Education (“DOE”) requires all funds be
reported as major to promote consistency among school districts in the State of New Jersey.
C. Measurement Focus, Basis of Accounting and Financial Statement Presentation
The government-wide financial statements are reported using the economic resources measurement
focus and the accrual basis of accounting, as are the proprietary fund and fiduciary fund financial
statements. Revenues are recorded when earned and expenses are recorded when a liability is incurred,
regardless of the timing of related cash flows. Property taxes are recognized as revenues in the year for
which they are levied. Grants and similar items are recognized as revenue as soon as all eligibility
requirements imposed by the provider have been met.
Governmental fund financial statements are reported using the current financial resources measurement
focus and the modified accrual basis of accounting. Revenues are recognized as soon as they are both
measurable and available. Revenues are considered to be available when they are collectible within the
current period or soon enough thereafter to pay liabilities of the current period. For this purpose, the
District considers revenues to be available if they are collected within sixty days of the end of the current
fiscal period, except for reimbursement grants. The District considers revenues to be available if they are
collected within one year of the end of the current fiscal period. Expenditures generally are recorded
when a liability is incurred, as under accrual accounting. However, debt service expenditures, as well as
expenditures related to compensated absences, the net pension liability and capital leases, are recorded
only when payment is due.
31

Borough of Edgewater School District
Notes to the Basic Financial Statements
Year ended June 30, 2018
1. Summary of Significant Accounting Policies (continued)
Property taxes, interest, and state equalization monies associated with the current fiscal period are all
considered to be susceptible to accrual and so have been recognized as revenues of the current fiscal
year. All other revenue items are considered to be measurable and available only when the District
receives cash.
The District has reported the following major governmental funds:
General Fund: The general fund is the general operating fund of the District and is used to
account for all financial resources except those required to be accounted for in another fund.
Included are certain expenditures for vehicles and movable instructional or non-instructional
equipment, which are classified in the capital outlay sub-fund.
Special Revenue Fund: The District maintains one special revenue fund, which includes the
proceeds of specific revenue sources that are restricted or committed to expenditures for
specified purposes, other than debt service or capital projects.
Capital Projects Fund: The capital projects fund is used to account for and report financial
resources that are restricted, committed, or assigned to an expenditure for capital outlays,
including the acquisition or construction of major capital facilities and other capital assets (other
than those financed by proprietary funds). The financial resources are derived from temporary
notes or serial bonds and state aid that are specifically authorized by the voters as a separate
question on the ballot either during the annual election or at a special election.
Debt Service Fund: The debt service fund accounts for and reports financial resources that are
restricted, committed, or assigned to an expenditure for the principal and interest on long-term
general obligation debt of governmental funds.
The District reports the following major proprietary funds:
Food Service Enterprise Fund: The food service fund accounts for all revenues and expenses
pertaining to cafeteria operations. The food service fund is utilized to account for operations that
are financed and operated in a manner similar to private business enterprises. The stated intent is
that the cost (i.e., expenses including depreciation and indirect costs) of providing goods or services
to the students on a continuing basis are financed or recovered primarily through user charges.
Pre-Kindergarten Enterprise Fund: The Pre-K fund was established by the District for Fiscal Year
2013. The stated intent is that the costs of maintaining a Pre-K program (including both direct and
indirect costs) of providing those services to the students are financed through tuition payments.
32

Borough of Edgewater School District
Notes to the Basic Financial Statements
Year ended June 30, 2018
1. Summary of Significant Accounting Policies (continued)
Additionally, the District reports the following fund types:
Fiduciary funds of the District include the Student Activities Agency Fund, Payroll Agency Fund and
Private Purpose Scholarship Trust Fund. The trust fund is reported using the economic resources
measurement focus. Agency funds are purely custodial (assets equal liabilities) and thus do not involve
measurements of results of operations. The following is a description of the fiduciary funds of the District.
Agency funds are purely custodial (assets equal liabilities) and thus do not involve measurements of
results of operations. The following is a description of the fiduciary funds of the District.
Agency Funds (Payroll and Student Activity Fund): Agency funds are used to account for the assets
that the District holds on behalf of others as their agent. Agency funds are custodial in nature and do
not involve measurement of results of operations.
Amounts reported as program revenues include (1) charged to customers or applicants for goods,
services, or privileges provided, (2) operating grants and contributions, and 3) capital grants and
contributions. Internally dedicated resources are reported as general revenues rather than as program
revenues. Likewise, general revenues include all taxes.
Proprietary funds distinguish operating revenues and expenses from nonoperating items. Operating
revenues and expenses generally result from providing services and producing and delivering goods in
connection with a proprietary fund’s principal ongoing operations. The principal operating revenues of
the District enterprise funds are charges for sales of food and tuition. Operating expenses for enterprise
funds include the cost of sales, administrative expenses, and depreciation on capital assets. All revenues
and expenses not meeting this definition are reported as nonoperating revenues and expenses.
The District reports unearned revenue on its statement of net position and balance sheet. Unearned
revenue arises when resources are received by the District before it has legal claim to them, as when
federal assistance is received prior to the incurrence of qualifying expenditures. In subsequent periods,
when both revenue recognition criteria are met, or when the District has a legal claim to the resources,
the liability for unearned revenue is removed from the balance sheet and revenue is recognized.
Ad Valorem (Property) taxes are susceptible to accrual as, under New Jersey State Statute, a
municipality is required to remit to its school district the entire balance of taxes in the amount certified
prior to the end of the school year. The District records the entire approved tax levy as revenue (accrued)
at the start of the fiscal year, since the revenue is both measurable and available. The District is entitled
to receive moneys under the established payment schedule and the unpaid amount is considered to be
an “accounts receivable.”
33

Borough of Edgewater School District
Notes to the Basic Financial Statements
Year ended June 30, 2018
1. Summary of Significant Accounting Policies (continued)
The County Board of Taxation is responsible for the assessment of properties and the Township Tax
Collector is responsible for collection of taxes. Assessments are certified and taxes are levied on
January 1; taxes are due February 1, May 1, August 1 and November 1. Unpaid taxes are considered
delinquent the following January 1 and are then subject to lien.
D. Budgets/Budgetary Control
In accordance with P.L. 2011, which became effective January 17, 2012, the District elected to move the
annual school board election from April to the date of the annual November general election, thereby
eliminating the vote on the annual based budget. Annual appropriated budgets are prepared in the spring
of each year for the general, special revenue and debt service funds. The budgets are submitted to the
Bergen County office of the DOE for approval. Budgets are prepared using the modified accrual basis
of accounting and the special revenue fund uses a non-GAAP budget (budgetary basis). The legal level
of budgetary control is established at line item accounts within each fund. Line item accounts are defined
as the lowest (most specific) level of detail as established pursuant to the minimum chart of accounts
referred in N.J.A.C. 6A:23. The overexpenditure in the general fund is due to the inclusion of the non-
budgeted on behalf payments made by the State of New Jersey as District expenditures. These amounts
are offset by related revenues and as such do not represent budgetary overexpenditures. All budget
amendments must be approved by School Board resolution. Budget amendments were made during
the year ended June 30, 2018 and were not significant.
Formal budgetary integration into the accounting system is employed as a management control device
during the year. For governmental funds, there are no substantial differences between the budgetary
basis of accounting and accounting principles generally accepted in the United States with the exception
of the legally mandated revenue recognition of the last state aid payments for budgetary purposes only
and the special revenue fund as noted below. Encumbrance accounting is also employed as an
extension of formal budgetary integration in the governmental fund types. Open encumbrances at year-
end are reappropriated in the subsequent year’s budget. Unencumbered appropriations lapse at fiscal
year-end.
The accounting records of the special revenue fund are maintained on the grant accounting budgetary
basis. The grant accounting budgetary basis differs from GAAP in that the grant accounting budgetary
basis recognizes encumbrances as expenditures and also recognizes the related revenues, whereas the
GAAP basis does not. Sufficient supplemental records are maintained to allow for the presentation of
GAAP basis financial reports.
E. Interfund Receivables/Payables
Interfund receivables/payables represent amounts that are owed, other than charges for goods or
services rendered to/from a particular fund in the District and that are due within one year.
34

Borough of Edgewater School District
Notes to the Basic Financial Statements
Year ended June 30, 2018
1. Summary of Significant Accounting Policies (continued)
F. Inventories
Inventories, which benefit future periods, other than those recorded in the enterprise fund, are recorded
as an expenditure during the year of purchase. Enterprise fund inventories are valued at cost, which
approximates market, using the first-in, first-out (FIFO) method.
G. Capital Assets
Capital assets, which include land, construction in progress, buildings and equipment, are reported in the
applicable governmental or business-type activities columns in the government-wide financial
statements. Capital assets are defined by the District as assets with an initial, individual cost of more
than $2,000 and an estimated useful life in excess of two years. Such assets are recorded at historical
cost or through estimation procedures performed by an independent appraisal company. Donated
capital assets are valued at their estimated fair value on the date of donation. The costs of normal repairs
and maintenance that do not add to the value of the asset or materially extend the assets lives are not
capitalized.
Buildings, machinery and equipment of the District is depreciated using the straight line method. The
following estimated useful lives are used to compute depreciation:
Years
Buildings
Building improvements
Site improvements
Machinery and equipment
50
10-50
20
10-15
Computer and related tech 5
Vehicles 8
H. Compensated Absences
A liability for compensated absences that are attributable to services already rendered and that are not
contingent on a specific event that is outside the control of the employer and employee is accrued as
employees earn the rights to the benefits. The District uses the “vesting method” for estimating its
accrued sick and vacation leave liability.
District employees are granted vacation and sick leave in varying amounts under the District’s personnel
policies. In the event of termination, an employee is reimbursed for accumulated vacation. Sick leave
benefits provide for ordinary sick pay and begin vesting with the employee after one year of service. The
liability for vested compensated absences of the District is recorded in the government-wide financial
statements and includes salary related payments. The liability for vested compensated absences of the
35

Borough of Edgewater School District
Notes to the Basic Financial Statements
Year ended June 30, 2018
1. Summary of Significant Accounting Policies (continued)
proprietary fund types is recorded within those funds as the benefits accrue to employees. As of June
30, 2018, a liability existed for compensated absences in the government-wide financial statements in
the amount of $340,427 and no liability existed for compensated absences in the proprietary fund types.
I. Deferred Outflows/Inflows of Resources
In addition to assets, the statement of net position will sometimes report a separate section for deferred
outflows of resources. This separate financial statement element, deferred outflows of resources,
represents a consumption of net position that applies to a future period(s) and so will not be recognized
as an outflow of resources (expense/expenditure) until then. Currently, the District has one item that
qualifies for reporting in this category, deferred amounts related to pensions. In addition to liabilities, the
statement of net position will sometimes report a separate section for deferred inflows of resources. This
separate financial statement element, deferred inflows of resources, represents an acquisition of net
position that applies to future periods and so will not be recognized as an inflow of resources (revenue)
until that time. The District has one item that qualifies for reporting in this category, deferred amounts
related to pensions.
J. Long-Term Obligations
In the government-wide financial statements, and proprietary fund types in the fund financial statements,
long-term debt and other long-term obligations are reported as liabilities in the applicable governmental
activities, business-type activities, or proprietary fund type statement of net position. Bond premiums
and discounts are deferred and amortized over the life of the bonds using the straight-line method which
approximates the effective interest method. Bonds payable are reported net of the applicable bond
premium or discount.
In the fund financial statements, governmental fund types recognize bond premiums and discounts
during the current period. The face amount of debt issued is reported as other financing
sources. Premiums received on debt issuances are reported as other financing sources while discounts
on debt issuances are reported as other financing uses. Issuance costs, whether or not withheld from
the actual debt proceeds received, are reported as either capital projects fund or debt service fund
expenditures.
K. Net Position
Net Position represents the difference between assets, deferred outflows of resources, deferred inflows
of resources, and liabilities in the government-wide financial statements. Net position net investment in
capital assets consists of capital assets, net of accumulated depreciation, reduced by the outstanding
balance of any long-term debt used to build or acquire the capital assets. Net position is reported as
36

Borough of Edgewater School District
Notes to the Basic Financial Statements
Year ended June 30, 2018
1. Summary of Significant Accounting Policies (continued)
restricted in the government-wide financial statements when there are limitations imposed on their use
through external restrictions imposed by creditors, grantors, or laws or regulations of other governments.
L. Fund Balances
GASB Statement No. 54, Fund Balance Reporting and Governmental Fund Type Definitions (“GASB
54”) established fund balance classifications that comprise a hierarchy based primarily on the extent
to which a government is bound to observe constraints imposed upon the use of the resources
reported in governmental funds. Under GASB 54, fund balances in the governmental funds financial
statements are reported under the modified accrual basis of accounting and classified into the
following five categories, as defined below:
1) Nonspendable – includes amounts that cannot be spent because they are either (a) not
in spendable form or (b) legally or contractually required to be maintained intact. Assets
included in this fund balance category include prepaid assets, inventories, long-term
receivables, and corpus of any permanent funds.
2) Restricted - includes amounts that can be spent only for the specific purposes stipulated
by constitution, external resource providers, or through enabling legislation.
3) Committed - includes amounts that can be used only for the specific purposes imposed
by a formal action of the government’s highest level of decision-making authority. The
District’s highest level of decision-making authority is the Board of Education (the “Board”)
and formal action is taken by resolution of the Board at publicly held meetings. Once
committed, amounts cannot be used for other purposes unless the Board revises or
changes the specified use by taking the same action (resolution) taken to originally
commit these funds.
4) Assigned – amounts intended to be used by the government for specific purposes but do
not meet the criteria to be classified as restricted or committed. Interest is expressed by
either the Board or Business Administrator, to whom the Board has delegated the
authority to assign amounts to be used for specific purposes, including the encumbering
of funds.
5) Unassigned - includes all spendable amounts not contained in the other classifications in
the general fund. This classification represents fund balance that has not been assigned
to other funds and that has not been restricted, committed or assigned to specific
purposes within the general fund. The general fund is the only fund that reports a positive
unassigned fund balance amount. In the other governmental funds, if expenditures
incurred for specific purposes exceed the amounts restricted, committed or assigned to
those purposes, it may be necessary to report a negative unassigned fund balance.
37

Borough of Edgewater School District
Notes to the Basic Financial Statements
Year ended June 30, 2018
1. Summary of Significant Accounting Policies (continued)
When both restricted and unrestricted resources are available for use, it is the District’s policy to use
restricted resources first, then unrestricted resources as they are needed. For the unrestricted fund
balance, the District first spends committed funds, then assigned funds, and finally, unassigned
funds.
Of the $1,284,313 of fund balances in the General Fund, $6,479 of encumbrances are assigned to
other purposes, $1,122,523 has been classified as restricted for maintenance reserve and capital
reserve in the amounts of $100,010 and $1,022,513, respectively, and $155,311 is classified as
unassigned. All of the fund balance in the Special Revenue Fund in the amount of $(1,594) is
classified as unassigned. All of the fund balance in the Capital Projects Fund in the amount of
$68,337 is restricted for capital projects. All of the fund balance in the Debt Service Fund in the
amount of $73,470 is restricted for future debt service payments.
N. Management Estimates
The preparation of financial statements in conformity with accounting principles generally accepted in the
United States requires management to make estimates and assumptions that affect the reported
amounts of revenues and expenditures/expenses during the reporting period. Actual results could differ
from those estimates.
O. On-Behalf Payments
Revenues and expenditures of the general fund include payments made by the State of New Jersey for
social security and post-retirement medical and pension contributions for certified teachers and other
members of the New Jersey Teachers Pension and Annuity Fund. The amounts are not required to be
included in the District’s annual budget.
P. Calculation of Excess Surplus
The designation for restricted fund balance -- excess surplus is a required calculation pursuant to
N.J.S.A. 18A:7F-7, as amended. New Jersey school districts are required to reserve General Fund fund
balance at the fiscal year end of June 30 if they did not appropriate a required minimum amount as
budgeted fund balance in their subsequent years’ budget. There was no excess fund balance at June
30, 2018.
38

Borough of Edgewater School District
Notes to the Basic Financial Statements
Year ended June 30, 2018
1. Summary of Significant Accounting Policies (continued)
Q. Tax Abatements
As defined by the Governmental Accounting Standards Board (GASB), a tax abatement is an
agreement between a government and an individual or entity in which the government promises to
forgo tax revenues and the individual or entity promises to subsequently take a specific action that
contributes to economic development or otherwise benefits the government or its citizens. School
districts are not authorized by New Jersey statute to enter into tax abatement agreements. However,
the county or municipality in which the school district is situated may have entered into tax abatement
agreements. Furthermore if the county entered into tax abatement agreements, those agreements
will not directly affect the school district’s local tax revenue because N.J.S.A. 54:4-75 and N.J.S.A.
54:4-76 require that amounts so forgiven must effectively be recouped from other taxpayers and
remitted to the school district.
For a local school district board of education or board of school estimate that has elected to raise
their minimum tax levy using the required local share provisions at N.J.S.A. 18A:7F-5(b), the loss of
revenue resulting from the municipality or county having entered into a tax abatement agreement is
indeterminate due to the complex nature of the calculation of required local share performed by the
New Jersey Department of Education based upon district property value and wealth. There have
been no tax abatement agreements entered into by the Borough that will materially affect the District.
R. GASB Pronouncements
GASB Pronouncements Implemented in the 2018 fiscal year
GASB Statement No. 75, Accounting and Financial Reporting for Postemployment Benefits Other Than
Pensions (“GASB No. 75”). The primary objective of this Statement is to improve accounting and financial
reporting by state and local governments for postemployment benefits other than pensions (other
postemployment benefits or OPEB). It also improves information provided by state and local government
employers about financial support for OPEB that is provided by other entities. The Statement became
effective for the District in the 2018 fiscal year.
S. Subsequent Events
Management has reviewed and evaluated all events and transactions from June 30, 2018 through
March 15, 2019, the date that the financial statements are issued and the effects of those that provide
additional pertinent information about conditions that existed at the balance sheet date, have been
recognized in the accompanying financial statements.
39

Borough of Edgewater School District
Notes to the Basic Financial Statements
Year ended June 30, 2018
2. Reconciliation of Government-Wide and Fund Financial Statements
Explanation of Certain Differences Between the Governmental Fund Balance Sheet and the
Government-Wide Statement of Net Position
The governmental fund balance sheet includes a reconciliation between fund balance – total
governmental funds and net position – governmental activities as reported in the government-wide
statement of net position. One element of that reconciliation explains that long-term liabilities, including
bonds payable, net of unamortized premiums and discounts and compensated absences payable are
not due and payable in the current period and therefore are not reported in the funds.
Explanation of Certain Differences Between the Governmental Fund Balance Sheet and the
Government-Wide Statement of Net Position
The details of this $31,003,180 difference are as follows:
Bonds payable 28,860,000$
Compensated absences 340,427
Unamortized Bond Premium 1,802,753
Net adjustment to reduce fund balance-total governmental
funds to arrive at net position - governmental activities 31,003,180$
3. Cash and Equivalents
Cash and equivalents – Cash and equivalents consist of funds deposited in demand deposit accounts,
time deposit accounts and certificates of deposit with original maturities of less than three months.
Investments are stated at fair value in accordance with Governmental Accounting Standards Board
(GASB) Statement No. 72, Fair Value Measurement and Application. The Board classifies certificates
of deposit, which have original maturity dates of more than three months but less than twelve months
from the date of purchase, as investments and are stated at cost. All other investments are stated at fair
value.
New Jersey school districts are limited as to the types of investments and types of financial institutions
they may invest in. New Jersey statute 18A:20-37 provides a list of permissible investments that may be
purchased by New Jersey school districts.
Additionally, the District has adopted a cash management plan that requires it to deposit public funds in
public depositories protected from loss under the provisions of the Governmental Unit Deposit Protection
Act (“GUDPA”). GUDPA was enacted in 1970 to protect governmental units from a loss of funds on
deposit with a failed banking institution in New Jersey.
40

Borough of Edgewater School District
Notes to the Basic Financial Statements
Year ended June 30, 2018
3. Cash and Equivalents (continued)
N.J.S.A. 17:9-41 et. seq. establishes the requirements for the security of deposits of governmental units.
The statute requires that no governmental unit shall deposit public funds in a public depository unless
such funds are secured in accordance with the Act. Public depositories include savings and loan
institutions, banks (both state and national banks) and savings banks, the deposits of which are federally
insured. All public depositories must pledge collateral, having a market value at least equal to five percent
of the average daily balance of collected public funds, to secure the deposits of governmental units. If a
public depository fails, the collateral it has pledged, plus the collateral of all other public depositories, is
available to pay the full amount of their deposits to the governmental units.
Deposits
New Jersey statutes require that school districts deposit public funds in public depositories located in
New Jersey that are insured by the Federal Deposit Insurance Corporation, the Federal Savings and
Loan Insurance Corporation, or by any other agency of the United States that insures deposits made in
public depositories. School districts are also permitted to deposit public funds in the State of New Jersey
Cash Management Fund.
New Jersey statutes require public depositories to maintain collateral for deposits of public funds that
exceed depository insurance limits as follows:
The market value of the collateral must equal at least 5% of the average daily balance of collected public
funds on deposit.
In addition to the above collateral requirement, if the public funds deposited exceed 75% of the capital
funds of the depository, the depository must provide collateral having a market value at least equal to
100% of the amount exceeding 75%.
All collateral must be deposited with the Federal Reserve Bank of New York, the Federal Reserve Bank
of Philadelphia, the Federal Home Loan Bank of New York, or a banking institution that is a member of
the Federal Reserve System and has capital funds of not less than $25,000,000.
Operating cash accounts are held in the District’s name by one institution. At June 30, 2018 the
carrying amount of the District’s deposits was $1,325,662 and the bank balance was $2,266,584. Of
the bank balance, $250,000 of the District’s cash deposits on June 30, 2018 was secured by federal
depository insurance. The New Jersey Governmental Unit Deposit Protection Act (GUDPA) covered
the bank balance of $1,899,502. $117,082 held in the District’s payroll and agency accounts are not
covered by GUDPA.
41

Borough of Edgewater School District
Notes to the Basic Financial Statements
Year ended June 30, 2018
3. Cash and Equivalents (continued)
Pursuant to GASB Statement No. 40, “Deposit and Investment Risk Disclosures” (“GASB 40”), the
District’s operating cash accounts are profiled in order to determine exposure, if any, to Custodial Credit
Risk (risk that in the event of failure of the counterparty the District would not be able to recover the value
of its deposits and investments). Deposits are considered to be exposed to Custodial Credit Risk if they
are: uncollateralized (securities not pledged to the depositor), collateralized with securities held by the
pledging financial institution, or collateralized with securities held by the financial institution’s trust
department or agent but not in the government’s name.
The District does not have a policy for the management of custodial credit risk, other than depositing all
of its funds in banks covered by GUDPA. At least five percent of the District’s deposits were fully
collateralized by funds held by the financial institution, but not in the name of the District. Due to the
nature of GUDPA, further information is not available regarding the full amount that is collateralized.
Investments
New Jersey statutes permit the Board to purchase the following types of investments:
a. Bonds and other obligations of the United States or obligations guaranteed by the United States.
b. Bonds of any Federal Intermediate Credit Bank, Federal Home Loan Bank, Federal National
Mortgage Agency or of any United States Bank, which have a maturity date not greater than twelve
months from the date of purchase.
c. New Jersey Cash Management Fund, (NJCMF) New Jersey Asset and Rebate Management Fund
(NJARM) and MBIA.
Custodial Credit Risk: The District does not have a policy for custodial credit risk.
Credit Risk: The District does not have an investment policy regarding the management of credit risk.
GASB 40 requires that disclosure be made as to the credit rating of all debt security investments except
for obligations of the U.S. government or investments guaranteed by the U.S. government.
Concentration of Credit Risk: The District places no limit on the amount the District may invest in any
one issuer.
Interest Rate Risk: The District does not have a policy to limit interest rate risk.
42

Borough of Edgewater School District
Notes to the Basic Financial Statements
Year ended June 30, 2018
4. Capital Assets
The following is a summarization of the governmental activities changes in capital assets for the fiscal
year ended June 30, 2018:
Depreciation expense was charged to functions/programs of the District for the year ended June 30,
2018 as follows:
Beginning Balance Increases Decreases
Ending
Balance
Governmental activities:
Capital assests, not being depreciated:
Sites and Site Improvements (Land) 179,988$ 179,988$
Construction in progress 73,340 73,340
Total capital assets, not being depreciated 253,328 253,328
Site improvements 624,434 624,434
Buildings and building improvements 34,025,825 34,025,825
Machinery, equipment and vehicles 2,617,220 156,077$ 2,773,297
Total capital assets being depreciated 37,267,479 156,077 37,423,556
Less accumulated depreciation for:
Site improvements 221,783 31,304 253,087
Buildings and building improvements 6,268,041 854,103 7,122,144
Machinery, equipment and vehicles 1,784,870 59,052 1,843,922
Total accumulated depreciation 8,274,694 944,459 9,219,153
Total capital assets being depreciated, net 28,992,785 (788,382) 28,204,403
Governmental activities capital assets, net 29,246,113$ (788,382)$ -$ 28,457,731$
Regular instruction 548,615$
General administration 49,182
Required maintenance of plant services 131,165
Student transportation 215,497
Total depreciation expense - governmental activities 944,459$
43

Borough of Edgewater School District
Notes to the Basic Financial Statements
Year ended June 30, 2018
4. Capital Assets (continued)
The following is a summarization of the business-type activities changes in capital assets for the fiscal
year ended June 30, 2018:
Beginning Ending
Balance Increases Balance
Business-type Activities: Capital assets, being depreciated: Machinery and Equipment $ 65,248 $ 65,248
Less accumulated depreciation for: Machinery and Equipment 64,281 $ 216 64,497
Total business-type activities capital assets, net $ 967 $ (216) $ 751
5. Long-Term Liabilities
During the fiscal year ended June 30, 2018, the following changes occurred in long-term liabilities:
Beginning Ending Due within
Balance Additions Reductions Balance One Year
Governmental activities: Compensated absences payable $ 270,181 $ 70,246 $ 340,427
Unamortized bond premium 1,876,786 $ 74,033 1,802,753 $ 83,144
Bonds payable 29,553,000 26,565,000 27,258,000 28,860,000 815,000
Subtotal 29,823,181 28,512,032 27,332,033 31,003,180 898,144
Net pension liability 3,543,778 1,275,173 2,268,605
Governmental activity long- term liabilities $33,366,959 $ 28,512,032 $ 28,607,206 $ 33,271,785 $ 898,144
The District expects to liquidate the balance in compensated absences and net pension liability with
payments made from the District’s general fund. Bonds payable will be liquidated with payments from
the debt service fund.
44

Borough of Edgewater School District
Notes to the Basic Financial Statements
Year ended June 30, 2018
5. Long-Term Liabilities (continued)
Bonds Payable
Bonds are authorized in accordance with State law or by the voters of the municipality through
referendums. All bonds are retired in serial installments within the statutory period of usefulness. Bonds
issued by the District are general obligation bonds. The principal and interest of these bonds will be paid
from the debt service fund as required by New Jersey statutes.
On August 10, 2017 the District issued $26,565,000 of refunding school bonds, Series 2017. This
transaction refunded the District’s outstanding series 2010 bonds. As a result, $26,038,000 of refunded
bonds are considered defeased and the liability has been removed from the basic financial statements.
This advance refunding was undertaken to reduce total debt service payments over the next 23 years
by $1,480,821 and resulted in a net present value savings of $1,091,227. Principal and interest due on all bonds outstanding is as follows:
Bonds payable at June 30, 2018 are comprised of the following issues:
$920,0000, 2010 school bonds, due in annual installments ranging from $455,000 to $465,000 through
March 1, 2020 at an interest rate of 4.00%.
$1,825,000, 2013 refunding bonds, due in annual installments ranging from $345,000 to $375,000
through September 1, 2022, at interest rates ranging from 3.00 to 4.00%.
$26,115,000, 2017 refunding bonds, due in annual installments ranging from $15,000 to $1,910,000,
through March 1, 2040, at interest rates ranging from 3.00 to 4.00%.
Principal Interest Total
Year ending June 30:
2019 $ 815,000 1,099,313$ $ 1,914,313
2020 845,000 1,070,088 1,915,088
2021 880,000 1,038,088 1,918,088
2022 910,000 1,002,788 1,912,788
2023 945,000 966,388 1,911,388
2024-2028 5,600,000 4,252,438 9,852,438
2029-2033 6,875,000 3,059,238 9,934,238
2034-2038 8,240,000 1,735,175 9,975,175
2039-2040 3,750,000 226,400 3,976,400
$ 28,860,000 14,449,916 $ 43,309,916
45

Borough of Edgewater School District
Notes to the Basic Financial Statements
Year ended June 30, 2018
6. Pension Plans
Description of Systems
Substantially all of the Board’s employees participate in one of the following contributory defined benefit
public employee retirement systems which have been established by State statute: the Teachers’
Pension and Annuity Fund (TPAF) or the Public Employees’ Retirement System (PERS). These systems
are sponsored and administered by the State of New Jersey. The Teachers’ Pension and Annuity Fund
Retirement System is considered a cost-sharing multiple-employer plan, with a special funding situation,
as under current statute, all employer contributions are made by the State of New Jersey on behalf of
the Board and the system’s other related non-contributing employers. The Public Employees’ Retirement
System is considered a cost-sharing multiple-employer plan.
Teachers’ Pension and Annuity Fund
The Teachers’ Pension and Annuity Fund was established in January 1955 under the provisions of
N.J.S.A. 18A:66 to provide coverage including post-retirement health care to substantially all full time
public school employees in the State. Membership is mandatory for such employees and vesting
occurs after 10 years of service for pension benefits and 25 years for health care coverage. Age
eligibility and benefit provisions were affected by Chapters 92 and 103, P.L. 2007, Chapter 89, P.L. 2008,
Chapter 1, P.L. 2010, and Chapter 78, P.L. 2011. Members are classified into one of five tiers dependent
upon the date of their enrollment. Tier 1, 2 and 3 members are eligible to retire at age 60, 60, and 62,
respectively, with an annual benefit generally determined to be 1/55th of the average annual
compensation for the highest three fiscal years’ compensation for each year of membership during years
of credited service. Tier 4 and 5 members are eligible to retire at age 62 and 65, respectively, with an
annual benefit generally determined to be 1/60th of the average annual compensation for the highest five
fiscal years’ compensation for each year of membership during years of credited service. Anyone who
retires early and is under their respective tier’s retirement age receives retirement benefits as calculated
in the above mentioned formulas but at a reduced rate in accordance with applicable New Jersey Statute
based upon their tier.
Public Employee’s Retirement System
The Public Employees’ Retirement System was established in January 1955 under the provisions of
N.J.S.A. 43:15A to provide coverage including post-retirement health care to substantially all full time
employees of the State or any county, municipality, school Board or public agency provided the
employee is not a member of another State-administered retirement system. Age eligibility and benefit
provisions were affected by Chapters 92 and 103, P.L. 2007, Chapter 89, P.L. 2008, Chapter 1, P.L.
2010, and Chapter 78, P.L. 2011.
46

Borough of Edgewater School District
Notes to the Basic Financial Statements
Year ended June 30, 2018
6. Pension Plans (continued)
Public Employee’s Retirement System
Members are classified into one of five tiers dependent upon the date of their enrollment. Tier 1, 2 and 3
members are eligible to retire at age 60, 60, and 62, respectively with an annual benefit generally
determined to be 1/55th of the average annual compensation for the highest three fiscal years’
compensation for each year of membership during years of credited service.
Tier 4 and 5 members are eligible to retire at age 62 and 65, respectively with an annual benefit generally
determined to be 1/60th of the average annual compensation for the highest five fiscal years’
compensation for each year of membership during years of credited service. Anyone who retires early
and is under their respective tier’s retirement age receives retirement benefits as calculated in the above
mentioned formulas but at a reduced rate in accordance with applicable New Jersey Statute based upon
their tier.
The State of New Jersey, Department of the Treasury, Division of Pensions and Benefits, issued
publicly available financial reports that include the financial statements and required supplementary
information for TPAF and PERS. The financial reports may be obtained by writing to the State of
New Jersey, Department of the Treasury, Division of Pensions and Benefits, P.O. Box 295, Trenton,
New Jersey 08625-0295.
Funding Policy
The contribution policy is set by New Jersey State Statutes and contributions are required by active
members and contributing members. Plan member and employer contributions may be amended
by State of New Jersey legislation. Under the provisions of Chapter 78, P.L. 2011, employee
contribution rates for TPAF and PERS increased from 5.5% to 6.5% of employees’ annual compensation.
An additional increase is to be phased in over the next six years that will bring the total pension
contribution rate to 7.5% of employees’ annual compensation. Employers are required to contribute at
an actuarially determined rate in both the TPAF and PERS. The actuarially determined contribution
includes funding for cost-of-living adjustments, noncontributory death benefits, and post-retirement
medical premiums. Under current statute the Board is a non-contributing employer of the TPAF.
During the year ended June 30, 2018, the State of New Jersey contributed $1,210,365 to the TPAF for
post-retirement medical benefits and other pension costs on behalf of the Board. Also, in accordance
with N.J.S.A. 18A:66-66 the State of New Jersey reimbursed the Board $394,267 during the year ended
June 30, 2018 for the employer’s share of social security contributions for TPAF members as calculated
on their base salaries. These amounts have been included in the government-wide and fund financial
statements.
47

Borough of Edgewater School District
Notes to the Basic Financial Statements
Year ended June 30, 2018
6. Pension Plans (continued)
The Board’s actuarially determined contributions to PERS for each of the years ended June 30, 2018,
2017, and 2016 was $105,219, $90,282, and $106,298, respectively, equal to the required contributions
for each year.
Funding Policy
For purposes of measuring the net pension liability, deferred outflows of resources and deferred
inflows of resources related to pensions, and pension expense, information about the fiduciary net
position of PERS and additions to/deductions from PERS fiduciary net position have been
determined on the same basis as they are reported by PERS. For this purpose, benefit payments
(including refunds of employee contributions) are recognized when due and payable in accordance
with the benefit terms. Investments are reported at fair value.
Pension Liabilities, Pension Expense, and Deferred Outflows of Resources and Deferred Inflows
of Resources Related to Pensions
Public Employee’s Retirement System (PERS)
At June 30, 2018, the District reported a liability of $2,268,605 for its proportionate share of the net
pension liability. The net pension liability was measured as of June 30, 2017, and the total pension
liability used to calculate the net pension liability was determined by an actuarial valuation July 01,
2016, which was rolled forward to June 30, 2017. The District’s proportion of the net pension liability
was based on a projection of the District’s long-term share of contributions to the pension plan
relative to the projected contributions of all participating school districts, actuarially determined. At
June 30, 2017, the District’s proportion was 0.0097455378 percent, which was a decrease of
0.0022197604 percent from its proportion measured as of June 30, 2016.
For the year ended June 30, 2018, the District recognized full accrual pension expense of $62,760
in the government-wide financial statements. At June 30, 2017, the District reported deferred
outflows of resources and deferred inflows of resources related to PERS from the following sources:
Deferred Deferred
Outflows of Inflows of
resources Resources
Changes of assumptions 457,046$ 455,370$
Net difference between projected and actual
earnings on pension plan investments 15,448
Changes in proportion 182,566 644,134
Difference between expected and actual
experience 53,418
District contributions subsequent to the
measurement date 105,219
813,697$ 1,099,504$
48

Borough of Edgewater School District
Notes to the Basic Financial Statements
Year ended June 30, 2018
6. Pension Plans (continued)
$105,219 is reported as deferred outflows of resources related to pensions resulting from school
district contributions subsequent to the measurement date. Other amounts reported as deferred
outflows of resources and deferred inflows of resources related to pensions will be recognized as a
reduction of the net pension liability as follows:
Actuarial Assumptions
The total pension liability for the June 30, 2017 measurement date was determined by an actuarial
valuation as of July 01, 2016, which was rolled forward to June 30, 2017. This actuarial valuation
used the following actuarial assumptions:
June 30, 2017
Inflation 2.25%
Salary increases
2021-2026 1.65 - 4.15%
Based on age
Thereafter 2.65 - 5.15%
Based on age
Investment rate of return 7.00%
Year ended June 30:
2019 58,440$
2020 17,883
2021 84,383
2022 130,188
2023 100,132
391,026$
49

Borough of Edgewater School District
Notes to the Basic Financial Statements
Year ended June 30, 2018
6. Pension Plans (continued) Pre-retirement mortality rates were based on the RP-2000 Employee Preretirement Mortality Table for male and female active participants. For State employees, mortality tables are set back 4 years for males and females. For local employees, mortality tables are set back 2 years for males and 7 years for females. In addition, the tables provide for future improvements in mortality from the base year of 2013 using a generational approach based on the plan actuary’s modified MP-2014 projection scale. Post-retirement mortality rates were based on the RP-2000 Combined Healthy Male and Female Mortality Tables (set back 1 year for males and females) for service retirements and beneficiaries of former members and a one-year static projection based on mortality improvement Scale AA. In addition, the tables for service retirements and beneficiaries of former members provide
for future improvements in mortality from the base year of 2013 using a generational approach based
on the plan actuary’s modified MP-2014 projection scale. Disability retirement rates used to value
disabled retirees were based on the RP-2000 Disabled Mortality Table (set back 3 years for males
and set forward 1 year for females).
The actuarial assumptions used in the July 1, 2016 valuation were based on the results of an
actuarial experience study for the period July 1, 2011 to June 30, 2014. It is likely that future
experience will not exactly conform to these assumptions. To the extent that actual experience
deviates from these assumptions, the emerging liabilities may be higher or lower than anticipated.
The more the experience deviates, the larger the impact on future financial statements.
Long-Term Rate of Return
In accordance with State statute, the long-term expected rate of return on plan investments (7.00%
at June 30, 2017) is determined by the State Treasurer, after consultation with the Directors of the
Division of Investment and Division of Pensions and Benefits, the board of trustees and the actuaries.
The long-term expected rate of return was determined using a building block method in which best-
estimate ranges of expected future real rates of return (expected returns, net of pension plan
investment expense and inflation) are developed for each major asset class. These ranges are
combined to produce the long-term expected rate of return by weighting the expected future real
rates of return by the target asset allocation percentage and by adding expected inflation. Best
estimates of arithmetic rates of return for each major asset class included in PERS’s target asset
allocation as of June 30, 2017 are summarized in the following table:
50

Borough of Edgewater School District
Notes to the Basic Financial Statements
Year ended June 30, 2018
6. Pension Plans (continued)
Long-Term
Target Expected Real
Asset Class Allocation Rate of Return
Absolute return/risk mitigation 5.00% 5.51%
Cash equivalents 5.50% 1.00%
U.S. Treasuries 3.00% 1.87%
Investment grade credit 10.00% 3.78%
Public high yield 2.50% 6.82%
Global diversified credit 5.00% 7.10%
Credit oriented hedge funds 1.00% 6.60%
Debt related private equity 2.00% 10.63%
Debt related real estate 1.00% 6.61%
Private real asset 2.50% 11.83%
Equity related real estate 6.25% 9.23%
U.S. equity 30.00% 8.19%
Non-U.S. developed markets equity 11.50% 9.00%
Emerging markets equity 6.50% 11.64%
Buyouts/venture capital 8.25% 13.08%
100.00%
Discount rate - The discount rate used to measure the total pension liability was 5.00% as of June
30, 2017. This single blended discount rate was based on the long-term expected rate of return on
pension plan investments of 7.00% and a municipal bond rate of 3.58% as of June 30, 2017 based
on the Bond Buyer Go 20-Bond Municipal Bond Index, which includes tax-exempt general obligation
municipal bonds with an average rating of AA/Aa or higher. The projection of cash flows used to
determine the discount rate assumed that contributions from plan members will be made at the
current member contribution rates and that contributions from employers will be made based on the
contribution rate in the most recent fiscal year. The State employer contributed 30% of the actuarially
determined contributions and the local employers contributed 100% of their actuarially determined
contributions. Based on those assumptions, the plan’s fiduciary net position was projected to be
available to make projected future benefit payments of current plan members through 2040.
Therefore, the long-term expected rate of return on plan investments was applied to projected benefit
payments through 2040 and the municipal bond rate was applied to projected benefit payments after
that date in determining the total pension liability.
51

Borough of Edgewater School District
Notes to the Basic Financial Statements
Year ended June 30, 2018
6. Pension Plans (continued)
At 1% At Current At 1%
Decrease Discount Rate Increase
(4.00%) (5.00%) (6.00%)
District's proportionate share of the net pension liability $ 2,814,358 $ 2,268,605 $ 1,813,925
Sensitivity of Net Pension Liability – the following presents the net pension liability of PERS
calculated using the discount rates as disclosed above as well as what the net pension liability would
be if it were calculated using a discount rate that is 1 percentage point lower or 1 percentage rate
higher than the current rate:
Pension Plan Fiduciary Net Position Detailed information about the pension plan’s fiduciary net position is available in the separately
issued financial report for the State of New Jersey Public Employees Retirement System.
Additional Information
Collective balances of the local group at June 30, 2017 are as follows:
Deferred outflows of resources $ 6,424,455,842
Deferred inflows of resources $ 5,700,625,981
Net pension liability $ 23,278,401,588
District's Proportion 0.009745455378%
Collective pension expense for the Local Group for the measurement period ended June 30, 2017
is $1,694,305,613.
The average of the expected remaining service lives of all employees that are provided with pension
through the pension plan (active and inactive employees) determined at June 30, 2017, 2016 and
2015, and 2014 is 5.48, 5.57, 5.72 and 6.44 years, respectively.
Teachers Pensions and Annuity Fund (TPAF)
The employer contributions for local participating employers are legally required to be funded by the
State in accordance with N.J.S.A. 18:66-33. Therefore, these local participating employers are
considered to be in a special funding situation as defined by GASB Statement No. 68 and the State
is treated as a nonemployer contributing entity. Since the local participating employers do not
52

Borough of Edgewater School District
Notes to the Basic Financial Statements
Year ended June 30, 2018
6. Pension Plans (continued)
contribute directly to the plan (except for employer specific financed amounts), there is no net
pension liability or deferred outflows or inflows to report in the financial statements of the local
participating employers. However, the notes to the financial statements of the local participating
employers must disclose the portion of the nonemployer contributing entities’ total proportionate
share of the net pension liability that is associated with the local participating employer.
The State’s proportionate share of the TPAF net pension liability associated with the District as of
June 30, 2017 was $30,679,796. The District’s proportionate share was $0.
The net pension liability was measured as of June 30, 2017, and the total pension liability used to
calculate the net pension liability was determined by an actuarial valuation as of July 01, 2016, which
was rolled forward to June 30, 2017. The State’s proportionate share of the net pension liability
associated with the District was based on a projection of the State’s long-term contributions to the
pension plan associated with the District relative to the projected contributions by the State
associated with all participating school districts, actuarially determined. At June 30, 2017, the State’s
proportionate share of the TPAF net pension liability associated with the District was
0.0455030489%. At June 30, 2016, the State’s proportionate share of the TPAF net pension liability
associated with the District was not determined or made available by the State of New Jersey.
Actuarial assumptions The actuarial valuation used the following actuarial assumptions, applied to all periods included in the measurement:
Inflation rate 2.25%
Salary increases
2012-2021
Varies based on
experience
Thereafter
Varies based on
experience
Investment rate of return 7.00%
Mortality Rates
Pre-retirement, post-retirement and disabled mortality rates were based on the experience of TPAF
members reflecting mortality improvement on a generational basis based on a 60-year average of
Social Security data from 1953 to 2013.
The actuarial assumptions used in the July 01, 2016 valuation were based on the results of an
actuarial experience study for the period July 1, 2012 to June 30, 2015.
53

Borough of Edgewater School District
Notes to the Basic Financial Statements
Year ended June 30, 2018
6. Pension Plans (continued)
Long-Term Expected Rate of Return
In accordance with State statute, the long-term expected rate of return on plan investments (7.00%
at June 30, 2017) is determined by the State Treasurer, after consultation with the Directors of the
Division of Investments and Division of Pensions and Benefits, the board of trustees and the
actuaries. The long-term expected rate of return was determined using a building block method in
which best-estimate ranges of expected future real rates of return (expected returns, net of pension
plan investment expense and inflation) are developed for each major asset class. These ranges are
combined to produce the long-term expected rate of return by weighting the expected future real
rates of return by the target asset allocation percentage and by adding expected inflation. Best
estimates of arithmetic rates of return for each major asset class included in TPAF’s target asset
allocation as of June 30, 2017 are summarized in the following table:
Asset Class
Target
Allocation
Long-Term
Expected Real
Rate of
Return
Absolute return/risk mitigations 5.00% 5.51%
Cash equivalents 5.50% 1.00%
U.S. Treasuries 3.00% 1.87%
Investment grade credit 10.00% 3.78%
Public high yield 2.50% 6.82%
Global diversified credit 5.00% 7.10%
Credit oriented hedge funds 1.00% 6.60%
Debt related private equity 2.00% 10.63%
Debt related real estate 1.00% 6.61%
Private real asset 2.50% 11.83%
Equity related real estate 6.25% 9.23%
U.S. equity 30.00% 8.19%
Non-U.S. developed markets equity 11.50% 9.00%
Emerging markets equity 6.50% 11.64%
Buyouts/venture capital 8.25% 13.08%
100.00%
54

Borough of Edgewater School District
Notes to the Basic Financial Statements
Year ended June 30, 2018
6. Pension Plans (continued) Discount Rate The discount rate used to measure the total pension liability was 4.25% as of June 30, 2017. This
single blended discount rate was based on the long-term rate of return on pension plan investments
of 7.00%, and a municipal bond rate of 3.58% as of June 30, 2017 based on the Bond Buyer GO 20-
Bond Municipal Bond Index which includes tax-exempt general obligation municipal bonds with an
average rating of AA/Aa or higher. The projection of cash flows used to determine the discount rate
assumed that contributions from plan members will be made at the current member contribution
rates and that contributions from employers will be made based on the contribution rate in the most
recent fiscal year. The State contributed 40% of the actuarially determined contributions. Based on
those assumptions, the plan’s fiduciary net position was projected to be available to make projected
future benefit payments of current plan members through 2036. Therefore, the long-term expected
rate of return on plan investments was applied to projected benefit payments through 2036, and the
municipal bond rate was applied to projected benefit payments after that date in determining the total
pension liability.
Sensitivity of the State’s proportionate share of the net pension liability associated with the District to changes in the discount rate
The following presents the State’s proportionate share of the net pension liability associated with the
District as of June 30, 2017 calculated using the discount rate as disclosed above as well as what
the State’s proportionate share of the net pension liability associated with the District would be if it
were calculated using a discount rate that is 1-percentage-point lower (3.25 percent) or 1-
percentage-point higher (5.25 percent) than the current rate:
At 1% At Current At 1%
Decrease Discount Rate Increase
(3.25%) (4.25%) (5.25%)
District's proportionate share of the net pension liability $ 36,448,560 $ 30,679,796 $ 25,927,463
55

Borough of Edgewater School District
Notes to the Basic Financial Statements
Year ended June 30, 2018
6. Pension Plans (continued)
Pension plan fiduciary net position Detailed information about the pension plan’s fiduciary net position is available in the separately
issued TPAF financial report.
Additional Information
Collective balances of the local group at June 30, 2017 are as follows:
Collective pension expense for the plan for the measurement period ended June 30, 2017 is
$4,688,207,089.
The average of the expected remaining service lives of all employees that are provided with pension
through the pension plan (active and inactive employees) determined at June 30, 2017, 2016, 2015,
and 2014 is 8.3, 8.3, 8.3 and 8.5 years, respectively.
7. Post-Retirement Benefits
Plan Description
The District contributes to the New Jersey School Employee Health Benefits Program (the “SEHBP”),
a cost-sharing multiple-employer defined benefit postemployment healthcare plan administered by
the State of New Jersey Division of Pension and Benefits. SEHBP provide medical, prescription drug,
mental health/substance abuse and Medicare Part B reimbursement to retirees and their covered
dependents. The School Employee Health Benefits Program Act is found in New Jersey Statutes
Annotated, Title 52, Article 17.25 et. seq. Rules governing the operation and administration of the
program are found in Title 17, Chapter 9 of the New Jersey Administrative Code. The State of New
Jersey Division of Pension and Benefits issues a publicly available financial report that includes
financial statements and required supplementary information for SEHBP. That report may be
obtained by writing to Division of Pension and Benefits, PO Box 295, Trenton, NJ 08625-0295.
Deferred outflows of resources 14,353,461,035$
Deferred inflows of resources 11,992,821,439$
Net pension liability 67,670,209,171$
State's proportionare share associated
with the District 0.0455030489%
56

Borough of Edgewater School District
Notes to the Basic Financial Statements
Year ended June 30, 2018
7. Post-Retirement Benefits (continued)
Funding Policy
P.L. 1987, c.384 and P.L. 1990, c.6 required Teachers’ Pensions and Annuity Fund (TPAF) and the
Public Employees’ Retirement System (PERS), respectively, to fund post-retirement medical
benefits for those state employees who retire after accumulating 25 years of credited service or on
a disability retirement. P.L. 2007, c.103 amended the law to eliminate the funding of post-retirement
medical benefits through the TPAF and PERS. It created separate funds outside of the pension plans
for the funding and payment of post-retirement medical benefits for retired state employees and
retired educational employees. The cost of these benefits is funded through contributions by the
State in accordance with P.L. 1994, c.62. Funding of post–retirement medical benefits changed from
a pre-funding basis to a pay-as-you-go basis beginning in Fiscal Year 1994. As the employer
contributions for local government education employers are legally required to be funded by the
State, this constitutes a special funding situation as defined by GASB Statement No. 75 and the
State is treated as a non-employer contributing entity.
The State is also responsible for the cost attributable P.L. 1992, c.126, which provides employer paid
health benefits to members of PERS and the Alternate Benefit Program (APB) who retired from a
board of education or county college with 25 years of service.
The School Employees Health Benefits Program (SEHBP) Act is found in New Jersey Statutes
Annotated, Title 52, Article 17.25 et.seq. Rules governing the operation and administration of the
program are found in Title 17, Chapter 9 of the New Jersey Administrative Code.
The State provides OPEB benefits through a defined benefit OPEB plan that is not administered
through a trust that meets the criteria in paragraph 4 of GASB Statement No. 75. No assets are
accumulated in a trust that meets the criteria in paragraph 4 of GASB Statement No. 75.
Total OPEB Liability The net OPEB liability from New Jersey’s plan is $53,639,841,858.
The following employees were covered by the benefit terms:
Local Education June 30, 2016
Active Plan Members 223,747
Inactive Plan Members or Beneficiaries Currently Receiving Benefits 142,331
Inactive Plan Members Entitled to but Not Yet Receiving Benefit Payments -
Total Plan Members 366,078
57
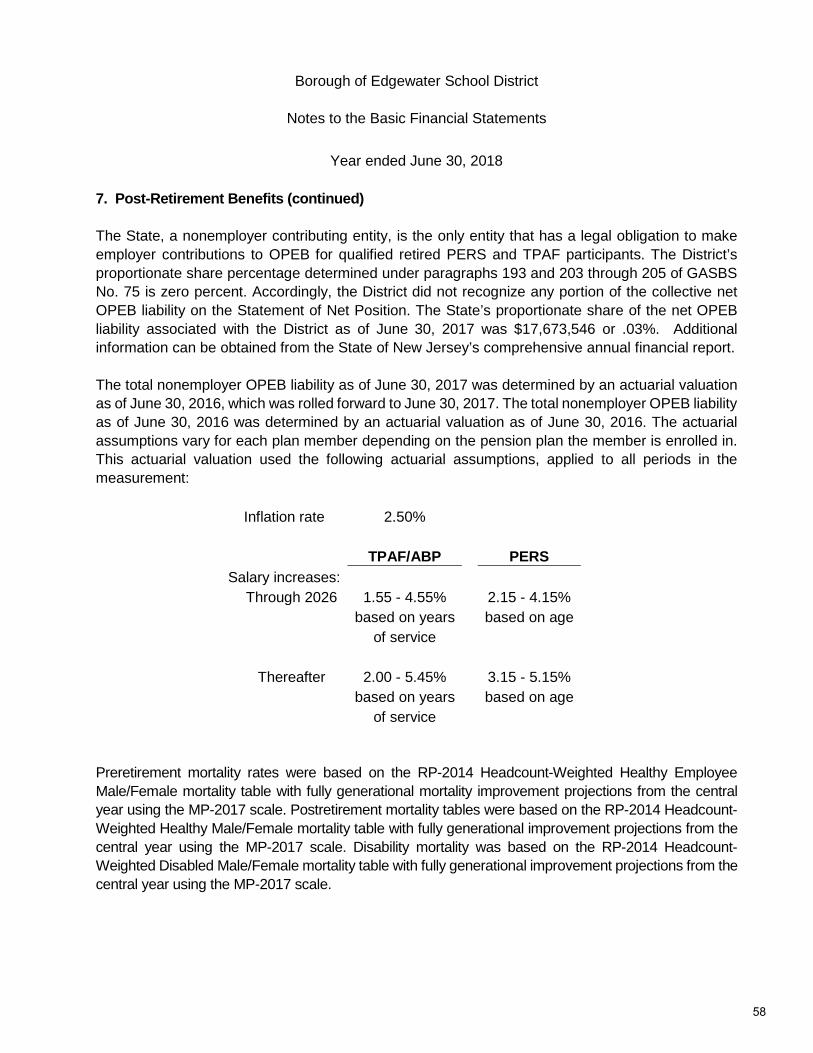
Borough of Edgewater School District
Notes to the Basic Financial Statements
Year ended June 30, 2018
7. Post-Retirement Benefits (continued)
The State, a nonemployer contributing entity, is the only entity that has a legal obligation to make
employer contributions to OPEB for qualified retired PERS and TPAF participants. The District’s
proportionate share percentage determined under paragraphs 193 and 203 through 205 of GASBS
No. 75 is zero percent. Accordingly, the District did not recognize any portion of the collective net
OPEB liability on the Statement of Net Position. The State’s proportionate share of the net OPEB
liability associated with the District as of June 30, 2017 was $17,673,546 or .03%. Additional
information can be obtained from the State of New Jersey’s comprehensive annual financial report.
The total nonemployer OPEB liability as of June 30, 2017 was determined by an actuarial valuation
as of June 30, 2016, which was rolled forward to June 30, 2017. The total nonemployer OPEB liability
as of June 30, 2016 was determined by an actuarial valuation as of June 30, 2016. The actuarial
assumptions vary for each plan member depending on the pension plan the member is enrolled in.
This actuarial valuation used the following actuarial assumptions, applied to all periods in the
measurement:
Inflation rate 2.50%
TPAF/ABP PERS
Salary increases: Through 2026 1.55 - 4.55% 2.15 - 4.15%
based on years based on age
of service
Thereafter 2.00 - 5.45% 3.15 - 5.15%
based on years based on age
of service
Preretirement mortality rates were based on the RP-2014 Headcount-Weighted Healthy Employee
Male/Female mortality table with fully generational mortality improvement projections from the central
year using the MP-2017 scale. Postretirement mortality tables were based on the RP-2014 Headcount-
Weighted Healthy Male/Female mortality table with fully generational improvement projections from the
central year using the MP-2017 scale. Disability mortality was based on the RP-2014 Headcount-
Weighted Disabled Male/Female mortality table with fully generational improvement projections from the
central year using the MP-2017 scale.
58

Borough of Edgewater School District
Notes to the Basic Financial Statements
Year ended June 30, 2018
7. Post-Retirement Benefits (continued)
The actuarial assumptions used in the June 30, 2016 valuation were based on the results of actuarial
experience studies for the periods July 1, 2012 – June 30, 2015, July 1, 2011 – June 30, 2014 for TPAF
and PERS, respectively.
Health Care Trend Assumptions For pre-Medicare preferred provider organization (PPO) medical benefits, this amount liability is 5.9%
and decreases to a 5.0% long-term trend rate after nine years. For self-insured post-65 PPO medical
benefits, the trend rate is 4.5%. For health maintenance organization (HMO) medical benefits, the trend
rate is initially 5.9% and decreases to a 5.0% long-term trend rate after nine years. For prescription drug
benefits, the initial trend rate is 10.5% decreasing to a 5.0% long-term trend rate after eight years. For
the Medicare Part B reimbursement, the trend rate is 5.0%. The Medicare Advantage trend rate is 4.5%
and will continue in all future years.
Discount Rate The discount rate for June 30, 2017 and 2016 was 3.58% and 2.85%, respectively. This represents the
municipal bond return rate as chosen by the Division. The source is the Bond Buyer Go 20-Bond
Municipal Bond Index, which includes tax-exempt general obligation municipal bonds with an average
rating of AA/Aa or higher.
The following represents the change in the State’s proportionate share of the OPEB liability associated
with the District:
Balance at June 30, 2016 $ 18,877,298
Increased by:
Service cost $ 1,190,596
Interest cost 566,356
Member contributions 15,074
1,772,026
Decrease by
Changes of assumptions 2,566,421
Gross benefit payment 409,357
2,975,778
Balance at June 30, 2017 $ 17,673,546
59

Borough of Edgewater School District
Notes to the Basic Financial Statements
Year ended June 30, 2018
7. Post-Retirement Benefits (continued)
The State’s proportionate share of deferred inflows of resources associated with the District at June 30,
2017 $2,090,179.
The following represents sensitivity of the State’s proportionate share of the net OPEB liability associated
with the District to changes in the discount rate and healthcare cost trend rate:
1% Decrease At current
discount rate 1% Increase
(2.58%) (3.58%) (4.58%)
Net OPEB Liability (Allocable to the District and
the responsibility of the State) $ 20,979,774 $ 17,673,546 $ 15,051,014
The following presents the State’s proportionate share of the net OPEB liability associated with the
District calculated using a healthcare cost trend rate that is 1-percentage-point lower or 1-percentage-
point higher than the current healthcare cost trend rate:
1%Decrease Health Cost Trent Rates 1% Increase
Net OPEB Liability (Allocable to the District and the
responsibility of the State)
$14,534,783 $17,673,546 $ 21,841,786
OPEB Expense and Deferred Outflows of Resources and Deferred Inflows of Resources Related to OPEB For the year ended June 30, 2018, the District recognized on-behalf OPEB expense and revenue in the
government-wide financial statements of $1,522,202 for OPEB expenses incurred by the State.
Collective balances of the Education Group at June 30, 2017 are as follows:
Deferred outflows of resources $ 99,843,255
Deferred inflows of resources $ 6,443,612,287
Collective OPEB expense $ 3,348,490,523
60

Borough of Edgewater School District
Notes to the Basic Financial Statements
Year ended June 30, 2018
8. Interfund Receivables and Payables
The total interfund accounts receivable and payable for the District at June 30, 2018 amounted to
$291,259 analyzed as follows:
Interfund Receivable
Interfund Payable Fund
General Fund $ 231,245 $ 9,610
Special Revenue Fund 79,552
Capital Projects Fund 100,943
Food Service Fund 9,610
Preschool Education Fund 50,404 98,654
Payroll Agency Fund 2,500 $ 291,259 $ 291,259
The interfund between the Capital Projects Fund and the General Fund represents a short-term loan
between the funds. The interfund between the Preschool Education Fund and the Special Revenue Fund
represents the repayment of program expenditures made in the Preschool Education Fund that were
related to a program in the Special Revenue Fund. The interfund between the General Fund and the
Special Revenue Fund represents cash loaned to the special revenue fund to cover a pooled cash deficit.
The interfund between the General Fund and the Payroll Agency Fund represents the excess funds
transferred to the Payroll Agency account which are due back to the General Fund as of June 30, 2018.
The interfund between the Food Service Fund and the General Fund represents amounts collected from
the state and federal government that were not remitted by year end. The interfund between the General
Fund and the Preschool Education Fund represents a short-term loan between the funds.
All interfunds are expected to be liquidated within one year.
9. Transfers
The transfer from the Capital Projects Fund to the General Fund represents interest earned in the Capital
Projects Fund due to the General Fund.
Transfers Transfers
Fund In Out
General Fund $ 293
Capital Projects Fund 293
$ 293 $ 293
61

Borough of Edgewater School District
Notes to the Basic Financial Statements
Year ended June 30, 2018
10. Economic Dependency
The District receives a substantial amount of its support from federal and state governments. A significant
reduction in the level of support, if this were to occur, could have an effect on the District’s programs and
activities.
11. Contingent Liabilities
The District participates in numerous state and federal grant programs, which are governed by various
rules and regulations of the grantor agencies; therefore, to the extent that the District has not complied
with the rules and regulations governing the grants, refunds of any money received may be required and
the collectability of any related receivable at June 30, 2018 may be impaired. In the opinion of the District,
there are no significant contingent liabilities relating to compliance with the rules and regulations
governing the respective grants; therefore, no provisions have been recorded in the accompanying
combined financial statements for such contingencies.
The District is also involved in several claims and lawsuits incidental to its operations. In the opinion of
the administration and legal counsel, the ultimate resolution of these matters will not have a material
adverse effect on the financial position of the Board.
12. Risk Management
The District is exposed to various risks of loss related to torts; theft of, damage to, and destruction of
assets; errors and omissions; injuries to employees; and natural disasters.
Property and Liability Insurance
The District maintains commercial insurance coverage for property, liability, student accident and surety
bonds and does not retain risk of loss. There have been no significant reductions in insurance coverage
from the prior year and no settlements have exceeded insurance coverages over the past three years.
A complete schedule of insurance coverage can be found in the statistical section of this report.
New Jersey Unemployment Compensation Insurance
The District has elected to fund its New Jersey Unemployment Compensation Insurance under the
“Benefit Reimbursement Method.” Under this plan, the District is required to reimburse the New Jersey
Unemployment Trust Fund for benefits paid to its former employees and charged to its account with the
State. The District is billed quarterly for amounts due to the State.
62

Borough of Edgewater School District
Notes to the Basic Financial Statements
Year ended June 30, 2018
13. Deferred Compensation Plans
The District offers its employees a choice of the following deferred compensation plans (the “Plans”)
created in accordance with Internal Revenue Code Section 403(b). The Plans, which are administered
by the entities listed below, permits participants to defer a portion of their salary until future years.
Amounts deferred under the Plans are not available to employees until termination, retirement, death or
unforeseeable emergency. The plan administrators are as follows:
Equitable
First Investors
Lincoln Investment Planning
Retirement Annuity Consultants
Vanguard
14. Restricted Assets
The funds set aside for capital and maintenance reserve are classified as restricted assets (cash and
cash equivalents and other accounts receivable) as they are restricted for use for future capital projects
and maintenance requirements. 15. Maintenance Reserve Account
A maintenance reserve account was established by the District by way of a Board approved resolution for the accumulation of funds for use as maintenance expenditures in subsequent fiscal years. The maintenance reserve account is maintained in the general fund and its activity is included in the general fund annual budget. Funds placed in the maintenance reserve account are restricted to maintenance projects in the District’s approved Comprehensive Maintenance Plan (CMP).Upon submission of the CMP to the New Jersey Department of Education, the District may increase the balance in the maintenance reserve by appropriating funds in the annual general fund budget certified for taxes or by transfer by board resolution at year end (June 1 to June 30) of any unanticipated revenue or unexpended line – item appropriation amounts, or both. The District may also appropriate additional amounts when the express approval of the voters has been obtained either by a separate proposal at budget time or by a special question at one of the four special elections authorized pursuant to N.J.S.A. 19:60-2. Pursuant to N.J.A.C. 6A:23A-14.2(g), the balance in the account cannot at any time exceed four percent of the replacement cost of the school district’s school facilities for the current year. The activity of the maintenance reserve for the July 01, 2017 to June 30, 2018 fiscal year is as follows:
Beginning balance, July 1, 2017 $ 100,000
Interest earned 10
Ending balance, June 30, 2018 $ 100,010
63

Borough of Edgewater School District
Notes to the Basic Financial Statements
Year ended June 30, 2018
15. Maintenance Reserve Account (continued)
The balance in the maintenance reserve does not exceed four percent of the replacement cost of the school district’s school facilities for the current year at June 30, 2018. The District has budgeted $35,000 in its 2018-19 budget for maintenance purposes.
16. Capital Reserve Account
A capital reserve account was established by the District by way of a Board resolution, and issued
for the accumulation of funds for use as capital outlay expenditures in subsequent fiscal years. The
capital reserve account is maintained in the general fund and its activity is included in the general
fund annual budget. Funds placed in the capital reserve account are restricted to capital projects in
the District’s approved Long Range Facilities Plan (LRFP). Upon submission of the LRFP to the
Department, a District may increase the balance in the capital reserve by appropriating funds in the
annual general fund budget certified for taxes or by transfer by board resolution at year end (June 1
to June 30) of any unanticipated revenue or unexpended line – item appropriation amounts, or both.
A district may also appropriate additional amounts when the express approval of the voters has been
obtained either by a separate proposal at budget time or by a special question at one of the four
special elections authorized pursuant to N.J.S.A. 19:60-2. Pursuant to N.J.A.C. 6A:23A-14.1(g), the
balance in the account cannot at any time exceed the local support costs of uncompleted capital projects
in its approved LRFP. The balance at June 30, 2018 and 2017 was $1,022,513. The June 30, 2018
LRFP balance of local support costs of uncompleted projects exceeds the amount set aside in capital
reserve.
17. Commitments
The District has contractual commitments at June 30, 2018 to various vendors, which are recorded
in the general fund as fund balance assigned to other purposes in the amount of $6,479.
64

REQUIRED SUPPLEMENTARY INFORMATION – PART II
SCHEDULES AND NOTES RELATED TO ACCOUNTING AND
REPORTING FOR PENSIONS AND OPEBS (GASB 68 AND 75)

2015 2016 2017 2018
School District's proportionate share of the net
pension liability 0.014540526% 0.012322215% 0.0119652982% 0.0097455378%
School District's proportionate share of the
net pension liability 2,722,384$ 2,766,090$ 3,543,778$ 2,268,605$
School District's covered-employee payroll 907,290$ 1,004,832$ 737,906$ 746,127$
School District's proportionate share of the
net pension liability as a percentage
of its covered-employee payroll 300.06% 275.28% 480.25% 304.05%
Plan fiduciary net position as a
percentage of the total pension liability 48.62% 47.93% 40.14% 48.10%
Note - The amounts presented for each fiscal year were determined as of
the June 30 measurement date within the prior fiscal year.
(1) Data not available prior to fiscal year 2015 implementation of Governmental Accounting
Standards Board Statement No. 68, Accounting and Financial Reporting for Pensions.
Borough of Edgewater School District
Required Supplementary Information
Schedule of the District's Proportionate Share of the Net Pension Liability
New Jersey Public Employees' Retirement System (PERS)
Last Ten Fiscal Years (1)
65

2015 2016 2017 2018
Contractually required contribution 119,870$ 105,938$ 106,298$ 90,282$
Contributions in relation to the
contractually required contribution (119,870)$ (105,938)$ (106,298)$ (90,282)$
Contribution deficiency (excess) -$ -$ -$ -$
School District's covered-employee payroll 1,004,832$ 737,906$ 746,127$ 820,083$
Contributions as a percentage of
covered-employee payroll 11.93% 14.36% 14.25% 11.01%
(1) Data not available prior to fiscal year 2015 implementation of Governmental Accounting
Standards Board Statement No. 68, Accounting and Financial Reporting for Pensions.
Borough of Edgewater School District
Required Supplementary Information - Schedule of Contributions
New Jersey Public Employees' Retirement System (PERS)
Last Ten Fiscal Years (1)
66

2015 2016 2017 2018
School District's proportion of the net
pension liability (asset) 0.034867692% 0.0378879269% Not available 0.0455030489%
School District's proportionate share of the
net pension liability (asset) 18,635,646$ 23,946,788$ Not available 30,679,796$
School District's covered-employee payroll 5,129,256$ 5,058,574$ 5,085,378$ 5,459,922$
School District's proportionate share of the
net pension liability (asset) as a percentage
of its covered-employee payroll 363.32% 473.39% Not available 561.91%
Plan fiduciary net position as a
percentage of the total pension liability 33.64% 28.71% 22.33% 25.41%
Note - The amounts presented for each fiscal year were determined as of
the June 30 measurement date within the prior fiscal year.
(1) Data not available prior to fiscal year 2015 implementation of Governmental Accounting
Standards Board Statement No. 68, Accounting and Financial Reporting for Pensions.
Borough of Edgewater School District
Required Supplementary Information - Schedule of the
District's Proportionate Share of the Net Pension Liability
New Jersey Teachers' Pension and Annuity Fund (TPAF)
Last Ten Fiscal Years (1)
67

Year Ended June 30,
2018
State's proportion of the OPEB Liability
associated with the District - 0.03%
District's proportionate share of the OPEB liability -$
State's proportionate share of the OPEB
liability associated with the District 17,673,546$
Total proportionate share of the OPEB liability
associated with the District 17,673,546$
Balance at June 30, 2016 18,877,298$
Increased by:
Service cost 1,190,596$
Interest cost 566,356
Member contributions 15,074
1,772,026
Decrease by
Changes of assumptions 2,566,421
Gross benefit payment 409,357
2,975,778
Balance at June 30, 2017 17,673,546$
Covered by employees payroll 6,280,005
Total OPEB liablity as a percentage of coverd employee payroll. 281.24%
* The amounts presented for each fiscal year were determined as of the previous fiscal year-end.
This schedule is presented to illustrate the requirement to show information for ten years. However, until a full ten-year trend is compiled,
governments should present information for those years for which information is available.
Borough of Edgewater School District
Schedule of the State's Proportionate Share of the OPEB Liability Associated With the District
State Health Benefit Local Education Retired Employees Plan
Last Ten Fiscal Years*
See Note to Required Supplementary Information
68

Borough of Edgewater School District
Notes to Required Supplementary Information
Year Ended June 30, 2018
1. PUBLIC EMPLOYEES’ RETIREMENT SYSTEM Benefit Changes There were none. Changes of Assumptions The discount rate changed from 3.98% as of June 30, 2016 to 5.00% as of June 30, 2017. 2. TEACHERS PENSION AND ANNUITY FUND Benefit Changes There were none. Changes of Assumptions The discount rate changed from 3.22% as of June 30, 2016 to 4.25% as of June 30, 2017.
3. NONEMPLOYER OPEB LIABILITY FOR THE STATE HEALTH BENEFIT LOCAL EDUCATION RETIRED EMPLOYEES PLAN Benefit Changes There were none. Changes of Assumptions The discount rate changed from 2.85% as of June 30, 2016 to 3.58% as of June 30, 2017
69

REQUIRED SUPPLEMENTARY INFORMATION –
PART III
BUDGETARY COMPARISON SCHEDULES

Borough of Edgewater School District
Budgetary Comparison Schedule
General Fund
For The Year Ended June 30, 2018
C-1
Sheet #1
Variance
Original Budget Final Final to
REVENUES: Budget Transfers Budget Actual Actual
Local Sources:
Local Tax Levy 19,069,096$ 19,069,096$ 19,069,096$
Interest on investments 1,010 1,010 16,140 15,130$
Miscellaneous 39,500 39,500 97,043 57,543
Total Local Sources 19,109,606 19,109,606 19,182,279 72,673
State Sources:
Special Education Categorical Aid 476,311 59,112$ 535,423 535,423
Security Aid 45,596 45,596 45,596
Transportation Aid 136,664 136,664 136,664
Supplemental Enrichment Growth Aid 255,143 255,143 255,143
Under Adequacy Aid 21,476 21,476 21,476
Extraordinary Special Education Costs Aid 100,000 100,000 119,112 19,112
PARCC Readiness Aid 13,300 13,300 13,300
Per Pupil Growth Aid 13,300 13,300 13,300
Professional Learning Community Aid 13,570 13,570 13,570
Homeless Tuition Reimbursement 11,354 11,354
Additional Nonpublic School Transportation Reimbursement Aid 40,256 40,256
TPAF Post Retirement Medical Benefits (On-Behalf Non-Budgeted) 474,167 474,167
TPAF Long-term Disability Insurance 2,055
TPAF Pension Benefits (On-Behalf-Non-Budgeted) 734,143 734,143
TPAF Social Security Reimbursed (Non-Budgeted) 394,267 394,267
Total - State Sources 1,075,360 59,112 1,134,472 2,809,826 1,673,299
Total Revenues 20,184,966 59,112 20,244,078 21,992,105 1,745,972
EXPENDITURES:
Current Expense:
Regular Programs - Instruction:
Preschool - Salaries of Teachers 8,725 (8,725)
Kindergarten - Salaries of Teachers 435,508 (61,450) 374,058 374,058
Grades 1 - 5 Salaries of Teachers 2,392,341 157,680 2,550,021 2,550,018 3
Grades 6 - 8 Salaries of Teachers 245,905 (12,462) 233,443 233,443
3,082,479 75,043 3,157,522 3,157,519 3
Regular Programs - Home Instruction
Salaries of Teachers 1,500 1,500 1,500
1,500 1,500 1,500
Regular Programs - Undistributed Instruction:
Other Salaries for Instruction 38,700 9,392 48,092 48,091 1
Purchased Technical Services 114,747 14,095 128,842 128,085 757
General Supplies 255,994 (38,308) 217,686 216,936 750
Textbooks 31,317 62,886 94,203 94,203
Other Objects 4,765 (4,445) 320 301 19
445,523 43,620 489,143 487,616 1,527
Total Regular Programs - Instruction 3,528,002 120,163 3,648,165 3,646,635 1,530
Special Education - Instruction:
Cognitive Mild:
Salaries of Teachers 161,482 (161,482)
Other Salaries for Instruction 123,502 (117,268) 6,234 6,234
Total Cognitive Mild 284,984 (278,750) 6,234 6,234
Learning/Language:
Salaries of Teachers 602,123 602,123 602,119 4
Other Salaries for Instruction 336,230 336,230 336,227 3
General Supplies 440 440 440
Total Learning/Language 938,793 938,793 938,346 447
Multiple Disabilities:
Salaries of Teachers 61,229 (61,229)
General Supplies 734 (734)
Total Multiple Disabilities 61,963 (61,963)
See Independent Auditors' Report70

Borough of Edgewater School District
Budgetary Comparison Schedule
General Fund
For The Year Ended June 30, 2018
C-1
Sheet #2
Variance
Original Budget Final Final to
Budget Transfers Budget Actual Actual
EXPENDITURES:
Current Expense:
Resource Room/Resource Center:
Salaries of Teachers 450,524$ (450,524)$
Total Resource Room/Resource Center 450,524 (450,524)
Preschool Disabilities - Full Time:
Other Salaries for Instruction 53,059 (53,059)
53,059 (53,059)
Total Special Education Instruction 850,530 94,497 945,027$ 944,580$ 447$
Bilingual Education - Instruction:
Salaries of Teachers 212,916 49,176 262,092 262,092
Total Bilingual Education - Instruction 212,916 49,176 262,092 262,092
Total Other Special Instruction 212,916 49,176 262,092 262,092
School Sponsored Co curricular Activities - Instruction:
Salaries 32,050 (18,353) 13,697 13,697
Supplies and Materials 192 (192)
Total School Sponsored Co curricular Activities - Instruction: 32,242 (18,545) 13,697 13,697
Total Instruction 4,623,690 245,291 4,868,981 4,867,004 1,977
Undistributed Expenditures :
Instruction:
Tuition to Other LEAs Within the State-Regular 5,908,064 (330,221) 5,577,843 5,577,843
Tuition to Other LEAs Within the State-Special 1,561,505 (64,469) 1,497,036 1,497,036
Tuition to County Special Services Schools & Regional Day Schools 717,964 (4,481) 713,483 713,482 1
Tuition to Priv. Sch. For the Disabled W/I State 55,849 293,440 349,289 349,289
Tuition - State Facilities 21,445 (21,445)
Tuition - Other 21,600 9,956 31,556 31,556
Total Undistributed Expenditures - Instruction 8,286,427 (117,220) 8,169,207 8,169,206 1
Attendance and Social Work Services:
Salaries 10,561 8,795 19,356 19,356
Other Purchased Services 11,856 86 11,942 11,942
Total Attendance and Social Work Services 22,417 8,881 31,298 31,298
Health Services:
Salaries 141,111 (46,593) 94,518 94,517 1
Salaries Other Professional Staff 30,338 30,338 30,338
Purchased Professional and Technical Services 11,763 (4,587) 7,176 7,176
Other Purchased Services (400-500 series) 5,561 5,561 5,560 1
Supplies and Materials 700 410 1,110 1,109 1
Total Health Services 153,574 (14,871) 138,703 138,700 3
Other Support Services - Speech, OT, PT and Related Services:
Salaries 83,954 (120) 83,834 83,834
Purchased Professional - Educational Services 404,995 43,776 448,771 448,771
Total Other Support Services - Speech, OT, PT and Related Services 488,949 43,656 532,605 532,605
Other Support Services- Students - Extraordinary Services:
Purchased Professional - Educational Services 40,555 64,017 104,572 104,572
Supplies and Materials 831 4,201 5,032 5,032
Total Other Support Services- Students - Extraordinary Services 41,386 68,218 109,604 109,604
Other Support Services - Students - Guidance:
Salaries - Other Professional Staff 56,728 (1,450) 55,278 55,278
Total Other Support Services - Students - Guidance 56,728 (1,450) 55,278 55,278
See Independent Auditors' Report71

Borough of Edgewater School District
Budgetary Comparison Schedule
General Fund
For The Year Ended June 30, 2018
C-1
Sheet #3
Variance
Original Budget Final Final to
Budget Transfers Budget Actual Actual
EXPENDITURES:
Other Support Services - Child Study Teams:
Salaries and Other Professional Staff 351,921$ (40,905)$ 311,016$ 311,015$ 1$
Salaries of Secretarial and Clerical Assistants 39,906 1,037 40,943 40,943
Purchased Professional and Technical Services 45,485 42,670 88,155 88,155
Miscellaneous Purchased Services 1,050 (415) 635 634 1
Supplies and Materials 5,232 3,993 9,225 9,225
Total Other Support Services - Child Study Teams 443,594 6,380 449,974 449,972 2
Educational Media Serv./Sch. Library
Salaries 112,006 (7,645) 104,361 104,361
Supplies and Materials 1,000 1,000 1,000
Total Educational Media Serv./Sch. Library 113,006 (7,645) 105,361 105,361
Total Student and Instruction Related Services 1,319,654 103,169 1,422,823 1,422,818 5
Current Expense:
Salaries - Supervisors of Instruction 92,700 (26,989) 65,711 65,711
Purchased Professional - Educational Services 4,572 (4,572)
Other Purchased Professional Services 4,485 (4,485)
Total Instructional Staff Training Services 101,757 (36,046) 65,711 65,711
Support Services - General Administration:
Salaries of Other Professional Staff 239,673 (22,483) 217,190 217,190
Legal Services 15,900 29,506 45,406 45,406
Audit Fees 30,000 750 30,750 30,750
Other Purchased Professional Services 550 (550)
Purchased Technical Services 338 1,249 1,587 1,225 362
Communications/Telephone 44,780 3,017 47,797 47,797
BOE Conferences and Travel 1,051 (751) 300 300
General Supplies 2,716 (381) 2,335 2,334 1
BOE In-House Training/Meeting Supplies 675 14,095 14,770 14,770
Miscellaneous Expenditures 14,006 (1,297) 12,709 12,709
BOE Membership Dues and Fees 8,160 (865) 7,295 7,294 1
Total Support Services - General Administration 357,849 22,290 380,139 379,775 364
Support Services-School Administration:
Salaries of Principals/Assistant Principals 271,416 (23,247) 248,169 248,167 2
Salaries of Secretarial and Clerical Assistants 116,661 (31,363) 85,298 85,296 2
Supplies and Materials 3,002 2,874 5,876 5,876
Other Objects 1,010 5 1,015 1,015
Total Support Services-School Administration 392,089 (51,731) 340,358 340,354 4
Central Services:
Salaries - Business Administrator 142,596 685 143,281 143,281
Salaries - Clerical 125,662 10,156 135,818 135,818
Purchased Professional Services 19,318 11,086 30,404 30,404
Supplies and Materials 3,546 (1,352) 2,194 2,194
Miscellaneous Expenditures 2,600 2,485 5,085 5,025 60
Total Central Services 293,722 23,060 316,782 316,722 60
Administrative Information Technology:
Other Purchased Services (400-500 series) 3,627 749 4,376 4,376
Supplies and Materials 5,624 (3,536) 2,088 2,060 28
Total Administrative Information Technology 9,251 (2,787) 6,464 6,436 28
Required Maint for School Facilities:
Salaries 183,621 6,939 190,560 190,542 18
Cleaning, Repair, and Maintenance Services 97,095 (17,576) 79,519 79,519
General Supplies 15,790 (3,329) 12,461 12,461
Other Objects 378 420 798 798
Total Required Maint for School Facilities 296,884 (13,546) 283,338 283,320 18
See Independent Auditors' Report72

Borough of Edgewater School District
Budgetary Comparison Schedule
General Fund
For The Year Ended June 30, 2018
C-1
Sheet #4
Variance
Original Budget Final Final to
Budget Transfers Budget Actual Actual
EXPENDITURES:
Custodial Services:
Salaries 265,879$ 8,723$ 274,602$ 274,601$ 1$
Cleaning, Repair, and Maintenance Services 46,080 20,634 66,714 66,713 1
Other Purchased Property Services 20,500 25,202 45,702 45,701 1
Insurance 134,226 (29,696) 104,530 104,530
General Supplies 31,015 7,576 38,591 38,590 1
Energy (Electricity) 362,107 (178,894) 183,213 183,213
Other Objects 2,000 1,384 3,384 3,384
Total Custodial Services 861,807 (145,071) 716,736 716,732 4
Security:
Purchased Professional and Technical Services 7,380 7,380 7,380
General Supplies 5,403 5,403 5,403
Total Security 12,783 12,783 12,783
Total Operations and Maintenance of Plant Services 1,158,691 (145,834) 1,012,857 1,012,835 22
Student Transportation Services:
Salaries for Pupil Transportation:
Other Salaries for Instruction 22,124 17,213 39,337 39,337
Between Home & School - Regular 26,655 26,655 26,654 1
Between Home & School - Nonpublic Schools 250 (250)
Health Benefits 1 1 1
Purchased Technical Services 2,142 119 2,261 2,260 1
Contracted Services: -
Aid in Lieu of Payment for Non-public School Students 90,640 29,232 119,872 119,872
Special Education Students - Joint Agreements 274,268 91,628 365,896 365,896
Special Education Students - ESC's and CSTAs 1,084,582 (13,024) 1,071,558 1,071,557 1
Misc. Purchased Services 26,272 2,889 29,161 29,161
General Supplies 4,327 4,327 4,327
Total Student Transportation Expenses 1,500,278 158,790 1,659,068 1,659,064 4
Unallocated Benefits:
Social Security Contributions 150,030 (15,278) 134,752 134,752
Other Retirement Contributions - PERS 130,391 (2,307) 128,084 128,084
Unemployment Compensation 45,180 (45,180)
Workmen's Compensation 68,200 2,819 71,019 71,019
Health Benefits 1,800,449 (43,522) 1,756,927 1,829,133 (72,206)
Tuition Reimbursement 15,000 5,000 20,000 20,000
Other Employee Benefits 36,400 4,850 41,250 41,249 1
Total Unallocated Benefits 2,245,650 (93,618) 2,152,032 2,224,237 (72,205)
On-Behalf Contributions:
TPAF Post Retirement Medical Benefits (non-budgeted) 474,167 (474,167)
TPAF Long-term Disability Insurance 2,055 (2,055)
TPAF Pension Contributions (non-budgeted) 734,143 (734,143)
Reimbursed TPAF Social Security Contributions (non-budgeted) 394,267 (394,267)
Total On-Behalf Contributions 1,604,632 (1,604,632)
Total Personal Services - Employee Benefits 2,245,650 (93,618) 2,152,032 3,828,869 (1,676,837)
Total Undistributed Expenses 15,665,368 (139,927) 15,525,441 17,201,790 (1,676,349)
TOTAL GENERAL CURRENT EXPENSE 20,289,058 105,364 20,394,422 22,068,794 (1,674,372)
Capital Outlay:
Equipment:
Undistributed Expenditures:
Required maintenance for school facilities 154,879 159,215 159,215
Total Equipment 154,879 159,215 159,215
Facilities Acquisition and Construction Services:
Assessment for Debt Service on SDA Funding 27,043 27,043 27,043
Total Facilities Acquisition and Construction Services 27,043 27,043 27,043
TOTAL CAPITAL OUTLAY 27,043 154,879 186,258 186,258
Total Expenditures 20,316,101 264,579 20,580,680 22,255,052 (1,674,372)
Deficiency of Revenues Under Expenditures (131,135) (205,467) (336,602) (262,947) (73,655)
See Independent Auditors' Report73

Borough of Edgewater School District
Budgetary Comparison Schedule
General Fund
For The Year Ended June 30, 2018
C-1
Sheet #5
Variance
Original Budget Final Final to
Budget Transfers Budget Actual Actual
EXPENDITURES:
Other Financing Sources :
Operating Transfers (Out):
Transfers In 293$ 293$
Total Other Financing Sources (Uses) 293 293
(Deficiency) excess of revenues (under) over
expenditures and other financing sources (uses) (131,135)$ (205,467)$ (336,602)$ (262,654) (73,948)
Fund Balances, Beginning of Year 1,584,469 1,584,469 1,584,469
Fund Balances, End of Year 1,453,334$ (205,467)$ 1,247,867$ 1,321,815$ (73,948)$
Recapitulation of (deficiency) excess of
revenues (under) over expenditures and
other financing sources (uses)
Budgeted fund balance (199,498)$ (125,000)$ (324,498)$ (250,550)$ (73,948)
Interest Earned on Maintenance Reserve 10 (10) -
Increase in Capital Reserve 67,353 (67,353) -
Interest Deposit to Capital Reserve 1,000 (1,000) -
Adjustment for prior year encumbrances (12,104) (12,104) (12,104) -
Total (131,135)$ (205,467)$ (336,602)$ (262,654)$ (73,948)$
Recapitulation of fund balance:
Restricted Fund Balance:
Capital reserve 1,022,513$
Maintenance reserve 100,010
Assigned to:
Year end encumbrances 6,479
Unassigned fund balance 192,813
1,321,815
Reconciliation to Governmental Fund Statement (GAAP):
Last state aid payments not recognized on GAAP basis (37,502)
Fund balance per Governmental Funds (GAAP) 1,284,313$
See Independent Auditors' Report74

For The Year Ended June 30, 2018
C-2
Original Final VarianceBudget Transfers Budget Actual Final to Actual
Revenues
State Sources 404,174$ (91,024)$ 313,150$ 279,352$ (33,798)$
Federal Sources 363,098 120,887 483,985 483,985 -
Total Revenues 767,272 29,863 797,135 763,337 (33,798)
Expenditures
Instruction: Salaries of teachers 303,109$ 76,060$ 379,169$ 379,169$
Salaries of supervisors of instruction 43,846 43,846 31,797 12,049
Other purchased services 11,567 (1,465) 10,102 8,134 1,968
Tuition 158,552 (3,521) 155,031 155,031
Supplies and Materials 41,959 50,102 92,061 92,061
Textbooks 922 283 1,205 1,205
Other objects 1,895 1,895 1,500 395
Total Instruction 559,955 123,354 683,309 667,692 15,617
Support Services:
Salaries of family/parent liaison and community parent involvement specialists 68,000 (68,000)
Employee Benefits 122,255 (76,277) 45,978 39,634 6,344
Purchased professional and technical services 32,300 32,300 25,732 6,568
Purchased professional and educational services 15,622 13,091 28,713 25,127 3,586
Other purchased services 3,940 3,940 3,350 590
Supplies and Materials 361 361 361
Other objects 1,440 1,094 2,534 1,802 732
Total Support Services 207,317 (93,491) 113,826 95,645 18,181
Total Expenditures 767,272 29,863 797,135 763,337 33,798
Excess (Deficiency) of Revenues Over (Under) Expenditures $ $ $ $ $
Borough of Edgewater School District
Budgetary Comparison Schedule
Special Revenue Fund
See Independent Auditors' Report
75

C-31 of 2
Note A - Explanation of Differences between Budgetary Inflows and Outflows and GAAP Revenues and Expenditures
SpecialGeneral Revenue Fund Fund
Sources/Inflows of Resources: Actual amounts (budgetary basis) "revenue" from the Budgetary Comparison Schedule (C-1, C-2) 21,992,105$ 763,337$
Differences - Budgetary to GAAP:
State Aid Payment Recognized for: GAAP statements, not recognized for budgetary purposes (prior year) 50,083 2,251 budgetary purposes, not recognized for GAAP statements (current year) (37,502) (1,594)
Total revenues as reported on the statement of revenues, expenditures, and changes in fund balances - governmental funds. 22,004,686$ 763,994$
Uses/Outflows of Resources: Actual amounts (budgetary basis) "total outflows" from the budgetary comparison schedule 22,255,052$ 763,337$
Total expenditures as reported on the statement of revenues, expenditures, and changes in fund balances - governmental funds. 22,255,052$ 763,337$
Borough of Edgewater School District
Required Supplementary Information
Budget-To-GAAP Reconciliation
Note to Required Supplementary Information
For The Year Ended June 30, 2018
See Independent Auditors' Report
76

Borough of Edgewater School District
Required Supplementary Information
Budgetary Comparison Schedule
Note to Required Supplementary Information
For The Year Ended June 30, 2018
C-3
2 of 2
Budgets/Budgetary Control:
Annual appropriated budgets are prepared in the spring of each year for the General, Special Revenue
and Debt Service Funds. The budgets are submitted to the County office. Budgets are prepared using
the modified accrual basis of accounting, The legal level of budgetary control is established at line item
accounts within each fund. Line item accounts are defined as the lowest most specific level, of detail as
established pursuant to the minimum chart of accounts referenced in N.J.A.C. 6:20-2A2(m)1. Transfers of
appropriations may be made by School Board resolution at any time during the fiscal year, All budgetary
amounts presented in the accompanying supplementary information reflect the original budget and the
amended budget, which have been adjusted for legally authorized revisions of the annual budgets during
the year.
Formal budgetary integration into the accounting system is employed as a management control device
during the year. For Governmental Funds, there are no substantial differences between the budgetary
basis of accounting and GAAP, with the exception of the Special Revenue Fund, as noted below.
Encumbrance accounting is also employed as an extension of formal budgetary integration in the
Governmental Fund types. Unencumbered appropriations lapse at fiscal year end.
The accounting records of the Special Revenue Fund are maintained on the grant accounting budgetary
basis. The grant accounting budgetary basis differs from GAAP in that the grant accounting budgetary
basis recognizes encumbrances as expenditures and also recognizes the related revenue, whereas
GAAP basis does not. Sufficient supplemental records are maintained to allow for the presentation of
GAAP basis financial reports.
The General and Special Revenue Fund budgetary revenue differs from GAAP revenue due to a
difference in recognition of the June State aid payments for the current year. Since the State is recording
the June State aid payments in the subsequent fiscal year, the District cannot recognize these payments
on the GAAP financial statements.
77

SUPPLEMENTARY INFORMATION

SPECIAL REVENUE FUND

E-1
p. 1
Title III Title III
Title I Title IIA Other Immigrant Title IV Part B Preschool
231 271 241/273 244/274 282 251 256
Revenues
State Sources
Federal Sources 214,098$ 25,127$ 32,562$ 36,878$ 2,482$ 172,088$ 750$
Total Revenues 214,098$ 25,127$ 32,562$ 36,878$ 2,482$ 172,088$ 750$
Expenditures
Instruction:
Salaries of teachers 141,550$
Tuition 155,031$
Supplies and Materials 8,914 29,212$ 36,878$ 17,057
Other objects 1,500$
Total instruction 150,464 29,212 36,878 1,500 172,088
Support services:
Employee Benefits 39,634
Purchased professional and technical services 24,000 982 750$
Purchased professional and educational services 25,127$
Other purchased services 3,350
Total support services 63,634 25,127 3,350 982 750
Total Expenditures 214,098$ 25,127$ 32,562$ 36,878$ 2,482$ 172,088$ 750$
Borough of Edgewater School District
Special Revenue Fund
Combining Schedule of Revenues and Expenditures - Budgetary Basis
Year ended June 30, 2018
I.D.E.A.
See Independent Auditors' Report 78

E-1
p.2
(continued)
Preschool
Education Corrective Technology English as a
Aid Speech Nursing Initiative Second Language Total
218 508 509 510
Revenues
State Sources 269,416$ 1,786$ 1,802$ 1,650$ 4,698$ 279,352$
Federal Sources 483,985
Total Revenues 269,416$ 1,786$ 1,802$ 1,650$ 4,698$ 763,337$
Expenditures
Instruction:
Salaries of teachers 237,619$ 379,169$
Salaries of supervisors of instruction 31,797 31,797
Other purchased services 1,786$ 1,650$ 4,698$ 8,134
Tuition 155,031
Supplies and Materials 92,061
Textbooks 1,500
Total instruction 269,416 1,786 1,650 4,698 667,692
Support services:
Employee Benefits 39,634
Purchased professional and technical services 25,732
Purchased professional and educational services 25,127
Other purchased services 3,350
Other objects 1,802$ 1,802
Total support services 1,802 95,645
Total Expenditures 269,416$ 1,786$ 1,802$ 1,650$ 4,698$ 763,337$
New Jersey Non - Public Aid
Borough of Edgewater School District
Special Revenue Fund
Combining Schedule of Revenues and Expenditures - Budgetary Basis
Year ended June 30, 2018
See Independent Auditors' Report 79

E-2
Original Budget Final
Budget Transfers Budgeted Actual Variance
EXPENDITURES
Instruction:
Salaries of teachers 177,983$ 59,636$ 237,619$ 237,619$
Salaries of supervisors of instruction 43,846 (12,049) 31,797 31,797
Total Instruction 221,829 47,587 269,416 269,416
Undistributed Expenditures:
Salaries of family/parent liaison and community parent involvement specialists 68,000 (68,000)
Employee Benefits 100,000 (100,000)
Total Undistributed Expenditures 168,000 (168,000)
Total Expenditures 389,829$ (120,413)$ 269,416$ 269,416$
CALCULATION OF BUDGET AND CARRYOVER
Total Revised 2017-18 Preschool Education Aid Allocation 15,944$
Actual Preschool Education Aid Carryover (June 30, 2017) 253,472
Total Preschool Education Aid Funds Available for 2017-18 Budget 269,416
Less: 2016-17 Budgeted Preschool Education Aid (Including prior year budgeted carryover) 269,416
Available & Unbudgeted Preschool Education Aid Funds as of June 30, 2018 -
Add: 2017-18 Unexpended Preschool Education Aid -
2017-18 Actual Carryover - Preschool Education Aid -$
2017-18 Preschool Education Aid Carryover Budgeted for 2018-19 -$
Borough of Edgewater School District
Special Revenue Fund
Pre-school Education Schedule of Expenditures
Budgetary Basis
For The Year Ended June 30, 2018
See Independent Auditors' Report80

CAPITAL PROJECTS FUND

F-1
Expenditures Expenditures Unexpended
Original Current Prior Balance
Project Title/Issue Date Appropriations Year Year June 30,2018
Construction of New George Washington School 12/08/2009 28,728,000$ 28,675,436$ 52,564$
Emergency Generator at Eleanor Van Gelder
School 01/06/2014 441,500 415,381 26,119
29,169,500$ -$ 29,090,817$ 78,683$
Borough of Edgewater School District
Capital Projects Fund
Summary Schedule of Project Expenditures
For the Year Ended June 30, 2018
81

Borough of Edgewater School District
Capital Projects Fund
Summary Schedule of Revenues, Expenditures and Changes in Fund Balance
For the Year Ended June 30, 2018
F-2
Revenues and Other Financing Sources:
Interest Revenue 293$
Total Revenue and Other Financing Sources 293
Expenditures and Other Financing Uses:
Construction Services
Total Expenditures -
Excess (Deficit) of Revenue over (under) Expenditures 293
Other Financing Sources (Uses):
Transfer to General Fund (293)
(293)
Excess (Deficit) of Revenue and Other Financing Sources
Over (Under) Expenditures and Other Financing Uses -
Fund Balance - Beginning of Year 78,683
Fund Balance - Ending of Year 78,683$
Reconciliation to Fund Financial Statements
Fund balance, June 30, 2018 - budgetary basis 78,683$
Less difference in grant revenue recognized (10,346)
Fund balance, June 30, 2018 - GAAP basis 68,337$
See Independent Auditors' Report
82

F-2a
Prior Current Project
Periods Year Totals Authorization
Revenues and Other Financing Sources:
Bond Proceeds and Transfers 28,728,000$ $ 28,728,000$ 28,728,400$
Total Revenue and Other Financing Sources 28,728,000 28,728,000 28,728,400
Expenditures:
Salaries 88,260 88,260 100,000
Solar 48,543 48,543 68,000
New School 2,043,362 2,043,362 1,945,000
Legal Services:
Solar 5,600 5,600 5,600
New School 53,665 53,665 150,000
Purchased Professional and Technical Services 297,368 297,368 270,800
Construction Services:
Solar 289,000 289,000 368,000
New School 22,748,187 22,748,187 22,500,000
New School - Generator 677,066 677,066
Other Purchased Services:
Solar 1,039 1,039 36,800
New School 2,423,346 2,423,346 3,284,200
Total Expenditures 28,675,436 - 28,675,436 28,728,400
Excess (Deficiency) of Revenue Over
(Under) Expenditures 52,564$ $ 52,564$ $
Additional Project Information:
Project Number - New School 1270-N01-09-1000
Project Number - Solar 1270-050-09-1000
Grant Date N/A
Bond Authorization Date December 8, 2009
Bonds Authorized 28,728,400$
Bonds Issued 28,728,000$
Original Authorized Cost 28,725,400$
Change Orders
Revised Authorized Cost 28,728,400$
Change Order Percentage
Percentage Completion 99.82%
Original Target Completion Date Not Readily Available
Revised Target Completion Date Not Readily Available
Borough of Edgewater School District
Capital Projects Fund
Schedule of Project Revenues, Expenditures, Project Status and Project Balance
Budgetary Basis
Construction of a New Elementary School and Installation of
Solar Panels at the Eleanor Van Gelder School
From Inception Through June 30, 2018
See Independent Auditors' Report
83

F-2b
Prior Current Project
Periods Year Totals Authorization
Revenues and Other Financing Sources:
State Sources - SCC Grant 176,500$ 176,500$ 176,500$
Transfer from Capital Reserves 265,000 265,000 265,000
Total Revenue and Other Financing Sources 441,500 - 441,500 441,500
Expenditures:
Architect/Design 15,190 15,190 30,000
Legal Services 4,223 4,223 10,000
Construction Services 395,968 395,968 401,500
Total Expenditures 415,381 - 415,381 441,500
Excess (Deficiency) of Revenue Over
(Under) Expenditures 26,119$ -$ 26,119$ $
Additional Project Information:
Project Number 1270-050-14-1008-G04
Grant Date 1/6/2014
Bond Authorization Date N/A
Bonds Authorized N/A
Bonds Issued N/A
Original Authorized Cost 441,500$
Change Orders
Revised Authorized Cost 441,500$
Change Order Percentage N/A
Percentage Completion 77.47%
Original Target Completion Date 6/30/2016
Revised Target Completion Date Not Readily Available
From Inception Through June 30, 2018
Borough of Edgewater School District
Capital Projects Fund
Schedule of Project Revenues, Expenditures, Project Status and Project Balance
Budgetary Basis
Installation of Generator at the Eleanor Van Gelder School
84

FIDUCIARY FUNDS

Borough of Edgewater School District
Fiduciary Fund
Combining Statement of Net Position
June 30, 2018 H-1
Student
Activity Payroll Total
Assets
Cash and cash equivalents 24,670$ 51,861$ 76,531$
Total assets 24,670$ 51,861$ 76,531$
Liabilities
Accounts payable 5,394$ 5,394$
Payroll deductions and withholdings payable 43,967 43,967
Interfund payable 2,500 2,500
Due to student groups 24,670$ 24,670
Total liabilities 24,670$ 51,861$ 76,531$
Agency
See Independent Auditors' Report 85

Borough of Edgewater School District
Combining Statement of Changes in Net Position
Fiduciary Fund
For The Year Ended June 30, 2018
H-2
NOT APPLICABLE
See Independent Auditors' Report
86

Borough of Edgewater School District
Student Activity Agency Fund
Statement of Activity
For Year Ended June 30, 2018
H-3
Balance, Cash Cash Balance,
June 30, 2017 Receipts Disbursements June 30, 2018
Elementary Schools:
Eleanor Van Gelder 22,083$ 46,388$ 46,266$ 22,205$
George Washington 1,735 7,753 7,023 2,465
Total All Schools 23,818$ 54,141$ 53,289$ 24,670$
See Independent Auditors' Report
87

Borough of Edgewater School District
Payroll Agency Fund
Schedule of Receipts and Disbursements
For The Year Ended June 30, 2018
H-4
Balance Balance
ASSETS June 30, 2017 Additions Deletions June 30, 2018
Cash and cash equivalents 57,875$ 8,802,586$ 8,808,600$ 51,861$
Total Assets 57,875$ 8,802,586$ 8,808,600$ 51,861$
LIABILITIES
Accounts payable 5,829$ 5,167,050$ 5,167,485$ 5,394$
Payroll deductions and withholdings payable 45,294 3,635,536 3,636,863 43,967
Interfund payable 6,752 4,252 2,500
Total Liabilities 57,875$ 8,802,586$ 8,808,600$ 51,861$
See Independent Auditors' Report
88

LONG-TERM DEBT

Borough of Edgewater School District
Long-Term Debt
Schedule of Serial Bonds
For the Year Ended June 30, 2018
I-1
Annual Maturities of Bonds Retired
Outstanding June 30, 2018 Interest Balance or Balance
Purpose Date of Issue Original Issue Date Amount Rate July 1, 2017 Issued Matured June 30, 2018
Eleanor Van Gelder School Roof 08/08/2007 665,000$ 75,000$ 75,000$
Replacement
Construction of a New Elementary School 05/20/2010 28,728,000 03/01/19 455,000$ #### 4.000%
and Installation of Solar Panels at the 03/01/20 465,000 #### 4.000% 27,323,000 26,403,000 920,000$
Eleanor Van Gelder School
Refunding 2003 Series General 03/01/2013 3,080,000 09/01/18 345,000 3.000%
Improvement Bonds 09/01/19 360,000 3.000%
09/01/20 370,000 4.000%
09/01/21 375,000 4.000%
09/01/22 375,000 4.000% 2,155,000 330,000 1,825,000
Refunding 2010 Series General 8/10/2017 26,565,000 03/01/19 15,000 3.000%
Improvement Bonds 03/01/20 20,000 3.000%
03/01/21 510,000 3.000%
03/01/22 535,000 4.000%
03/01/23 570,000 4.000%
03/01/24 1,020,000 4.000%
03/01/25 1,070,000 4.000%
03/01/26 1,120,000 4.000%
03/01/27 1,170,000 4.000%
03/01/28 1,220,000 4.000%
03/01/29 1,265,000 4.000%
03/01/30 1,325,000 4.000%
03/01/31 1,380,000 3.000%
03/01/32 1,425,000 4.000%
03/01/33 1,480,000 3.000%
03/01/34 1,530,000 4.000%
03/01/35 1,590,000 3.125%
03/01/36 1,640,000 3.000%
03/01/37 1,705,000 3.000%
03/01/38 1,775,000 3.000%
03/01/39 1,840,000 3.000%
03/01/40 1,910,000 3.000% 26,565,000$ 450,000 26,115,000
29,553,000$ 26,565,000$ 27,258,000$ 28,860,000$
See Independent Auditors' Report
89

I-2
Borough of Edgewater School District
Long-Term Debt
Schedule of Obligations Under Capital Leases
For The Year Ended June 30, 2018
NOT APPLICABLE
See Independent Auditors' Report
90

Borough of Edgewater School District
Budgetary Comparison Schedule
Debt Service Fund
For The Year Ended June 30, 2018
I-3
Original Final Variance
Budget Budget Actual Final to Actual
Revenues
Local Sources:
Local Tax Levy 1,888,577$ 1,888,577$ 1,888,578$ 1$
State Sources:
Debt Service Aid Type II 86,965 86,965 86,965 -
Total Revenues 1,975,542 1,975,542 1,975,543 1
Expenditures
Regular Debt Service:
Interest Payment 1,205,542 1,205,542 682,074 523,468
Redemption of Principal 770,000 770,000 1,220,000 (450,000)
Cost of Issuance 181,308 (181,308)
Total Regular Debt Service 1,975,542 1,975,542 2,083,382 (107,840)
Excess (Deficit) of Revenues
Over (Under) Expenditures - - (107,839) 107,839
Other Financing Sources (Uses)
Refunding bonds issued 26,565,000 (26,565,000)
Premium on bonds issued 1,876,786 (1,876,786)
Payment to refunding bond escrow agent (28,260,478) 28,260,478
Total other financing sources (uses) 181,308 (181,308)
Excess (Deficit) of Revenues and Other Financing Sources
Over (Under) Expenditures and Other Financing Sources (Uses) 73,469 73,469
Fund Balance, Beginning of Year 1 1 1 -
Fund Balance, End of Year 1$ 1$ 73,470$ 73,469$
See Independent Auditors' Report
91

INTRODUCTION TO THE STATISTICAL SECTION

This part of the District's comprehensive annual financial report presents detailed information as a context
for understanding what the information in the financial statements, note disclosures and required
supplementary information says about the District's overall financial health.
Contents Exhibit
Financial Trends
These schedules contain trend information to help the reader understand
how the District’s financial performance and well-being have changed over time. J-1 thru J-5
Revenue Capacity
These schedules contain information to help the reader assess the factors
affecting the District’s ability to generate its property taxes. J-6 thru J-9
Debt Capacity
These schedules present information to help the reader assess the affordability
of the District’s current levels of outstanding debt and the District’s ability to issue
additional debt in the future. J-10 thru J-13
Demographic and Economic Information
These schedules offer demographic and economic indicators to help the reader
understand the environment within which the District's financial activities take
place and to help make comparisons over time and with other governments. J-14 thru J-15
Operating Information
These schedules contain information about the District's operations and resources
to help the reader understand how the District's financial information relates to the
services the District provides and the activities it performs. J-16 thru J-20
Sources: Unless otherwise noted, the information in these schedules is derived from the comprehensive
annual financial report for the relevant year. The District implemented GASB Statement 34 in a previous
fiscal year. Schedules presenting government-wide information include information beginning in the fiscal
year ended June 30, 2006.
STATISTICAL SECTION

FINANCIAL TRENDS

Borough of Edgewater School District
Net Position By Component
LAST TEN YEARS
(Accrual Basis of Accounting)
UnauditedJ-1
2009 2010 2011 2012 2013 2014 2015 2016 2017 2018
Governmental Activities:
Net investment in capital assets 4,942,981$ 5,188,665$ 5,518,375$ 5,857,262$ 5,585,748$ 5,201,403$ 776,791$ 17,074$
Restricted 3,552,692 3,488,846 26,012,480 6,988,746 2,944,373 2,762,562 1,853,943 1,486,751 1,390,349$ 1,264,330$
Unrestricted 293,293 28,300 (22,537,284) (4,029,920) (313,469) (173,383) (2,030,229) (2,753,138) (3,457,669) (5,413,046)
Total Governmental Activities Net Position 8,788,966$ 8,705,811$ 8,993,571$ 8,816,087$ 8,216,652$ 7,790,582$ 600,505$ (1,249,313)$ (2,067,320)$ (4,148,716)$
Business-Type Activities
Net investment in capital assets 2,695$ 2,479$ 2,263$ 2,047$ 1,831$ 1,615$ 1,399$ 1,183$ 967$ 751$
Unrestricted 35,664 49,169 60,851 81,162 322,601 390,106 577,270 544,044 397,358 98,909
Total Business-Type Activities Net Position 38,359$ 51,648$ 63,114$ 83,209$ 324,432$ 391,721$ 578,669$ 545,227$ 398,325$ 99,660$
Government-Wide:
Net investment in capital assets 4,945,676$ 5,191,144$ 5,520,638$ 5,859,309$ 5,587,579$ 5,203,018$ 778,190$ 18,257$ 967$ 751$
Restricted 3,552,692 3,488,846 26,012,480 6,988,746 2,944,373 2,762,562 1,853,943 1,486,751 1,390,349 1,264,330
Unrestricted 328,957 77,469 (22,476,433) (3,948,759) 9,132 216,723 (1,452,959) (2,209,093) (3,060,311) (5,314,137)
Total District Net Position 8,827,325$ 8,757,459$ 9,056,685$ 8,899,296$ 8,541,084$ 8,182,303$ 1,179,174$ (704,085)$ (1,668,995)$ (4,049,056)$
Source: CAFR Schedule A-1 and District Reports
See Independent Auditors' Report
92

Borough of Edgewater School District
Net Position By Component
LAST TEN YEARS
(Accrual Basis of Accounting)
UnauditedJ-2
Sheet 1
2009 2010 2011 2012 2013 2014 2015 2016 2017 2018
Expenses
Government Activities Instruction:
Regular 3,122,285$ 3,303,923$ 3,422,408$ 3,575,466$ 3,892,617$ 4,006,589$ 4,723,302$ 4,871,840$ 6,527,759$ 7,937,022$
Special Education 647,845 575,935 440,727 558,763 718,988 1,282,620 1,103,161 1,613,187 1,265,663 1,848,632
Other Special Instruction 341,887 537,482 502,098 432,766 412,523 371,600 498,542 348,981 310,137 512,939
Other Instruction 35,864 25,141 51,608 40,843 2,277 22,176 29,214 27,552 26,806
Support Services:
Tuition 5,289,052 5,466,774 5,804,159 6,395,141 6,472,243 6,824,783 6,956,574 7,721,550 8,628,019 8,169,206
Student & Instruction Related Services 1,308,713 1,411,433 1,372,698 1,403,583 1,294,741 1,161,145 1,498,292 1,665,152 2,348,533 2,354,975
General Administration Services 255,315 327,550 306,579 210,194 259,404 439,263 448,325 607,331 521,285 636,341
School Administrative Services 162,069 261,572 203,485 180,058 272,105 542,323 561,341 497,295 507,355 659,510
Central Services 220,859 248,647 283,399 313,520 379,909 385,104 378,193 363,084 406,665 590,283
Administrative Information Technology 68,140 72,743 98,598 89,455 112,826 12,778 12,698 6,050
Plant Operations and Maintenance 817,827 758,260 695,498 625,558 1,113,816 1,134,938 1,367,696 1,253,568 1,585,199 1,618,067
Pupil Transportation 896,694 925,277 929,443 989,317 1,048,643 1,351,962 1,448,681 1,506,819 1,692,283 1,934,947
Special Schools 3,486 18,838 18,135 20,466 17,467 5,333 - - -
Transfer of Funds to Charter Schools 72,114 78,454 38,042 22,431 8,867 - - - -
State Assessment on EDA Grants 21,974 12,779 17,538 27,043 25,912 27,043 - -
Interest on Long-Term Debt 244,732 360,455 1,224,989 1,366,140 1,292,172 1,286,190 1,439,937 1,240,054 1,220,154 2,976,417
Unallocated Depreciation 241,035 244,055 257,290 271,113 1,011,514 1,044,345 5,257,189 1,032,360 - -
Total Governmental Activities Expenses 13,655,803 14,610,199 15,711,542 16,523,206 18,321,469 19,899,292 25,747,351 22,783,528 25,040,604 29,265,145
Business-Type Activities:
Food Service 145,114 172,402 176,593 207,522 254,786 264,873 280,095 276,209 568,781 380,658
Pre-K 395,312 529,723 352,633 435,235 309,392 737,487
Total Business-Type Activities Expenses 145,114 172,402 176,593 207,522 650,098 794,597 632,728 711,444 878,173 1,118,145
Total District-wide Expenses 13,800,917 14,782,601 15,888,135 16,730,728 18,971,567 20,693,889 26,380,079 23,494,973 25,918,777 30,383,290
Program Revenues
Governmental Activities;
Charges for Services 47,695 66,649
Operating Grants and Contributions 1,733,382 1,788,783 791,842 846,298 948,260 879,193 1,101,691 881,472 1,049,682 763,994
Capital Grants and Contributions 264,517 29,336
Total Governmental Activities 1,781,077 1,855,432 791,842 846,298 948,260 879,193 1,101,691 1,145,989 1,079,018 763,994
Business Type Activities;
Charges for Services:
Food Service 110,611 130,764 130,444 147,321 156,168 188,117 202,868 202,651 433,800 227,309
Pre-K 654,072 579,600 493,177 361,600 202,969 489,950
Capital Grants and Contributions - Food Service & Preschool 46,546 54,833 57,760 80,225 81,006 93,789 123,045 112,773 94,502 95,788
Total Business Type Activities 157,157 185,597 188,204 227,545 891,246 861,506 819,090 677,023 731,271 813,047
Total District-wide Program Revenues 1,938,234 2,041,029 980,046 1,073,843 1,839,506 1,740,700 1,920,781 1,823,013 1,810,289 1,577,041
Net (Expense) Revenue
Governmental Activities (11,874,726) (12,754,767) (14,919,701) (15,676,909) (17,373,209) (19,020,099) (24,645,660) (21,637,539) (23,961,586) (28,501,151)
Business-Type Activities 12,043 13,195 11,611 20,024 241,148 66,909 186,361 (34,421) (146,902) (305,098)
Total District-Wide Net (Expense) (11,862,683)$ (12,741,572)$ (14,908,089)$ (15,656,885)$ (17,132,062)$ (18,953,190)$ (24,459,299)$ (21,671,960)$ (24,108,488)$ (28,806,249)$
See Independent Auditors' Report
93

Borough of Edgewater School District
Net Position By Component
LAST TEN YEARS
(Accrual Basis of Accounting)
Unaudited J-2
Sheet 2
2009 2010 2011 2012 2013 2014 2015 2016 2017 2018
General Revenue and Other Changes in Net Positions
Governmental Activities
Property Taxes - General Purpose, Net 11,666,842$ 11,741,879$ 12,154,377$ 12,739,891$ 14,254,469$ 15,632,668$ 16,582,328$ 18,153,303$ 18,695,192$ 19,069,096$
Taxes Levied for Debt Service 730,728 663,320 2,392,641 1,854,451 1,067,270 1,731,143 1,878,556 1,878,700 1,888,284 1,888,578
Unrestricted Grants and Contributions 243,058 112,011 508,663 898,850 1,249,592 1,064,077 1,156,921 1,118,630 2,513,303 5,348,605
Interest and Miscellaneous Income 193,069 154,402 227,054 72,433 202,444 166,140 134,915 359,665 46,800 113,476
Unrecorded Prior Year Expenditures (45,959)
Cancelation of Grants Receivable (75,275)
Transfers (20,240)
Total Governmental Activities General
Revenues and Other Changes 12,833,697 12,671,612 15,207,460 15,499,426 16,773,775 18,594,028 19,752,720 21,510,297 23,143,579 26,419,755
Business-Type Activities;
Investment Earnings 94 70 71 75 380 587 979 - 6,433
Transfers
Total Business-type Activities General
Revenues and Other Changes 70 71 75 380 587 979 - 6,433
Total District-Wide General Revenues and
Other Changes in Net Position 12,482,053 12,833,697 15,207,530 15,499,497 16,773,850 18,594,408 19,753,307 21,511,276 23,143,579 26,419,755
Change in Net Positions
Governmental Activities 958,971 (83,155) 287,760 (177,483) (599,435) (426,071) (4,892,949) (127,242) (818,007) (2,081,396)
Business-type Activities 12,043 13,289 11,681 20,095 241,223 67,289 186,948 (33,442) (146,902) (298,665)
Total District-wide Change in Net Position 971,014$ (69,866)$ 299,441$ (157,388)$ (358,212)$ (358,781)$ (4,706,001)$ (160,684)$ (964,909)$ (2,380,061)$
Source: CAF Schedule A-2 and District records
See Independent Auditors' Report
94

Borough of Edgewater School District
Net Position By Component
LAST TEN YEARS
(Accrual Basis of Accounting)
UnauditedJ-3
2009 2010 2011 2012 2013 2014 2015 2016 2017 2018
General Fund
Reserved 3,327,262$ 3,299,978$
Unreserved 575,348 408,884
Restricted 2,480,182$ 1,874,038$ 2,305,131$ 2,423,454$ 1,801,377$ 1,326,957$ 1,322,011$ 1,122,523$
Assigned 7,768 12,104 6,479
Unassigned 451,141 513,081 421,614 291,136 326,673 408,806 200,271 155,311
Total General Fund 3,902,610$ 3,708,862$ 2,931,323$ 2,387,119$ 2,726,745$ 2,714,589$ 2,128,050$ 1,743,531$ 1,534,386$ 1,284,313$
All Other Governmental Funds:
Reserved 41,006$
Restricted for:
Capital Projects Funds 194,423$ 28,455,235 23,807,614$ 4,229,338$ 725,563$ 339,108$ 52,566$ 152,025$ 68,337$ 68,337$
Debit Service Fund 35,091 2,450 753,681 890,931 137,249 1 1 73,470
Unassigned (Deficit), reported in:
Special Revenue Fund (4,084) (8,005) (1,328) (5,561) (2,251) (1,594)
Total All Other Governmental Funds 225,430$ 28,490,686$ 24,559,967$ 5,114,708$ 862,812$ 339,108$ 52,566$ 152,026$ 66,087$ 140,213$
Total Governmental Funds 4,128,040$ 32,199,548$ 27,491,290$ 7,501,827$ 3,589,557$ 3,053,698$ 2,180,616$ 1,895,557$ 1,600,473$ 1,424,526$
Source: CAFR Schedule B-1 and District records.
GASB #54 was implemented in the 2011 fiscal year, which required the presentation of fund balances to be reported in different classifications from
those presented in prior years. Prior years have not been restated above.
See Independent Auditors' Report
95

Borough of Edgewater School District
Change in Fund Balances-Governmental Funds
LAST TEN YEARS
(Modified Accrual Basis of Accounting)
Unaudited
J-4
2009 2010 2011 2012 2013 2014 2015 2016 2017 2018
Revenues
Tax Levy 12,397,570$ 12,405,199$ 14,547,018$ 14,594,342$ 15,321,739$ 17,363,811$ 18,460,884$ 20,032,003$ 20,583,476$ 20,957,674$
Tuition Charges 47,695 66,649
Interest Earnings 36,225 16,398 2,107 1,162 983 638 3,363 4,035 88 16,140
Miscellaneous 156,844 137,808 224,947 71,271 91,461 167,145 131,552 355,630 46,712 97,336
State Sources 1,764,271 1,493,351 1,070,741 1,488,599 1,999,152 1,772,050 2,012,841 1,747,057 3,114,859 3,189,381
Federal Sources 212,169 407,443 229,764 256,548 198,699 169,579 245,772 517,562 475,211 483,985
Total Revenues 14,614,774 14,526,848 16,074,577 16,411,922 17,612,034 19,473,222 20,854,411 22,656,286 24,220,346 24,744,516
Expenditures
Instruction:
Regular 2,284,748 2,476,753 2,554,507 2,568,775 2,785,103 2,869,575 3,455,434 3,715,804 4,257,917 4,314,327
Special 540,709 462,953 319,472 390,467 494,014 925,445 760,330 1,237,052 825,386 944,580
Other Special 247,679 392,477 362,812 301,240 283,047 257,317 343,610 253,286 202,252 262,092
Other Instruction 26,276 19,181 37,238 28,613 1,575 15,285 21,287 18,034 13,697
Support Services:
Tuition 5,289,052 5,466,774 5,804,159 6,395,141 6,472,243 6,824,783 6,956,574 7,721,550 8,628,019 8,169,206
Student and Instruction Related Services 1,081,518 1,095,363 1,146,240 1,095,584 1,048,576 960,578 1,190,105 1,368,861 1,898,686 1,584,174
General Administrative Services 227,339 306,046 272,296 176,329 222,763 375,538 381,498 524,946 365,651 379,775
School Administrative Services 121,833 197,829 148,041 126,250 187,786 376,710 388,199 362,218 322,933 340,354
Central Services 181,043 202,034 211,917 223,365 267,408 275,941 276,972 282,140 278,403 316,722
Administrative Information Technology 54,984 59,223 77,318 66,052 108,061 12,778 11,219 6,050 4,555 6,436
Plant Operations and Maintenance 595,124 708,888 617,579 527,239 912,007 961,416 1,146,169 1,064,200 1,065,448 1,012,835
Pupil Transportation 866,775 904,391 896,193 955,617 1,020,663 1,298,761 1,431,702 1,494,738 1,466,841 1,659,064
Unallocated Benefits 1,471,438 1,653,241 1,635,813 1,956,309 2,141,430 2,380,351 2,799,533 2,301,158 3,064,896 3,828,869
Special Schools 2,501 13,676 13,050 14,231 12,080 3,675
Transfer Funds to Charter Schools 72,114 78,454 38,042 22,431 8,867
Capital Outlay 369,987 426,182 4,816,356 19,487,006 3,631,813 519,289 601,272 621,339 100,383 186,258
Cost of issuance 181,308
Debt Service:
Principal 540,000 500,000 587,000 610,000 630,000 660,000 700,000 720,000 750,000 1,220,000
Interest and Other Charges 244,481 226,411 1,129,117 1,374,926 1,296,958 1,288,079 1,265,917 1,246,717 1,226,342 682,074
Total Expenditures 14,145,487 15,183,536 20,707,560 36,335,187 21,524,304 20,009,082 21,727,493 22,941,345 24,475,746 25,101,771
Excess (Deficiency) of Revenue
Over (Under) Expenditures 469,287 (656,688) (4,632,983) (19,923,265) (3,912,269) (535,859) (873,081) (285,059) (255,401) (357,255)
Other Financial Sources (Uses)
Transfers In 13,172 9,605 49,147 2,980 637 117 265,057 88 293
Transfers Out (13,172) (9,605) (49,147) (20,240) (2,980) (637) (117) (265,057) (88) (293)
Cancelation of Grant Receivable and Payables (75,275) (39,684)
Unrecorded Prior Year Expenditures (45,959)
Payment to Refunding Bond Escrow Agent (28,260,478)
Premium on Sale of Bonds 196 1,876,786
Bond Proceeds 28,728,000 26,565,000
Total Other Financing Sources (Uses) - 28,728,196 (75,275) (66,199) (39,684) 181,308
Net Change in Fund Balances 469,287$ 28,071,508$ (4,708,258)$ (19,989,463)$ (3,912,269)$ (535,859)$ (873,081)$ (285,059)$ (295,085)$ (175,947)$
Debt Service as Percentage of
Noncapital Expenditures 6.0% 4.9% 10.8% 11.8% 10.8% 10.0% 9.3% 8.7% 8.8% 8.3%
Source: Borough of Edgewater School District Financial Reports.
See Independent Auditors' Report 96

Borough of Edgewater School District
General Fund - Other Local Revenue by Source
LAST TEN YEARS
(Modified Accrual Basis of Accounting)
UnauditedJ-5
Fiscal Year Interest on Rental - Use Medical Prior Year Prior Year Club
Ending June 30, Tuition Investments of Facilities Contributions Reimbursements Voids Fees Other Total
2009 47,695$ 23,053$ 30,000$ 126,844$ 144,589$
2010 66,649 6,989 30,000 107,808 227,592
2011 68,934 10,000 53,625$ 18,206$ 74,182 211,446
2012 2,200 22,500 15,921 40,621
2013 5,136 15,000 22,356 42,492
2014 3,580 3,766 160,436 167,782
2015 3,363 131,426 134,789
2016 4,035 24,000 85,381 211,541$ 13,820$ 20,888 359,665
2017 88 1,056 45,568 46,712
2018 16,140 97,043 113,183
Source: Borough of Edgewater School District records
See Independent Auditors' Report 97

REVENUE CAPACITY

Borough of Edgewater School District
Assessed Value and Estimated Actual Value of Taxable Property
LAST TEN YEARS
Unaudited
J-6
Year
Ended
June 30 Land Vacant Residential Commercial Industrial Apartments Total Assessed Value
Add Public
Utilitiesª
Net Valuation
Taxable
Tax-Exempt
Property
Total Direct
School
Tax Rateᵇ
Estimated Actual
(County Equalized
Value)
2009 49,105,400$ 1,786,728,700$ 618,395,300$ 42,425,700$ 511,108,800$ 3,007,763,900$ 1,150,145$ 3,008,914,045$ 221,474,700$ 0.41$ 2,908,422,685$
2010 47,424,500 1,771,314,100 611,067,900 42,049,000 488,763,400 2,960,618,900 1,450,701 2,962,069,601 222,611,000 0.455 2,894,436,437
2011 45,227,200 1,463,121,400 581,383,500 30,204,400 478,473,100 2,598,409,600 1,259,173 2,599,668,773 211,990,500 0.561 2,821,205,491
2012 45,227,200 1,466,104,500 578,261,800 30,204,400 479,814,600 2,599,612,500 1,188,586 2,600,801,086 215,832,700 0.577 2,979,498,567
2013 53,129,100 1,483,198,300 572,208,300 25,614,400 489,200,000 2,623,350,100 1,342,815 2,624,692,915 215,825,000 0.616 3,015,344,943
2014 42,707,100 1,509,306,200 590,875,500 25,614,400 489,009,900 2,657,513,000 1,409,977 2,658,922,977 215,825,200 0.670 3,021,486,850
2015 60,858,500 1,570,040,600 605,247,900 25,614,400 480,777,600 2,742,539,000 1,597,567 2,744,136,607 217,951,600 0.711 3,141,467,580
2016 89,097,900 1,644,915,900 592,568,500 25,614,400 460,069,100 2,812,265,800 1,575,594 2,812,265,800 217,864,300 0.722 3,352,389,394
2017 49,981,100 1,665,841,800 620,284,700 25,614,400 534,740,200 2,896,462,200 1,567,489 2,896,462,200 217,928,400 0.717 3,621,299,388
2018 76,150,100 1,800,727,000 587,567,400 25,614,400 457,899,700 2,947,958,600 Not available 2,947,968,000 Not available 0.726 3,821,748,979
ª - Taxable Value of Machinery, Implements and Equipment of Telephone, Telegraph and Messenger System Companies.
ᵇ - Tax rates are per $100 of assessed value.
* - Revaluation effective in this year.
N/A - Not Provided
Source: Borough of Edgewater Tax Assessor.
Note: Real property is required to be assessed at some percentage of true value (fair or market value) established by each County Board of Taxation. Reassessment occurs when ordered by the County Board of Taxation.
See Independent Auditors' Report98

Borough of Edgewater School District
Direct and Overlapping Tax Rates
LAST TEN YEARS
Unaudited
(Rate per $100 of Assessed Value)J-7
Overlapping Rates
Year Ended
June 30, Basic Rate ª
General
Obligation
Debt
Serviceᵇ
Total
Direct
Borough of
Edgewater
Bergen
County
Total Direct
and
Overlapping
Tax Rate
2009 0.386$ 0.024$ 0.410$ 0.560$ 0.180$ 1.150$
2010 0.431 0.024 0.46 0.581 0.19 1.225
2011 0.469 0.092 0.56 0.700 ** 0.22 1.480 *
2012 0.490 0.087 0.58 0.732 0.26 1.556
2013 0.543 0.073 0.62 0.740 0.27 1.626
2014 0.595 0.075 0.67 0.766 0.26 1.701
2015 0.624 0.087 0.71 0.771 0.28 1.755
2016 0.662 0.060 0.77 0.766 0.29 1.779
2017 0.665 0.067 0.72 0.774 0.31 1.800
2018 0.658 0.068 0.73 0.787 0.32 1.833
ᵇ - Rates for debt service are based on each year's requirements.
* - Reflects revaluation of real property.
** Includes Library
Source: Borough of Edgewater Tax Collector and School Business Administrator
Borough of Edgewater School District
Direct Rate
Note: N.J.S.A. 18A:7F-5D limits the amount that the District can submit for a General Fund tax levy. The levy,
when added to other components of the District's net budget, may not exceed the pre-budget year net budget
by more than the spending growth limitation calculation.
ª - The District's basic tax rate is calculated from the A4F form which is submitted with the budget and the Net
Valuation Taxable.
See Independent Auditors' Report
99

Borough of Edgewater School District
Principal Property Taxpayers
CURRENT YEAR
UnauditedJ-8
Taxpayer
Taxable
Assessed
Valuation
% of Total
District's Net
Assessed Value
Not available Not available Not available
Not available Not available Not available
Not available Not available Not available
Not available Not available Not available
Not available Not available Not available
Not available Not available Not available
Not available Not available Not available
Not available Not available Not available
Not available Not available Not available
Not available Not available Not available
Total -$ 0.00%
Source: Borough of Edgewater Tax Assessor.
2018
See Independent Auditors' Report
100

Borough of Edgewater School District
Property Tax Levies and Collections
LAST TEN YEARS
Unaudited
J-9
Fiscal
Year
Ended
June 30
Taxes Levied for
the Fiscal Year Amount
Percentage of
Levy
Collections in
Subsequent Years
2009 12,397,570$ 12,397,570$ 100.00% -$
2010 12,405,199 12,405,199 100.00% -
2011 14,547,018 14,547,018 100.00% -
2012 14,594,342 14,594,342 100.00% -
2013 15,321,739 15,321,739 100.00% -
2014 17,363,811 17,363,811 100.00% -
2015 18,460,884 18,460,884 100.00% -
2016 20,282,952 20,282,952 100.00% -
2017 20,583,476 20,583,476 100.00% -
2018 20,957,674 20,957,674 100.00% -
Collected Within the Fiscal Year of the Levyª
ª - School taxes are collected by the Municipal Tax Collector. Under New Jersey State statute, a municipality is required
to remit to the School District the entire property tax balance, in the amount voted upon or certified prior to the end of the
school year.
Source: Borough of Edgewater School District records, including the Certificate and Report of Report of School Taxes
(A4F form).
See Independent Auditors' Report
101

DEBT CAPACITY

Borough of Edgewater School District
Ratios of Outstanding Debt by Type
LAST TEN YEARS
Unaudited J-10
Fiscal Year
Ended June 30,
General
Obligation
Bonds
Bond
Anticipation
Notes (BANs) Total District
Percentage of
Personal
Incomeª Per Capitaᵇ
2009 6,092,000$ 6,092,000$ 0.94% 636.04$
2010 34,320,000 1,000,000$ 35,320,000 5.42% 3,669.99
2011 33,733,000 33,733,000 4.44% 2,929.99
2012 33,123,000 33,123,000 4.19% 2,857.89
2013 32,383,000 32,383,000 4.03% 2,704.89
2014 31,723,000 31,723,000 3.70% 2,645.35
2015 31,023,000 31,023,000 3.44% 2,513.41
2016 30,653,000 30,653,000 3.30% 2,547.20
2017 29,553,000 29,553,000 2.94% 2,389.47
2018 28,860,000 28,860,000 Not available Not available
Note: Details regarding the District's outstanding debt can be found in the notes to the
basic financial statements
Source: Borough of Edgewater School District Financial Reports.
Governmental Activities
ª - See J-14 for personal income and population data. These ratios are calculated using
personal income and population for the prior calendar year.
See Independent Auditors' Report
102

Borough of Edgewater School District
Ratios of General Bonded Debt Outstanding
LAST TEN YEARS
UnauditedJ-11
General Bonded Debt Outstanding
Fiscal
Year
Ended
June 30,
General Obligation
Bonds Deductions
Net General
Bonded Debt
Outstanding
Percentage of
Net Valuation
Taxableª Per Capitaᵇ
2009 6,092,000$ 6,092,000$ 0.202% 636.04$
2010 34,320,000 34,320,000 1.141% 3,566.08
2011 33,733,000 33,733,000 1.30% 2,929.99
2012 33,123,000 33,123,000 1.27% 2,857.89
2013 32,383,000 32,383,000 1.23% 2,704.89
2014 31,723,000 31,723,000 1.19% 2,645.35
2015 31,023,000 31,023,000 1.13% 2,513.41
2016 30,653,000 30,653,000 1.12% 2,547.20
2017 29,553,000 29,553,000 0.73% 2,389.47
2018 28,860,000 28,860,000 N/A N/A
Note: Details regarding the District's outstanding debt can be found in the Notes to Financial Statements.
ª - See J-6 for property tax data. This ratio is calculated using valuation data for the prior calendar year.
ᵇ - See J-14 for population data. This ratio is calculated using population for the prior calendar year.
Source: Borough of Edgewater School District Financial Reports.
See Independent Auditors' Report
103

Borough of Edgewater School District
Ratios of Overlapping Governmental Activities Debt
As of June 30, 2018
Unaudited
J-12
Governmental Unit
Debt
Outstanding
Estimated
Percentage
Applicableª
Estimated Share
of Overlapping
Debt
Debt Repaid with Property Taxes:
Borough of Edgewater Not available Not available Not available
Bergen County General Obligation Debt Not available
Total Overlapping Debt Not available
Borough of Edgewater School District Direct Debt Not available
Total Direct and Overlapping Debt Not available
N/A
Note: Overlapping governments are those that coincide, at least in part, with the geographic boundaries of the District.
This schedule estimates the portion of the outstanding debt of those overlapping governments that are borne by
residents and businesses of the Borough of Edgewater. This process recognizes that, when considering the District's
ability to issue and repay long-term, the entire debt burden borne by the residents and businesses should be taken into
account. However this does not imply that every taxpayer is a resident, and therefore responsible for repaying the debt,
of each overlapping unit.
ª - For debt repaid with property taxes, the percentage of overlapping debt applicable is estimated using taxable
equalized property values. Applicable percentages were estimated by determining the portion of another governmental
unit's equalized property value that is within the District's boundaries and dividing it by each unit's total equalized
property value.
Sources: Assessed value data used to estimate applicable percentages provided by the Bergen County Board of
Taxation; debt outstanding data provided by each governmental unit.
See Independent Auditors' Report
104

Borough of Edgewater School District
Legal Debt Margin Information
LAST TEN YEARS
Unaudited
J-13
Legal Debt Margin Calculation for Fiscal Year 2018
Year
Equalized Valuation
Basis
2018 4,064,819,927$
2017 3,678,678,857
2016 3,432,841,821
11,176,340,605$
Average Equalized Valuation of Taxable Property 3,725,446,868$
Debt Limit (2.5% of Average Equalization Value)ª 93,136,172$
Net Bonded School Debt as of December 31, 2018 28,860,000
Legal Debt Margin 64,276,172$
2009 2010 2011 2012 2013 2014 2015 2016 2017 2018
Debt Limit 69,785,664$ 70,463,535$ 71,937,878$ 73,334,349$ 73,871,578$ 73,809,045$ 75,526,865$ 74,822,133$ 81,830,530$ 93,136,172$
Total Net Debt Applicable
to Limit 34,320,000 34,320,000 33,733,000 33,123,000 32,383,000 31,723,000 31,023,000 30,303,000 29,553,000 28,860,000
Legal Debt Margin 35,465,664$ 36,143,535$ 38,204,878$ 40,211,349$ 41,488,578$ 42,086,045$ 44,503,865$ 44,519,133$ 52,277,530$ 64,276,172$
Total Net Debt applicable to
the Limit as a Percentage
of Debt Limit 12.12% 10.97% 8.98% 49.18% 44.16% 42.94% 42.03% 40.59% 39.97% 30.99%
ª - Limit set by N.J.S.A. 18A:24-19 for a K through 6 district; other % limits would be applicable for other districts.
Source: Equalized valuation bases were provided by the Annual Report of the State of New Jersey. Department of Treasury, Division of Taxation.
See Independent Auditors' Report
105

DEMOGRAPHIC AND ECONOMIC INFORMATION

Borough of Edgewater School District
Demographic and Economic Statistics
LAST TEN YEARS
UnauditedJ-14
Year
Borough
Populationª
Bergen County
Per Capita
Personal Incomeᵇ
Borough Personal
Incomeᶜ
Borough
Unemployment Rateᵈ
2009 9,624 64,388 651,506,304 8.40%
2010 11,526 63,198 728,420,148 8.60%
2011 11,590 65,486 758,982,740 8.40%
2012 11,972 66,096 791,301,312 8.60%
2013 11,992 66,985 803,284,120 7.70%
2014 12,343 69,495 857,776,785 6.40%
2015 12,034 70,498 847,372,932 6.00%
2016 12,044 73,536 885,667,584 5.60%
2017 12,368 81,203 1,004,318,704 7.70%
2018 Not available Not available Not available Not available
Source:
ª - Population information provided by the US Department of Census - Population Division.
ᵈ - Unemployment data provided by the NJ Department of Labor and Workforce Development.
* - Latest Bergen County per capita personal income available (2017) was used for calculation purposes.
ᵇ - Per Capita Personal Income provided by the US Department of Commerce - Bureau of Economic Analysis
ᶜ - Personal Income information provided by the US Department of Commerce - Bureau of Economic Analysis.
See Independent Auditors' Report
106

Borough of Edgewater School District
Principal Employers
CURRENT YEAR AND
TEN YEARS AGO
UnauditedJ-15
2018 2009
Employer Employees
% of Total
Municipal
Employment Employer Employees
% of Total
Municipal
Employment
* * * * * *
* * * * * *
* * * * * *
* * * * * *
* * * * * *
* * * * * *
* * * * * *
* * * * * *
* * * * * *
* * * * * *
NOTE:
The District was unsuccessful in its attempts to obtain information regarding the principal
employers of the Borough of Edgewater.
*Information not available
See Independent Auditors' Report 107

Borough of Edgewater School District
Full-Time Equivalent District Employees by Function/Program
LAST TEN YEARS
Unaudited
J-16
2009 2010 2011 2012 2013 2014 2015 2016 2017 2018
Function/Program
Instruction
Regular 36.0 36.0 44.5 46.5 47.0 48.0 52.7 54.2 56.4 58.4
Special Education 4.0 4.0 6.0 6.0 8.0 8.0 8.6 8.6 9.6 9.6
Other Special Education 4.0 4.0 5.0 5.0 5.0 5.0 7.0
Other Instruction 1.0 1.0 1.0 1.0 1.0 1.0 4.0 6.0 8.0
Support Services:
Student & Instruction Related Services 5.5 5.5 6.5 6.5 6.5 7.0 29.1 28.0 27.0 27.2
General Administration Services 1.5 1.5 1.0 1.0 1.0 2.0 2.0 2.0 2.0 2.0
School Administration Services 2.0 2.0 2.0 2.0 2.0 2.0 5.6 5.6 5.6 5.6
Central Services 3.0 3.0 3.5 3.5 4.0 5.0 3.8 3.0 3.0 3.0
Administration Information Technology 1.0 1.0 1.5 1.5 2.0 2.0 0.0 0.0 0.0 0.0
Plant Operations and Maintenance 5.0 5.0 5.0 5.0 12.5 14.0 14.0 12.5 12.5 12.5
Career Life Skills
Total 58.2 63.0 63.0 78.0 89.0 94.0 119.8 119.9 124.1 125.3
Source: Borough of Edgewater District Personnel Records
See Independent Auditors' Report
108

OPERATING INFORMATION

Borough of Edgewater School District
Operating Statistics
LAST TEN YEARS
Unaudited
J-17
Fiscal Year Pre-K-6 7-12
Operating
Expendituresª
Cost per
Pupilᵇ
Percentage
Change
Teaching
Staffᶜ
Pupil/
Teacher
Ratio
Average
Daily
Enrollment
(ADE)ᵈ
Average
Daily
Attendance
(ADA)ᵈ
% Change in
Average
Daily
Enrollment
Student
Attendance
Percentage
2009 488 269 12,991,019$ 17,161$ -4.32% 36 13.56:1 486 463 9.21% 95.27%
2010 597 295 14,030,943 15,730 -8.34% 36 16.50:1 594 566 22.22% 95.29%
2011 628 325 14,197,062 14,897 -5.30% 44.5 14.11:1 618.8 590.8 4.42% 95.57%
2012 656 337 14,614,975 14,718 -1.20% 46.5 14.11:7 663.7 634.2 7.00% 95.50%
2013 780 343 15,717,584 13,996 -4.90% 47 16.3:1 764.8 731.3 15.00% 95.60%
2014 808 381 17,339,394 14,583 10.31% 48 16.8:1 865 826.5 13.07% 95.97%
2015 905 379 18,901,616 14,721 0.90% 53 17.1:1 907.4 867.1 4.90% 95.55%
2016 906 381 19,462,818 15,122 2.72% 54 16.8:1 905.9 870.2 0.00% 96.06%
2017 903 372 22,398,661 17,568 16.17% 56 16.1:1 906.4 862.3 0.00% 95.14%
2018 976 414 22,832,131 16,426 -6.50% 58 16.8:1 956.7 907.2 5.55% 94.84%
Note: Enrollment based on annual October District count.
ª - Operating expenditures equal total expenditures less debt service and capital outlay.
ᵇ - Cost per pupil represents operating expenditures divided by enrollment. This cost per pupil may be different from other cost per pupil calculations.
ᶜ - Teaching staff includes only full-time equivalents of certificated staff.
ᵈ - Average daily enrollment and average daily attendance are obtained from the School Register Summary (SRS).
Source: Borough of Edgewater School District Records
Enrollment - Grades
See Independent Auditors' Report 109

Borough of Edgewater School District
School Building Information
LAST TEN YEARS
Unaudited
J-18
2009 2010 2011 2012 2013 2014 2015 2016 2017 2018
District Building
Elementary
George Washington School (2012):
Square Feet 23,155 23,155 N/A N/A 100,000 100,000 100,000 100,000 100,000 100,000
Capacity (students) 350 350 N/A N/A 925 925 925 925 925 925
Enrollment N/A N/A N/A N/A 423 460 525 508 488 488
Eleanor Van Gelder School (1914):
Square Feet 63,941 63,941 63,941 63,941 63,941 63,941 63,941 63,941 63,941 63,941
Capacity (students) 565 565 565 565 565 565 565 565 565 565
Enrollment 488 597 628 656 332 348 382 398 418 418
Number of Schools at June 30, 2018
Elementary = 2
Other = N/A - Not Applicable.
Note: Year of original construction is shown in parentheses. Enrollment is based on the annual October District count.
Source: Borough of Edgewater School District Board office.
See Independent Auditors' Report
110

Borough of Edgewater School District
Schedule of Required Maintenance for School Facilities
LAST TEN YEARS
Unaudited
J-19
UNDISTRIBUTED EXPENDITURES - REQUIRED
MAINTENANCE FOR SCHOOL FACILITIES
11-000-261-xxx
School Facilities* 2009 2010 2011 2012 2013 2014 2015 2016 2017 2018
George Washington $ $ $ $ 96,842$ 139,583$ 193,588$ 199,672$ 204,665$ 193,685$
Eleanor Van Gelder 132,590 247,936 187,657 178,050 118,775 149,585 82,966 86,266 89,403 89,635
132,590$ 247,936$ 187,657$ 178,050$ 215,617$ 289,168$ 276,554$ 285,938$ 294,068$ 283,320$
* - School facilities as defined under EFCFA (N.J.A.C. 6A:26-1-2 and N.J.A.C. 6:26-1.3).
Source: Borough of Edgewater School District Records
See Independent Auditors' Report 111

Borough of Edgewater School District
Insurance Schedule
June 30, 2018
UnauditedJ-20
Coverage Deductible
School Package Policy - NJ Schools Insurance Group:
Property:
Blanket Real and Personal Property Per Occurrence 50,000,000$ 5,000$
Blanket Extra Expense 50,000,000 5,000
Blanket Valuable Papers 10,000,000 5,000
Flood Insurance:
Zones A and V 25,000,000 500,000
All Other Zones 75,000,000 10,000
Earthquake Insurance 50,000,000 5,000
Demolition and Increased Cost of Construction 25,000,000 5,000
Electronic Data Processing:
Blanket Hardware 250,000 1,000
Blanket Extra Expense Included 1,000
Boiler and Machinery:
Property Damage 100,000,000 5,000
Crime:
Public Employee Dishonesty with Faithful Performance 500,000 1,000
Theft, Disappearance and Destruction:
Loss of Money and Securities 25,000 500
Money Orders and Counterfeit Paper Currency 25,000 500
Forgery or Alteration 500,000 1,000
Computer Fraud 500,000 1,000
Comprehensive General Liability:
Bodily Injury and Property Damage 16,000,000 1,000
Employee Benefit Liability 16,000,000 1,000
Automobile:
Liability 16,000,000
School Board Legal Liability - NJ Schools Insurance Group
Group:
School Leaders Errors and Omissions:
Coverage A 16,000,000 5,000
Coverage B 100,000/300,000 5,000
Workers' Compensation and Employers' Liability - NJ Schools Insurance Group
Association Insurance Group:
Workers' Compensation Statutory
Employers' Liability 2,000,000
Public Employees' Faithful Performance Blanket Position Bond- NJSBAIG
Board Secretary 230,000 1,000
Treasurer 230,000 1,000
Source: Borough of Edgewater School District records.
See Independent Auditors' Report
112

SINGLE AUDIT SECTION

PKF O’CONNOR DAVIES, LLP 20 Commerce Drive, Suite 301, Cranford, NJ 07016 I Tel: 908.272.6200 I Fax: 908.272.2416 I www.pkfod.com
PKF O’Connor Davies, LLP is a member firm of the PKF International Limited network of legally independent firms and does not accept any responsibility or liability for the actions or inactions on the part of any other individual member firm or firms.
K-1
Report on Internal Control Over Financial Reporting and on Compliance and Other
Matters Based on an Audit of Financial Statements Performed
in Accordance with Government Auditing Standards
Independent Auditors’ Report
The Honorable President and Members
of the Board of Education
Borough of Edgewater School District
County of Bergen
Edgewater, New Jersey We have audited, in accordance with the auditing standards generally accepted in the United States of America; audit requirements as prescribed by the Office of School Finance, Department of Education, State of New Jersey; and the standards applicable to financial audits contained in Government Auditing Standards, issued by the Comptroller General of the United States, the financial statements of the governmental activities, the business-type activities, each major fund, and the aggregate remaining fund information of the Borough of Edgewater School District’s, in the County of Bergen, New Jersey (the “District”) as of and for the year ended June 30, 2018, and the related notes to the financial statements, which collectively comprise the District’s basic financial statements, and have issued our report thereon dated March 15, 2019. Internal Control Over Financial Reporting In planning and performing our audit of the financial statements, we considered the District’s internal control over financial reporting (internal control) to determine the audit procedures that are appropriate in the circumstances for the purpose of expressing our opinions on the financial statements, but not for the purpose of expressing an opinion on the effectiveness of the District’s internal control. Accordingly, we do not express an opinion on the effectiveness of the District’s internal control. A deficiency in internal control exists when the design or operation of a control does not allow management or employees, in the normal course of performing their assigned functions, to prevent, or detect and correct, misstatements on a timely basis. A material weakness is a deficiency, or a combination of deficiencies, in internal control, such that there is a reasonable possibility that a material misstatement of the District’s financial statements will not be prevented, or detected and corrected on a timely basis. A significant deficiency is a deficiency, or a combination of deficiencies, in internal control that is less severe than a material weakness, yet important enough to merit attention by those charged with governance. We consider the deficiency described in the accompanying schedule of findings and questioned costs to be a significant deficiency, 2018-001.
113

The Honorable President and Members of the Board of Education Borough of Edgewater School District Page 2 Our consideration of internal control was for the limited purpose described in the first paragraph of this section and was not designed to identify all deficiencies in internal control that might be material weaknesses or significant deficiencies. Given these limitations, during our audit we did not identify any deficiencies in internal control that we consider to be material weaknesses. However, material weaknesses may exist that have not been identified. Compliance and Other Matters As part of obtaining reasonable assurance about whether the District’s financial statements are free of material misstatement, we performed tests of its compliance with certain provisions of laws, regulations, contracts, and grant agreements, noncompliance with which could have a direct and material effect on the determination of financial statement amounts. However, providing an opinion on compliance with those provisions was not an objective of our audit, and accordingly, we do not express such an opinion. The results of our tests disclosed no instances of noncompliance or other matters that are required to be reported under Government Auditing Standards and the audit requirements as prescribed by the Office of School Finance, Department of Education, State of New Jersey. District’s Response to Finding The District’s response to the finding identified in our audit is described in the accompanying schedule of findings and questioned costs. The District’s response was not subjected to the auditing procedures applied in the audit of the financial statements and, accordingly, we express no opinion on it. Purpose of this Report The purpose of this report is solely to describe the scope of our testing of internal control and compliance and the results of that testing, and not to provide an opinion on the effectiveness of the District's internal control or on compliance. This report is an integral part of an audit performed in accordance with Government Auditing Standards in considering the District's internal control and compliance. Accordingly, this communication is not suitable for any other purpose.
March 15, 2019
Cranford, New Jersey
Michael Andriola, CPA
Licensed Public School Accountant No. 2429
114

K-2
Report on Compliance For Each Major Federal and State Program and on Internal Control Over Compliance Required by the
New Jersey OMB Circular 15-08
Independent Auditors’ Report
The Honorable President and Members of the Board of Education Borough of Edgewater School District County of Bergen Edgewater, New Jersey Report on Compliance for Each Major State Program We have audited the Borough of Edgewater School District’s, in the County of Bergen, New Jersey (the “District”) compliance with the types of compliance requirements described in the New Jersey State Aid/Grant Compliance Supplement that could have a direct and material effect on each of the District’s major state programs for the year ended June 30, 2018. The District’s major state programs are identified in the summary of auditors’ results section of the accompanying schedule of findings and questioned costs.
Management’s Responsibility Management is responsible for compliance with the state statutes, regulations, and the terms and conditions of its state awards applicable to its state programs. Auditor’s Responsibility Our responsibility is to express an opinion on compliance for each of the District’s major state programs based on our audit of the types of compliance requirements referred to above. We conducted our audit of compliance in accordance with auditing standards generally accepted in the United States of America; the standards applicable to financial audits contained in Government Auditing Standards, issued by the Comptroller General of the United States; the audit requirements as prescribed by the Office of School Finance, Department of Education, State of New Jersey; and the audit requirements of New Jersey OMB’s Circular 15-08, Single Audit Policy for Recipients of State Grants and State Aid. Those standards and New Jersey OMB Circular 15-08 require that we plan and perform the audit to obtain reasonable assurance about whether noncompliance with the types of compliance requirements referred to above that could have a direct and material effect on a major state program occurred. An audit includes examining, on a test basis, evidence about the District’s compliance with those requirements and performing such other procedures as we considered necessary in the circumstances.
PKF O’CONNOR DAVIES, LLP 20 Commerce Drive, Suite 301, Cranford, NJ 07016 I Tel: 908.272.6200 I Fax: 908.272.2416 I www.pkfod.com
PKF O’Connor Davies, LLP is a member firm of the PKF International Limited network of legally independent firms and does not accept any responsibility or liability for the actions or inactions on the part of any other individual member firm or firms.
115

The Honorable President and Members of the Board of Education Borough of Edgewater School District Page 2 We believe that our audit provides a reasonable basis for our opinion on compliance for each major state program. However, our audit does not provide a legal determination of the District’s compliance. Opinion on Each Major State Program In our opinion, the District complied, in all material respects, with the types of compliance requirements referred to above that could have a direct and material effect on each of its major state programs for the year ended June 30, 2018. Report on Internal Control Over Compliance Management of the District is responsible for establishing and maintaining effective internal control over compliance with the types of compliance requirements referred to above. In planning and performing our audit of compliance, we considered the District’s internal control over compliance with the types of requirements that could have a direct and material effect on each major state program to determine the auditing procedures that are appropriate in the circumstances for the purpose of expressing an opinion on compliance for each major state program and to test and report on internal control over compliance in accordance with the New Jersey OMB Circular 15-08, but not for the purpose of expressing an opinion on the effectiveness of internal control over compliance. Accordingly, we do not express an opinion on the effectiveness of the District’s internal control over compliance. A deficiency in internal control over compliance exists when the design or operation of a control over compliance does not allow management or employees, in the normal course of performing their assigned functions, to prevent, or detect and correct, noncompliance with a type of compliance requirement of a state program on a timely basis. A material weakness in internal control over compliance is a deficiency, or combination of deficiencies, in internal control over compliance, such that there is a reasonable possibility that material noncompliance with a type of compliance requirement of a state program will not be prevented, or detected and corrected, on a timely basis. A significant deficiency in internal control over compliance is a deficiency, or a combination of deficiencies, in internal control over compliance with a type of compliance requirement of a state program that is less severe than a material weakness in internal control over compliance, yet important enough to merit attention by those charged with governance. Our consideration of internal control over compliance was for the limited purpose described in the first paragraph of this section and was not designed to identify all deficiencies in internal control over compliance that might be material weaknesses or significant deficiencies. We did not identify any deficiencies in internal control over compliance that we consider to be material weaknesses. However, material weaknesses may exist that have not been identified.
116

The Honorable President and Members of the Board of Education Borough of Edgewater School District
Page 3
Purpose of this Report
The purpose of this report on internal control over compliance is solely to describe the scope of
our testing of internal control over compliance and the results of that testing based on the
requirements of the New Jersey OMB Circular 15-08. Accordingly, this report is not suitable for
any other purposes.
March 15, 2019
Cranford, New Jersey
Michael Andriola, CPA
Licensed Public School Accountant No. 2429
117

Borough of Edgewater School District
Schedule of Expenditures of Federal Awards
For The Year Ended June 30, 2018
K-3
Schedule A
Federal Grantor/ Federal Federal Balance, June 30, 2017 Repayment of Balance, June 30, 2018
Pass-Through Grantor CFDA FAIN Award (Accounts Unearned Due To Cash Budgetary Prior Year (Accounts Unearned Due To
Program Title Number Number Amount Grant Period Receivable) Revenue Grantor Received Expenditures Balance Receivable) Revenue Grantor
U.S. Department of Education
Passed - Through State of New Jersey
Department of Education:
Special Revenue Fund:
Special Education Cluster:
IDEA Part B 84.027 S027A180100 176,430$ 7/1/17-6/30/18 161,108$ (172,088)$ (10,980)$
IDEA Part B 84.027 S027A170100 226,004 7/1/16-6/30/17 (9,809)$ 9,809
IDEA Preschool 84.173 S173A180114 1,053 7/1/17-6/30/18
IDEA Preschool 84.173 S173A170114 7,225 7/1/16-6/30/17 (1,236) 1,045 (262) (453)
IDEA Preschool 84.173 S173A160114 9,150 7/1/15-6/30/16 488$ (488)
Subtotal of Special Education Cluster (11,045) 488 - 171,962 (172,838) - (11,433) -
Title I, Part A 84.010 S010A180030 216,902 7/1/17-6/30/18 223,246 (214,098) 9,148$
Title I, Part A 84.010 S010A170030 214,556 7/1/16-6/30/17 (216,854) 205,338 (11,516)
Title II, Part A 84.367 S367B180029 24,587 7/1/17-6/30/18 28,416 (21,538) 6,878
Title II, Part A 84.367 S367B170029 17,093 7/1/16-6/30/17 (17,000) 13,264 (2,954) (6,690)
Title II, Part A 84.367 S367B160029 17,093 7/1/15-6/30/16 (3,736) 3,736
Title II, Part A 84.367 S367B150029 24,855 9/1/14-8/31/15 635 (635)
Title III 84.365 S365A180030 33,335 7/1/17-6/30/18 33,739 (27,681) 6,058
Title III 84.365 S365A170030 14,493 7/1/16-6/30/17 (5,686) 5,089 (4,881) (5,478)
Title III, Immigrant 84.365 S365A180030 9,454 7/1/17-6/30/18 5,000 (7,730) (2,730)
Title III, Immigrant 84.365 S365A170030 40,373 7/1/16-6/30/17 17,923 11,225 (29,148) -
Title IV, Part A 84.424A S424A180031 2,482 7/1/17-6/30/18 2,482 (2,482)
Total Special Revenue Fund (254,321) 19,046 - 703,497 (483,985) - (37,847) 22,084
U.S. Department of Agriculture
Passed-through State of New Jersey Department
of Education:
Enterprise Fund:
Child Nutrition Cluster:
Food Donation Program (NC) 10.555 181NJ304N109 26,057 7/1/17-6/30/18 26,057 (26,057)
School Breakfast Program 10.553 181NJ304N109 1,113 7/1/17-6/30/18 1,054 (1,113) (59)
School Breakfast Program 10.553 171NJ304N109 1,875 7/1/16-6/30/17 (122) 122
National School Lunch Program 10.555 181NJ304N109 59,311 7/1/17-6/30/18 54,299 (59,311) (5,012)
National School Lunch Program 10.555 171NJ304N109 65,264 7/1/16-6/30/17 (4,358) 4,358
Subtotal Child Nutrition Cluster (4,480) 85,890 (86,481) (5,071)
Federal PB Lunch - Healthy Hunger-Free Kids Act of 2010 10.555 181NJ304N1099 5,044 7/1/17-6/30/18 4,595 (5,044) (449)
Federal PB Lunch - Healthy Hunger-Free Kids Act of 2010 10.555 171NJ304N1099 4,922 7/1/16-6/30/17 (344) 344
Total Enterprise Fund (4,824) 90,829 (91,525) (5,520)
Total Federal Financial Awards (259,145)$ 19,046$ -$ 794,326$ (575,510)$ -$ (43,367)$ 22,084$ -$
NC - Non-cash expenditures
See accompanying Notes to the Schedule of Expenditures of Federal and State Awards and Financial Assistance.118

Borough of Edgewater School District
Schedule of Expenditures of State Awards
For The Year Ended June 30, 2018
K-4
Schedule B
Balance, June 30, 2017 MEMO
(Accounts Repayment of
Grant or State Award Receivable) Due To Cash Budgetary Prior Year (Accounts Unearned Due To Budgetary Cumulative
State Grantor/Program Title Project Number Amount Grant Period Unearned Revenue Grantor Received Expenditures Balance Receivable) Revenue Grantor Receivable Expenditures
New Jersey State Department of Education:
General Funds:
Special Education Categorical Aid 495-034-5120-089 535,423$ 7/1/17-6/30/18 516,012$ (535,423)$ (19,411)$ (535,423)$
Transportation Aid 495-034-5120-014 136,664 7/1/17-6/30/18 131,710 (136,664) (4,954) (136,664)
Security Aid 495-034-5120-057 45,596 7/1/17-6/30/18 43,943 (45,596) (1,653) (45,596)
Supplemental Enrichment Growth Aid 495-034-5120-085 255,143 7/1/17-6/30/18 245,894 (255,143) (9,249) (255,143)
Under Adequacy Aid 495-034-5120-000 21,476 7/1/17-6/30/18 20,697 (21,476) (779) (21,476)
PARCC Readiness Aid 495-034-5120-044 13,300 7/1/17-6/30/18 12,818 (13,300) (482) (13,300)
Per Pupil Growth Aid 495-034-5120-044 13,300 7/1/17-6/30/18 12,818 (13,300) (482) (13,300)
Professional Learning Community Aid 495-034-5120-101 13,570 7/1/17-6/30/18 13,078 (13,570) (492) (13,570)
Homeless Tuition Reimbursement N/A 11,354 7/1/17-6/30/18 (11,354) (11,354)$ (11,354)
Non-Public School Transportation 495-034-5095-014 40,256 7/1/17-6/30/18 (40,256) (40,256) (40,256)
Extraordinary Aid 495-034-5120-044 119,112 7/1/17-6/30/18 (119,112) (119,112) (119,112)
Special Education Categorical Aid 495-034-5120-089 476,311 7/1/16-6/30/17 (24,458)$ 24,458
Transportation Aid 495-034-5120-014 136,664 7/1/16-6/30/17 (7,017) 7,017
Security Aid 495-034-5120-057 45,595 7/1/16-6/30/17 (2,341) 2,341
Supplemental Enrichment Growth Aid 495-034-5120-085 255,143 7/1/16-6/30/17 (13,101) 13,101
Under Adequacy Aid 495-034-5120-000 21,476 7/1/16-6/30/17 (1,103) 1,103
PARCC Readiness Aid 495-034-5120-044 13,300 7/1/16-6/30/17 (683) 683
Per Pupil Growth Aid 495-034-5120-044 13,300 7/1/16-6/30/17 (683) 683
Professional Learning Community Aid 495-034-5120-101 13,570 7/1/16-6/30/17 (697) 697
Non-Public School Transportation 495-034-5095-014 20,358 7/1/16-6/30/17 (20,358) 20,358
Extraordinary Aid 495-034-5120-044 112,947 7/1/16-6/30/17 (112,947) 112,947
TPAF Social Security Aid 495-034-5095-002 394,267 7/1/17-6/30/18 394,267 (394,267) (394,267)
On-Behalf TPAF Contributions:
Pension Benefit Contributions 495-034-5095-006 734,143 7/1/17-6/30/18 734,143 (734,143) (734,143)
Post Retirement Medical Contributions 495-034-5095-001 474,167 7/1/17-6/30/18 474,167 (474,167) (474,167)
Long-term Disability Insurance 495-034-5095-001 2,055 7/1/17-6/30/18 2,055 (2,055) (2,055)
Total General Funds (183,388) 2,784,990 (2,809,826) (170,722) (37,502) (2,809,826)
Special Revenue Funds:
Preschool Education Aid 495-034-5120-085 15,944 7/1/17 - 6/30/18 14,350 (15,944) (1,594) (15,944)
Preschool Education Aid 495-034-5120-085 43,846 7/1/16 - 6/30/17 41,595 2,251 (43,846) (43,846)
Preschool Education Aid 495-034-5120-085 366,712 7/1/15 - 6/30/16 209,626 (209,626) (366,712)
Safety Grant Not available 3,421 7/1/16 - 6/30/17 3,421 3,421$
New Jersey Non-Public Aid:
Nursing Aid 100-034-5120-070 2,134 7/1/17 - 6/30/18 2,134 (1,802) 332$ (1,802)
Nursing Aid 100-034-5120-070 1,800 7/1/16 - 6/30/17 1,683$ (1,683)$
Textbook Aid 100-034-5120-064 1,205 7/1/17 - 6/30/18 1,205 1,205
Textbook Aid 100-034-5120-064 1,153 7/1/16 - 6/30/17
Technology Initiative 100-034-5120-373 814 7/1/17 - 6/30/18 814 814
Technology Initiative 100-034-5120-373 520 7/1/16 - 6/30/17
Security Aid 100-034-5120-509 1,650 7/1/17 - 6/30/18 1,650 (1,650) (1,650)
Security Aid 100-034-5120-509 1,000 7/1/16 - 6/30/17 1,000 (1,000)
Non Public Auxiliary Services (Ch. 192):
Compensatory Education 100-034-5120-067 6,271 7/1/16 - 6/30/17 6,271 (6,271)
English as a Second Language 100-034-5120-067 6,504 7/1/17 - 6/30/18 6,504 (4,698) 1,806 (4,698)
English as a Second Language 100-034-5120-067 3,654 7/1/16 - 6/30/17 2,558 (2,558)
Non Public Handicapped Services (Ch. 193):
Corrective Speech 100-034-5120-066 1,786 7/1/17 - 6/30/18
Corrective Speech 100-034-5120-066 3,534 7/1/16 - 6/30/17 2,562 1,786 (1,786) (2,562) (1,786)
Total Special Revenue Funds 254,642 14,074 30,694 (279,352) (14,074) 3,421 4,157 (1,594) (436,438)
Debt Service Fund:
Debt Service Aid 495-034-5120-125 86,965 7/1/17-6/30/18 86,965 (86,965) (86,965)
86,965 (86,965) (86,965)
New Jersey State Department of Education:
Capital Projects Fund:
NJ Schools Development Authority Not available 176,500 7/1/14-Completion (166,152) (166,152) (166,152)
(166,152) (166,152) (166,152)
New Jersey State Department of Agriculture:
Enterprise Fund:
State School Lunch Program (state share) 100-010-3350-023 4,263 7/1/17-6/30/18 3,883 (4,263) (380) (4,263)
State School Lunch Program (state share) 100-010-3350-023 3,502 7/1/16-6/30/17 (244) 244
Total Enterprise Funds (244) 4,127 (4,263) (380) (4,263)
Total State Awards (95,142)$ 14,074$ 2,906,776$ (3,180,406)$ (14,074)$ (337,254)$ 3,421$ 4,157$ (39,096)$ (3,503,644)$
State Financial Assistance Not Subject
to Single Audit Determination
On-Behalf TPAF Contributions:
Pension Benefit Contributions 495-034-5095-006 734,143 7/1/17-6/30/18 734,143 (734,143) (734,143)
Post Retirement Medical Contributions 495-034-5095-001 474,167 7/1/17-6/30/18 474,167 (474,167) (474,167)
Long-term Disability Insurance 495-034-5095-001 2,055 7/1/17-6/30/18 2,055 (2,055) (2,055)
(95,142)$ 14,074$ 1,696,411$ (1,970,041)$ (14,074)$ (337,254)$ 3,421$ 4,157$ (39,096)$ (2,293,279)$
Balance, June 30, 2018
See accompanying Notes to the Schedule of Expenditures of Federal and State Awards and Financial Assistance.119

K-5
p. 1
(continued)
Borough of Edgewater School District
Notes to Schedules of Expenditures of
State Financial Assistance
Year ended June 30, 2018
1. General
The accompanying schedules of expenditures of state financial assistance present the
activity of all of all state financial assistance programs of the District. The Board of
Education is defined in Note 1 to the board’s basic financial statements. All state
financial assistance received directly from state agencies, as well as state financial
assistance passed through other government agencies, are included on the schedules
of expenditures of state financial assistance.
2. Basis of Accounting
The accompanying schedules of expenditures of state financial assistance are
presented on the budgetary basis of accounting with the exception of programs
recorded in the enterprise funds, which are presented using the accrual basis of
accounting and those recorded in the special revenue fund, which are presented using
the budgetary basis of accounting. These basis of accounting are described in Note 1
to the District's basic financial statements. The information in these schedules are
presented in accordance with the requirements of New Jersey OMB Circular 15-08,
Single Audit Policy for Recipients of State Grants and State Aid. Therefore, some
amounts presented in this schedule may differ from amounts presented, or used in the
preparation of, the basic financial statements.
3. Relationship to Basic Financial Statements
Amounts reported in the accompanying schedules agree with amounts reported in the
District’s basic financial statements. The basic financial statements present the general
fund and special revenue fund on a GAAP basis. Budgetary comparison statements or
schedules (RSI) are presented for the general fund and special revenue fund to
demonstrate finance-related legal compliance in which certain revenue is permitted by
law or grant agreement to be recognized in the fiscal year, whereas for GAAP reporting,
revenue is not recognized until the subsequent year or when expenditures have been
made.
120

K-5
p. 2
(continued)
Borough of Edgewater School District
Notes to Schedules of Expenditures of
State Financial Assistance
Year ended June 30, 2018
3. Relationship to Basic Financial Statements (Continued)
The general fund is presented in the accompanying schedules on the modified accrual
basis of accounting with the exception of the revenue recognition of the last two state
aid payments in the current year, which is mandated pursuant to N.J.S.A. 18A:22-44.2.
For GAAP purposes, those payments are not recognized until the subsequent year due
to the state deferral and recording of the last two state aid payments in the subsequent
year. The special revenue fund is presented in the accompanying schedules on the
grant accounting budgetary basis, which recognizes encumbrances as expenditures and
also recognizes the related revenues, whereas the GAAP basis does not. The special
revenue fund also recognizes the last state aid payments in the current budget year,
consistent with N.J.S.A. 18A:22-44.2.
The net adjustment to reconcile from the budgetary basis to the GAAP basis is $12,581
for the general fund and $657 for the special revenue fund. See note to required
supplementary information for a reconciliation of the budgetary basis to the modified
accrual basis of accounting for the general and special revenue funds (C-3). Federal
and State award revenues are reported in the District's basic financial statements on a
GAAP basis as follows:
Federal
State
Total
General Fund
$ 2,822,407
$ 2,822,407
Special Revenue Fund $ 483,985
280,009
763,994
Debt Service Fund
86,965
86,965
Food Service Fund 91,525
4,263
95,788
$ 575,510
$ 3,193,644
$ 3,769,154
4. Relationship to State Financial Reports
Amounts reported in the accompanying schedules agree with the amounts reported in
the related state financial reports.
121

K-5
p. 3
Borough of Edgewater School District
Notes to Schedules of Expenditures of
State Financial Assistance
Year ended June 30, 2018
5. Other
Revenues and expenditures reported under the Food Donation Program represent
current year value received and current year distributions, respectively. TPAF Social
Security Contributions represent the amount reimbursed by the State for the employer’s
share of Social Security for TPAF members for the year ended June 30, 2018.
The post-retirement pension, medical and disability insurance benefits received on
behalf of the District for the year ended June 30, 2018 amounted to $1,210,365. Since
on-behalf post retirement, medical and disability insurance benefits are paid by the State
directly, these expenditures are not subject to a single audit in accordance with New
Jersey OMB Circular 15-08, however they are reported on the Schedule of Expenditures
of State Financial Assistance, as directed by the funding agency.
6. Indirect Costs
The District did not use the 10% de minimis indirect cost rate.
122

K-6 p. 1
(continued)
Borough of Edgewater School District
Schedule of Findings and Questioned Costs (continued)
Year ended June 30, 2018
Part I – Summary of Auditors’ Results
Financial Statements Section
Type of auditors’ report issued: Unmodified
Internal control over financial reporting:
Are any material weaknesses identified? Yes X No
Are any significant deficiencies identified? X Yes None Reported
Is any noncompliance material to financial statements noted?
Yes
X
No
State Awards Section
Internal control over major state programs:
Are any material weaknesses identified? Yes X No
Are any significant deficiencies identified?
Yes
X
None reported
Type of auditors’ report issued on compliance for major
state programs:
Unmodified
Any audit findings disclosed that are required to be reported
in accordance with NJOMB Circular 15-08?
Yes
X
No
123

K-6 p. 2
Borough of Edgewater School District
Schedule of Findings and Questioned Costs (continued)
Year ended June 30, 2018
Part I - Summary of Auditors’ Results
State Awards Section (continued)
Identification of major state programs:
GMIS/Program Number Name of State Program or Cluster
State Aid Cluster:
495-034-5120-078
495-034-5120-089
495-034-5120-083
495-034-5120-084
495-034-5120-097
495-034-5120-098
495-034-5120-101
Equalization Aid
Special Education Categorical Aid
Educational Adequacy Aid
Security Aid
Per Pupil Growth Aid
PARCC Readiness Aid
Professional Learning Community Aid
Dollar threshold used to distinguish between Type A and
Type B programs:
$750,000
Auditee qualified as low-risk auditee? Yes X No
124

K-7 p. 1
Borough of Edgewater School District
Schedule of Findings and Questioned Costs (continued)
Year ended June 30, 2018
Part II – Schedule of Financial Statement Findings
Significant Deficiency in Internal Control 2018-001 Criteria: Timely and accurate financial reporting is an important element of the District’s control environment. Financial reporting provides the foundation for financial analysis, a critical component needed to be able to respond timely to financial related issues. Condition: The District did not maintain a general ledger that was in agreement with the District's subsidiary records nor were entries made in a timely manner. Balances in the general ledger were not examined or reconciled to detailed analyses on an ongoing basis. In addition to internal controls over financial reporting, the District did not maintain budgetary controls resulting in noncompliance with legal provisions embodied in the annual appropriated budget approved by the voters of the municipality. Context: Management’s preparation and review of the financial statements and related supporting schedules in regard to accounts receivable, accounts payable and interfunds were not performed timely and consistently. The District did not expend funds in accordance with appropriations established by the approved budget resulting in over-expenditures being identified despite the Board Secretary’s monthly certification to the contrary (N.J.A.C. 6A:23A-16.10). In addition, the District did not allocate expenditures to the correct fund in a timely manner in certain instances. Cause and Effect:
As a result, the District’s financial records for the year ending June 30, 2018 were not
finalized until months after fiscal year end and financial information provided throughout
the year may not have accurately reflected the financial activity of the District. A large
number of adjusting journal entries were needed to ensure the completeness and
accuracy of the financial statements at year end.
125

K-7 p. 2
(continued)
Borough of Edgewater School District
Schedule of Findings and Questioned Costs (continued)
Year ended June 30, 2018
Part II – Schedule of Financial Statement Findings
Recommendation:
That the District maintain a general ledger accounting record that is reconciled monthly
to other subsidiary records. The District should also strengthen controls to ensure
accurate and timely posting of the financial activity for the fiscal period so that actions
can be taken and informed decisions can be made in a timely manner. Approved
budgetary line accounts should not be over-expended. The Board Secretary should not
approve the issuance of purchase orders that would cause over-expenditure in the line
account to be charged, prior to the board approving the requested transfer of additional
appropriations to cover such orders. The Board Secretary should file monthly
certifications of the budgetary line item status which are consistent with the actual
budgetary records.
View of Responsible Officials and Planned Corrective Action:
District management concurs with the finding and will develop a corrective action plan in
response to the recommendation above.
126

K-7 p. 3
(continued) Borough of Edgewater School District
Schedule of Findings and Questioned Costs
Year ended June 30, 2018
Part III - Schedule of State Financial Assistance Findings
and Questioned Costs
No state financial assistance program compliance findings or questioned costs were
noted that are required to be reported in accordance with New Jersey OMB Circular
Letter 15-08.
127

K-8
Borough of Edgewater School District
Schedule of Findings and Questioned Costs (continued)
Year ended June 30, 2018
Part III – Schedule of Federal and State Award Findings and Questioned Costs
No prior year findings were noted.
128