border timbers limited · 2012-10-22 · 2 border timbers - annual report - 2011 notice of annual...
TRANSCRIPT

2011 ANNUAL REPORT
BORDER TIMBERS LIMITED

1
Contents
Annual Performance Analysis 67
Analysis of Shareholders 68
02
17
67
08
52
Notice of Annual General Meeting 2
Group Financial Highlights 3
Statutory Information 4
Statement of Corporate Governance 5
Directors Responsibility for the Financial Statements 7
Certificate by Company Secretary 7
Directors’ Report 8
Chairman’s Report 9
Operational Report 12
Finance Report 14
Independent Auditors’ Report 16
Consolidated Statement of Financial Position 17
Consolidated Income Statement 18
Consolidated Statement of Comprehensive Income 19
Consolidated Statement of Changes in Equity 20
Consolidated Statement of Cash Flows 21
Notes to the Consolidated Financial Statements 22
Company Statement of Financial Position 52
Company Income Statement 53
Company Statement of Changes in Equity 54
Company Statement of Cash Flows 55
Notes to the Company Financial Statements 56
Contents

B o R D e R T I M B e R S - A N N u A l R e p o R T - 2 0 1 12
NotiCe of ANNuAl GeNerAl MeetiNG
Time 9:15 amDate Wednesday 7th December 2011Place 4th Floor, Tanganyika House, Corner Kwame Nkrumah Avenue and Third Street, Harare.
NOTICE IS HEREBY GIVEN that the Annual General Meeting of the members of Border Timbers Limited will be held in the Board Room of Radar Holdings Limited, 4th Floor, Tanganyika House, Corner Kwame Nkrumah Avenue and Third Street, Harare:
Members will be asked to consider, and if deemed fit, to pass with or without amendments, the resolutions set out below:
AS ORDINARY RESOLUTION
1. Financial StatementsTo receive, consider and adopt the audited financial statements for year ended 30th June 2011, together with reports of the Directors and Auditors.
2. Election of DirectorsTo re-elect retiring Directors. Mr K.R.R. Schofield retires by rotation and, being eligible, offers himself for re-election.
To elect Mr. R.E. Breschini and Mr. E. Hwenga as Directors who were appointed on the 18th January 2011 and 2nd August 2011 respectively.
3. Directors RemunerationTo ratify the remuneration paid to the non-Executive Directors.
4. Auditors Fees and AppointmentTo ratify the remuneration paid to the Auditors for the past year’s services and to appoint Auditors for the ensuing year. Messrs PricewaterhouseCoopers, being eligible, offer themselves for reappointment.
5. Any Other BusinessTo transact such other business as maybe transacted at an Annual General Meeting.
By order of the Board Radar Investments (Private) Limited Transfer Secretaries Harare Radar Investments (Private) Limited7th November 2011 4th Floor Tanganyika House 23 Third Street PO Box 10 Harare, Zimbabwe
Notes:
1. Appointment of Proxies
1.1 A shareholder entitled to attend and vote at the Annual general Meeting is entitled to appoint one or more proxies to attend and speak and upon a poll, vote in his stead. A proxy need not also be a member of the Company.
1.2 The proxy form should be lodged with the Secretary of the Company, to be received not later than 10:00am on Monday 5th December 2011.
2. Change of Address: Members are requested to advise the Transfer Secretaries in writing of any change of address.
NotiCe of ANNuAl GeNerAl MeetiNG

3
2011 2010 US$ US$
Consolidated Income Statement
Revenue 21,930,331 13,843,061
Operating profit 7,792,464 2,076,261
Net Interest paid (1,129,633) (320,017)
Profit before taxation 6,662,831 1,756,244
Profit/(Loss) after taxation 5,030,969 7,233,902
Consolidated Statement of Financial position
Equity Attributable to equity holders of parent company 104,914,395 99,883,426
Net Cash Resources (2,112,970) (2,890,117)
Interest Bearing Debt 7,213,345 4,701,371
Consolidated Statement of Cash Flows
Net Increase / (Decrease) in Cash & Cash Equivalents 777,147 (2,986,804)
ordinary Share performance
Basic earnings per share 0.12 0.17
Diluted earnings per share 0.12 0.17
Market price per share at 30 June $0.35 $0.38
Shares in issue (number) 42,942,487 42,942,487
other
Profit before Interest and Taxation return on Total Assets 5.34% 1,53%
Profit after tax return on Shareholders Funds 4.80% 7.24%
Net Asset Value per Share (US$) 3.18 3.00
Debt to Equity 6.88% 4.71%
Current Ratio 0.94 : 1 0.92 : 1
Interest Cover 6.90 6,49
Number of Employees 3,012 2,530
Value Added per Employee (US$ ) 5,383 4,857
Employment Cost per Employee (US$) 4,122 3,841
Shareholders Calendar in respect of year to 30 June 2011Financial Reports
Interim Results announced 27 February 2011
Year End results announced 30 September 2011
Annual report posted to Shareholders 15 November 2011
Annual General Meeting 7 December 2011
Shareholders are reminded to notify Radar Investments (Private) Limited, P.O. Box 10455, Harare, of any change of address.
Group fiNANCiAl HiGHliGHtsGroup fiNANCiAl HiGHliGHts

B o R D e R T I M B e R S - A N N u A l R e p o R T - 2 0 1 14
DIRECTORS K R R Schofield (Chairman)
R E Breschini (Appointed January 2011)
D Dell (Managing Director)
P Nyemba (Finance Director)
H B A J von Pezold
J. Mortmer (Resigned February 2011)
R von Pezold
I Kanyemba
OPERATIONS BOARD E Hwenga
D Dell
P Nyemba
G Bottger
S Sena
S Vanderlingen
L Ngoma
SECRETARIES Radar Investments (Private) Limited
AUDITORS PricewaterhouseCoopers
ATTORNEYS Henning Lock Donagher & Winter, Honey & Blackenberg, Maunga and
Maanda, and Wintertons
REGISTERED OFFICE 5th Floor, Charter House
Leopold Takawira Avenue/Fort Street
P.O. Box 2346
Bulawayo
BANKERS Kingdom Bank Limited
MBCA Bank Limited
Stanbic Bank Limited
NMB Bank Limited
FBC Bank Limited
TN Bank
POSTAL ADDRESS P.O. Box 458
Mutare
PERIOD OF FINANCIAL STATEMENTS Year ended 30th June 2011
DATE FINANCIAL STATEMENTS AUTHORISED FOR ISSUE 31 October 2011
stAtutory iNforMAtioNstAtutory iNforMAtioN

5
stAteMeNt of CorporAte GoverNANCe
GENERAL PRINCIPLESThe Board affirms its commitment to the principles of openness, integrity and accountability and to the provision of timeous, relevant and meaningful reporting to all stakeholders.
THE BOARDThe Board of Directors currently comprises two Executive and six non-Executive Directors. This structure concurs with the principles set out in King III report where a preferred majority of non-Executive Directors is mandated.
The Executive Directors generally have a responsibility for making and implementing operational decisions on running the Group’s businesses.
Non-Executive Directors complement the skills and experience of the Executive Directors, contributing to the formation of policy and decision making through their knowledge and experience of other businesses and sectors. All Directors bring an independent judgement to the issues of strategy, performance and resources, including key appointments and standards of conduct.
The roles of Chairman and Managing Director are separate with responsibilities divided between them.
All Directors are subject to retirement and re-election by Shareholders in accordance with the Articles of Association which provides that all Directors are subject to election at the first annual general meeting following their appointment and thereafter one third of the Directors retire by rotation with the exception of the Managing Director whose appointment is set for a renewable period of five years in terms of Article 118. The board meets at least quarterly to review operational strategies and monitor management performance.
The details of each Director are as follows:
CHAIRMAN* - KRR Schofield - age 47Appointed to the Board in November 1994 and appointed Deputy Chairman on 12 December 2002. He is the Chairman of Radar Holdings Limited and a Director of a number of other Zimbabwean companies outside the Radar Group. Appointed as board chairman on the 1st of August 2009.
DIRECTOR - R E Breschini – age 55Appointed to the Board in January 2011.
DIRECTOR * - HBAJ von Pezold – age 39Appointed to the Board in December 2003. Mr. von Pezold is also a non-executive Director for Radar Holdings Limited and serves on many other local and international companies.
DIRECTOR ◊* - P Nyemba - age 41Appointed to the Board in February 2007. He was appointed Finance Director of Border Timbers Limited in September 2006
DIRECTOR –JH Mortimer – age 72Appointed to the Board in May 2009. Resigned from the board February 2011
DIRECTOR – R von Pezold – age 70Appointed to the Board in April 2003.
DIRECTOR◊* - - D Dell – age 64Appointed to the board in May 2010.
DIRECTOR – I Kanyemba age 51Appointed to the board in January 2010..◊ Executive Director* Member of the Audit Committee.
stAteMeNt of CorporAte GoverNANCe

B o R D e R T I M B e R S - A N N u A l R e p o R T - 2 0 1 16
THE AUDIT COMMITTEEThe Audit Committee, having majority of non-Executive Directors, is chaired by Mr. S. Mattinson. The Committee meets three times a year. The Audit
Committee is attended by the external auditors, the Managing Director and Financial Director in addition to other members of the management team
as required.
The Audit Committee reviews with management that adequate and appropriate internal controls are in place and are appropriate to meet current
and future needs; that significant business, strategic, statutory and financial risks have been identified and are being monitored and managed; that
appropriate standards of governance, reporting and compliance are in operation; and it advises the Board on issues relating to the application of
accounting standards to published financial information.
It is anticipated that, in the continued turbulence in the economy, the Audit Committee will be required to remain ever vigilant in their role of guardians
of the Group.
THE OPERATIONS BOARDThe Group has established, as a sub-committee of the Board, an operations board designed to assist the Chairman and Managing Director in
managing the Group. Whilst the authority of the Chairman and Managing Director are unrestricted as far as management is concerned, the Board, as
a whole, sets the overall tenor and parameters necessary. This Committee is designed to assist in the daily operation of the Group when the Board
is not in session but is subject to the prevailing statutory limits and terms of reference set out by the Board.
stAteMeNt of CorporAte GoverNANCestAteMeNt of CorporAte GoverNANCe

7
The Directors are responsible for the maintenance of adequate accounting records and the preparation and integrity of the financial statements. The
financial statements have been prepared in the manner required by the Companies Act [Chapter 24:03].
In preparing the financial statements, the Directors are required to:
• Select suitable accounting policies and then apply them consistently;
• Make judgments and estimates that are reasonable and prudent;
• State whether applicable International Financial Reporting Standards have been followed, subject to any material departures
disclosed and explained in the financial statements; and
• Prepare the financial statements on the going concern basis unless it is inappropriate to presume that the Group will continue in
business.
The Directors are also responsible for the Group’s systems of internal control. These are designed to provide reasonable, but not absolute, assurance
as to the reliability of the financial statements, and to adequately safeguard, verify and maintain accountability of assets, and to prevent and detect
misstatement and loss. Nothing has come to the attention of the Directors to indicate that any material breakdown in the functioning of these controls,
procedures and systems has occurred during the year under review.
The annual financial statements are prepared on the going concern basis as the Directors have no reason to believe that neither the Group nor the
Company will not be a going concern in the foreseeable future based on forecasts and available cash resources (refer to note 2.1.3).
As a result of these uncertainties and inherent limitations, the Directors advise caution on the use of the comparative information on the income
statement, statement of comprehensive income, statement of changes in equity and the statement of cash flows for decision making purposes.
However the directors are of the opinion that the comparative statement of financial position reveals a true picture of the assets and liabilities in the
prior year.
The financial statements set out on pages 19 to 64 were approved by the Board of Directors on 31st October and are signed on its behalf by:
__________________ __________________
KRR SCHOFIELD P. NYEMBA
CHAIRMAN OF THE BOARD FINANCE DIRECTOR
CERTIFICATE BY COMPANY SECRETARY
In terms of the Companies Act [Chapter 24:03], Radar Investments (Private) Limited, as Company Secretaries, we confirm that for the year ended
30th June 2011, the Group has lodged with the Registrar of Companies all such Returns as are required of a public company in terms of this Act and
that all such Returns are true, correct and up to date.
Radar Investments (Private) Limited
Company Secretary
Harare
31 October 2011
DireCtors’ respoNsibility for tHe ANNuAl fiNANCiAl stAteMeNtsDireCtors’ respoNsibility for tHe ANNuAl fiNANCiAl stAteMeNts

B o R D e R T I M B e R S - A N N u A l R e p o R T - 2 0 1 18
The activities and results of the Group are summarised in the Operational and Financial Reviews. In addition the following statutory information is provided.
Authorised and Issued Share CapitalDetails of the authorised and issued share capital at 30th June 2011 are included in note 12 to the Group financial statements.
ReservesThe movements in the Reserves of the Group are shown in the Statement of Changes in Equity. 2011 2010Results For The Year US$ US$
Profit before taxation 6 662 831 1 756 244 Income tax credit/(expense) (1 631 862) 5 477 658 Profit for the year 5 030 969 7 233 902
Borrowing FacilitiesArticle 86 of the Company’s Articles of Association provides that the Group may from time to time, at the discretion of the Directors, borrow, raise or source borrowings up to half the value of the shareholders equity as reflected in the Statement of Financial Position of the Annual Report. This limit may only be exceeded with the sanction of an ordinary resolution of the Company.
Directors The following Directors served during the year ended 30th June 2011:
KRR Schofield Chairman appointed as chairman to the board on the
1st of August 2009
R E Breschini Director appointed January 2011
D Dell Director appointed 27th of May 2010
P Nyemba Director re-appointed December 2007
R Von Pezold Director re-appointed December 2007
H B A J von Pezold Director re- appointed December 2007
JH Mortimer Director appointed May 2008, resigned Febru-
ary 2011
I Kanyemba Director appointed 1st of January 2010
Directors’ emoluments for Management Services during the year were $274,617, (2010: $147,659).
Messrs H von Pezold and R von Pezold retire by rotation and all being eligible, offer themselves for re-election.
Going ConcernThe Directors have satisfied themselves that the Group is in a sound financial position and has adequate resources to continue in operational existence for the foreseeable future. Accordingly, they are satisfied that it is appropriate to adopt the going concern basis in preparing the financial statements. However, we draw your attention to note 2.1.3 relating to the going concern status of the Group.
AuditorsMembers will be asked to approve the Auditor’s remuneration for the past audit and to confirm the re-appointment of Messrs PricewaterhouseCoopers as auditors to the Group for the ensuing year, they having signified their willingness to continue in office.
Annual General MeetingThe annual general meeting is to be held on 7 December 2011 in terms of the notice set out on page 2 of this annual report.
By order of the BoardRadar Investments (Private) Limited31 October 2011
DireCtors’ reportDireCtors’ report

9
CHAirMAN’s report
Dear ShareholderA year of achievement within the seemingly unending context of power, liquidity, law and order chaos, a tax authority that assumes impunity
and competitive cost pressures that continue to mean that the value of the forest asset base is compromised in order to “fund” operations. The
achievements have been many. Doug Dell and his team – and ultimately his team is the thousands of people who are part of the Border family – have
driven an improved m3 production, improved silviculture, improved capital allocation, improved industrial relations, and importantly, as without the
business operating on a profitable basis the future is uncertain, an improved profitability.
The “global meltdown” has certainly had some impact on your company. The South African economy has shown weakness although this has not
impacted materially the Rand. We had expected – and continue to do so – that the South African Rand would weaken given what we feel is an
underlying uncertainty about the future as well as issues in a country where there has been substantial wealth accumulation in the hands of a relatively
small number of people and a growing underclass of poor who will pressure for a part of the “better life” that is to my mind simply not being provided
for. The impact of the strong rand on our inputs which is USD denominated is substantial and overall adds roughly 6% to our cost base.
The increase in revenue is a very rewarding conclusion to the year and I would like to commend all concerned for achieving a much improved
production. Looking through to the cash generated, it is clear that we have some way to go to convert production to cash in the bank – or at the very
least - cash invested back into the assets.
I note our plantation development values separately as it points clearly to the values created by a managed forest asset.
While our current ratio would look pretty dismal at .93/1 the position is, cetarus paribus, not as dire as it looks. Long term financing that is reasonably
and appropriately priced, has quite simply not been available in Zimbabwe. Reasonably we would expect at least USD4m of the short term liabilities
to be long term financed as we rebuild the business.
This would alter this ratio to 1.67/1 – a happier state of affairs. Sadly, the truth of the matter is that management spend critical time dealing with
financial positions that in any normal world would be absurd. The cash pressure on the business is immense as while we are always confident that
short term cash will remain available to fund our long term investment it simply cannot be taken for granted and therefore is a daily trauma to the
business.
We very much hope to dramatically improve the position in the very near future. Your company is in advanced negotiations with an international
financial institution that will, if successful, materially alter the company’s borrowing position and the relevant associated costs.
Forestry 1,276 hectares were planted as against 562 felled. Hectares planted was less than planned but survivability was a key focus in ensuring that whatever
was planted did not have to be redone in the following year. Our mortality rates have been too high and we very much hope to have addressed this.
Most silviculture targets were met and for the first time in a decade, the forest is nearing a complete silvicultural regime. It is impossible to pay enough
attention to this seemingly invisible regimen – and yet attention to its every detail is right at the heart of the value generation of the forest. New
varieties are being trialed and where appropriate put into full planting cycles. Our association with Camcore continues to be of enormous benefit in an
environment where Zimbabwe’s research and development in the Science of forests has sadly fallen behind. There remains a well of goodwill towards
this country and as a more positive atmosphere develops, we look forward to again playing a role in the development of Southern African timber.
CHAirMAN’s report
FinancialThe headline figures are as follows:
Revenue for the Year $21,930,331
EBITDA $7,792,464
Cash Generated $2,565,292
Capital Expenditure $2,108,949
Plantation Development $1,968,596

B o R D e R T I M B e R S - A N N u A l R e p o R T - 2 0 1 110
CHAirMAN’s report (CoNt)CHAirMAN’s report (CoNt)
Fire damage continues to be a major concern to the long term viability of the forests with arson being the principle cause of damage. Border is in the
process of claiming against the Government of Zimbabwe for the losses incurred to the company. Shareholders will be advised in due course as to
the progress of this claim.
Sawmills and FactoriesThe company is running two of its three sawmills with utilization being much improved from last year. The investment made over the year in equipment
has paid off notwithstanding low recoveries as we continue to work with a greater proportion of thinnings as opposed to clearfelled areas.
The repairs and maintenance aspect of both operating mills is such that in the near future the company will need to address the capital investment
required to replace aged equipment. This investment will be substantial but is essential.
Demand has remained strong for all products with a much greater proportion of our products going into the local market. As an industry, there has
been a 50% reduction in volumes exported to South Africa over the past 3 years. The increased activity in the local market points to promising years
ahead as the economy improves. The company will need to ensure that its costs are firmly contained as competition from imported product will be a
challenge.
The biggest single cost issue across every aspect of Border Timbers Limited is the chaotic provision – or lack thereof - of power. It seems churlish
to lambast ZESA for mismanagement when an enormous proportion of the power that they supply to sectors of government as well as to large parts
of the politically driven agricultural sector goes ignored and unpaid. While appreciating the issues that ZESA face, I implore – again … and again …
government to address the investment needed at ZESA to provide a more consistent power supply. Power supply has been part of the competitive
advantage enjoyed by Zimbabwe in the past in building an industrial base. Government must define the role of power in the development of the
future of the country in a clear and focused way that allows industry to plan its own investment. Diesel generation is not the way – unless we plan on
Somalia being a role model for development!
polesThe demand for transmission poles has continued to strengthen with enquiries coming from as far afield as Uganda. The quality of your company’s
product has been instrumental in Border being recognized as one of the premium suppliers of poles in Southern/Central Africa. We believe that as
the economies around us continue to grow, the demand for electricity will be a strong driver of demand for our products. That said, there has been
huge investment in the region in Eucalyptus and this will impact the position that we have as a supplier of poles. This impact is still a few years away
but while there is currently a shortage in the market of quality poles, this market will become very competitive in the coming years. Border Timbers
continues to analyze its investment and balancing of forest resource to match what we believe is future demand.
As reported at the time, a fire severely damaged our pole treatment facility. My specific thanks goes to all involved in getting the facility operational
within 19 days of the damage being incurred. All concerned worked night and day to get back up and running shouldering the burden of responsibility
to try our very best to ensure that the commitments that we had made to customers were kept. It has not been possible in every case to meet timing
and volumes.
A disaster totally out of our control has seen the entire treatment industry in southern Africa in a position that has not been experienced in at least
40 years. The combination of a major player in the production of coal tar pulling out of the business due to long term legal issues, a fire at the Engen
production facility in Durban and maintenance that has taken months longer than anticipated at a third facility has meant that creosote supply has all
but dried up. Zimchem have been enormously helpful in trying to supply as have our major suppliers in South Africa. There is simply no creosote and
this position is expected to remain critical to at least January next year. Border has looked to other markets to supply us but the nature of the product
and its specifications means a slow process in establishing reliable suppliers. This will impact your company’s financial and volume performance as
a significant part of our budgets are predicated on the pole market.
EnvironmentalYour company continues to manage to international environmental standards and under the auspices of the Timber Producers Federation, to develop
local standards and guidelines. Due diligence undertaken by the financial institution mentioned above provided a reference to global standards and

11
CHAirMAN’s report (CoNt)CHAirMAN’s report (CoNt)
while there were some issues that needed to be addressed, it was pleasing to note that Border’s environmental management continues to be of a
very high standard.
outlookThe South African lumber market has grown by nearly 8% over last year. However, the real story is in the growth of the region as a whole. My
belief is that as an industry we should be concerned not about the possible weakness of the market but the strength of demand emanating from the
groundswell of development in Sub Saharan Africa. Mozambique in particular has seen huge potential investment in forestry – and I say potential
as large areas are planned but the policy environment surrounding long term land use remains at times confused. Zimabawe has the opportunity to
re-establish itself as a key player in the regional forestry sector. The nature of Forestry investment is such that long term policies and stable operating
environments are critical to investment.
Your company is particularly well placed to take advantage of the growing local and regional markets. Zimbabwes central position logistically is a
much needed advantage given some of the other challenges that we face. Our prospects are a little like those given by our Climate Change friends...
we know the prospects given particular parameters – but it will be a pretty choppy ride on the way - we can only assume the parameters are positive
and a given - anything else would seem utterly moronic!
AppreciationIt remains for me to thank, on behalf of my Board and shareholders, the Management and workforce for the efforts of the past year. Border Timbers
workforce have conducted themselves with dignity and purpose and this is reflected in the stronger position of the company.
John Mortimer resigned during the year due to the extensive travel required to properly acquit his responsibilities. I thank him for his invaluable input
over the past 3 years. Randolph Breschini was appointed to the Board and brings a wealth of experience and direction that we sorely need in what
has been a relatively closed operating environment over the past decade.
I would also note with thanks the enormous patience of our suppliers in working with us in meeting our cash flow challenges. I and management
appreciate the challenges that they themselves must face and our constraints cannot have made their lives any easier.
The assistance that we have had from our neighbours and the police in coping with, in particular, fire, has been much appreciated.
Post Year End EventI regret that Border Timbers suffered a major fire at Sheba which damaged 711 hectares of resource. Every effort is being made to extract the
maximum value from the damaged timber and replant as rapidly as possible.
KRR Schofield
CHAIRMAN
31 October 2011

B o R D e R T I M B e R S - A N N u A l R e p o R T - 2 0 1 112
operAtioNAl report
The year ending June 30, 2011
overviewThe Group has continued to witness positive growth in all spheres. However its inability to produce at a consistent, rateable basis resulted in financial targets not being met. This in-turn meant that insufficient cash was generated during the year to complete the planned capital expenditure programme and this negatively impacted on actual performance compared to planned performance. Good progress was made on the redevelopment of the plantations with 1623ha being planted.
A fire at the pole treating plant in June, took the gloss off a satisfactory year.
operational Review.The Group had strong growth in sales for all its products. The strategy to rebuild the production assets is currently focused on harvesting and haulage. These investments are starting to bear fruit as seen in the increased round wood production. All production facilities are now better served by the plantations, although the overall reinvestment programme has been slower than planned for the reasons mentioned above. Overall, our cash position remains a concern for management; made worse by the overall liquidity position in the economy, with inadequate long term funding available.
Meeting all stakeholders’ expectations, in the current economic environment is challenging. However, notwithstanding that an additional 400 jobs were created during the year and round wood volumes have moved up from 143,000m3 in 2009 to 200,000m3 in this year, under review.
The treated pole segment of our business continues to show a strong recovery with pole volumes moving from 10,415m3 in 2010 to 15,971m3 in 2011.
Key production statistics FY 2010 FY 2011 VarianceRoundwood production 147,000 m3 200,000 m3 53,000 m3Planting 1,580 ha 1,276 ha -304 haSaw Mill Intake (Pine) 118,717 m3 154,455 m3 35,738 m3
An aerial survey of the plantations conducted in April/May of this year resulted is a positive adjustment of the planted area of 674 ha, after netting off the minefields on properties bordering Mozambique that had previously reflected as planted area..
Health and safety show a positive trend and remains a key focus for every level of management. The programme to improve the supply of potable water to every housing complex in the company is making solid progress. Malaria remains a concern and a spraying programme will be introduced in the coming summer in an attempt to limit the malaria risk.
Border Timbers International (BTI)BTI remains under operating pressure. The capital injection, in the way of machinery has started to yield results. An additional investment in plant and machinery is required and efforts are being made to secure funding. The anticipated increase in rough sawn timber production from the sawmills should see BTI increasing production throughput.
operAtioNAl report

13
operAtioNAl report (CoNt)operAtioNAl report (CoNt)
The MarketBoth locally and regionally demand for the Group’s product range remains strong. Sales volumes, for most products are only limited by our ability to produce for that demand. There are significant infrastructural developments taking place in the Region, particularly in the Eastern Coast countries, and Zambia, from which we are benefitting.
Bottlenecks at Beira port are limiting our ability to reduce transport costs for imported raw materials which currently come through South African harbours with their longer road transport leg. This is impacting on our regional competitiveness.
Local demand is being driven largely through individual home builders throughout the length and breadth of the country. Concern for the year ahead is inflation rising in the forestry sector of the economy with fuel, electricity, District Council levies and wages being the main drivers.
DirectorateChanges to the board are the retirement of Mr John Mortimer on February 18, 2011 after serving on the board for almost 3 years. His input both at board and operational level will be missed.
Elias Hwenga, the Radar Group CEO was formally appointed to the board on August 2, 2011 Mr. Hwenga had previously attended board meetings as an invitee.
D. M. DellManaging Director31 October 2011
B o R D e R T I M B e R S - A N N u A l R e p o R T - 2 0 1 114
IntroductionThe year under review has been characterized by liquidity challenges.
operating ResultsThe Group recorded revenue of $21.9 million against prior period comparative of $13.8 million. The growth in turnover is mainly a result of an increase in production output.
Operating margins continue to be under pressure from high repairs and maintenance costs which are attributable to assets in need of replacement and the continued reliance on diesel generated power. Wage rates have also remained at levels that are not in line with productivity. At 27% of turnover, staff costs are unusually high.
Lending rates in the banking sector have remained at significantly high levels. The increase in borrowings coupled with high interest rates resulted in finance charges of $1.1 million being incurred.
Fair value gains of $10.9 million have been credited to the income statement against plantation redemption of $5.3 million. Once again, biological assets continue to grow in value due to the favourable ratio of clear fellings to plantings. The bulk of the timber being harvested is from commercial thinning operations.
Border Timbers InternationalPower outages at Border Timbers International continued to impact negatively on production output. Machine breakdowns have been on the increase due to the state of the plant. The replacement of part of the equipment in the second half of the year resulted in improved plant availability and production output. The impact of the new equipment was largely felt in the last two months of the year. A preferential power supply contract with the Zimbabwe Electricity Transmission and Distribution Company concluded in the month of June 2011 is expected to improve power supply in the new financial year. The company posted a loss of $245,000. The benefits of the new equipment and the power supply agreement should see the company return to profitability in the coming financial year.
paulington factoryThe investment in a 500KVA diesel generator at the beginning of the financial year enabled the factory to increase production throughput. Consequently, the factory traded profitably. Competition on the export market for plywood based products remained stiff and hence the bulk of product sold was on the local market. The cost of diesel generated power continued to affect operating margins.
pole yardThe pole yard contributed $3.4 million to Group turnover. The pole market remained buoyant throughout the year and this has mainly been influenced by rural electrification projects being undertaken by countries in the Southern African region. The pole contract with the power utility company in Zambia accounted for a significant portion of the export business.
On the 29th of June 2011, a fire which started outside the perimeter wall at the Pole yard in Mutare, destroyed pole stocks worth $396,614 and damaged the two pole treatment autoclaves. One autoclave has since been repaired and was commissioned 19 days after the fire. The second autoclave is due for commissioning in October 2011.
Deferred TaxationAt dollarization the group did not transfer the deferred tax component on the deemed cost of biological assets and deferred tax on buildings was provided for at the capital gains tax as opposed to the income tax rate. The opening statement of financial position as at 30 June 2009 has therefore been restated to account for the error on deferred tax on biological assets and buildings. The resultant impact of the adjustment has been an increase of $22.5 million in the deferred tax balance and a corresponding decrease in the non distributable reserve account. Consequently, the income tax credit for the year ended 30 June 2010 has increased by $4.7 million.
Working capitalIt is pleasing to report that the Group has continued to fund working capital from internally generated cash. Operating cash flow at $2.6 million is significantly higher than prior year actual of $372,558. This is attributable to the increased sales revenues.
fiNANCe reportfiNANCe report

15
The Group’s balance sheet has however continued to reflect a negative working capital position. This is primarily a result of capital expenditure related debt which is mainly in the form of short term borrowings. As previously reported, efforts are being made to restructure all capital expenditure related debt into long term. In this regard, discussions are in progress with an international financial institution on a loan facility which would allow the Group to restructure all the capital expenditure related debt. Should the discussions be successful,
the structure of the balance sheet will improve significantly by the end of the new financial year and the interest burden would be reduced by at least fifty percent.
Biological AssetsThe re-development of plantations has continued at an accelerated pace, with $2 million being spent on silvicultural activities. The expenditure will certainly see plantations being more productive in the future. It is pleasing to note that the back-log is being addressed and some operations such as pruning at Sheba are now up to date. The aerial survey undertaken in May 2011 has provided us with a more accurate inventory count of growing timber.
property, plant and equipmentThe asset replacement programme initiated two years ago has seen $2.1 million being spent in the year under review. Expenditure was mainly on timber harvesting and road maintenance equipment. The equipment has impacted positively on production with roundwood production increasing to 200,000M3 from 143,000m3 achieved in prior year. In order to enhance systems of internal control and improve on reporting, an amount of $318,092 was spent on a new accounting system. The new accounting package (Syspro) went live on the 1st of July 2011.
external AuditorsIn line with our quest to observe good corporate governance principles, we have changed external auditors for the Group. Ernst and Young Chartered Accountants ceased to be our auditors during the year and PricewaterhouseCoopers (PwC) were appointed as auditors for the Group with effect from 1 June 2011.
We thank Ernst & Young for having been our auditors for more than 10 years. In the same vein, we would want to congratulate PwC on their appointment and trust that our relationship with them shall be professional and mutually beneficial.
outlookThe continued investment in capital expenditure will see your Group increasing production and sales revenues. It is envisaged that the new financial year will once again witness positive growth in revenues and profitability. Consequently, cash generation will be at a considerably higher level.
Post year end, the Group lost 1,055ha of plantation to fires with Sheba Estate recording the bulk of the loss. Whilst this is a setback, we believe salvage operations should mitigate the loss incurred and an accelerated planting program should bring back the area lost into production.
P NyembaFINANCE DIRECTOR31 October 2011
fiNANCe report (CoNt)fiNANCe report (CoNt)

B o R D e R T I M B e R S - A N N u A l R e p o R T - 2 0 1 116
INDepeNDeNT AuDIToR’S RepoRTto the shareholders of
BoRDeR TIMBeRS lIMITeDWe have audited the consolidated financial statements of Border Timbers Limited and its subsidiaries (“the Group”) and the statement of financial
position of Border Timbers Limited (“the Company”) standing alone, together the “financial statements”, which comprise the consolidated and separate
statements of financial position as at 30 June 2011 and the consolidated and separate statements of comprehensive income, changes in equity and
cash flows for the year then ended, and a summary of significant accounting policies and other explanatory notes set out on pages 17 to 66.
Directors’ Responsibility for the Financial StatementsThe directors are responsible for the preparation and fair presentation of these financial statements in accordance with International Financial
Reporting Standards and in the manner required by the Zimbabwe Companies Act (Chapter 24:03), and the relevant Statutory Instruments (“SI”) SI
33/99 and SI 62/96, and for such internal control as the directors determine is necessary to enable the preparation of financial statements that are
free from material misstatement, whether due to fraud or error.
Auditor’s ResponsibilityOur responsibility is to express an opinion on these financial statements based on our audit. We conducted our audit in accordance with International
Standards on Auditing. Those standards require that we comply with ethical requirements and plan and perform the audit to obtain reasonable
assurance about whether the financial statements are free from material misstatement.
An audit involves performing procedures to obtain audit evidence about the amounts and disclosures in the financial statements. The procedures
selected depend on the auditor’s judgment, including the assessment of the risks of material misstatement of the financial statements, whether due
to fraud or error. In making those risk assessments, the auditor considers internal control relevant to the entity’s preparation and fair presentation
of the financial statements in order to design audit procedures that are appropriate in the circumstances, but not for the purpose of expressing an
opinion on the effectiveness of the entity’s internal control. An audit also includes evaluating the appropriateness of accounting policies used and the
reasonableness of accounting estimates made by management, as well as evaluating the overall presentation of the financial statements. We believe
that the audit evidence we have obtained is sufficient and appropriate to provide a basis for our audit opinion.
opinionIn our opinion the financial statements present fairly, in all material respects, the financial position of the Group and the Company as at 30 June
2011, and the Group’s and Company’s financial performance and their cash flows for the year then ended in accordance with International Financial
Reporting Standards and in the manner required by the Zimbabwe Companies Act (Chapter 24:03) and the relevant Statutory Instruments SI 33/99
and SI 62/96.
emphasis of MatterWe draw attention to Note 2.1.3 to the financial statements, which indicates that the Group’s current liabilities exceeded its current assets by US$566 783
as at 30 June 2011, and the Group and Company incurred losses before fair value gains and tax of US$4 310 176 and US$3 942 947, respectively,
for the year then ended. These conditions, along with the other matters as set forth in Note 2.1.3, indicate the existence of a material uncertainty
which may cast significant doubt about the ability of the Group and Company to continue as going concerns. Our opinion is not qualified in respect
of this matter.
PricewaterhouseCoopers
Chartered Accountants (Zimbabwe)
Harare
2 December 2011
16

17
Restated Restated Notes 2011 2010 2009 US$ US$ US$Assets
Non-current assets Property, plant and equipment 6 46,867,238 46,723,497 48,779,512 Biological assets 7 90,432,254 82,828,342 74,372,359 137,299,492 129,551,839 123,151,871
Current assets Inventories 8 4,580,560 4,334,043 4,203,988Trade and other receivables 10 3,841,047 2,046,388 1,357,430Cash and bank 11 127,360 254,271 96,698 8,548,967 6,634,702 5,658,116
totAL Assets 145,848,459 136,186,541 128,809,987
eQUItY AND LIABILItIes
equityShare capital 12 429,425 - -Non distributable reserves 13 90,455,727 90,885,152 90,885,152Revaluation reserve 2,365,481 2,365,481 - Retained earnings / (accumulated loss) 11,663,762 6,632,793 (601,109) 104,914,395 99,883,426 90,284,043
liabilities
Non – current liabilities Borrowings 14 1,100,979 - -Deferred income 15 - - 646 918Deferred income tax liabilities 16 30,717,337 29,085,475 33,749,508 31,818,316 29,085,475 34,396,426
Current liabilities Trade and other payables 17 2,701,801 2,359,921 2,445,881 Provisions 18 301,581 156,348 196,922 Borrowings 14 6,112,366 4,701,371 1,486,715 9,115,748 7,217,640 4,129,518
totAL eQUItY AND LIABILItIes 145,848,459 136,186,541 128,809,987
The financial statements on pages 17 to 66 were approved by the Board of Directors and authorised for issue on the 31st October 2011 and are signed on its behalf by:
KRR SCHOFIELD P. NYEMBACHAIRMAN OF THE BOARD FINANCE DIRECTOR
CoNsoliDAteD stAteMeNt of fiNANCiAl positioNCoNsoliDAteD stAteMeNt of fiNANCiAl positioN

B o R D e R T I M B e R S - A N N u A l R e p o R T - 2 0 1 118
CoNsoliDAteD iNCoMe stAteMeNtCoNsoliDAteD iNCoMe stAteMeNt
Restated Notes 2011 2010 US$ US$
ReVeNUe 21,930,331 13,843,061Cost of sales 21 (19,785,061) (12,387,483)
GRoss PRoFIt 2,145,270 1,455,578Fair value gains on biological assets 7 10,973,007 8,936,592Other operating income – net 20 365,061 917,026Distribution and selling expenses 21 (1,693,276) (1,316,113)Administration expenses 21 (3,997,598) (7,916,822)
oPeRAtING PRoFIt 7,792,464 2,076,261Finance income 23 3,405 1,060Finance costs 23 (1,133,038) (321,077)
PRoFIt BeFoRe tAXAtIoN 6,662,831 1,756,244Income tax (expense) / credit 24 (1,631,862) 5,477,658
PRoFIt FoR tHe YeAR 5,030,969 7,233,902
Earnings per share (expressed in cents per share)
Basic earnings per share 25 11.72 16.85 Diluted earnings per share 25 11.72 16.85

19
2011 2010 US$ US$
PRoFIt FoR tHe YeAR 5,030,969 7,233,902
Other comprehensive income Gain on revaluation of property, plant and equipment - 3,179,106Income tax effect - (813,625)
Total other comprehensive income for the year, net of tax 5,030,969 2,365,481
Total comprehensive income for the year , net of tax 5,030,969 9,599,383
CoNsoliDAteD stAteMeNt of CoMpreHeNsive iNCoMeCoNsoliDAteD stAteMeNt of CoMpreHeNsive iNCoMe

B o R D e R T I M B e R S - A N N u A l R e p o R T - 2 0 1 120
Share Non Revaluation Retained Total capital distributable reserve earnings / equity reserves (accumulated losses) US$ US$ US$ US$ US$
Balance at 1 July 2009 as previously
reported - 113,364,035 - (601,109) 112,762,926Prior period adjustment (Note 4) - (22 478 883) - - (22 478 883) Balance as at 30 June 2009 restated - 90,885,152 - (601,109) 90 284 043 Comprehensive income:Profit for the year (restated) - - - 7 233 902 7 233 902
Other comprehensive income: Gain on revaluation of property plant and equipment,net of tax - - 2 365 481 - 2 365 481
Balance as at 30 June 2010 restated - 90,885,152 2.365,481 6,632,793 99,883,426
Comprehensive income:Profit for the year - - - 5,030,969 5,030,969
Transactions with owners:Re-denomination of shares 429,425 (429,425) - - - Balance as at 30 June 2011 429,425 90,455,727 2,365,481 11,663,762 104,914,395
CoNsoliDAteD stAteMeNt of CHANGes iN equityCoNsoliDAteD stAteMeNt of CHANGes iN equity

21
Restated Notes 2011 2009 US$ US$
Cash flows from operating activities Profit before interest and tax 7,792,464 2,076,261Adjustment for non-cash items 30 (3,673,109) (758,154) 4,119,355 1,318,107Movement in working capital 30 (1,554,063) (945,549)
Net cash generated from operating activities 2,565,292 372,558
Cash flows from investing activities Additions to property, plant & equipment (2,108,949) (1,227,386)Expenditure on biological assets (1,968,596) (1,882,238)Proceeds on sale of property, plant and equipment 3,000 -Interest received 3,405 1,060
Net cash used in investing activities (4,071,140) (3,108,564)
Cash flows from financing activities Proceeds from borrowings 10,297,245 2,070,382Repayments of borrowings (6,881,213) (2,000,103)Interest paid (1,133,037) (321,077)
Net cash generated from/(used in) financing activities 2,282,995 (250,798)
Net INCReAse / (DeCReAse) IN CAsH AND CAsH eQUIVALeNts 777,147 (2,986,804)
CAsH AND CAsH eQUIVALeNts At tHe BeGINNING oF tHe YeAR (2,890,117) 96,687
CAsH AND CAsH eQUIVALeNts At tHe eND oF tHe YeAR 11 (2,112,970) (2,890,117)
CoNsoliDAteD stAteMeNt of CAsH floWsCoNsoliDAteD stAteMeNt of CAsH floWs

B o R D e R T I M B e R S - A N N u A l R e p o R T - 2 0 1 122
1. CoRPoRAte INFoRMAtIoN
The financial statements of Border Timbers Limited (Group and Company) for the year ended 30 June 2011 were authorised for issue in
accordance with a resolution of the Directors on 26 October 2011. Border Timbers Limited is a limited liability public company incorporated
and domiciled in Zimbabwe whose shares are publicly traded.
The principle activities of the Group are the growing and milling of timber from managed plantations, and manufacturing of timber products.
2. sUMMARY oF ACCoUNtING PoLICIes
The principal accounting policies applied in the preparation of these consolidated financial statements are set out below. These policies have
been consistently applied to all the years presented, unless otherwise stated.
2.1 Basis of preparation
2.1.1 Statement of compliance The consolidated financial statements of Border Timbers Limited have been prepared in accordance with International Financial Reporting
Standards and IFRIC interpretations. International Financial Reporting Standards (IFRSs) include standards and interpretations approved
by the International Accounting Standards Board (IASB) as well as International Accounting Standards (IASs) and Standing Interpretations
Committee interpretations issued under previous constitutions.
2.1.2 Basis of Measurement The consolidated financial statements have been prepared under the historical cost convention, as modified by the revaluation of property
plant and equipment and biological assets.
The preparation of financial statements in conformity with IFRS requires the use of certain critical accounting estimates. It also requires
management to exercise its judgement in the process of applying the Group’s accounting policies. The areas involving a higher degree of
judgement or complexity, or areas where assumptions and estimates are significant to the consolidated financial statements are disclosed in
note 3.
2.1.3 Going concern The financial statements have been prepared on a going concern basis which assumes that the Group and the Company will continue in
existence for the foreseeable future. However there are material uncertainties related to the conditions noted below which may cast significant
doubt on the Group’s and Company’s ability to continue as a going concern and that they may be unable to realise their assets and discharge
their liabilities in the normal course of business.
The Group had a net current liability position of US$566,783 as at 30 June 2011. In addition as at year end the Group and the Company had
borrowings totaling US$7,213,345 comprised mainly of short term borrowings from local banks with maturity dates of less than 12 months.
The Group and the Company incurred losses before fair value gains and income tax of US$ 4,310,176. (2010: US$7,180,348) and US$3 942 947
(2010: US$6 483 314), respectively.
The Group’s operations have been significantly affected, and may continue to be affected by the challenging environment and lack of liquidity
in the Zimbabwean economy.
The Group is in negotiations to access medium to long term funding from international lenders.
Notes to tHe CoNsoliDAteD fiNANCiAl stAteMeNtsNotes to tHe CoNsoliDAteD fiNANCiAl stAteMeNts

23
However, after assessing the Group’s ability to continue as a going concern the Directors believe that the Group is on its way to recovery and
the strategies which have been put in place will ensure that the Group continues as a going concern. If the Group was not able to continue
in operational existence for the foreseeable future, adjustments would have to be made to reduce the year end values of assets to their
recoverable amounts and to provide for further liabilities that might arise, and to reclassify non-current assets and liabilities to current assets
and liabilities.
2.1.4Transition to IFRS The Group is resuming presentation of IFRS financial statements after the Group issued financial statements in the prior reporting period
ended 30 June 2010 which did not include an explicit and unreserved statement of compliance with IFRS due to the effects of severe
hyperinflation. As discussed in note 2.1.7(c), the Group early adopted the Amendments to IFRS 1 and is therefore applying that standard in
returning to compliance with IFRS. The Group’s functional currency for the period before 1 February 2009, the Zimbabwe dollar (“ZW$”), was
subjected to severe hyperinflation because it had both of the following characteristics:
(a) a reliable general price index was not available to all entities with transactions and balances in the ZW$, because the Central Statistical
Office did not release the consumer prices from 1 August 2008 and the existence of market distortions made measurement of inflation
by alternative means unreliable; and
(b) exchangeability between the ZW$ and a relatively stable foreign currency did not exist.
The Group’s functional currency ceased to be subject to severe hyperinflation from 1 February 2009, because the Group changed its functional
and presentation currency from the Zimbabwe dollar, (‘ZW$”), to the United States of America dollar (“US$”), because changes in legislation
allowed the Group to predominately operate within a US$ environment. The Group changed its functional and presentation currency from
ZW$ to the US$ with effect from 1 February 2009. The Group’s date of transition to IFRS was 1 July 2009.
2.1.5 exemption for fair value as deemed cost The Group elected to measure certain items of property and equipment, biological assets, inventory, trade and other receivables and trade
and other payables at fair value and to use the fair value as the deemed cost of those assets and liabilities in the opening IFRS statement of
financial position as follows:
Property plant and equipment - based on Directors’ valuation
Biological assets - based on independent valuers’ valuation
Trade and other receivables - actual US$ amounts receivable from customers and other parties.
Trade and other payables - based on actual US$ amounts owed to suppliers of goods and services.
Inventories - actual US$ cost and current US$ values
Cash and bank - actual foreign currency cash and bank balances.
Deferred income tax was computed based on temporary differences between tax bases and accounting bases of the assets and liabilities
included and take on statement of financial position. All references in these financial statements to cost shall apply to deemed cost to comply
with IFRS 1 where applicable.
2.1.6 Reconciliation to previous basis of preparation The Group’s financial statements for the prior reporting year ended 30 June 2010, claimed compliance with IFRS, except certain
requirements of IAS 1 ‘Presentation of Financial Statements’, IAS 21 ‘The Effects of Changes in Foreign Exchange Rates’, and IAS 29
‘Financial Reporting in Hyperinflationary Economies’. However, after the application of the exemption for fair value as deemed cost, no
measurement differences exist between the amounts previously presented as at 30 June 2009 and for the period ended 30 June 2010. As a
consequence, no reconciliation has been presented between the IFRS results and the previous basis of preparation.
Notes to tHe CoNsoliDAteD fiNANCiAl stAteMeNtsNotes to tHe CoNsoliDAteD fiNANCiAl stAteMeNts

B o R D e R T I M B e R S - A N N u A l R e p o R T - 2 0 1 124
2.1.7 Changes in Accounting policies and Disclosures
a) New and amended standards adopted by the Group
The following new standards and amendments to standards are mandatory for the first time for the financial year beginning 1 July 2010.
• IFRS 3 (revised), ‘Business combinations’, and consequential amendments to IAS 27, ‘Consolidated and separate financial statements’,
IAS 28, ‘Investments in associates’, and IAS 31, ‘Interests in joint ventures’, are effective prospectively to business combinations for
which the acquisition date is on or after the beginning of the first annual reporting period beginning on or after 1 July 2009.
The revised standard continues to apply the acquisition method to business combinations but with some significant changes compared
with IFRS 3. For example, all payments to purchase a business are recorded at fair value at the acquisition date, with contingent
payments classified as debt subsequently remeasured through the statement of comprehensive income. There is a choice on an
acquisition-by-acquisition basis to measure the non-controlling interest in the acquiree either at fair value or at the non-controlling
interest’s proportionate share of the acquiree’s net assets. All acquisition-related costs are expensed.
• IAS 1 (amendment), ‘Presentation of financial statements’. The amendment clarifies that the potential settlement of a liability by the
issue of equity is not relevant to its classification as current or non-current. By amending the definition of current liability, the amendment
permits a liability to be classified as non-current (provided that the entity has an unconditional right to defer settlement by transfer of
cash or other assets for at least 12 months after the accounting period) notwithstanding the fact that the entity could be required by the
counterparty to settle in shares at any time.
• IAS 27 (revised) requires the effects of all transactions with non-controlling interests to be recorded in equity if there is no change in
control and these transactions will no longer result in goodwill or gains and losses. The standard also specifies the accounting when
control is lost. Any remaining interest in the entity is re-measured to fair value, and a gain or loss is recognised in profit or loss. IAS 27
(revised) has had no impact on the current period, as there have been no transactions with non-controlling interests.
• IAS 36 (amendment), ‘Impairment of assets’, effective 1 January 2010. The amendment clarifies that the largest cash-generating unit
(or group of units) to which goodwill should be allocated for the purposes of impairment testing is an operating segment, as defined by
paragraph 5 of IFRS 8, ‘Operating segments’ (that is, before the aggregation of segments with similar economic characteristics).
b) New and amended standards, and interpretations mandatory for the first time for the financial year beginning 1 July 2010 but not
currently relevant to the Group (although they may affect the accounting for future transactions and events)
• IFRIC 17, ‘Distribution of non-cash assets to owners’ (effective on or after 1 July 2009).The interpretation was published in November
2008. This interpretation provides guidance on accounting for arrangements whereby an entity distributes non-cash assets to
shareholders either as a distribution of reserves or as dividends. IFRS 5 has also been amended to require that assets are classified as
held for distribution only when they are available for distribution in their present condition and the distribution is highly probable.
• IFRS 5 (amendment), ‘Non-current assets held for sale and discontinued operations’. The amendment clarifies that IFRS 5 specifies the
disclosures required in respect of non-current assets (or disposal groups) classified as held for sale or discontinued operations. It also
clarifies that the general requirement of IAS 1 still apply, in particular paragraph 15 (to achieve a fair presentation) and paragraph 125
(sources of estimation uncertainty) of IAS 1.
Notes to tHe CoNsoliDAteD fiNANCiAl stAteMeNtsNotes to tHe CoNsoliDAteD fiNANCiAl stAteMeNts
Notes to tHe CoNsoliDAteD fiNANCiAl stAteMeNtsNotes to tHe CoNsoliDAteD fiNANCiAl stAteMeNts

25
c) New standards, amendments and interpretations issued but not effective for the financial year beginning 1 July 2010 and early
adopted.
The Group early adopted the Amendments to IFRS 1- Severe hyperinflation and removal of fixed dates for first-time adopters from the
31 December 2010, as well as the related consequential amendments to other IFRSs, because the amendment provides an additional
exemption within IFRS 1 for entities which were subject to severe hyperinflation. Refer to note 2.1.4 where the transition to IFRS is
discussed in more detail.
d) New standards, amendments and interpretations issued but not effective for the financial year beginning 1 July 2010 and not early
adopted
The Group is yet to assess the impact of these new standards and interpretations on its financial statements:
• Amendments to IFRS 7, ‘Financial instruments: Disclosures’ on derecognition, effective 1 July 2011. This amendment will promote
transparency in the reporting of transfer transactions and improve users’ understanding of the risk exposures relating to transfers
of financial assets and the effect of those risks on an entity’s financial position, particularly those involving securitisation of financial
assets.
• IFRS 9, ‘Financial instruments’, issued in November 2009. This standard is the first step in the process to replace IAS 39, ‘Financial
instruments: recognition and measurement’. IFRS 9 introduces new requirements for classifying and measuring financial assets and
is likely to affect the Group’s accounting for its financial assets. The standard is not applicable until 1 January 2013 but is available for
early adoption.
• IFRS 10, ‘Consolidated financial statements’, effective 1 January 2013. The objective of IFRS 10 is to establish principles for the
presentation and preparation of consolidated financial statements when an entity controls one or more other entities to present
consolidated financial statements. Defines the principle of control, and establishes controls as the basis for consolidation. The standard
also sets out how to apply the principle of control to identify whether an investor controls an investee and therefore must consolidate the
investee and sets out the accounting requirements for the preparation of consolidated financial statements.
• IFRS 11, ‘Joint arrangements’, effective 1 January 2013. IFRS 11 is a more realistic reflection of joint arrangements by focusing on the
rights and obligations of the arrangement rather than its legal form. There are two types of joint arrangement: joint operations and joint
ventures. Joint operations arise where a joint operator has rights to the assets and obligations relating to the arrangement and hence
accounts for its interest in assets, liabilities, revenue and expenses. Joint ventures arise where the joint operator has rights to the net
assets of the arrangement and hence equity accounts for its interest. Proportional consolidation of joint ventures is no longer allowed.
• IFRS 12, ‘Disclosures of interests in other entities’, effective 1 January 2013 .IFRS 12 includes the disclosure requirements for all forms
of interests in other entities, including joint arrangements, associates, special purpose vehicles and other off balance sheet vehicles.
• IFRS 13, ‘Fair value measurement’, effective 1 January 2013. IFRS 13 aims to improve consistency and reduce complexity by providing
a precise definition of fair value and a single source of fair value measurement and disclosure requirements for use across IFRSs.
The requirements, which are largely aligned between IFRSs and US GAAP, do not extend the use of fair value accounting but provide
guidance on how it should be applied where its use is already required or permitted by other standards within IFRSs or US GAAP.
Notes to tHe CoNsoliDAteD fiNANCiAl stAteMeNtsNotes to tHe CoNsoliDAteD fiNANCiAl stAteMeNts
Notes to tHe CoNsoliDAteD fiNANCiAl stAteMeNtsNotes to tHe CoNsoliDAteD fiNANCiAl stAteMeNts

B o R D e R T I M B e R S - A N N u A l R e p o R T - 2 0 1 126
• Amendment to IAS 1, ‘Financial statement presentation’, regarding other comprehensive income, effective 1July 2012. The main
change resulting from these amendments is a requirement for entities to group items presented in ‘other comprehensive income’ (OCI)
on the basis of whether they are potentially reclassifiable to profit or loss subsequently (reclassification adjustments). The amendments
do not address which items are presented in OCI.
• Amendment to IAS 12, ‘Income taxes’ on deferred tax, effective date 1 January 2012. IAS 12, ‘Income taxes’, currently requires an entity
to measure the deferred tax relating to an asset depending on whether the entity expects to recover the carrying amount of the asset
through use or sale. It can be difficult and subjective to assess whether recovery will bethrough use or through sale when the asset is
measured using the fair value model in IAS 40, ‘Investment property’. This amendment therefore introduces an exception to the existing
principle for the measurement of deferred tax assets or liabilities arising on investment property measured at fair value. As a result of
the amendments, SIC 21, ‘Income taxes - recovery of revalued non-depreciable assets’, will no longer apply to investment properties
carried at fair value. The amendments also incorporate into IAS 12 the remaining guidance previously contained in SIC 21, which is
withdrawn.
• Amendment to IAS 19, ‘Employee benefits’, effective 1 January 2013. These amendments eliminate the corridor approach and calculate
finance costs on a net funding basis.
• Revised IAS 24 (revised), ‘Related party disclosures’, issued in November 2009. It supersedes IAS 24, ‘Related party disclosures’,
issued in 2003. IAS 24 (revised) is mandatory for periods beginning on or after 1 January 2011. Earlier application, in whole or in part,
is permitted.
The revised standard clarifies and simplifies the definition of a related party and removes the requirement for government-related entities
to disclose details of all transactions with the government and other government-related entities. The Group will apply the revised standard
from 1 January 2011. When the revised standard is applied, the Group and the parent will need to disclose any transactions between its
subsidiaries and its associates.
• IAS 27 (revised 2011), ‘Separate financial statements’, effective 1 January 2013. IAS 27 (revised 2011) includes the provisions on
separate financial statements that are left after the control provisions of IAS 27 have been included in the new IFRS 10.
• IAS 28 (revised 2011), ‘Associates and joint ventures’, effective 1 January 2013. IAS 28 (revised 2011) includes the requirements for
joint ventures, as well as associates, to be equity accounted following the issue of IFRS 11.
2.2 Basis of Consolidation The consolidated financial statements incorporate the financial statements of the Border Timbers Limited and its subsidiaries, using uniform
accounting policies.
Subsidiaries Subsidiaries are all entities (including special purpose entities) over which the Group has the power to govern the financial and operating
policies generally accompanying a shareholding of more than one half of the voting rights. The existence and effect of potential voting rights
that are currently exercisable or convertible are considered when assessing whether the Group controls another entity. Subsidiaries are fully
consolidated from the date on which control is transferred to the Group. They are deconsolidated from the date that control ceases.
The Group uses the acquisition method of accounting to account for business combinations. The consideration transferred for the
acquisition of a subsidiary is the fair values of the assets transferred, the liabilities incurred and the equity interests issued by the Group. The
consideration transferred includes the fair value of any asset or liability resulting from a contingent consideration arrangement. Acquisition-
related costs are expensed as incurred. Identifiable assets acquired and liabilities and contingent liabilities assumed in a business combination
are measured initially at their fair values at the acquisition date. On an acquisition-by-acquisition basis, the Group recognises any non-
controlling interest in the acquiree either at fair value or at the non-controlling interest’s proportionate share of the acquiree’s net assets.
Notes to tHe CoNsoliDAteD fiNANCiAl stAteMeNtsNotes to tHe CoNsoliDAteD fiNANCiAl stAteMeNts

27
Investments in subsidiaries are accounted for at cost less impairment. Cost is adjusted to reflect changes in consideration arising from
contingent consideration amendments. Cost also includes direct attributable costs of investment.
The excess of the consideration transferred, the amount of any non-controlling interest in the acquiree and the acquisition-date fair value
of any previous equity interest in the acquiree over the fair value of the Group’s share of the identifiable net assets acquired is recorded as
goodwill. If this is less than the fair value of the net assets of the subsidiary acquired in the case of a bargain purchase, the difference is
recognized directly in the statement of comprehensive income.
Inter-company transactions, balances and unrealised gains on transactions between group companies are eliminated. Unrealised losses are
also eliminated. Accounting policies of subsidiaries have been changed where necessary to ensure consistency with the policies adopted by
the Group.
2.3 Segment Reporting
Operating segments are reported in a manner consistent with the internal reporting provided to the chief operating decision-maker. The
chief operating decision-maker, who is responsible for allocating resources and assessing performance of the operating segments, has
been identified as the Operations Board.
2.4 Foreign Currency Translation (a) Functional and presentation currency
I tems included in the financial statements of each of the Group’s entities are measured using the currency of the primary economic
environment in which the entity operates (‘the functional currency’). The consolidated financial statements are presented in ‘United State
dollars’ (US$), which is the Group’s presentation currency.
(b) Transactions and balances
Foreign currency transactions are translated into the functional currency using the exchange rates prevailing at the dates of the transactions
or valuation where items are re-measured. Foreign exchange gains and losses resulting from the settlement of such transactions and from
the translation at year-end exchange rates of monetary assets and liabilities denominated in foreign currencies are recognised in the income
statement.
Foreign exchange gains and losses that relate to borrowings are presented in the income statement within ‘finance income or cost’. All
other foreign exchange gains and losses are presented in the income statement within ‘other (losses)/gains – net’.
Translation differences on non-monetary financial assets and liabilities are recognised in profit or loss as part of the fair value gain or loss.
Translation differences on non-monetary financial assets are included in other comprehensive income.
2.5 property, plant and equipment Property, plant and equipment are shown at fair value, based on periodic valuations by independent professional valuers or directors less
subsequent depreciation and impairment losses. Any accumulated depreciation at the date of revaluation is eliminated against the gross
carrying amount of the asset, and the net amount is restated to the revalued amount of the asset.
Subsequent costs are included in the asset’s carrying amount or recognised as a separate asset, as appropriate, only when it is probable
that future economic benefits associated with the item will flow to the Group and the cost of the item can be measured reliably. The carrying
amount of the replaced part is derecognised. All other repairs and maintenance are charged to the income statement during the financial
period in which they are incurred. Cost includes expenditure that is directly attributable to the acquisition of the items.
Notes to tHe CoNsoliDAteD fiNANCiAl stAteMeNtsNotes to tHe CoNsoliDAteD fiNANCiAl stAteMeNts

B o R D e R T I M B e R S - A N N u A l R e p o R T - 2 0 1 128
Increases in the carrying amount arising on revaluation of property plant and equipment are credited to the revaluation reserve through other
comprehensive income. Decreases that offset previous increases of the same asset are charged against the revaluation reserve through
other comprehensive income, all other decreases are charged to the statement of comprehensive income.
Land and capital work in progress are not depreciated. Depreciation on other assets is calculated using the straight-line method to allocate
their cost or revalued amounts to their residual values over their estimated useful lives, as follows:
Buildings and improvements 4 - 30 years
Plant and machinery 5 - 33 years
Motor vehicles and tractors 5 - 10 years
Furniture, fittings and office equipment 4 - 15 years
The assets’ residual values and useful lives are reviewed, and adjusted if appropriate, at each reporting date. An asset’s carrying amount is
written down immediately to its recoverable amount if the asset’s carrying amount is greater than its estimated recoverable amount.
Gains and losses on disposals are determined by comparing the proceeds with the carrying amount and are recognised in the statement of
comprehensive income.
When revalued assets are sold, the amounts included in revaluation reserves are transferred to retained earnings.
2.6 Biological Assets - plantations Plantations are stated at fair value less estimated cost to sell at the harvesting stage. Immature timber which is in the 1 – 6 age group is
carried at cost as the fair value cannot be easily determined. The age threshold used for quantifying immature timber is dependent on the
rotation period of the specific timber genus. Softwood less than six years and hardwood less than four years is classified as immature timber.
All changes in fair value are recognised in the period in which they arise.
Trees are generally felled at the optimum age when ready for intended use. At the time the tree is felled it is taken out of plantations and
accounted for under inventory. Fair value for mature timber is determined based on prices on the local and regional markets which are
markets in which the bulk of the timber is sold. Changes in the carrying value of the biological asset are taken directly to the income statement
in accordance with IAS 41 “Agriculture”. Transfers to inventory are recognized at the carrying amount of the plantation when the timber is
felled.
2.7 Financial Assets
Classification The Group classifies its financial assets as loans and receivables.The classification depends on the purpose for which the financial assets
were acquired. Management determines the classification of its financial assets at initial recognition.
a) loans and receivables Loans and receivables are non-derivative financial assets with fixed or determinable payments that are not quoted in an active market.
They are included in current assets, except for maturities greater than 12 months after the reporting date. These are classified as non-current
assets. The Group’s loans and receivables comprise trade and other receivables and cash and cash equivalents in the statement of financial
position.
Recognition and measurement Regular purchases and sales of financial assets are recognised on the trade-date – the date on which the Group commits to purchase or sell
the asset. Investments are initially recognised at fair value plus transaction costs for all financial assets not carried at fair value through profit
Notes to tHe CoNsoliDAteD fiNANCiAl stAteMeNtsNotes to tHe CoNsoliDAteD fiNANCiAl stAteMeNts

29
or loss. Financial assets are derecognised when the rights to receive cash flows from the investments have expired or have been transferred
and the Group has transferred substantially all risks and rewards of ownership. Loans and receivables are subsequently carried at amortised
cost using the effective interest method.
2.8 Impairment of Financial Assets
Assets carried at amortised cost The Group assesses at the end of each reporting period whether there is objective evidence that a financial asset or group of financial assets
is impaired. A financial asset or a group of financial assets is impaired and impairment losses are incurred only if there is objective evidence
of impairment as a result of one or more events that occurred after the initial recognition of the asset (a ‘loss event’) and that loss event (or
events) has an impact on the estimated future cash flows of the financial asset or group of financial assets that can be reliably estimated. The
criteria that the Group uses to determine that there is objective evidence of an impairment loss include:
- significant financial difficulty of the issuer or obligor;
- a breach of contract, such as a default or delinquency in interest or principal payments;
- the Group, for economic or legal reasons relating to the borrower’s financial difficulty, granting to the borrower a concession that the
lender would not otherwise consider;
- it becomes probable that the borrower will enter bankruptcy or other financial reorganisation;
- the disappearance of an active market for that financial asset because of financial difficulties; or
- observable data indicating that there is a measurable decrease in the estimated future cash flows from a portfolio of financial assets
since the initial recognition of those assets, although the decrease cannot yet be identified with the individual financial assets in the
portfolio, including:
(i) adverse changes in the payment status of borrowers in the portfolio; and
(ii) national or local economic conditions that correlate with defaults on the assets in the portfolio.
The Group first assesses whether objective evidence of impairment exists.
For loans and receivables category, the amount of the loss is measured as the difference between the asset’s carrying amount and the
present value of estimated future cash flows (excluding future credit losses that have not been incurred) discounted at the financial asset’s
original effective interest rate. The carrying amount of the asset is reduced and the amount of the loss is recognised in the statement of
comprehensive income. If a loan has a variable interest rate, the discount rate for measuring any impairment loss is the current effective
interest rate determined under the contract. As a practical expedient, the Group may measure impairment on the basis of an instrument’s fair
value using an observable market price.
If, in a subsequent period, the amount of the impairment loss decreases and the decrease can be related objectively to an event occurring after
the impairment was recognised (such as an improvement in the debtor’s credit rating), the reversal of the previously recognised impairment
loss is recognised in the statement of comprehensive income.
2.9 Inventories Inventories are valued at the lower of cost and net realisable value after appropriate provisions for redundant and slow moving items. Cost is
determined on the following basis:-
a) Raw materials are valued at cost on a weighted average basis.
b) Finished goods and work-in-progress are valued at cost using weighted average cost method. Cost includes raw materials, direct
labour, other direct costs and related production overheads (based on normal operating capacity). It excludes borrowing costs.
c) Consumables are valued at weighted average cost.
The values of obsolete and slow moving stocks are reduced, where necessary, to estimated net realisable values.
Notes to tHe CoNsoliDAteD fiNANCiAl stAteMeNtsNotes to tHe CoNsoliDAteD fiNANCiAl stAteMeNts

B o R D e R T I M B e R S - A N N u A l R e p o R T - 2 0 1 130
Net realisable value is the estimated selling price in the ordinary course of the business less estimated costs of completion and estimated
costs necessary to make the sale.
2.10 Trade Receivables Trade receivables are amounts due from customers for goods and services provided in the ordinary course of business. If collection is
expected in one year or less (or in the normal operating cycle of the business if longer), they are classified as current assets. If not, they are
presented as non-current assets.
Trade receivables are recognised initially at fair value and subsequently measured at amortised cost using the effective interest method, less
provision for impairment.
2.11 Cash and Cash equivalents In the consolidated statement of cash flows, cash and cash equivalents includes cash in hand, deposits held at call with banks, other
short- term highly liquid investments with original maturities of three months or less, and bank overdrafts. Bank overdrafts are shown within
borrowings in current liabilities on the statement of financial position.
2.12 Share Capital Ordinary shares are classified as equity. Incremental costs directly attributable to the issue of new shares or options are shown in equity as
a deduction, net of tax, from the proceeds.
2.13 Borrowings Borrowings are recognised initially at fair value, net of transaction costs incurred. Borrowings are subsequently carried at amortised cost; any
difference between the proceeds (net of transaction costs) and the redemption value is recognised in the income statement over the period
of the borrowings using the effective interest method.
Fees paid on the establishment of loan facilities are recognised as transaction costs of the loan to the extent that it is probable that some or
all of the facility will be drawn down. In this case, the fee is deferred until the draw-down occurs. To the extent there is no evidence that it is
probable that some or all of the facility will be drawn down, the fee is capitalised as a pre-payment for liquidity services and amortised over
the period of the facility to which it relates.
2.14 Government Grants Grants from the government are recognised at their fair value where there is a reasonable assurance that the grant will be received and the
Group will comply with all attached conditions.
Government grants relating to income are deferred and recognised in the income statement over the period necessary to match them with
the costs that they are intended to compensate. Government grants relating to property, plant and equipment are included in non-current
liabilities as deferred government grants and are credited to the income statement on a straight-line basis over the expected lives of the
related assets.
2.15 Current and Deferred Income Tax The tax expense for the period comprises current and deferred tax. Tax is recognised in the income statement, except to the extent that it
relates to items recognised in other comprehensive income or directly in equity. In this case, the tax is also recognised in other comprehensive
income or directly in equity, respectively.
Current income tax Current income tax assets and liabilities for the current and prior periods are measured at the amount expected to be recovered from, or paid
Notes to tHe CoNsoliDAteD fiNANCiAl stAteMeNtsNotes to tHe CoNsoliDAteD fiNANCiAl stAteMeNts

31
to, the taxation authority. The tax rates and tax laws used to compute the amount are those that are enacted or substantially enacted by the
reporting date. Management periodically evaluates positions taken in tax returns with respect to situations in which applicable tax regulation
is subject to interpretation. It establishes provisions where appropriate on the basis of amounts expected to be paid to the tax authorities.
Deferred tax Deferred tax is provided using the liability method, on temporary differences at the reporting date between the tax bases of assets and
liabilities and their carrying amounts in the consolidated financial statements. However, deferred tax liabilities are not recognised if they
arise from the initial recognition of goodwill; deferred income tax is not accounted for if it arises from initial recognition of an asset or liability
in a transaction other than a business combination that at the time of the transaction affects neither accounting nor taxable profit or loss.
Deferred income tax is determined using tax rates (and laws) that have been enacted or substantially enacted by the balance sheet date and
are expected to apply when the related deferred income tax asset is realised or the deferred income tax liability is settled.
Deferred income tax assets are recognised only to the extent that it is probable that future taxable profit will be available against which the
temporary differences can be utilised.
Deferred income tax assets and liabilities are offset when there is a legally enforceable right to offset current tax assets against current tax
liabilities and when the deferred income taxes assets and liabilities relate to income taxes levied by the same taxation authority on either the
same taxable entity or different taxable entities where there is an intention to settle the balances on a net basis.
Value Added tax Revenues, expenses and assets are recognised net of the amount of value added tax except:
• where the value added tax incurred on a purchase of assets or services is not recoverable from the taxation authority, in which case the
value added tax is recognised as part of the cost of acquisition of the asset or as part of the expense item as applicable: and
• receivables and payables that are stated with the amount of value added tax included.
The net amount of value added tax recoverable from, or payable to, the taxation authority is included as part of the receivables or payables
in the statement of financial position.
2.16 Employee Benefits
pension obligations The Group provides for pensions on retirement for all employees by means of a defined contribution pension fund which is administered by
a Board of Trustees.
A defined contribution plan is a pension plan under which the Group pays fixed contributions into a separate entity. The Group has no legal
or constructive obligations to pay further contributions if the fund does not hold sufficient assets to pay all employees the benefits relating to
employee service in the current and prior periods. The contributions are recognised as employee benefit expense when they are due. Prepaid
contributions are recognised as an asset to the extent that a cash refund or a reduction in the future payments is available.
Group Companies and all employees contribute to the National Social Security Authority Scheme of which the contributions are determined
by the systematic recognition of legislated contributions.
Short terms benefits The cost of short term employee benefits is recognised in the period in which the service is rendered. The expected cost of short term
accumulating compensated absence is recognised as an expense as the employees render services that increase their entitlement.
Notes to tHe CoNsoliDAteD fiNANCiAl stAteMeNtsNotes to tHe CoNsoliDAteD fiNANCiAl stAteMeNts

B o R D e R T I M B e R S - A N N u A l R e p o R T - 2 0 1 132
Termination benefits Termination benefits are payable when employment is terminated by the Group before the normal retirement date, or whenever an
employee accepts voluntary redundancy in exchange for these benefits. The Group recognises termination benefits when it is demonstrably
committed to either: terminating the employment of current employees according to a detailed formal plan without possibility of withdrawal;
or providing termination benefits as a result of an offer made to encourage voluntary redundancy. Benefits falling due more than 12 months
after the reporting date are discounted to their present value.
Profit sharing and bonus plans. The Group recognises a liability and an expense for bonuses and profit-sharing, based on a formula that takes into consideration the profit
attributable to the company’s shareholders after certain adjustments. The Group recognizes a provision where contractually obliged or where
there is a past practice that has created a constructive obligation.
2.17 Trade payables Trade payables are obligations to pay for goods or services that have been acquired in the ordinary course of business from suppliers.
Accounts payable are classified as current liabilities if payment is due within one year or less (or in the normal operating cycle of the business
if longer). If not, they are presented as non-current liabilities.
Trade payables are recognised initially at fair value and subsequently measured at amortised cost using the effective interest method.
2.18 provisions Provisions are recognised when; the Group has a present legal or constructive obligation as a result of past events; it is probable that an
outflow of resources will be required to settle the obligation and the amount has been reliably estimated. Provisions are not recognised for
future operating losses.
Where there are a number of similar obligations, the likelihood that an outflow will be required in settlement is determined by considering the
class of obligations as a whole. A provision is recognised even if the likelihood of an outflow with respect to any one item included in the same
class of obligations may be small.
Provisions are measured at the present value of the expenditures expected to be required to settle the obligation using a pre-tax rate that
reflects current market assessments of the time value of money and the risks specific to the obligation. The increase in the provision due to
passage of time is recognised as interest expense.
2.19 Revenue Recognition Revenue is measured at the fair value of the consideration received or receivable and represents amounts received or receivable for goods
and services sold in the normal course of business, net of discounts and value added taxes and after eliminating sales within the Group. The
revenue for the Group comprises sales of processed and raw timber to local and export markets. The Group recognizes revenue when the
amount of revenue can be reliably measured, it is probable that future economic benefits will flow to the entity and when the following specific
recognition criteria are met.
a) Sale of goods
Revenue is recognised when significant risks and rewards of ownership are transferred to the buyer.
b) Interest income
Interest income is recognised as interest accrues using the effective interest method.
c) Dividend income
Dividend income is recognised when the Group’s right to receive the payment is established.
Notes to tHe CoNsoliDAteD fiNANCiAl stAteMeNtsNotes to tHe CoNsoliDAteD fiNANCiAl stAteMeNts
33
2.20 leases
Finance leases Leases of property, plant and equipment where the Group has substantially all the risks and rewards of ownership are classified as finance
leases. Finance leases are capitalised at the lease’s commencement at the lower of the fair value of the leased property and the present value
of the minimum lease payments.
Each lease payment is allocated between the liability and finance charges. The corresponding rental obligations, net of finance charges, are
included in borrowings. The interest element of the finance cost is charged to the income statement over the lease period so as to produce a
constant periodic rate of interest on the remaining balance of the liability for each period. The property, plant and equipment acquired under
finance leases are depreciated over the shorter of the estimated useful life of the asset or the lease term, if there is no reasonable certainty
that the Group will obtain ownership by the end of the lease term.
operating lease Leases in which a significant portion of the risks and rewards of ownership are retained by the lessor are classified as operating leases.
Payments made under operating leases (net of any incentives received from the lessor) are charged to the income statement on a straight-line
basis over the period of the lease.
2.21 Borrowing Costs Borrowing costs directly attributable to the acquisition, construction or production of assets that necessarily take a substantial period of time
to get ready for their intended use or sale, are added to the cost of those assets, until such time as the assets are substantially ready for their
intended use or sale. All other borrowing costs are expensed in the period in which they are incurred.
3. CRItICAL ACCoUNtING estIMAtes AND JUDGeMeNts
Estimates and judgements are continually evaluated and are based on historical experience and other factors, including expectations of future
events that are believed to be reasonable under the circumstances.
Critical accounting estimates and assumptions The Group makes estimates and assumptions concerning the future. The resulting accounting estimates will, by definition, seldom equal the
related actual results. The estimates and assumptions that have significant risk of causing a material adjustment to the carrying amounts of
assets and liabilities within the next financial year are discussed below.
a) Useful lives and values of property, equipment and vehicles
The Group management determines the estimated useful lives and related depreciation charges for its property, plant and equipment.
This estimate is based on projected lifecycles for these assets. Management will increase the depreciation charge where useful lives
are less than previously estimated lives, or it will write off or write down technically obsolete or non-strategic assets that have been
abandoned or sold.
b) Valuation of property, plant and equipment
On 30 June 2010 an independent valuer’s valuation was done on all property, plant and equipment. In the view of the directors there
is no significant change in the fair value as at 30 June 2011.
The Group tests whether property, plant and equipment has suffered any impairment whenever events or changes in circumstances
indicate that the carrying amount may not be recovered, in accordance with the accounting policy note in 2.7 to the Group financial
statements. The recoverable amounts of plant and equipment have been determined with reference to fair value less cost to sell.
Notes to tHe CoNsoliDAteD fiNANCiAl stAteMeNtsNotes to tHe CoNsoliDAteD fiNANCiAl stAteMeNts

B o R D e R T I M B e R S - A N N u A l R e p o R T - 2 0 1 134
c) Valuation of biological assets
In determining biological asset valuation the following assumptions were used:
• Mean annual increment (MAI) calculated by estate, compartment, species and age class was determined based on current silviculture
regime and used to compute yield per hectare. MAI is the incremental movement in volume due to growth. The group’s MAI is in line
with regional averages.
• Where biomass for young trees is negligible and cannot easily be quantifiable, input costs have been used
• Current recovery rates have been used to arrive at saleable output
• Prices used for valuation are market linked
• Yield volumes are dependent on species and age
Changes in any estimates could lead to recognition of significant fair value changes in the statement of comprehensive income. The effect of
a change in the MAI on profit before tax is analysed in note 7 to the financial group statements.
d) Impairment losses on trade and other receivables
The Group reviews its trade and other receivables to assess impairment on a monthly basis. In determining whether an impairment loss
should be recorded in the income statement, the Group makes judgments as to whether there is an observable data indicating that there
is a measurable decrease in the estimated future cash flows from a portfolio of trade and other receivables before the decrease can be
identified with an individual receivables in that portfolio. This evidence may include observable data indicating that there has been an
adverse change in the payment status of borrowers in the Group, or national or local economic conditions that correlate with defaults
in the Group. Management uses estimates based on historical loss experience for assets with credit risk characteristics and objective
evidence of impairment similar to those in the portfolio when scheduling its cash flows. The methodology and assumptions used for
estimating both the amount and timing of future cash flows are reviewed regularly to reduce any differences between loss estimates
and actual loss experience.
e) Income taxes
The Group recognises liabilities for anticipated tax audit issues based on estimates of whether additional taxes will be due. Where the
final tax outcome of these matters is different from the amounts that were initially recorded, such differences will impact the income tax
and deferred tax provisions in the period in which such determination is made.
f) Going concern
The Directors assess the ability of the Group to continue operating as a going concern at the end of each financial year. As at 30 June
2011, the directors have assessed the ability of the Group to continue operating as a going concern and believe that the preparation of
these financial statements on a going concern basis is still appropriate. However, the Directors believe that under the current Zimbabwe
economic environment a continuous’ assessment of the ability of the Group to continue to operate as a going concern will need to be
performed to determine the continued appropriateness of the going concern assumption that has been applied in the preparation of
these financial statements.
Notes to tHe CoNsoliDAteD fiNANCiAl stAteMeNtsNotes to tHe CoNsoliDAteD fiNANCiAl stAteMeNts

35
4. CoRReCtIoN oF PRIoR PeRIoD eRRoRs
During the financial year, the Group identified errors in the opening balances of deferred income tax liabilities. Deferred tax was not provided
on the deemed cost of biological assets and land, roads and bridges as at 1 July 2009; and assessable tax losses for the year ended 30 June
2010. The errors were identified during the current financial year and in accordance with IAS 8: Accounting Policies, Changes in Accounting
Estimates and Errors, the deferred tax has been corrected retrospectively and certain comparative figures have been restated. The effect of
the restatement on the 2010 and 2009 financial statements is shown below:
Notes to tHe CoNsoliDAteD fiNANCiAl stAteMeNtsNotes to tHe CoNsoliDAteD fiNANCiAl stAteMeNts
Deferred tax Non Retained liability distributable earnings reserve US$ US$ US$ 2011 2010 2009 Financial position
Balance at 1 July 2009 (as previously reported) 11,270,625 113,364,035 -Correction of error 22,478,883 (22,478,883) -Balance at 1 July 2009 (restated) 33,749,508 90,885,152 - Balance at 30 June 2010 (as previously reported) 11,270,350 113,364,035 1,969,035Correction of error – 2009 22,478,883 (22,478,883) - 2010 (4,663,758) - 4,663,758Balance at 30 June 2010 (restated) 29,085,475 90,885,152 6,632,793
2010 US$Comprehensive income Profit after tax (as previously reported) 2,570,144Correction of error in tax credit 4,663,758Profit after tax (restated) 7,233,902

B o R D e R T I M B e R S - A N N u A l R e p o R T - 2 0 1 136
Notes to tHe CoNsoliDAteD fiNANCiAl stAteMeNtsNotes to tHe CoNsoliDAteD fiNANCiAl stAteMeNts
5. SEGMENT INFORMATION Forestry Manufacturing Unallocated Total US$ US$ US$ US$
Year ended 30 June 2011
Total segment revenue 15,495,555 12,893,376 - 28,388,931Inter segment revenue (6,414,184) (44,416) - (6,458,600)Revenue from external customers 9,081,371 12,848,960 - 21,930,331 Operating profit/(loss) before interest & taxation 10,897,195 150,640 (3,255,371) 7,792,464Net interest paid - (134,597) (995,036) (1,129,633)Profit before tax 10,897,195 16,043 (4,250,407) 6,662,831
Statement of financial position Total Assets 127,817,041 14,480,997 3,550,421 145,848,459 Total Liabilities 8,054,205 873,674 32,006,185 40,934,064
other Information Capital expenditure 3,356,237 372,099 349,209 4,077,545Depreciation 1,112,047 494,283 157,532 1,763,862Impairment of property, plant and equipment - 193,322 - 193,322Employee numbers 2,379 575 58 3,012
Year ended 30 June 2010 Total segment revenue 10,565,541 8,419,462 52,893 19,037,896Inter segment revenue (5,178,985) (15,850) - (5,194,835)Revenue from external customers 5,386,556 8,403,612 52,893 13,843,061 Operating profit/(loss) before interest & taxation 7,215,211 (2,057,101) (3,081,849) 2,076,261Net interest received / (paid) - 178 (320,195) (320,017)Profit before tax 7,215,211 (2,056,923) (3,402,044) 1,756,244
Statement of financial position Total Assets 119,166,516 13,718,979 3,301,046 136,186,541 Total Liabilities 5,054,737 1,583,695 29,664,683 36,303,115
other Information Capital expenditure 3,755,402 129,973 38,453 3,923,828Depreciation 1,092,201 732,740 120,443 1,945,384Impairment of property, plant and equipment 3,413,820 1,038,425 - 4,452,245Employee numbers 2,048 394 68 2,530
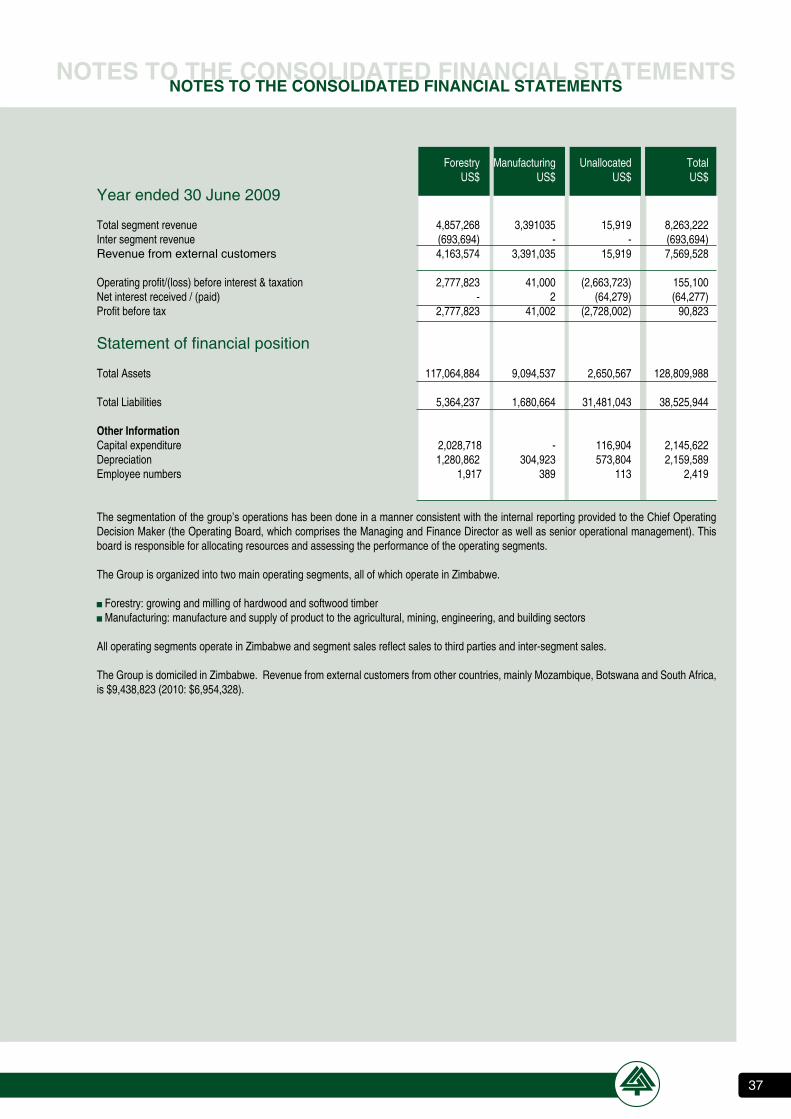
37
Forestry Manufacturing Unallocated Total US$ US$ US$ US$
Year ended 30 June 2009
Total segment revenue 4,857,268 3,391035 15,919 8,263,222Inter segment revenue (693,694) - - (693,694)Revenue from external customers 4,163,574 3,391,035 15,919 7,569,528 Operating profit/(loss) before interest & taxation 2,777,823 41,000 (2,663,723) 155,100Net interest received / (paid) - 2 (64,279) (64,277)Profit before tax 2,777,823 41,002 (2,728,002) 90,823
Statement of financial position Total Assets 117,064,884 9,094,537 2,650,567 128,809,988 Total Liabilities 5,364,237 1,680,664 31,481,043 38,525,944
Other Information Capital expenditure 2,028,718 - 116,904 2,145,622Depreciation 1,280,862 304,923 573,804 2,159,589Employee numbers 1,917 389 113 2,419
The segmentation of the group’s operations has been done in a manner consistent with the internal reporting provided to the Chief Operating Decision Maker (the Operating Board, which comprises the Managing and Finance Director as well as senior operational management). This board is responsible for allocating resources and assessing the performance of the operating segments.
The Group is organized into two main operating segments, all of which operate in Zimbabwe.
Forestry: growing and milling of hardwood and softwood timber Manufacturing: manufacture and supply of product to the agricultural, mining, engineering, and building sectors
All operating segments operate in Zimbabwe and segment sales reflect sales to third parties and inter-segment sales.
The Group is domiciled in Zimbabwe. Revenue from external customers from other countries, mainly Mozambique, Botswana and South Africa, is $9,438,823 (2010: $6,954,328).
Notes to tHe CoNsoliDAteD fiNANCiAl stAteMeNtsNotes to tHe CoNsoliDAteD fiNANCiAl stAteMeNts

B o R D e R T I M B e R S - A N N u A l R e p o R T - 2 0 1 138
Notes to tHe CoNsoliDAteD fiNANCiAl stAteMeNtsNotes to tHe CoNsoliDAteD fiNANCiAl stAteMeNts
6. PROPERTY, PLANT EQUIPMENT Land and Plant and Motor vehicles Furniture and Capital work-in buildings machinery and tractors fittings progress Total US$ US$ US$ US$ US$ US$At 1 July 2009 Deemed cost 35,879,135 7,745,780 4,022,084 134,077 998,436 48,779,512Accumulated depreciation - - - - - -Net book amount 35,879,135 7,745,780 4,022,084 134,077 998,436 48,779,512 Year ended 30 June 2010 Opening net book amount 35,879,135 7,745,780 4,022,084 134,077 998,436 48,779,512Additions 1,012 182,955 1,040,057 3,360 - 1,227,384 Disposals (3,996) - (60,880) - - (64,876)Transfers in / (out) 5,000 39,500 735,952 33,752 (814,204) -Revaluation surplus 1,111,862 944,485 1,120,012 2,747 - 3,179,106 Impairment charge (1,142,360) (2,100,020) (1,181,120) (28,745) - (4,452,245)Depreciation charge (790,261) (654,697) (464,244) (36,182) - (1,945,384)Closing net book amount 35,060,392 6,158,003 5,211,861 109,009 184,232 46,723,497
At 30 June 2010 Cost or valuation 35,850,653 6,812,700 5,676,105 145,191 184,232 48,668,881Accumulated depreciation (790,261) (654,697) (464,244) (36,182) - (1,945,384)Net book amount 35,060,392 6,158,003 5,211,861 109,009 184,232 46,723,497
Year ended 30 June 2011 Opening net book amount 35,060,392 6,158,003 5,211,861 109,009 184,232 46,723,497 Additions - 430,865 1,191,564 3,813 482,707 2,108,949 Disposals - - (8,024) - - (8,024)Transfers in /(out) - 64,765 500 - (65,265) -Impairment charge - (18,789) (174,533) - - (193,322)Depreciation charge (644,095) (666,267) (424,680) (28,820) - (1,763,862) Closing net book amount 34,416,297 5,968,576 5,796,688 84,002 601,675 46,867,238
At 30 June 2011 Cost or valuation 35,850,653 7,289,540 6,685,612 149,004 601,675 50,576,484Accumulated depreciation (1,434,356) (1,320,964) (888,924) (65,002) - (3,709,246)Net book amount 34,416,297 5,968,576 5,796,688 84,002 601,675 46,867,238
The Group’s property, plant and equipment were last valued on 30 June 2010 by independent valuers. For the year ended 30 June
2011, physical inspection of property, plant and equipment was carried out by the engineering department with the assistance of divisional management to assess the condition of property, plant and equipment. It is the belief of management that all assets given in the asset register have been carried at values greater than their recoverable amounts.
Depreciation expense of US$ 1,402,418 (2010: US$ 1,554,114) has been charged in ‘cost of sales ’ , US$ 361,444 (2010: US$391,270)
has been charged in ‘administrative expenses’. On the 29th of June 2011, a fire which started outside the perimeter wall at the Pole yard in Mutare and damaged the two pole
treatment autoclaves worth $193,322. One autoclave has since been repaired and was commissioned 19 days after the fire. The second autoclave is due for commissioning in December 2011. The assets damaged belong to the Manufacturing segment.
6.1 encumbered Assets There are no encumbered assets.

39
7. BIoLoGICAL Assets 2011 2010 2009 US$ US$ US$
At 1 July 82,828,342 74,372,359 79,034,288 Expenditure for the period 1,968,596 1,882,238 969,166 Fair value gain 10,973,007 8,936,592 3,534,878 95,769,945 85,191,189 83,538,332
Deduct: (5,337,691) (2,362,847) (9,165,973) Destroyed by fire / Cyclone (601,677) (68,459) (8,790,512) Felled timber (4,736,014) (2,294,388) (375,461) At 30 June 90,432,254 82,828,342 74,372,359
Comprising of standing 2011 2011 2010 2010 2009 2009
timber Hectares US$ Hectares US$ Hectares US$
Age 1- 6 years 6,804 1,740,159 6,579 1,776,386 5,861 1,025,588 7-12 years 4,675 9,847,427 4,665 10,206,516 5,045 5,861,278 13-18 years 6,952 39,452,620 6,422 38,337,821 5,429 30,709,078 19-24 years 3,043 26,028,032 2,402 21,176,072 2,585 25,211,227 25-30 years 401 4,616,101 378 4,686,031 491 6,784,953 Over 30 years 845 8,747,915 699 6,645,516 656 4,780,235 22,720 90,432,254 21,145 82,828,342 20,067 74,372,359
Valuation of plantations A director’s valuation was carried out at 30th June 2011 based on estimated fair values based on cost in the local and regional market. In
arriving at their estimates of fair values, the Directors have used market knowledge, professional judgement and historical data.
The growth in biological asset is linked to the mean annual increment (MAI) as determined by the Group’s forestry planning department. MAI is the incremental movement in volume due to growth.
To calculate the volume of standing timber at 30 June 2011, the directors have used mean annual increment, calculated by estate, compartment, species and age class. Where the biomass for young trees is negligible and cannot be easily quantified, the fair value of such trees is restricted to cost incurred in growing the trees. The volume of standing timber at 30 June 2011 amounts to 3,294,502 m3 (2010; 2,916,772 m3, 2009; 1,440,376 m3)
The table below presents the sensitivity on profit/(loss) before tax due to change in assumptions. The sensitivities presented are a favourable movement, if the sensitivity variables are unfavourable, the negative impact on profit would be of a similar magnitude:
effect of 5% increase in mean annual increment: Increase in volume (cubic meters) 164,725 Increase in profit before tax (US$) 4,521,613
The following assumptions were made in valuation of biological assets:
• Yield per estate, compartment, species and age class was computed based on current silviculture regime • Where biomass for young trees is negligible and cannot easily be quantifiable, input costs were used • Current recovery rates have been used to arrive at saleable output • Prices used for valuation are market linked • Yield volumes are dependent on species and age
Changes in any estimates could lead to recognition of significant fair value changes in the statement of comprehensive income.
Notes to tHe CoNsoliDAteD fiNANCiAl stAteMeNtsNotes to tHe CoNsoliDAteD fiNANCiAl stAteMeNts

B o R D e R T I M B e R S - A N N u A l R e p o R T - 2 0 1 140
2011 2010 2009 US$ US$ US$
8. INVeNtoRIes Raw materials 256,999 158,794 132,380 Work-in-progress 2,580,540 2,133,384 1,556,799 Finished goods 683,476 1,143,642 2,022,556 Consumables 1,059,545 898,223 492,253 4,580,560 4,334,043 4,203,988
The amount of write-down of inventories recognised as an expense is US$396,614 (2010: US$ 445 477, 2009; US$348,459).
9. FINANCIAL INstRUMeNts BY CAteGoRY Assetsperstatementoffinancialposition Loans and receivables Trade and other receivables (excluding prepayments) 3,601,423 1,877,540 1,190,591 Cash and cash equivalents 127,360 254,271 96,698 3,728,783 2,131,811 1,287,289 Liabilitiesperstatementoffinancialposition Other financial liabilities at armotised cost: Trade and other payables (excluding statutory liabilities) 2,535,481 2,228,314 2,384,413 Borrowings (excluding finance liabilities) 7,032,008 4,701,371 1,486,715 Finance lease liabilities 181,337 - - 9,748,826 6,929,685 3,871,128
10. tRADe AND otHeR ReCeIVABLes Trade receivables 2,827,093 1,500,943 988,522 Receivable from related parties (Note 19) 184,605 110,469 144,013 Prepayments 239,624 168,850 166,839 Other receivables 589,725 266,126 58,057 3,841,047 2,046,388 1,357,430 Trade receivables do not bear interest and are normally settled on 30 day terms for local sales and 90 days for export sales. Trade receivables are shown after deducting a provision for impairment of 147,249 145,607 62,284
Movement in the provision for impairment of trade receivables was as follows: At 1 July 145,607 62,284 - Charge to income statement 1,642 83,323 62,284 At 30 June 147,249 145,607 62,284
The analysis of net trade receivables is as follows:
Total Neither past due nor impaired Past due but not impaired 0-30 days 31-60 days 61-90 days >90 days US$ US$ US$ US$ US$ 30 June 2011 2,827,093 1,584,167 569,204 293,946 379,776 30 June 2010 1,500,943 626,064 603,529 144,098 127,252 30 June 2009 988,522 307,739 492,426 90,577 97,780
Notes to tHe CoNsoliDAteD fiNANCiAl stAteMeNtsNotes to tHe CoNsoliDAteD fiNANCiAl stAteMeNts

41
past due but not impaired These relate to a number of independent customers for whom there is no recent history of default.
past due but impaired The amount of the provision was US$ 147,249 (2010:$145,607). The individually impaired receivables mainly relate to customers facing liquidity challenges and amounts in dispute. A portion of the receivables is expected to be recovered.
The maximum exposure to credit risk at the reporting date is the carrying amount of each class of receivable mentioned above. The Group does not hold any collateral as security.
The carrying amounts of the Group’s trade and other receivables are denominated in the following currencies: 2011 2010 2009 US$ US$ US$
United States of America dollar 2,334,487 1,189,445 520,122 South African Rand 550,376 170,232 468,973 Botswana Pula 956,184 686,711 368,335 3,841,047 2,046,388 1,357,430
11. CAsH AND CAsH eQUIVALeNts
Cash and cash equivalents at the end of the period include deposits with banks of the Group and cash on hand
Cash at bank and on hand 127,360 254,271 96,698 Cash and cash equivalents include the following for the purpose of the statement of cash flows: Cash and cash equivalents 127,360 254,271 96,698 Bank overdrafts (Note 14) (2,240,330) (3,144,388) (11)
Cash and cash equivalents per statement of cash flows (2,112,970) (2,890,117) 96,687
12. sHARe CAPItAL ` Issued share capital 429,425 - -
Approval was granted by members at the Annual General meeting held on 26 November 2010 to redenominate the issued share capital valued at US$0.01 per share.
Number of Number of Number of Ordinary shares of US$ 0.01 each shares shares shares - authorized 43 000 000 43 000 000 43 000 000 - unissued (57 513) (57 513) (57 513)
Issued and fully paid 42 942 487 42 942 487 42 942 487 The unissued shares are under the control of the Directors who may issue them on such terms and conditions as they see fit subject to the limitation of the Companies Act (Chapter 24:03) and the Zimbabwe Stock Exchange Regulations. The period of this authority is unlimited.
13. NoN DIstRIBUtABLe ReseRVes 2011 2010 2009 US$ US$ US$ Balance at 1 July 90,885,152 90,885,152 113,364,035 Prior period error (note 4) - - (22,478,883) Redenomination on share capital (429,425) - -
Balance as at 30 June 90,455,727 90,885,152 90,885,152 The non-distributable reserve arose on restatement on change of functional currency.
Notes to tHe CoNsoliDAteD fiNANCiAl stAteMeNtsNotes to tHe CoNsoliDAteD fiNANCiAl stAteMeNts

B o R D e R T I M B e R S - A N N u A l R e p o R T - 2 0 1 142
2011 2010 2009 US$ US$ US$
14. BoRRoWINGs
Non-current Bank loans (a) 1,100,979 - -
Current Bank loans (a) 3,365,724 1,271,990 1,486,704 Bank overdrafts (b) 2,240,330 3,144,388 11 Finance lease (c) 181,337 - - Other loans (d) 324,975 284,993 - 6,112,366 4,701,371 1,486,715
Total borrowings 7,213,345 4,701,371 1,486,715
a) Bank loans are payable from July 2011 to May 2014 and bear average interest of 17% per annum. The loans are unsecured. b) Bank overdrafts are unsecured and bear average interest rate of 13% per annum. c) Finance lease liability is effectively secured as the rights to the leased asset revert to the lessor in the event of default. d) Other loans bear interest at 20% per annum and are unsecured.
Finance leases The Group leases mobile production equipment from Loinette Company Leasing Limited, based in Tortola, British Virgin Islands under the following terms and conditions: Lease period 12 months Lease cost 13.5% Rights to the leased asset pass on to the lessee upon fulfillment of the terms and conditions of the lease. Lease liabilities are effectively secured as the rights to the leased asset revert to the lessor in the event of default. Gross finance lease liability – minimum lease payments 2011 2010 2009 US$ US$ US$
Gross finance lease liability – minimum lease payments: Not later than 1 year 210,471 - - Later than 1 year and no later than 5 years - - - Later than 5 years - - - 210,471 - - Future finance charges on finance leases (29,134) - - 181,337 - - Present value of finance lease liabilities is as follows:
Not later than 1 year 181,337 - - Later than 1 year and no later than 5 years - - - Later than 5 years 181,337 -
Notes to tHe CoNsoliDAteD fiNANCiAl stAteMeNtsNotes to tHe CoNsoliDAteD fiNANCiAl stAteMeNts

43
Borrowings analysis:
Effective Maturity 2011 2010 2009 interest period US$ US$ US$ rate
Medium term bank loan 12% 3 years 1,100,979 - - Bank Loans - Stanbic 6% 150 days - 500,000 - MBCA 13% 180 days - 986,704 - FBC 18% 60 days 3,111,838 300,000 - - IDBZ 13% 180 days - 499,990 - - NMB 18% 60 days 253,886 206,000 - - NMB 25% 90 days - 200,000 - - KMB - 180 days - 66,000 - Shareholders loan 20% On demand 324,975 284,993 - Loinette Finance Lease 13% 360 days 181,337 - - Bank overdraft facilities - Stanbic 12% - 1,514,803 1,502,833 11 - FBC 15% - 725,527 1,641,555 -
Total borrowings 7,213,345 4,701,371 1,486,715
All facilities bear a fixed interest rate. The fair value of borrowings equals their carrying amounts, as the impact of discounting is not significant because the interest rates are fixed and the borrowings are short to medium term.
Borrowing costs The Articles of Association provide that the Group may from time to time, at the discretion of the Directors, borrow, raise or source
borrowings up to half the value of the shareholders equity as reflected in the Statement of Financial Position of the Annual Report. This limit may only be exceeded with the sanction of an ordinary resolution of the Company
2011 2010 2009
15. DeFeRReD INCoMe US$ US$ US$
Balance at 1 July - 646,918 486,716 Exchange rate adjustment - 56,918 - Received during the year - - 160,202 Transferred to income statement - (703,836) -
Balance at 30 June - - 646,918 Deferred income relates to income received from the European Union during 2009 and 2010. The European Union undertook to finance
the installation of a Steam Engine-powered generator set at Charter Sawmill. The total cost of the project was €818,301 of which €499,000 was the European Contribution.
The steam engine was commissioned during the last financial year. The condition of the grant was that funds should be used for the intended purpose. As the Steam Engine was commissioned, these funds were credited to profit and loss.
16. DeFeRReD INCoMe tAX
The analysis of deferred tax assets and deferred tax liabilities is as follows: Deferred tax assets - Deferred tax assets to be recovered after more than 12 months 796,359 679 234 - - Deferred tax assets to be recovered within 12 months 45,406 13 953 12 483 841,765 693 187 12 483 Deferred tax liabilities - Deferred tax liabilities to be recovered after more than 12 months 31,490,924 29 731 084 33 639 239 - Deferred tax liabilities to be recovered within 12 months 68,178 47 578 122 752 31,559,102 29 778 662 33 761 991
Deferred tax liability (net) 30,717,337 29 085 475 33 749 508
Notes to tHe CoNsoliDAteD fiNANCiAl stAteMeNtsNotes to tHe CoNsoliDAteD fiNANCiAl stAteMeNts
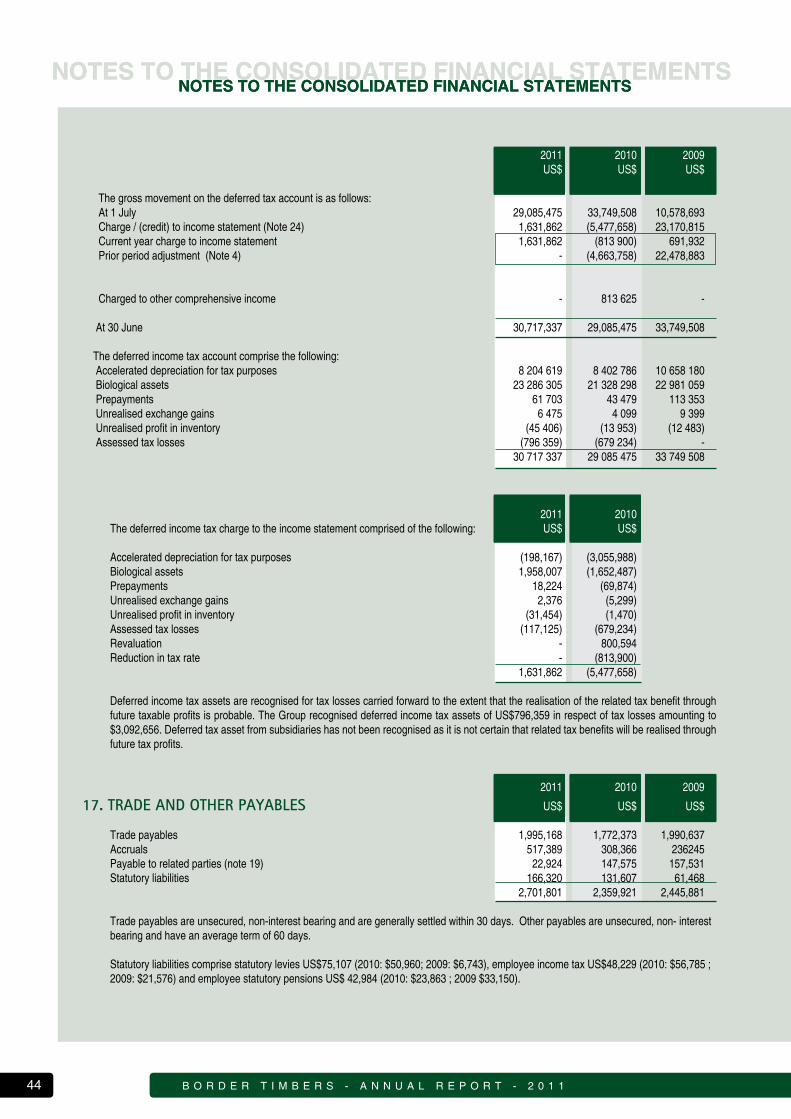
B o R D e R T I M B e R S - A N N u A l R e p o R T - 2 0 1 144
2011 2010 2009 US$ US$ US$
The gross movement on the deferred tax account is as follows: At 1 July 29,085,475 33,749,508 10,578,693 Charge / (credit) to income statement (Note 24) 1,631,862 (5,477,658) 23,170,815 Current year charge to income statement 1,631,862 (813 900) 691,932 Prior period adjustment (Note 4) - (4,663,758) 22,478,883
Charged to other comprehensive income - 813 625 - At 30 June 30,717,337 29,085,475 33,749,508 The deferred income tax account comprise the following: Accelerated depreciation for tax purposes 8 204 619 8 402 786 10 658 180 Biological assets 23 286 305 21 328 298 22 981 059 Prepayments 61 703 43 479 113 353 Unrealised exchange gains 6 475 4 099 9 399 Unrealised profit in inventory (45 406) (13 953) (12 483) Assessed tax losses (796 359) (679 234) - 30 717 337 29 085 475 33 749 508
2011 2010 The deferred income tax charge to the income statement comprised of the following: US$ US$ Accelerated depreciation for tax purposes (198,167) (3,055,988) Biological assets 1,958,007 (1,652,487) Prepayments 18,224 (69,874) Unrealised exchange gains 2,376 (5,299) Unrealised profit in inventory (31,454) (1,470) Assessed tax losses (117,125) (679,234) Revaluation - 800,594 Reduction in tax rate - (813,900) 1,631,862 (5,477,658)
Deferred income tax assets are recognised for tax losses carried forward to the extent that the realisation of the related tax benefit through future taxable profits is probable. The Group recognised deferred income tax assets of US$796,359 in respect of tax losses amounting to $3,092,656. Deferred tax asset from subsidiaries has not been recognised as it is not certain that related tax benefits will be realised through future tax profits.
2011 2010 2009
17. tRADe AND otHeR PAYABLes US$ US$ US$
Trade payables 1,995,168 1,772,373 1,990,637 Accruals 517,389 308,366 236245 Payable to related parties (note 19) 22,924 147,575 157,531 Statutory liabilities 166,320 131,607 61,468 2,701,801 2,359,921 2,445,881
Trade payables are unsecured, non-interest bearing and are generally settled within 30 days. Other payables are unsecured, non- interest bearing and have an average term of 60 days.
Statutory liabilities comprise statutory levies US$75,107 (2010: $50,960; 2009: $6,743), employee income tax US$48,229 (2010: $56,785 ; 2009: $21,576) and employee statutory pensions US$ 42,984 (2010: $23,863 ; 2009 $33,150).
Notes to tHe CoNsoliDAteD fiNANCiAl stAteMeNtsNotes to tHe CoNsoliDAteD fiNANCiAl stAteMeNts
Notes to tHe CoNsoliDAteD fiNANCiAl stAteMeNtsNotes to tHe CoNsoliDAteD fiNANCiAl stAteMeNts

45
18. PRoVIsIoNs 2011 2010 2009 US$ US$ US$ Analysis of provisions: At 1 July 156,348 196,922 - Additional provision 225,157 - 196,922 Amounts utilized (79,924) (40,574) - At 30 June 301,581 156,348 196,922 The provision consists of an annual bonus and a performance based bonus. Performance based bonus is paid as and when the monthly set
targets are met whilst the annual bonus is expected to be paid in December 2011
19. ReLAteD PARtY DIsCLosURes The Group’s parent is Radar Holdings Limited, and the ultimate parent is Saxonian Estate Limited. The Group trades with various fellow
subsidiary companies. These are conducted on an arm’s length basis. In addition, the Group participates in financial transactions involving the holding company and fellow subsidiaries. The consolidated financial statements include the financial statements of Border Timbers Limited and the following subsidiary companies.
Name Country of Incorporation Activities Percentage Equity Interest 2011 2010 Border Timbers International (Private) Limited Zimbabwe Manufacturing 100% 100% Hangani Development Company (Private) zimbabwe Dormant 100% 100%
2011 2010 a) Key management personnel remuneration and other compensation US$ US$ - Salaries and other short term employee benefits 265,793 141,724 - Pension contributions 8,824 5,935 274,617 147,659
Key management includes directors (executive and non-executive). b) Transactions Nature of Relationship i) Sales - Radar Investments (Private) Limited Fellow subsidiary - MacDonald Bricks (Division) 1,076,937 1,237,109 - United Builders Merchants (Division) - 15,075 ii) Purchases - Radar Investments (Private) Limited Fellow subsidiary - United Builders Merchants (Division) 295,715 56,430 iii) Management fees paid - Radar Investments (Private) Limited Fellow subsidiary 392,576 240,000 iv) Professional fees paid - Radar Investments (Private) Limited Fellow subsidiary - 11,770 v) Interest paid - Forrester Estates (Private Limited) Common shareholding 39,983 34,993
c) Year end balances
Receivables from related parties 2011 2010 2009 US$ US$ US$
- Radar Investments (Private) Limited Fellow subsidiary 24,715 - - - MacDonald Bricks (Division) 34,874 - 17,613 - United Builders Merchants (Division) 124,117 109,570 113,291 - Beit Bridge Juices (Private) Limited Common shareholding 899 899 13,095 - Radar Properties (Private) Limited Fellow subsidiary - - 14 184,605 110,469 144,013 Payables to related parties - Radar Investments (Private) Limited Fellow subsidiary - 85,734 108,757 - MacDonald Bricks (Division) 639 639 - - United Builders Merchants (Division) 22,285 42,634 18,799 - Makandi Tea and Coffee (Private) Limited Common shareholding - - 15,075 - Radar Holdings Limited Parent - 15,438 - - Rift Valley Holdings (Private) Limited Common shareholding - 3,130 14,900 22,924 147,575 157,531 d) Loans from related parties - Forrester Estates (Private) Limited Common shareholding 324,975 284,993 -
The sales to and purchases from related parties are based on the price list in force and terms that would be available to third parties. Outstanding balances at the year-end are unsecured, interest free (except for shareholders loan) and settlement occurs in cash. The shareholder’s loan carries an interest of 20% per annum and is available on demand. There have been no guarantees provided or received for any related party receivables or payables. For the year ended 30 June 2011, the Group has not recorded any impairment of receivables relating to amounts owed by related parties. This assessment is undertaken each financial year through examining the financial position of the related party and the market in which the related party operates.
Notes to tHe CoNsoliDAteD fiNANCiAl stAteMeNtsNotes to tHe CoNsoliDAteD fiNANCiAl stAteMeNts

B o R D e R T I M B e R S - A N N u A l R e p o R T - 2 0 1 146
20. otHeR oPeRAtING INCoMe – Net 2011 2010 US$ US$ Loss on disposal of property, plant & equipment (5,023) (64,882) Proceed from insurance claim 250,000 - Transfer from deferred income - 703,836 Exchange (losses) / gains (7,849) 156,833 Sundry income 127,933 121,239 365,061 917,026 Insurance proceeds are in respect of pole plant fire claim.
21. eXPeNses BY NAtURe
Raw material and consumables used 1,739,577 1,514,700 Depreciation charges (note 6) 1,763,862 1,945,384 Employee benefit expense (note 22) 6,101,836 5,404,962 Haulage 2,094,636 1,020,508 Repairs and maintenance - motor vehicles 3,243,774 2,230,302 Repairs and maintenance - plant/buildings 2,604,379 1,612,534 Sub contract services 875,301 398,820 Consultancy 598,344 209,579 Electricity 787,454 567,183 Auditors remuneration - current year audit services 64,000 - - prior year audit services 90,987 91,227 - current year non-audit services 7,047 7,268 Plantation damage/redemption (note 7) 5,337,691 2,362,846 Provision for doubtful debts (note 10) 1,642 83,323 Impairment : - impairment of property, plant and equipment (note 6) 193,322 4,452,245 - inventory (note 8) 396,614 445,477 Other expenses 1,544,065 1,156,298 27,444,531 23,502,656 Capitalisation of forestry costs (note 7) (1,968,596) (1,882,238) Total cost of sales, administrative and distribution and selling costs 25,475,935 21,620,418
22. eMPLoYee BeNeFIt eXPeNses
Wages and salaries 4,895,016 4,296,682 Pension fund contribution (note 26) 330,762 306,384 Social security costs (note 26) 256,971 222,692 Staff welfare costs 344,470 431,545 5,827,219 5,257,303 Directors remuneration: Salaries and other short term employee benefits 265,793 141,724 Pension contributions 8,824 5,935 6,101,836 5,404,962 Number of Number of Manning levels at 30 June employees employees
Permanent 1,404 1,395 Contract 1,608 1,135 Total 3,012 2,530
Notes to tHe CoNsoliDAteD fiNANCiAl stAteMeNtsNotes to tHe CoNsoliDAteD fiNANCiAl stAteMeNts

47
23. FINANCe INCoMe AND Costs 2011 2010 US$ US$ Finance costs Interest paid: -Bank loans 1,064,327 286,084 -Finance lease liability 28,727 - -Related party borrowings 39,983 34,993 1,133,038 321,077 Finance income - Interest income on short-term bank deposits 3,405 1,060
24. tAXAtIoN Deferred income tax charge/(credit) 1,631,862 (5,477,658) Tax Reconciliation: Profit before taxation 6,662,831 1,756,244 - Taxation at normal rate 1,715,679 452,233 - Non-deductible expenses (83,817) (304,973) - Adjustment to deferred tax liability resulting from change in tax rate - (5,624,918) Tax charge 1,631,862 (5,477,658)
The applicable corporate tax rate for Zimbabwean companies was reduced to 25.75% during 2010 from 30.9% in 2009. The change was enacted into law by the Zimbabwean Government in December 2009 and was therefore applicable for the year ended 30 June 2010.
25. eARNINGs PeR sHARe a) Basic Basic earnings per share is calculated by dividing the profit attributable to equity holders of the company by the weighted average number of ordinary shares in issue during the year. Profit attributable to equity holders (US$) 5,030,969 7,233,902 Weighted average number of ordinary shares 42,942,487 42,942,487
b) Diluted Diluted earnings per share is calculated after adjusting the weighted average number of ordinary shares outstanding to assume conver sion of all dilutive potential ordinary shares. The Company had no potentially dilutive ordinary shares (2010: nil).
Profit attributable to equity holders (US$) 5,030,969 7,233,902
Weighted average number of ordinary shares for diluted earnings per share 42,942,487 42,942,487
26. PeNsIoN FUNDs
26.1 The Radar Group pension Fund The fund is a defined contribution scheme and is not subject to actuarial valuation. Employer/employee contributions are 10% and 5% respectively.
26.2 National Social Security Authority Scheme (NSSA) This scheme was promulgated under the National Social Security Act (Chapter 17:04) of 1989. Employer/employee contributions under the scheme are limited to specific contributions as legislated from time to time and which at 30 June 2011 were 3% of pensionable emoluments.
Contributions recognized in the income statement: Radar Group pension fund 339,586 312,319 National social security fund 256,971 222,692 Staff welfare costs 596,557 535,011
Notes to tHe CoNsoliDAteD fiNANCiAl stAteMeNtsNotes to tHe CoNsoliDAteD fiNANCiAl stAteMeNts

B o R D e R T I M B e R S - A N N u A l R e p o R T - 2 0 1 148
27. FINANCIAL RIsK MANAGeMeNt, oBJeCtIVes AND PoLICIes
The Group’s principal financial liabilities comprise loans and borrowings, and trade and other payables. The main purpose of these financial liabilities is to finance the Group’s operations. The Group has trade and other receivables and cash and short term deposits that arise directly from its operations.
The Group is exposed to interest rate risks, foreign currency exposure, credit risk and liquidity risk. The Group’s senior management
oversees the management of these risks. The Group’s senior management is supported by the Board of directors that advises on financial risks and the appropriate financial risk governance framework for the Group. The Board of Directors meets regularly to analyse the Group’s risk-taking activities and ensure that they are governed by appropriate policies. The policies for each of these risks are summarized below.
Derivative Financial Instruments The Group, in its management of foreign currency, does not use derivative financial instruments, nor are any held for trading purposes.
Board Meetings The Board executive meets regularly to consider and to adopt effective strategies to manage the following risks: - exposure to exchange rate fluctuations; - borrowing facilities in the form of bank overdrafts and acceptance credits which are negotiated with approved and registered financial
institutions and third parties, at acceptable interest rates; - investment of surplus funds in the form of treasury bills, bank acceptances and money at call which are placed with approved registered
financial institutions and building societies at favourable rates on a short-term basis; - credit risk in the form of trade receivables that consist of a large customer base. However a sales agent who deals directly with many
individual customers, represents a major portion of the amount outstanding. - Specific provisions for doubtful debts are regularly adjusted. Where appropriate, credit guarantee insurance is purchased; - Insurance of group assets with the exception of plantations, which are not insured.
27.1 Interest Rate Risk Management The Group’s exposure to the risk of changes in market rates relates primarily to the Group’s short term debt obligations with a fixed interest
rate. Management monitors the Group’s debt and makes efforts to reduce the interest rate exposure.
At 30 June 2011, if the interest rate had been 3 percentage points higher with all other variables held constant, profit before tax would have been US$47,033 (2010:US$ 44,725) lower and current liabilities would have been US$47,033 (2010:US$ 44,725) higher due to the increased interest obligations. Similarly at 30 June 2011, if the interest rates had been 3 percentage points lower with all other variables held constant, profit before tax would have been US$47,033 (2010:US$ 44,725) higher and current liabilities would have been US$47,033 (2010:US$ 44,725) lower due to reduced interest obligations.
27.2 Foreign Currency exposure Management The Group has transactional currency exposures. Such exposure arises from the sales or purchases or borrowings by an operating unit in
currencies other than the Group’s functional currency. Management monitors exposure to exchange rate fluctuations on an ongoing basis.
With all other variables held constant, the Group’s profit before tax, current liabilities and current assets are affected through the impact of the fluctuating foreign exchange rates as follows: At 30 June 2011, if the foreign currency exchange rates had been 5% higher with a l l other variables held constant, profit before tax would have been US$30,883 higher (2010: US$ 26,173 lower), current liabilities would have been US$9,164 (2010: US$ 283) lower and current assets would have been US$21,719 higher (2010: US$ 26,456 lower). Similarly at 30 June 2011,if the foreign currency exchange rates had been 5% lower with all other variables held constant, profit before tax would have been US$29,728 lower (2010: US$26,173 higher), current liabilities would have been US$9,804 (2010: US$283) higher and current assets would have been US$19,924 lower (2010: US$26,456 higher).
Notes to tHe CoNsoliDAteD fiNANCiAl stAteMeNtsNotes to tHe CoNsoliDAteD fiNANCiAl stAteMeNts

49
Notes to tHe CoNsoliDAteD fiNANCiAl stAteMeNtsNotes to tHe CoNsoliDAteD fiNANCiAl stAteMeNts
27.3 Credit Risk Management Credit risk arises from credit exposures to customers, including outstanding receivables and committed transactions as well as cash and cash
equivalents.
Trade receivables The Group trades only with recognised creditworthy third parties. It is the Group’s policy that all customers who wish to trade on credit terms
are subject to credit verification procedures. In addition, receivable balances are monitored on an ongoing basis with the result that the Group’s exposure to impairment is not significant. The maximum exposure is the carrying amount of trade receivables.
Customer credit risk is managed by each business unit subject to the Group’s established policy, procedures and control relating to customer credit risk management. Credit limits are established for all customers based on internal rating criteria. Credit quality of the customer is assessed based on an extensive credit rating scorecard. Outstanding customer receivables are regularly monitored and any shipments to major customers are generally covered by letters of credit or other form of credit insurance. The maximum exposure to credit risk at the reporting date is the carrying value of each class of financial assets. The Group does not hold collateral as security.
Cash and cash equivalents The Group’s exposure to credit risk arises from default of the counterparty, with a maximum exposure equal to the carrying amount of the
instrument. Reputable financial institutions are used for investing and cash handling purposes.
27.4 liquidity Risk Management The Group monitors its risk to a shortage of funds using a recurring liquidity planning tool. This tool considers the maturity of both its financial
investments and financial assets (e.g. accounts receivables, other financial assets) and projected cash flows from operations. The Group’s objective is to maintain a balance between continuity of funding and flexibility through the use of bank overdrafts and bank loans.
The table below summarizes the maturity profile of the Group’s financial liabilities at 30 June 2011
27.5 Capital Management The primary objective of the Group’s capital management is to ensure that it maintains a strong credit rating and healthy capital ratios
in order to support its business and maximize shareholder value.
The Group manages its capital structure and makes adjustments to it, in light of changes in economic conditions. To maintain or adjust the capital structure, the Group may adjust the dividend payment to shareholders, return capital to shareholders or issue new shares. No changes were made in the objectives, policies or processes during the year ended 30 June 2011.
The Group monitors its capital ratio using a gearing ratio which is net debt divided by total capital plus net debt.The Group includes within its net debts, interest bearing loans and borrowings, trade and other payables, less cash and cash equivalents, excluding discontinued operations; capital includes equity attributable to the equity holders of the parent.
The gearing ratios at 30 June were as follows: 2011 2010 2009 US$ US$ US$
Interest bearing loans and borrowings 7,213,345 4,701,371 1,486,715 Less cash and short term deposits 127,360 254,271 96,698 Net debt 7,085,985 4,447,100 1,390,017 Equity 104,914,395 99,883,426 90,284,043 Gearing ratio 6% 4% 2%
The Group’s strategy is to maintain the gearing ratio below 50%.

B o R D e R T I M B e R S - A N N u A l R e p o R T - 2 0 1 150
Notes to tHe CoNsoliDAteD fiNANCiAl stAteMeNtsNotes to tHe CoNsoliDAteD fiNANCiAl stAteMeNts
27.6 Financial Risk Management – (Agricultural Activities)
As a leading member of the Timber Producers Federation (TPF), the Group complies with the TPF Fire Policy, and actively participates in TPF District Fire Committees. District Fire Committees include Traditional Leaders and Local Authorities, Zimbabwe Republic Police (ZRP), Environmental Management Agency (EMA), Forestry Commission and landowners within each District.
The risk to the company’s plantation area from uncontrolled fires is increased because of the presence of illegal settlers on four of the com pany’s five estates. Each estate annually produces a Fire Plan identifying risk levels for each compartment and responses to miti-gate such risk as far as is practical, and identifying fire-control teams, equipment and infrastructure, fire responses and callout procedures. Fire- awareness campaigns are carried out in conjunction with the District Fire Committees. Areas areselected for pre-season fuel-reduction burns. Teams are trained at Basic, Fire-fighter and Fire Boss level and refresher drill are carried out weekly during the Fire Season. All estates are covered day and night throughout the year by manned Fire Towers and a radio network. Standby teams including specialised, dedicated Fire Tenders are on duty at all times during the Fire Season and procedures are in place to rapidly augment first-call teams with local back-up, then with additional units from other estates, should the need arise.
All major fires are investigated with a view to improving response and effectiveness. Fires of unknown origin or resulting from illegal activities are reported to ZRP.
Over and above the fire risks, the group is exposed to financial risks arising from climatic changes, disease and other natural risks such as flooding and storms and human-induced losses arising from strikes, civil commotion and malicious damage. Management is in constant liason with the community and local authorities in an effort to manage the exposure.
28. FAIR VALUe oF FINANCIAL INstRUMeNts The estimated fair values of all financial instruments approximate to the carrying amounts shown in the statement of financial position dueto
the short term nature of these instruments. Receivables were tested for impairment and adjusted for accordingly. The fair value of the financial assets and liabilities are included at the amounts at which the instruments could be exchanged in a current
transaction of willing parties, other than a forced or liquidation sale.
29. Asset INsURANCe
Assets are insured on a reinstatement basis. The sums insured are subject to regular review by the Group and its brokers. Plantations are not insured as cover is not available.
30. CAsH FLoW INFoRMAtIoN 2011 2010 US$ US$ 30.1 Non cash items and other adjustments - Depreciation (note 6) 1,763,862 1,945,384 - Fair value gain on biological assets (note 7) (10,973,007) (8,936,592) - Plantation redemption (note 7) 5,337,691 2,362,845 - Loss on disposal of property, plant & equipment 5,023 64,882 - Grant income (note 15) - (646,918) - Impairment loss (note 21) 193,322 4,452,245 (3,673,109) (758,154) 30.2 Movement in working capital - Inventories (246,519) (130,056) - Receivables (1,720,525) (722,502) - Trade and other payables 611,766 (116,580) - Related party balances (198,786) 23,589 (1,554,063) (945,549)
31. LAND DesIGNAtIoN
During previous financial years, the Zimbabwe Government de-listed all land previously listed for compulsory acquisition. In 2005 the Constitution of Zimbabwe Amendment (No17) was enacted into Zimbabwe law by the Parliament of Zimbabwe to confirm acquisition of land for resettlement purposes which took place pursuant of the Land Reform Program beginning 2000 and to provide for the acquisition in future of agricultural land for resettlement and other purposes.
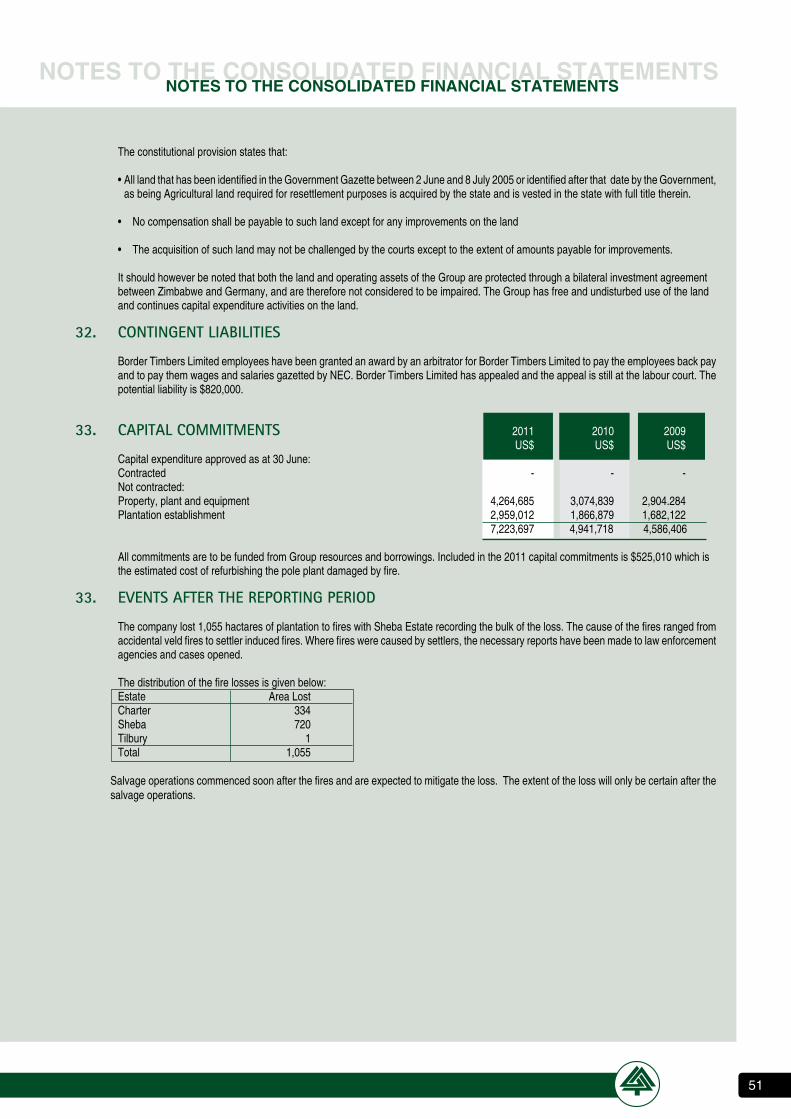
51
Notes to tHe CoNsoliDAteD fiNANCiAl stAteMeNtsNotes to tHe CoNsoliDAteD fiNANCiAl stAteMeNts
The constitutional provision states that:
• All land that has been identified in the Government Gazette between 2 June and 8 July 2005 or identified after that date by the Government, as being Agricultural land required for resettlement purposes is acquired by the state and is vested in the state with full title therein.
• No compensation shall be payable to such land except for any improvements on the land
• The acquisition of such land may not be challenged by the courts except to the extent of amounts payable for improvements.
It should however be noted that both the land and operating assets of the Group are protected through a bilateral investment agree ment between Zimbabwe and Germany, and are therefore not considered to be impaired. The Group has free and undisturbed use of the land and continues capital expenditure activities on the land.
32. CoNtINGeNt LIABILItIes
Border Timbers Limited employees have been granted an award by an arbitrator for Border Timbers Limited to pay the employees back pay and to pay them wages and salaries gazetted by NEC. Border Timbers Limited has appealed and the appeal is still at the labour court. The potential liability is $820,000.
33. CAPItAL CoMMItMeNts 2011 2010 2009 US$ US$ US$ Capital expenditure approved as at 30 June: Contracted - - - Not contracted: Property, plant and equipment 4,264,685 3,074,839 2,904.284 Plantation establishment 2,959,012 1,866,879 1,682,122 7,223,697 4,941,718 4,586,406 All commitments are to be funded from Group resources and borrowings. Included in the 2011 capital commitments is $525,010 which is
the estimated cost of refurbishing the pole plant damaged by fire.
33. eVeNts AFteR tHe RePoRtING PeRIoD
The company lost 1,055 hactares of plantation to fires with Sheba Estate recording the bulk of the loss. The cause of the fires ranged from accidental veld fires to settler induced fires. Where fires were caused by settlers, the necessary reports have been made to law enforcement agencies and cases opened.
The distribution of the fire losses is given below: Estate Area Lost Charter 334 Sheba 720 Tilbury 1 Total 1,055
Salvage operations commenced soon after the fires and are expected to mitigate the loss. The extent of the loss will only be certain after the salvage operations.

B o R D e R T I M B e R S - A N N u A l R e p o R T - 2 0 1 152
CoMpANy stAteMeNt of fiNANCiAl positioNCoMpANy stAteMeNt of fiNANCiAl positioN
Restated Restated Notes 2011 2010 2009
Assets US$ US$ US$
Non-current assets Property, plant and equipment 2 46,867,238 46,723,497 48,779,512 Biological assets 3 90,432,254 82,828,342 74,372,359 137,299,492 129,551,839 123,151,871
Current assets Inventories 4 3,800,460 3,763,572 3,800,024Trade and other receivables 6 5,496,828 3,169,844 1,671,177Cash and bank 7 71,260 238,917 88,869 9,368,548 7,172,333 5,560,070
totAL Assets 146,668,040 136,724,172 128,711,941
eQUItY AND LIABILItIes
equity Share capital 8 429,425 - -Non distributable reserves 9 90,455,727 90 885 152 90 885 152 Revaluation reserve 2 365 481 2 365 481 - Retained earnings / (accumulated loss) 12 635 098 7 268 354 (661 112)
Total equity 105,885,731 100,518,987 90,224,040
LIABILItIes
Non – current liabilities Borrowings 10 1,100,979 - -Deferred income 11 - - 646,918Deferred income tax liability 12 30,762,745 29,099,427 33,761,991 31,863,724 29,099,427 34,408,909
Current liabilities Trade and other payables 13 2,538,186 2,271,005 2,407,210Provisions 14 268,033 133,594 185,067Borrowings 10 6,112,366 4,701,158 1,486,715 8,918,585 7,105,757 4,078,992
totAL eQUItY AND LIABILItIes 146,668,040 136,724,172 128,711,941
KRR SCHOFIELD P. NYEMBACHAIRMAN OF THE BOARD FINANCE DIRECTOR 31 OCTOBER 2011

53
CoMpANy iNCoMe stAteMeNtCoMpANy iNCoMe stAteMeNt
Restated Notes 2011 2010 US$ US$
ReVeNue 21,006,256 13,423,750Cost of sales 17 (18,394,038) (11,611,338)
GRoSS pRoFIT 2,612,218 1,812,412Fair value gains on biological assets 3 10,973,007 8,936,592Other operating income-net 16 358,737 906,357Distribution and selling expenses 17 (1,578,993) (1,184,255)Administration expenses 17 (4,136,581) (7,697,633)
oPeRAtING PRoFIt BeFoRe INteRest AND tAXAtIoN 8,025,096 2,773,473 Finance income 19 99,798 859Finance costs 19 (1,094,834) (321,054)
PRoFIt BeFoRe tAXAtIoN 7,030,060 2,453,278 Income tax (expense)/credit 20 (1,663,316) 5,476,188
PRoFIt FoR tHe YeAR 5,366,744 7,929,466
CoMPANY stAteMeNt oF CoMPReHeNsIVe INCoMe
Profit for the year 5,366,744 7,929,466
other comprehensive income: Revaluation of property, plant and equipment - 3,179,106Income tax effect - (813,625)
Total other comprehensive income for the year, net of tax - 2,365,481
Total comprehensive income for the year, net of tax 5,366,744 10,294,947

B o R D e R T I M B e R S - A N N u A l R e p o R T - 2 0 1 154
CoMpANy stAteMeNt of CHANGes iN equityCoMpANy stAteMeNt of CHANGes iN equity
Share Non Revaluation Retained Total capital distributable reserves earnings / equity reserves (accumulated losses) US$ US$ US$ US$ US$
Balance at 1 July 2009 as previously reported - 113,364,035 - (661,112) 112,702,923
Prior period adjustment (Note 1) - (22,478,883) - (22,478,883) Balance as at 30 June 2009 restated - 90,885,152 - (661,112) 90,224,040
Comprehensive income:Profit for the year restated - - - 7,929,466 7,929,466
Other comprehensive income:Gain on revaluation of property, plant and equipment, net of tax - - 2,365,481 - 2,365,481
Balance as at 30 June 2010 restated - 90,885,152 2,365,481 7,268,354 100,518,987
Comprehensive income:Profit for the year - - - 5,366,744 5,366,744Transactions with owners:Re-denomination of shares 429,425 (429,425) - - -
Balance as at 30 June 2011 429,425 90,455,727 2,365,481 12,635,098 105,885,731
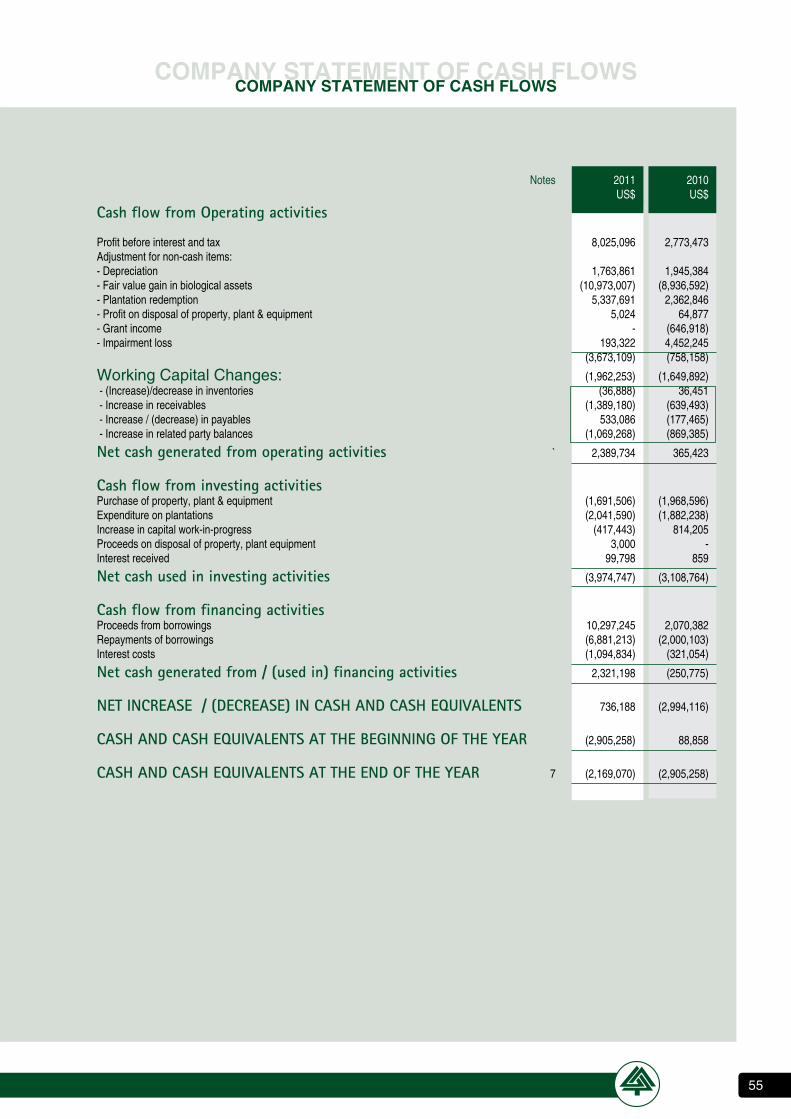
55
CoMpANy stAteMeNt of CAsH floWsCoMpANy stAteMeNt of CAsH floWs
Notes 2011 2010 US$ US$
Cash flow from operating activities Profit before interest and tax 8,025,096 2,773,473 Adjustment for non-cash items: - Depreciation 1,763,861 1,945,384- Fair value gain in biological assets (10,973,007) (8,936,592)- Plantation redemption 5,337,691 2,362,846- Profit on disposal of property, plant & equipment 5,024 64,877- Grant income - (646,918)- Impairment loss 193,322 4,452,245 (3,673,109) (758,158)
Working Capital Changes: (1,962,253) (1,649,892) - (Increase)/decrease in inventories (36,888) 36,451 - Increase in receivables (1,389,180) (639,493) - Increase / (decrease) in payables 533,086 (177,465) - Increase in related party balances (1,069,268) (869,385)
Net cash generated from operating activities ` 2,389,734 365,423
Cash flow from investing activitiesPurchase of property, plant & equipment (1,691,506) (1,968,596) Expenditure on plantations (2,041,590) (1,882,238)Increase in capital work-in-progress (417,443) 814,205Proceeds on disposal of property, plant equipment 3,000 -Interest received 99,798 859
Net cash used in investing activities (3,974,747) (3,108,764)
Cash flow from financing activities Proceeds from borrowings 10,297,245 2,070,382Repayments of borrowings (6,881,213) (2,000,103)Interest costs (1,094,834) (321,054)
Net cash generated from / (used in) financing activities 2,321,198 (250,775)
Net INCReAse / (DeCReAse) IN CAsH AND CAsH eQUIVALeNts 736,188 (2,994,116)
CAsH AND CAsH eQUIVALeNts At tHe BeGINNING oF tHe YeAR (2,905,258) 88,858
CAsH AND CAsH eQUIVALeNts At tHe eND oF tHe YeAR 7 (2,169,070) (2,905,258)

B o R D e R T I M B e R S - A N N u A l R e p o R T - 2 0 1 156
Notes to tHe CoMpANy fiNANCiAl stAteMeNtsNotes to tHe CoMpANy fiNANCiAl stAteMeNts
1. CoRReCTIoN oF pRIoR peRIoD eRRoRS
During the financial year, the Group identified errors in the opening balances of deferred income tax liabilities. Deferred tax was not provided on the deemed cost of biological assets and land, roads and bridges as at 1 July 2009; and assessable tax losses for the year ending 30 June 2010. The errors were identified during the current financial year and in accordance with IAS 8: Accounting Policies, Changes in Accounting Estimates and Errors, the deferred tax has been corrected retrospectively and certain comparative figures have been restated.
The effect of the restatement on the 2010 and 2009 financial statements is shown below:
Deferred tax Non Retained liability distributable earnings reserve US$ US$ US$ 2011 2010 2009
Financial position
Balance at 1 July 2009 (as previously reported) 11,283,108 113,364,035 - Correction of error 22,478,883 (22,478,883) - Balance at 1 July 2009 (restated) 33,761,991 90,885,152 -
Balance at 30 June 2010 (as previously reported) 11,284,302 113,364,036 2,604,596 Correction of error – 2009 22,478,883 (22,478,883) - 2010 (4,663,758) - 4,663,758 Balance at 30 June 2010 (restated) 29,099,427 90,885,152 7,268,354
2010
Comprehensive income US$
Profit after tax (as previously reported) 3,265,708 Correction of error in tax credit 4,663,758 Profit after tax (restated) 7,929,466
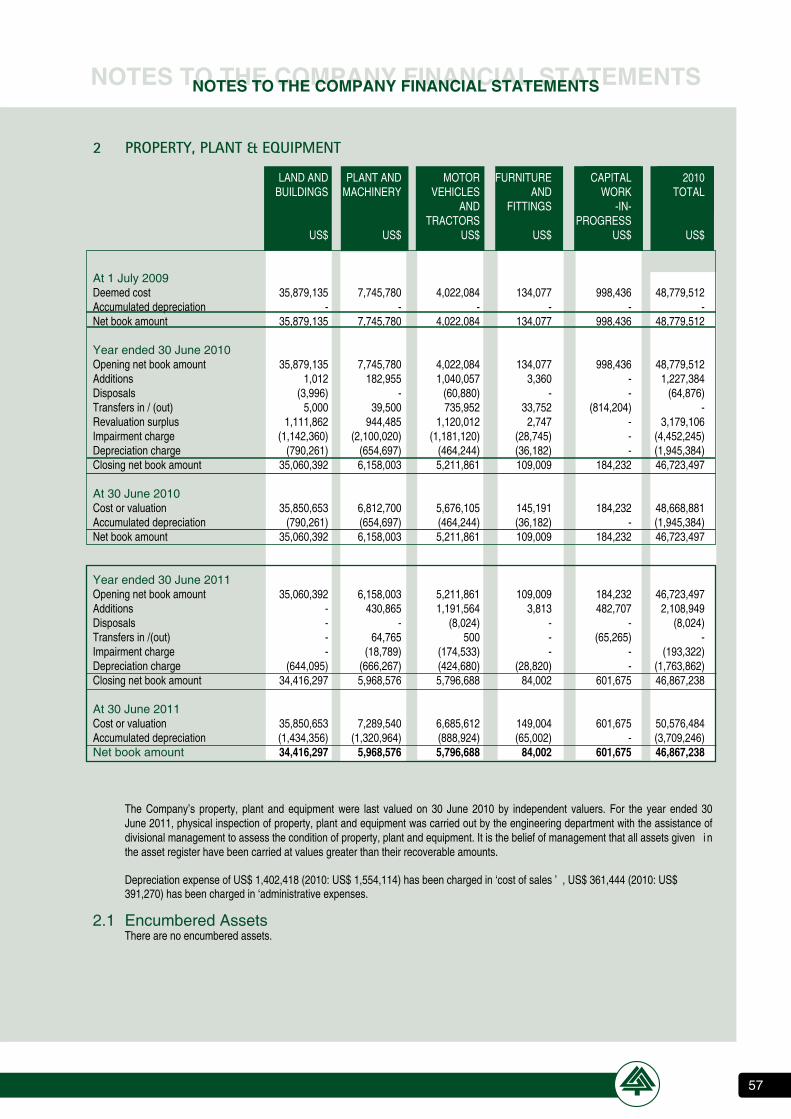
57
Notes to tHe CoMpANy fiNANCiAl stAteMeNtsNotes to tHe CoMpANy fiNANCiAl stAteMeNts
2 PRoPeRtY, PLANt & eQUIPMeNt
LAND AND PLANT AND MOTOR FURNITURE CAPITAL 2010 BUILDINGS MACHINERY VEHICLES AND WORK TOTAL AND FITTINGS -IN- TRACTORS PROGRESS US$ US$ US$ US$ US$ US$
At 1 July 2009 Deemed cost 35,879,135 7,745,780 4,022,084 134,077 998,436 48,779,512Accumulated depreciation - - - - - -Net book amount 35,879,135 7,745,780 4,022,084 134,077 998,436 48,779,512 Year ended 30 June 2010 Opening net book amount 35,879,135 7,745,780 4,022,084 134,077 998,436 48,779,512Additions 1,012 182,955 1,040,057 3,360 - 1,227,384 Disposals (3,996) - (60,880) - - (64,876)Transfers in / (out) 5,000 39,500 735,952 33,752 (814,204) -Revaluation surplus 1,111,862 944,485 1,120,012 2,747 - 3,179,106 Impairment charge (1,142,360) (2,100,020) (1,181,120) (28,745) - (4,452,245)Depreciation charge (790,261) (654,697) (464,244) (36,182) - (1,945,384)Closing net book amount 35,060,392 6,158,003 5,211,861 109,009 184,232 46,723,497
At 30 June 2010 Cost or valuation 35,850,653 6,812,700 5,676,105 145,191 184,232 48,668,881Accumulated depreciation (790,261) (654,697) (464,244) (36,182) - (1,945,384)Net book amount 35,060,392 6,158,003 5,211,861 109,009 184,232 46,723,497
Year ended 30 June 2011 Opening net book amount 35,060,392 6,158,003 5,211,861 109,009 184,232 46,723,497 Additions - 430,865 1,191,564 3,813 482,707 2,108,949 Disposals - - (8,024) - - (8,024)Transfers in /(out) - 64,765 500 - (65,265) -Impairment charge - (18,789) (174,533) - - (193,322)Depreciation charge (644,095) (666,267) (424,680) (28,820) - (1,763,862) Closing net book amount 34,416,297 5,968,576 5,796,688 84,002 601,675 46,867,238
At 30 June 2011 Cost or valuation 35,850,653 7,289,540 6,685,612 149,004 601,675 50,576,484Accumulated depreciation (1,434,356) (1,320,964) (888,924) (65,002) - (3,709,246)Net book amount 34,416,297 5,968,576 5,796,688 84,002 601,675 46,867,238
The Company’s property, plant and equipment were last valued on 30 June 2010 by independent valuers. For the year ended 30 June 2011, physical inspection of property, plant and equipment was carried out by the engineering department with the assistance of divisional management to assess the condition of property, plant and equipment. It is the belief of management that all assets given i n the asset register have been carried at values greater than their recoverable amounts.
Depreciation expense of US$ 1,402,418 (2010: US$ 1,554,114) has been charged in ‘cost of sales ’ , US$ 361,444 (2010: US$ 391,270) has been charged in ‘administrative expenses. 2.1 encumbered Assets There are no encumbered assets.

B o R D e R T I M B e R S - A N N u A l R e p o R T - 2 0 1 158
Notes to tHe CoMpANy fiNANCiAl stAteMeNtsNotes to tHe CoMpANy fiNANCiAl stAteMeNts
3. BIoLoGICAL Assets 2011 2010 2009 US$ US$ US$ At 1 July 82,828,342 74,372,359 79,034,288 Expenditure for the period 1,968,596 1,882,238 969,166 Fair value gain 10,973,007 8,936,592 3,534,878 95,769,945 85,191,189 83,538,332 Deduct: Destroyed by fire / Cyclone (601,677) (68,459) (8,790,512) Felled timber (4,736,014) (2,294,388) (375,461) At 30 June 90,432,254 82,828,342 74,372,359 Comprising of standing timber 2011 2011 2010 2010 2009 2009
Age Hectares US$ Hectares US$ Hectares US$
1- 6 years 6,804 1,740,159 6,579 1,776,386 5,861 1,025,588
7-12 years 4,675 9,847,427 4,665 10,206,516 5,045 5,861,278
13-18 years 6,952 39,452,620 6,422 38,337,821 5,429 30,709,078
19-24 years 3,043 26,028,032 2,402 21,176,072 2,585 25,211,227
25-30 years 401 4,616,101 378 4,686,031 491 6,784,953 Over 30 years 844 8,747,916 699 6,645,516 656 4,780,235
22,720 90,432,254 21,145 82,828,342 20,067 74,372,359
Valuation of plantations A director’s valuation was carried out at 30th June 2011 based on estimated fair values based on cost in the local and regional market. In arriving at their estimates of fair values, the Directors have used market knowledge, professional judgement and historical data.
The growth in biological asset is linked to the mean annual increment (MAI) as determined by the Company’s forestry planning depart ment. MAI is the incremental movement in volume due to growth.
To calculate the volume of standing timber at 30 June 2011, the directors have used mean annual increment, calculated by estate, compartment, species and age class. Where the biomass for young trees is negligible and cannot be easily quantified, the fair value of such trees is restricted to cost incurred in growing the trees. The volume of standing timber at 30 June 2011 amounts to 3,294,502 m3 (2010; 2,916,772 m3, 2009; 1,440,376 m3)
The table below presents the sensitivity on profit/(loss) before tax due to change in assumptions. The sensitivities presented are a favourable movement, if the sensitivity variables are unfavourable, the negative impact on profit would be of a similar magnitude:
Effect of 5% increase in mean annual increment: Increase in volume (cubic meters) 164,725 Increase in profit before tax (US$) 4,521,613

59
• Yield per estate, compartment, species and age class was computed based on current silviculture regime • Where biomass for young trees is negligible and cannot easily be quantifiable, input costs were used • Current recovery rates have been used to arrive at saleable output • Prices used for valuation are market linked • Yield volumes are dependent on species and age
Changes in any estimates could lead to recognition of significant fair value changes in the statement of comprehensive income.
2011 2010 2009
4. INVeNtoRIes US$ US$ US$
Work-in-progress 2,246,369 2,073,727 1,419,994 Finished goods 632,862 931,533 1,887,778 Consumable 992,229 758,312 492,252 3,800,460 3,763,572 3,800,024
The amount of write-down of inventories recognised as an expense is US$396,614 (2010: US$ 445 477, 2009; 348,459).
5. FINANCIAL INstRUMeNts BY CAteGoRY
Assets per statement of financial position loans and receivables Trade and other receivables (excluding prepayments) 5,257,207 3,000,995 1,304,340 Cash and cash equivalents 71,260 238,917 88,869 Liabilities per statement of financial position 5,328,467 3,239,912 1,393,209
Other financial liabilities at armotised cost Trade and other payables excluding (statutory liabilities) 2,371,865 2,139,398 2,448,688 Borrowings (excluding finance liabilities) 7,032,008 4,701,371 1,486,715 Finance lease liabilities 181,337 - - 9,585,210 6,840,769 3,935,403
6. tRADe AND otHeR ReCeIVABLes
Trade receivables 2,211,084 1,327,562 785,970 Receivable from related parties (Note 15) 2,604,303 1,666,500 807,328 Prepayments 239,624 168,850 25,437 Other receivables 441,817 6,932 52,442 5,496,828 3,169,844 1,671,177 Trade and other receivables do not bear interest and are normally settled on 30 day terms for local sales and 90 days for export sales. Trade receivables are sh own after deducting a provision for impairment of 120,436 120,794 62,284
Movement in the provision for impairment of trade receivables was as follows: At 1 July 120,794 62,284 - Charge to income statement (358) 58,510 62,284 At 30 June 120,436 120,794 62,284
Notes to tHe CoMpANy fiNANCiAl stAteMeNtsNotes to tHe CoMpANy fiNANCiAl stAteMeNts

B o R D e R T I M B e R S - A N N u A l R e p o R T - 2 0 1 160
Notes to tHe CoMpANy fiNANCiAl stAteMeNtsNotes to tHe CoMpANy fiNANCiAl stAteMeNts
past due but not impaired These relate to a number of independent customers for whom there is no recent history of default.
past due but impaired The amount of the provision was US$ 120,436 (2010:$120,794). The individually impaired receivables mainly relate to customers
facing liquidity challenges and amounts in dispute. A portion of the receivables is expected to be recovered.
The maximum exposure to credit risk at the reporting date is the carrying amount of each class of receivable mentioned above. The Group does not hold any collateral as security.
The carrying amounts of the Group’s trade and other receivables are denominated in the following currencies: 2011 2010 2009 US$ US$ US$ United States of America dollar 4,382,539 2,599,206 1,023,789 South African Rand 356,994 72,580 327,237 Botswana Pula 757,295 498,058 320,151 5,496,828 3,169,844 1,671,177
7. CAsH AND CAsH eQUIVALeNts
Cash and cash equivalents at the end of the period include deposits with banks and cash on hand Cash at bank and on hand 71,260 238,917 88,869
Cash and cash equivalents include the following for the purposes of statement of cash flows: Cash at bank and on hand 71,260 238,917 88,869 Bank overdrafts (Note 10) (2,240,330) (3,144,175) (11)
Cash and cash equivalents (2,169,070) (2,905,258) 88,858
8. sHARe CAPItAL Issued share capital 429,425 - -
Approval was granted by members at the Annual General meeting held on 26 November 2010 to redenominate the issued share capital valued at US$0.01 per share.
The analysis of net trade receivables is as follows:
Total Neither past Past due but not impaired due nor impaired 0-30 days 31-60 days 61-90 days >90 days US$ US$ US$ US$ US$ 30 June 2011 2,211,084 1,123,394 531,490 202,543 353,657 30 June 2010 1,327,562 698,195 431,702 82,015 115,650 30 June 2009 785,970 183,955 299,366 169,391 133,258

61
Notes to tHe CoMpANy fiNANCiAl stAteMeNtsNotes to tHe CoMpANy fiNANCiAl stAteMeNts
Number of Number of Number of Shares Shares Shares Ordinary shares of US$ 0.01 each - authorized 43 000 000 43 000 000 43 000 000 - unissued (57 513) (57 513) (57 513) Issued and fully paid 42 942 487 42 942 487 42 942 487 The unissued shares are under the control of the Directors who may issue them on such terms and conditions as they see fit subject
to the limitation of the Companies Act (Chapter 24:03) and the Zimbabwe Stock Exchange Regulations.The period of this authority is unlimited.
9. NoN DIstRIBUtABLe ReseRVes 2011 2010 2009 US$ US$ US$
Balance at 1 July 90,885,152 90,885,152 113,364,035 Prior period error (note 1) - - (22,478,883) Redenomination on share capital (429,425) - - Balance at 30 June 90,455,727 90,885,152 90,885,152 The non-distributable reserve arose on restatement on change of functional currency.
10. BoRRoWINGs
Non-Current Bank loans (a) 1,100,979 - -
Current Bank loans (a) 3,365,723 1,271,990 1,486,704 Bank overdrafts (b) 2,240,331 3,144,175 11 Finance lease (c) 181,337 - - Other loans (d) 324,975 284,993 - 6,112,366 4,701,158 1,486,715
Total borrowings 7,213,345 4,701,158 1,486,715
a) Bank loans are payable from July 2011 to May 2014 and bear average interest of 17% per annum. The loans are unsecured. b) Bank overdrafts are unsecured and bear average interest rate of 13% per annum. c) Finance lease liability is effectively secured as the rights to the leased asset revert to the lessor in the event of default. d) Other loans bear interest at 20% per annum and are unsecured. Finance Leases The Group leases mobile production equipment from Loinette Company Leasing Limited, based in Tortola, British Virgin Islands under
the following terms and conditions: Lease period 12 months Lease cost 13.5% Rights to the leased asset pass on to the lessee upon fulfillment of the terms and conditions of the lease. Lease liabilities are effectively
secured as the rights to the leased asset revert to the lessor in the event of default.
Gross finance lease liability – minimum lease payments 2011 2010 2009 US$ US$ US$ Gross finance lease liability – minimum lease payments: Not later than 1 year 210,471 - - Later than 1 year and no later than 5 years - - - Later than 5 years - - - 210,471 - - Future finance charges on finance leases (29,134) - - 181,337 - - Present value of finance lease liabilities is as follows: Not later than 1 year 181,337 - - Later than 1 year and no later than 5 years - - - Later than 5 years - - - 181,337 - -

B o R D e R T I M B e R S - A N N u A l R e p o R T - 2 0 1 162
Notes to tHe CoMpANy fiNANCiAl stAteMeNtsNotes to tHe CoMpANy fiNANCiAl stAteMeNts
Borrowing analysis
Effective Maturity 2011 2010 2009 Interest Period US$ US$ US$ Rate Medium term bank loan 12% 3 years 1,100,979 - - Bank Loans - Stanbic 6% 150 days - 500,000 - MBCA 13% 180 days - 986,704 - FBC 18% 60 days 3,111,838 300,000 - - IDBZ 13% 180 days - 499,990 - - NMB 18% 60 days 253,886 206,000 - - NMB 25% 90 days - 200,000 - - KMB - 180 days - 66,000 - Shareholders loan 20% 365 days 324,975 284,993 - Loinette Finance Lease 13.5% 360 days 181,337 - - Bank overdraft facilities - Stanbic 12% 1,514,803 1,502,620 11 - FBC 15% 725,527 1,641,555 -
Total borrowings 7,213,345 4,701,158 1,486,715
All facilities bear a fixed interest rate.
The fair value of borrowings equals their carrying amounts, as the impact of discounting is not significant.
Borrowing costs The Articles of Association provide that the Group may from time to time, at the discretion of the Directors, borrow, raise or source
borrowings up to half the value of the shareholders equity as reflected in the Statement of Financial Position of the Annual Report. This limit may only be exceeded with the sanction of an ordinary resolution of the Company
11. DeFeRReD INCoMe 2011 2010 2009 US$ US$ US$ Balance at 1 July - 646,918 486,716 Exchange rate adjustment - 56,918 - Received during the year - - 160,202 Transferred to income statement - (703,836) - Balance at 30 June - - 646,918
12. DeFeRReD INCoMe tAX The analysis of deferred tax assets and deferred tax liabilities is as follows: Deferred tax assets - Deferred tax assets to be recovered after more than 12 months 796,359 679,234 - - Deferred tax assets to be recovered within 12 months - - - 796,359 679,234 - Deferred tax liabilities - Deferred tax liabilities to be recovered after more than 12 months 31,490,926 29,731,083 33,639,239 - Deferred tax liabilities to be recovered within 12 months 68,178 47,578 122,752 31,559,104 29,778,661 33,761,991 Deferred tax liability (net) 30,762,745 29,099,427 33,761,991 The gross movement on the deferred tax account is as follows: At 1 July 29,099,427 33,761,991 10,578,693 1,663,318 (5,476,189) 23,183,298 Current year charge to income statement (Note 20) 1,663,318 (812,431) 704,415 Prior period adjustment (Note 1) - (4,663,758) 22,478,883 Charged to other comprehensive income - 813 625 - At 30 June 30,762,745 29,099,427 33,761,991

63
Notes to tHe CoMpANy fiNANCiAl stAteMeNtsNotes to tHe CoMpANy fiNANCiAl stAteMeNts
2011 2010 2009 US$ US$ US$
The deferred income tax account comprise the following: Accelerated depreciation for tax purposes 8,204,621 8,402,785 10,658,180 Biological assets 23,286,305 21,328,298 22,981,059 Prepayments 61,703 43,479 113,353 Unrealised exchange gains 6,475 4,099 9,399 Assessable tax losses (796,359) (679,234) - At 30 June 30,762,745 29,099,427 33,761,991
2011 2010 The deferred income tax charge to the income statement comprised of the following: US$ US$
Accelerated depreciation for tax purposes (198,167) 1,958,007 Biological assets 1 958 007 (1 652 487) Prepayments 18 224 (69 874) Unrealised exchange gains 2 376 (5,299) Assessed tax losses (117 125) (679 234) Revaluation - 800 594 Reduction in tax rate - (813 900) 1 663 316 (5 476 188)
Deferred income tax assets are recognised for tax losses carried forward to the extent that the realisation of the related tax benefit through future taxable profits is probable. The Company recognised deferred income tax assets of US$796,359 in respect of tax losses amounting to $3,092,656.
13. tRADe AND otHeR PAYABLes 2011 2010 2009 US$ US$ US$ Trade payables 1,955,762 1,726,448 1,986,803 Accruals 400,290 265,670 201,446 Payable to related parties (note 15) 15,814 147,280 157,493 Statutory liabilities 166,320 131,607 61,468 2,538,186 2,271,005 2,407,210
Trade payables are unsecured, non-interest bearing and are generally settled within 30 days. Other payables are unsecured, non- interest bearing and have an average term of 60 days.
Statutory liabilities comprise statutory levies $75,107 (2010: $50,960; 2009: $6,743), employee income tax $48,229 (2010: $56,785 ; 2009: $21,576) and employee statutory pensions $42,984 (2010: $23,863 ; 2009 $33,150).
14. PRoVIsIoNs
At 1 July 133,594 185,067 - Additional provision 189,477 - 185,067 Amounts utilized (55,038) (51,473) - At 30 June 268,033 133,594 185,067
provision for bonus The provision consists of an annual bonus and a performance based bonus. Performance based bonus is paid as and when set targets are met whilst the annual bonus is expected to be paid in December 2011.
15. ReLAteD PARtY DIsCLosURes a) Key management personnel remuneration and other compensation Salaries and other short term employee benefits 265,793 141,724 Pension contributions 8,824 5,935 274,617 147,659
Key management compensation comprises remuneration to executive directors.

B o R D e R T I M B e R S - A N N u A l R e p o R T - 2 0 1 164
Notes to tHe CoMpANy fiNANCiAl stAteMeNtsNotes to tHe CoMpANy fiNANCiAl stAteMeNts
2011 2010 US$ US$
b) Transactions Nature of Relationship
i) Sales Radar Investments (Private) Limited Fellow subsidiary - United Builders Merchants (Division) 1,076,937 1237109 - Macdonald Bricks (Division) - 15075 Border Timbers International (Private) Limited Subsidiary 4,542,908 2,599,300 ii) Purchases Radar Investments (Private) Limited Fellow Subsidiary - United Builders Merchants (Division) 295,715 156,430 iii) Management fees paid Radar Investments (Private) Limited Fellow Subsidiary 392,576 240,000 iv) Professional fees paid Foresta De Niassa (Private) Limited Common shareholding - 11,770 v) Interest paid - Forrester Estates (Private) Limited Common shareholding 39,983 34,993
2011 2010 2009
c) Year end balances US$ US$ US$ i) Receivables from related parties Radar Investments (Private) Limited Fellow Subsidiary 24,715 - - - MacDonald Bricks (Division) 34,874 - 17,613 - United Builders Merchants ((Division) 73,518 50,194 86,645 Border Timbers International Subsidiary 2,470,297 1,615,407 689,962 Radar properties Fellow Subsidiary - - 13 Beit Bridge Juice (Private) Limited Common Shareholding 899 899 13,095 2,604,303 1,666,500 807,328 ii) Payables to related parties Radar Investments (Private) Limited Fellow Subsidiary - 85,734 108,757 - MacDonald Bricks (Division) 639 639 - United Builders Merchants ((Division) 15,175 42,339 18,761 - Beitbridge Juice (Private) Limited Common Shareholding 15,075 - Radar Holdings Limited Parent - 15,438 - Rift Valley Holdings (Private) Limited Common Shareholding - 3,130 14,900 15,814 147,280 157,493
d) Loans from related parties
- Forrester Estates (Private) Limited Common shareholding 324,976 284,993 - The sales to and purchases from related parties are based on the price list in force and terms that would be available to third parties.
Outstanding balances at the year-end are unsecured, interest free (except for shareholders loan) and settlement occurs in cash. The shareholder’s loan carries an interest of 20% per annum and is available on demand. There have been no guarantees provided or received for any related party receivables or payables. For the year ended 30 June 2011, the Company has not recorded any impairment of receivables relating to amounts owed by related parties. This assessment is undertaken each financial year through examining the financial position of the related party and the market in which the related party operates.

65
Notes to tHe CoMpANy fiNANCiAl stAteMeNtsNotes to tHe CoMpANy fiNANCiAl stAteMeNts
16. otHeR INCoMe – Net 2011 2010 US$ US$ Proceeds from insurance claim 250,000 0 Deferred Income transferred to Income statement 0 703,836 Sale of firewood 29,852 9,016 Sale of reject stocks 2,824 3,309 Beer hall profit 16,826 18,273 Sundry income 59,235 171,923 358,737 906,357
17. eXPeNses BY NAtURe
Depreciation charges (note 2) 1,763,862 1,945,384 Employee benefit expense (note 18) 5,552,886 4,964,737 Auditors remuneration - current year audit services 64,000 - - prior year audit services 51,947 91,227 - current year non-audit services 7,047 7,268 Provision for doubtful debts (note 6) (358) 83,323 Impairment of property, plant and equipment (note 2) 193,322 4,452,245 Plantation damage/redemption (note 3) 5,337,691 2,362,846 Raw material and consumables used 1,739,577 1,514,700 Inventory write off (note 4) 396,614 445,477 Haulage costs 2,094,636 1,020,508 Repairs and maintenance - motor vehicles 3,243,774 2,230,302 Repairs and maintenance - plant/buildings 2,604,379 1,612,534 Sub contract services 875,301 398,820 Consultancy 598,344 209,579 Electiricity 787,454 567,183 Other expenses 971,023 469,330 26,281,499 22,375,463 Capitalisation of forestry costs (note 3) (1,968,596) (1,882,238) Total cost of sales, administration and distribution and selling costs 24,312,903 20,493,225
18. eMploYee BeNeFIT eXpeNSe
Wages and salaries 4,761,182 3,853,104 Pension fund contribution 196,876 529,076 Social security costs 73,784 101,808 Staff welfare costs 246,428 333,091 5,278,270 4,817,079 Directors’ remuneration: Salaries and other short term employee benefits 265,793 141,724 Pension contributions 8,824 5,935 5,552,887 4,964,738 Manning levels at 30 June Nos Nos. Permanent 1,389 1,259 Contract 1,375 1,129 Total 2,764 2,388

B o R D e R T I M B e R S - A N N u A l R e p o R T - 2 0 1 166
19. FINANCe INCoMe AND Costs 2011 2010 US$ US$
Finance costs Interest paid: - Bank loans 1,026,124 286,061 - Finance lease liability 28,727 - - Related party borrowings 39,983 34,993 1,094,834 321,054
Finance income Interest income: -Short-term bank deposits 2,878 859 -Related party balances 96,920 - 99,798 859
20. tAXAtIoN
Deferred tax charge / (credit) 1,663,316 (5,476,188)
Tax Reconciliation: Profit before taxation 7,030,062 2,453,278
Taxation at normal rate 1,810,241 631,719 Net of non-taxable income and non-deductible expenses (146,925) (480,908) Adjustment to deferred tax liability resulting from change in tax rate - (5,626,999) Tax charge 1,663,316 (5,476,188)
The applicable corporate tax rate for Zimbabwean companies was reduced to 25.75% during 2010 from 30.9% in 2009. The change was enacted into law by the Zimbabwean Government in December 2009 and was therefore applicable for the year ended 30 June 2010.
Notes to tHe CoMpANy fiNANCiAl stAteMeNtsNotes to tHe CoMpANy fiNANCiAl stAteMeNts

67
2011 2010 2009 US$ US$ US$
ReVeNUe 21,006,256 13,423,750 7,037,345 Profit before taxation 7,030,062 2,453,356 107,582Taxation (1,663,316) 5,476,188 (704,415)Retained profit for the period 5,366,745 7,929,544 (661,112)
FUNDs eMPLoYeD
Share holders’ equity 105,885,732 100,518,987 90,224,040Medium Term Loans 1,100,979 - Deferred income - - 646,918Deferred income tax liability 30,762,745 29,099,427 33,761,991 137,749,456 129,618,414 124,632,949Represented by: Property, plant & equipment 46,867,238 46,723,497 48,779,512Biological assets 90,432,254 82,828,342 74,372,359Net current assets /(liabilities) excluding cash resources 378,704 (172,342) 1,392,209Cash resources 71,260 238,917 88,869 137,749,456 129,618,414 124,632,949
Statistics
sHARes IN IssUe Number of ordinary shares 42,942,487 42,942,487 42,942,487Number of shareholders 178 185 186
Shareholders performance per share (dollars) Basic earnings per share 0.12 0.18 0.13
Returns Operating income to turnover 38.2% 20.7% 1.5%Operating income to total assets 5.5% 2.0% 0.1%Profit after tax to shareholders funds 5.1% 7.9% 6.0%-
Ratios Debt-Equity 7% 5% 2%Interest cover (times) 7.33 8.64 1.60
Solvency ratios Current Ratio 1.05 1.01 1.37Liquidity 0.62 0.48 0.43Number of employees 2,764 2,388 2,419
CoMpANy ANNuAl perfoMANCe ANAlysisCoMpANy ANNuAl perfoMANCe ANAlysis

B o R D e R T I M B e R S - A N N u A l R e p o R T - 2 0 1 168
ANAlysisi of sHAreHolDersANAlysis of sHAreHolDers
2011 2010
Number of % of Number of % of
Holders Total Shares Total Holders Total Shares Total
0 - 1 000 114 64.0% 38 008 0.1% 115 62.2% 37 502 0.1%
1.001 - 5 000 28 15.7% 78 784 0.2% 32 17.3% 88 328 0.2%
5.001 - 10 000 7 3.9% 57 798 0.1% 8 4.3% 67 798 0.2%
10.001 - 50 000 15 8.4% 319 925 0.7% 8 4.3% 67 798 0.2%
Over 50 000 14 7.9% 42 447 972 98.8% 16 8.6% 310 612 0.7%
178 100.0% 42 942 487 100.0% 185 100.0% 42 942 487 100.0%
2011 2010
Number of % of % of Number of % of % of
CLASSIFICATION Holders Total Shares Total Holders Total Shares Total
Resident:
Banks & Nominee Companies 27 15.2% 4 499 610 10.5% 34 18.4% 8 963 440 20.9%
Companies 33 18.5% 37 583 301 87.5% 28 15.1% 33 110 055 77.1%
Pension Funds 3 1.7% 188 008 0.4% 1 0.5% 152 816 0.4%
Individuals 91 51.1% 176 720 0.4% 105 56.8% 234 331 0.5%
Non Resident:
Companies 4 2.2% 300 508 0.7% 3 1.6% 300 508 0.7%
Individuals 20 11.2% 194 340 0.5% 14 7.6% 181 337 0.4%
178 100.0% 42 942 487 100.0% 185 100.0% 42 942 487 100.0%
2011 2010
% of % of
MAJOR SHAREHOLDERS Holders Total Shares Total
RADAR HOLDINGS LIMITED 22 005 087 51.2% 22 005 087 51.2%
FRANCONIAN ZIMBABWE INVESTMENTS (PVT) LTD 11 045 468 25.7% 11 045 468 25.7%
KINGDOM NOMINEES (PVT) LTD 4 294 248 10.0% 0 0.0%
TRUSTCORP GROUP 0 0.0% 4 294 248 10.0%
ILARIA LIMITED 4 294 248 10.0% 4 294 248 10.0%
RIA HOLDINGS LIMITED 123 239 0.3% 123 239 0.3%
P & R HOLDINGS (PVT) LTD PENSION FUND 152 816 0.4% 0 0.0%
TUDLEY HOLDINGS LIMITED 90 500 0.2% 0 0.0%
SALISBURY NEW POOL SETTLEMENT 114 088 0.3% 114 088 0.3%
WAUGHCO NOMINEES (PVT) LTD 100 000 0.2% 100 000 0.2%
41 915 106 97.6% 41 976 378 97.8%

69
NotesNotes

B o R D e R T I M B e R S - A N N u A l R e p o R T - 2 0 1 170
NotesNotes

71
NotesNotes

B o R D e R T I M B e R S - A N N u A l R e p o R T - 2 0 1 172
NotesNotes
