bolton, thomas a.w.; kebets, valeria; glerean, enrico ... › files › 40259250 › bolton... ·...
TRANSCRIPT
This is an electronic reprint of the original article.This reprint may differ from the original in pagination and typographic detail.
Powered by TCPDF (www.tcpdf.org)
This material is protected by copyright and other intellectual property rights, and duplication or sale of all or part of any of the repository collections is not permitted, except that material may be duplicated by you for your research use or educational purposes in electronic or print form. You must obtain permission for any other use. Electronic or print copies may not be offered, whether for sale or otherwise to anyone who is not an authorised user.
Bolton, Thomas A.W.; Kebets, Valeria; Glerean, Enrico; Zöller, Daniela; Li, Jingwei; Yeo, B.T.Thomas; Caballero-Gaudes, César; Van De Ville, DimitriAgito ergo sum
Published in:NeuroImage
DOI:10.1016/j.neuroimage.2019.116433
Published: 01/04/2020
Document VersionPublisher's PDF, also known as Version of record
Please cite the original version:Bolton, T. A. W., Kebets, V., Glerean, E., Zöller, D., Li, J., Yeo, B. T. T., ... Van De Ville, D. (2020). Agito ergosum: Correlates of spatio-temporal motion characteristics during fMRI. NeuroImage, 209, [116433].https://doi.org/10.1016/j.neuroimage.2019.116433

NeuroImage 209 (2020) 116433
Contents lists available at ScienceDirect
NeuroImage
journal homepage: www.elsevier.com/locate/neuroimage
Agito ergo sum: Correlates of spatio-temporal motion characteristicsduring fMRI
Thomas A.W. Bolton a,b,*, Valeria Kebets b,c, Enrico Glerean d, Daniela Z€oller a,b,e, Jingwei Li c,B.T. Thomas Yeo c, C�esar Caballero-Gaudes f, Dimitri Van De Ville a,b
a Institute of Bioengineering, �Ecole Polytechnique F�ed�erale de Lausanne (EPFL), Lausanne, Switzerlandb Department of Radiology and Medical Informatics, University of Geneva (UNIGE), Geneva, Switzerlandc Department of Electrical and Computer Engineering, Clinical Imaging Research Centre, Centre for Sleep and Cognition, N.1 Institute for Health and Memory NetworksProgram, National University of Singapore, Singapored Department of Neuroscience and Biomedical Engineering, Aalto University, Helsinki, Finlande Developmental Imaging and Psychopathology Laboratory, Office M�edico-P�edagogique, Department of Psychiatry, University of Geneva (UNIGE), Geneva, Switzerlandf Basque Center on Cognition, Brain and Language, San Sebastian, Spain
A R T I C L E I N F O
Keywords:BehaviourMotion artefactsPartial least squares analysisResting-state fMRISpatio-temporal motion
* Corresponding author. Institute of BioengineeriE-mail address: [email protected] (T.A.W.
https://doi.org/10.1016/j.neuroimage.2019.11643Received 10 June 2019; Received in revised form 1Available online 11 December 20191053-8119/© 2019 Published by Elsevier Inc. This
A B S T R A C T
The impact of in-scanner motion on functional magnetic resonance imaging (fMRI) data has a notorious repu-tation in the neuroimaging community. State-of-the-art guidelines advise to scrub out excessively corruptedframes as assessed by a composite framewise displacement (FD) score, to regress out models of nuisance variables,and to include average FD as a covariate in group-level analyses.
Here, we studied individual motion time courses at time points typically retained in fMRI analyses. Weobserved that even in this set of putatively clean time points, motion exhibited a very clear spatio-temporalstructure, so that we could distinguish subjects into separate groups of movers with varying characteristics.
Then, we showed that this spatio-temporal motion cartography tightly relates to a broad array of anthropo-metric and cognitive factors. Convergent results were obtained from two different analytical perspectives: uni-variate assessment of behavioural differences across mover subgroups unraveled defining markers, whilesubsequent multivariate analysis broadened the range of involved factors and clarified that multiple motion/behaviour modes of covariance overlap in the data.
Our results demonstrate that even the smaller episodes of motion typically retained in fMRI analyses carrystructured, behaviourally relevant information. They call for further examinations of possible biases in currentregression-based motion correction strategies.
1. Introduction
Resting-state functional magnetic resonance imaging (RS fMRI) hasbeen a vibrant and flourishing research topic. Since its advent (Biswalet al., 1995), the assessment of statistical interdependence between brainregions, or functional connectivity (FC), has enabled the determination oflarge-scale functional brain networks (Damoiseaux et al., 2006; Poweret al., 2011; Yeo et al., 2011), and the harvesting of their spatio-temporalproperties towards a refined understanding of a constellation of braindisorders (Fox and Greicius, 2010).
One of the most remarkable features of RS fMRI is that such analysesare already feasible from a few minutes of acquisition (Van Dijk et al.,2009). However, the reliance on low amounts of data also requires that
ng, �Ecole Polytechnique F�ed�eraleBolton).
31 November 2019; Accepted 2 D
is an open access article under t
the acquired time courses be impeccably cleaned from potential con-founding signals. This is even more of a concern as the field starts movingtowards time-varying and -resolved analyses, such as dynamic FC (Lau-mann et al., 2016)—see Preti et al. (2017) for a review—or real-timeneurofeedback (Watanabe et al., 2017).
Amongst confounding signal sources, in-scanner head motion ofvolunteering participants has been a leading cause of investigation. Itsdeleterious impacts may take many forms, and remain incompletelyunderstood—see Power et al. (2015); Caballero-Gaudes and Reynolds(2017) for reviews. Some years ago, it was discovered that evenshort-lived episodes of motion might greatly bias FC analyses (Poweret al., 2012; Van Dijk et al., 2012; Satterthwaite et al., 2012), and lead toerroneous interpretations in clinical or developmental studies (Deen and
de Lausanne (EPFL), Lausanne, Switzerland.
ecember 2019
he CC BY-NC-ND license (http://creativecommons.org/licenses/by-nc-nd/4.0/).
T.A.W. Bolton et al. NeuroImage 209 (2020) 116433
Pelphrey, 2012; Makowski et al., 2019). These observations ofmotion-biased results further fueled the development of robustpost-processing strategies to free fMRI time courses from confoundingmotion effects.
Thanks to many rigorous and extensive studies (Satterthwaite et al.,2013; Yan et al., 2013; Power et al., 2014; Burgess et al., 2016; Ciricet al., 2017; Parkes et al., 2018), the field has reached a consensus as towhat general steps are essential for a viable RS fMRI denoising pipeline.Their specificities, however, remain debated. In short, following thelinear realignment of functional images, estimates of motion over timeare obtained along three translational directions (left/right, ante-rior/posterior and dorsal/ventral, respectively termed X, Y and Z in whatfollows) and three rotational planes (roll, pitch and yaw, respectivelyreferred to hereafter as α, β and γ). Framewise displacement (FD) is thencomputed as an aggregated measure across these 6 motion parameters,1
in order to tag data points corrupted by excessive instantaneous motionand exclude them from subsequent analyses.
Estimated motion time courses are then linearly regressed out fromthe remaining fMRI data,2 in a matrix of regressors that can be extendedto include their quadratic expansions, their derivatives, and/or theirsquared derivatives. More parsimonious models lead to a greater amountof retained degrees of freedom in the data, while more exhaustive modelsmay remove signal of interest (Bright and Murphy, 2015), but enable toaccount for biophysically relevant nonlinear motion effects (Friston et al.,1996).
Finally, the addition of a covariate for group-level analyses has alsobeen warranted (Ciric et al., 2018). However, this last step has beencriticised for its risk of biasing some RS fMRI analyses: indeed, if thebehavioural feature of interest in the study positively correlates with theextent of head motion, the investigated metric will be more stronglyattenuated in larger movers, thus potentially lowering the true magni-tude of the effect of interest.
To date, such concerns have been raised in attention or impulsivitystudies (Kong et al., 2014; Wylie et al., 2014). Head motion has beenposited to be a marker of cognitive control abilities (Zeng et al., 2014),showing clear heritability (Couvy-Duchesne et al., 2014), even if solelynon-scrubbed frames are considered (Engelhardt et al., 2017), andsharing genetic influences with hyperactivity (Couvy-Duchesne et al.,2016) or body mass index (Hodgson et al., 2016). Very recently, anextended multivariate assessment isolated body mass index and weightas the major predictors of head motion, with mild additional impacts ofimpulsivity levels and alcohol/nicotine consumption (Ekhtiari et al.,2019). Thus, in light of current knowledge, the span of behavioural orclinical measures subject to bias remains limited.
A major shortcoming of all the above studies, however, is the use ofaverage FD over time to quantify head motion levels. In other words, it isimplicitly assumed that motion properties remain similar along thecourse of a scanning session, and do not differ across translational di-rections or rotational planes—an assumption that does actually notsquare well with the information available to date; see Wilke (2014). It islikely that the true spatio-temporal complexity of motion is so far over-looked, and that its relationship to behaviour is thus only poorly un-derstood. Since even the most sophisticated motion correctionapproaches summarised above are still unable to fully remove deleteriousmotion influences (Yan et al., 2013; Siegel et al., 2016), filling suchpossible gaps of knowledge is a critical task.
Our first question in the present work was thus whether we could
1 Here, we will be discussing the FD metric suggested by Power et al. (2012),but other alternatives have also been put forward in the past literature (Jen-kinson et al., 2002; Van Dijk et al., 2012).2 Scrubbed data points can be accounted for in two ways: either by modelling
them as individual single-point regressors (Lemieux et al., 2007), or byextracting fitting weights from solely non-scrubbed data points, and thenapplying the regression to the whole data (Power et al., 2014).
2
find, consistently across subjects, spatio-temporal head motion proper-ties going beyond time- and space-invariance. Our second question wasthen whether these more subtle motion profiles would be associated tospecific anthropometric features, cognitive properties or personal char-acter traits.
2. Materials and methods
2.1. Motion data acquisition and preprocessing
We considered a set of 951 healthy subjects from the Human Con-nectome Project—HCP (Smith et al., 2013), scanned at rest (eyes open)over four separate 15-minute sessions at a TR of 0.72 s. For each session,motion was estimated using rigid-body transformation with threetranslation parameters (along the X, Y and Z axes) and three rotationangles (in the α, β and γ planes respectively highlighting roll, pitch andyaw) with respect to a single-band reference image acquired at the startof each session, and FSL’s FLIRT (Jenkinson et al., 2012). It resulted in 6time courses (one per motion parameter) with 1200 time points each.
In the present work, we solely analysed the motion time courses (notthe fMRI data) from the first and second acquired sessions (in the mainresults and to assess replicability of the findings, respectively). Individualmotion time courses were differentiated so that our analyses would focuson instantaneous displacement from time t to time tþ1. Further, sincetime points linked to excessive displacement are typically removed fromRS fMRI analyses, we only considered non-scrubbed motion instancesaccording to Power’s FD definition (Power et al., 2012) at a threshold of0.3 mm. Resorting to a more conservative (0.2 mm) or more lenient (upto 1 mm) threshold, or censoring not only tagged time points (time t) butalso the following ones (time tþ1), did not modify our findings (seeSupplementary Material, Section 2 for a more detailed description).
2.2. Spatio-temporal motion characterisation
Wewished to assess whether different subjects would present distinctspatio-temporal motion characteristics in the data points that are typi-cally conserved in RS fMRI analysis (i.e., not scrubbed out).
For each motion time course, we computed absolute valued instan-taneous displacement. Thus, we did not consider the sign of the changes(e.g., moving positively as opposed to negatively in the X direction); thisis because initial analyses indicated that positive-valued and negative-valued movements always compensated, to the exception of the X case(two-sided Wilcoxon rank sum test, p < 0.0001).
Then, we averaged motion values within each motion type (X, Y, Z, α,β and γ), and each of 6 even-duration time intervals along the scanningsessions (2.4 min ¼ 144 s each). This resulted in a total of 36 conditions.We chose 6 temporal sub-bins to give equal weight to spatial and tem-poral domain information in our decomposition of the data. Eventually,the values were z-scored across subjects for each condition so that posi-tive values highlight strong movers (at a given time and for a givenmotion parameter) with respect to themean, and vice versa. It also followsthat an equal weight is given to each condition.
Next, we used these 36 motion summary measures to separate sub-jects into different subgroups of movers through spectral clustering (VonLuxburg, 2007), a nonlinear dimensionality reduction approach—seeSupplementary Material, Section 3 for details. By taking into accountsuch precise motion characteristics, we exploit complex motion profilesrather than simply dividing into high- and low-motion subjects, as isclassically done on the basis of average FD.
To evaluate whether there was any significant effect of scanningduration, motion parameter or mover subtype, or any interaction be-tween these factors, we conducted a three-way ANOVA (factor 1: scan-ning duration [time], factor 2: motion parameter [space], factor 3: moversubtype [group]) and assessed significance by comparing the obtained F-values with a null distribution generated non-parametrically over 10,000folds, shuffling the three factors independently from each other across

T.A.W. Bolton et al. NeuroImage 209 (2020) 116433
subjects.To assess motion changes along time within a given group of subjects,
a linear model was fitted along the six time bins (including a constantregressor of no interest), and the null hypothesis that the mean valueacross subjects would be equal to 0 was assessed. To examine differencesin motion along space, we conducted pair-wise two-tailed t-tests betweenall group pairs.
2.3. Replication of the findings on a second HCP session
To assess the generalisability of our findings, we performed a similaranalysis on a second session from the HCP, acquired during the same dayas the first. We matched the 36-dimensional motion states obtained fromboth sessions using the Hungarian algorithm (Kuhn, 1955), andcomputed the mean square error (MSE) between the matching pairs. Wecompared the resulting values to the distribution of MSE values obtainedby comparing all possible non-matched pairs of states within or acrossboth sessions.
In addition, to provide quantitative evidence that mover subgroupsare the reflection of individual traits, we conducted supervised classifi-cation: the mover subgroup of a subject was determined from spectralclustering on one of the two sessions’ data, and we then assessed whetherthat subject would be classified as expressing the samemotion state usingdata from the other session.
For this analysis, we discarded the subjects that expressed, in one ofthe two sessions, a state that had no equivalent in the other. On theremaining pool of subjects, we quantified the fraction of “correct classi-fication” (i.e., to the same mover subgroup). We conducted the analysisusing a K-nearest neighbour classifier with 50 or 100 neighbours, andusing either the first or the second session data to generate labels.
2.4. Behavioural data acquisition and processing
For each subject, a battery of behavioural scores was also quantified.A list of all the investigated scores in the present study can be found in theSupplementary Material (Section 4). They were subdivided into severalkey sub-domains, largely following the original classification found in theHCP Data Dictionary3:
� Bodily features, such as weight, height or blood pressure.� Arousal, assessed in terms of cognitive status—MMSE (Folstein et al.,1983)—and sleep quality—PSQI (Buysse et al., 1989).
� Cognitive functions, quantified by diverse scores including, forinstance, attentional and memory performance, language skills, andspatial orientation abilities.
� Affect in terms of emotion recognition, anger, fear, stress or life sat-isfaction—assessed through the NIH toolbox (Gershon et al., 2010).
� Task performance (in terms of accuracy, response time or errors)across various cognitive domains—see Barch et al. (2013) for details.
� Motor abilities, including endurance, gait speed, dexterity andstrength measurements.
� Personality, as assessed by the NEOFAC questionnaire (McCrae andCosta Jr, 2004).
� Sensory perception, quantified in terms of responses to noise, odour,pain, taste, or contrast.
� Personal character traits, including for example measures of anxiety,aggressiveness, withdrawal or inattention (Achenbach, 2009).
� Substance use, that is, intake of alcohol or drugs (partly from theSSAGA questionnaire).
For some scores, several entries were not acquired in a sub-fraction ofsubjects. This was taken into account in behavioural data processing so
3 Ωhttps://wiki.humanconnectome.org/display/PublicData/HCPþDataþDictionaryþPublic-ΩþUpdatedþforþtheþ1200þSubjectþRelease.
3
that it would exert a minimal effect on the described findings. Somescores were also discarded due to various criteria, and the remaining oneswere processed as in Smith et al. (2015), yielding a total of 60 summa-rising measures for subsequent analyses, reflective of anthropometricproperties, cognitive abilities or personal character traits. Details areprovided in the Supplementary Material (Section 4).
2.5. Univariate links between motion subgroups and anthropometry/behaviour
To determine whether some anthropometric/behavioural scoreswould differ across mover subgroups, we performed a univariateassessment. For each of the 60 assessed domains, we computed a scoreindicative of cluster-to-cluster distinction. Formally, following Gu et al.(2012):
FðxiÞ¼PK
k¼1nkðμk;i � μiÞ2PK
k¼1nkðσk;iÞ2; (1)
where xi is the vector of the ith domain scores across subjects, μi is itsaverage regardless of group classification, μk;i is its average within groupk, and σk;i is the standard deviation within group k. A large F(xi) scorevalue indicates that the assessed behavioural domain shows distinctvalues between clusters.
To non-parametrically extract significant scores, we used permutationtesting, by randomly shuffling subject motion entries 1000 times. P-values were Bonferroni corrected for 60 tests. Scores were consideredsignificant at a corrected p-value of 0.05.
2.6. Multivariate links between motion features and anthropometry/behaviour
To go beyond univariate comparisons and test for multivariate pat-terns of motion-behaviour interactions, we conducted a Partial LeastSquares (PLS) analysis (McIntosh and Lobaugh, 2004; Krishnan et al.,2011). We summarise the gist of the approach below, and additionaldetails can be found in the Supplementary Material (Section 3).
We considered thematrix of behavioural scores (size 951� 60) on theone hand, and the matrix of spatio-temporal motion features (size 951 �72) on the other (where we jointly considered the 36 features obtainedfrom each HCP session). Using PLS, we derived a set of so-called com-ponents. Each consists in a linear combination of motion scores, and alinear combination of behavioural scores, with maximised covariance.The associated weights are termed motion saliences and behavioural sa-liences, and are respectively arranged in U and V, two matrices of size 72� 60 and 60 � 60. Motion saliences (i.e., the columns of U) are ortho-normal, and so are behavioural saliences. Successive components explaingradually less of the covariance present in the data, as quantified by theirsingular values. Finally, the extent to which a motion salience or abehavioural salience is expressed in a given subject is termed the motionlatent weight or behavioural latent weight, respectively.
To assess significance of the PLS components, we compared theirsingular values to a null distribution constructed from 1000 shuffleddatasets (where shuffling was applied across different subjects),following Z€oller et al. (2017). We focused our interpretation on thecomponents significant at p ¼ 0.05. To determine the stability of thesaliences, we performed bootstrapping with 80% of the data.
For interpretation, we converted the 36-element motion saliencesobtained from PLS analysis for each session into a 6-element space and a6-element time representation, by averaging across all time points oracross all spatial directions, respectively. Stability was assessed on thesesummarising values. Each behavioural or motion salience element wasconsidered significant above a bootstrap score (mean salience acrossbootstrapping folds divided by the associated standard deviation) of 3,corresponding to a confidence interval of approximately 99% (Garrett

T.A.W. Bolton et al. NeuroImage 209 (2020) 116433
et al., 2010; Z€oller et al., 2017).In addition, we performed correlation analyses between motion (or
behavioural) latent weights of the analysed components and FD (ascomputed from non-scrubbed frames) or age, using Spearman’s correla-tion and non-parametric significance assessment. We also performed aWilcoxon rank sum test to probe for possible differences in motion (orbehavioural) latent weights across gender. Results were Bonferroni-corrected for 24 tests (4 components examined in terms of 3 separateparameters for 2 types of latent weights) and judged significant at acorrected p-value of 0.05.
2.7. Validation of the findings on an independent dataset
To demonstrate that our findings generalise to other acquisition set-tings, we extracted spatio-temporal motion states, and motion/behaviourmodes of covariance, in a second independent dataset. We selected theUCLA Consortium for Neuropsychiatric Phenomics dataset—referred toas the “UCLA dataset” in what follows (Poldrack et al., 2016), whichincludes healthy subjects as well as patients diagnosed with schizo-phrenia, schizoaffective disorder, bipolar disorder, and attention defi-cit/hyperactivity disorder. By this mean, on top of validating our mainfindings, we could also evaluate whether neuropsychiatric disordersmodulate in-scanner motion along space and time, as well as its linkswith behaviour.
To evaluate whether motion and/or behavioural latent weights wereexpressed differentially as a function of diagnosis, we conducted a three-way ANOVA (factor 1: significant component index, factor 2: type oflatent weight, factor 3: diagnosis), and assessed significance bycomparing the obtained F-values with a null distribution generated non-parametrically over 10,000 folds, shuffling the three factors indepen-dently from each other across subjects.
3. Results
3.1. Spatio-temporal motion diversity
Average motion across six even-duration time bins, and the 6 motionparameters, was quantified. This spatio-temporal motion profile char-acterisation revealed the existence of four separate subgroups of movers(Fig. 1A/B). As an alternative representation, we also individually plottedscanning duration or motion parameter against cluster assignments(Fig. 1C), averaging over all entries from the other factor (e.g., the barlabeled “X” denotes the average of motion along the X direction from t1 tot6).
In the first mover subgroup (n1 ¼ 164, red patches), subjects showedparticularly strong motion in the γ rotational plane. In the second (n2 ¼310, dark blue patches), they showed low motion across all time andmotion dimensions (negative z-score values in Fig. 1C). In the third group(n3 ¼ 282, green patches), subjects showed particularly marked motionalong Y, Z and α. Subjects from group 4 (n4 ¼ 195) moved more from thesecond session sixth, mostly along X, Z and β.
Statistical analysis confirmed the above observations: on top of asignificant effect of group (F ¼ 3280.21, p < 10�5), there was a signifi-cant time � group interaction (F ¼ 3.19, p < 10�5), and post-hocassessment revealed that while groups 1 and 2 and showed a decrease inmotion over time (β1 ¼ � 0:0099 ½ � 0:0149; � 0:0049�, p ¼1.35⋅10�4; β2 ¼ � 0:0034 ½ � 0:0051; � 0:0017�, p ¼ 1.27⋅10�4),group 4 exhibited an increase (β4 ¼ 0:0241 ½0:0136; 0:0347�, p ¼1.06⋅10�5). Thus, different mover subgroups displayed varying temporalchanges in their extent of motion.
In terms of spatial properties, there was a significant effect of space (F¼ 19.65, p < 10�5), as well as a significant space � group interaction (F¼ 415.88, p < 10�5). Exhaustive results from a post-hoc assessment aredisplayed in the Supplementary Material (Section 1). They show thatsubjects in group 1 moved the most in the γ plane (hence their blue shadein Fig. 1B, right panel), while subjects in group 2 moved the least across
4
all 6 spatial degrees of freedom. Group 4 featured the largest movers in Xand in β, and group 3 in Y and α. Overall, each group could thus be clearlydistinguished on the basis of spatial motion properties.
In a second acquired session, three subgroups of movers could bedelineated (Fig. 2A). Each could be unequivocally matched to anequivalent spatio-temporal motion state from session 1 (Fig. 2C, toppanel); only the first mover subgroup from session 1 (primarily high-lighting marked motion along the γ rotational plane) had no equivalentin session 2. Within the subjects that belonged to one of the threeconsistently retrieved mover subgroups in session 1, 69.3% continued tobelong to the same group in session 2 (Fig. 2C, bottom panel). Theconverse was also true: 69.4% of subjects expressing one of these threestates in session 2 also expressed the same in session 1.
3.2. Univariate links between motion and anthropometry
Next, we related the spatio-temporal motion characteristics of thesubjects (as summarised by their mover group assignment) to theiranthropometric, cognitive and personality features. Weight, height,blood pressure, language abilities and endurance scores were signifi-cantly different across mover subtypes following Bonferroni correction(Fig. 3A). When applying FDR correction instead, scores reflective ofsleep disturbances, cognitive flexibility, self-regulation, spatial orienta-tion abilities, and working memory performance also became significant.
Subsequent inspection of pair-wise group relationships (Fig. 3B)showed that group 4 (i.e., the largest movers in X and β) showed greaterweight, lower height, more elevated blood pressure and reducedendurance compared to all others, highlighting that they clearly standout in terms of anthropometric features. Subjects from group 2 (thelowest movers) showed significantly better cognitive abilities comparedto all others in language proficiency and self-regulation. They also out-performed subjects from groups 3 and 4 (both larger mover subgroups) interms of working memory performance, spatial orientation abilities, andcognitive flexibility. Groups 1 and 2 differedmore subtly, mostly in termsof endurance (lower in group 1) and height (larger in group 2). Overall,mover subgroups can thus be subdivided in terms of a set of anthropo-metric and cognitive measures.
3.3. Subtler motion/behaviour relationships revealed by multivariateanalysis
Finally, we attempted to extract significant multivariate relationshipsbetween our spatio-temporal motion characteristics and the entirebreadth of anthropomorphic and behavioural features (Fig. 4).
There were four significant covariance components. Component 1 (p< 10�5) explained 79.94% of the data covariance. Its expression waslinked to quite uniform, significant motion across all spatial degrees offreedom, along all time bins, and across both sessions (Fig. 4A, left col-umn). The subjects expressing this component more positively had alarger weight and a more elevated blood pressure (Fig. 4B, first row).They showed a greater extent of sleep problems, and reduced cognitiveperformance across a broad range of domains including cognitive flexi-bility, inhibitory control, language abilities, processing speed, theory ofmind and working memory. Emotion recognition was impaired, andnegative affect more pronounced. This was also accompanied by worseendurance, a less daring personality, and a more antisocial, inattentive,externalising and aggressive character. When compared to the movergroups derived beforehand, the gradient in motion latent weights acrosssubjects appeared to discriminate low movers (group 2) from the largemovers in group 4 (Fig. 4C, top left panel).
Component 2 (p < 10�5) explained 7.74% of the covariance of thedata. It contrasted translational (X across sessions, Y in session 1, Z insession 2) and rotational (α and β) motion. Stronger rotational and lowertranslational movers showed smaller weight, height and blood pressure,lower fluid intelligence, as well as worse inhibitory control, spatialorientation and language abilities. They were less strong and had lower
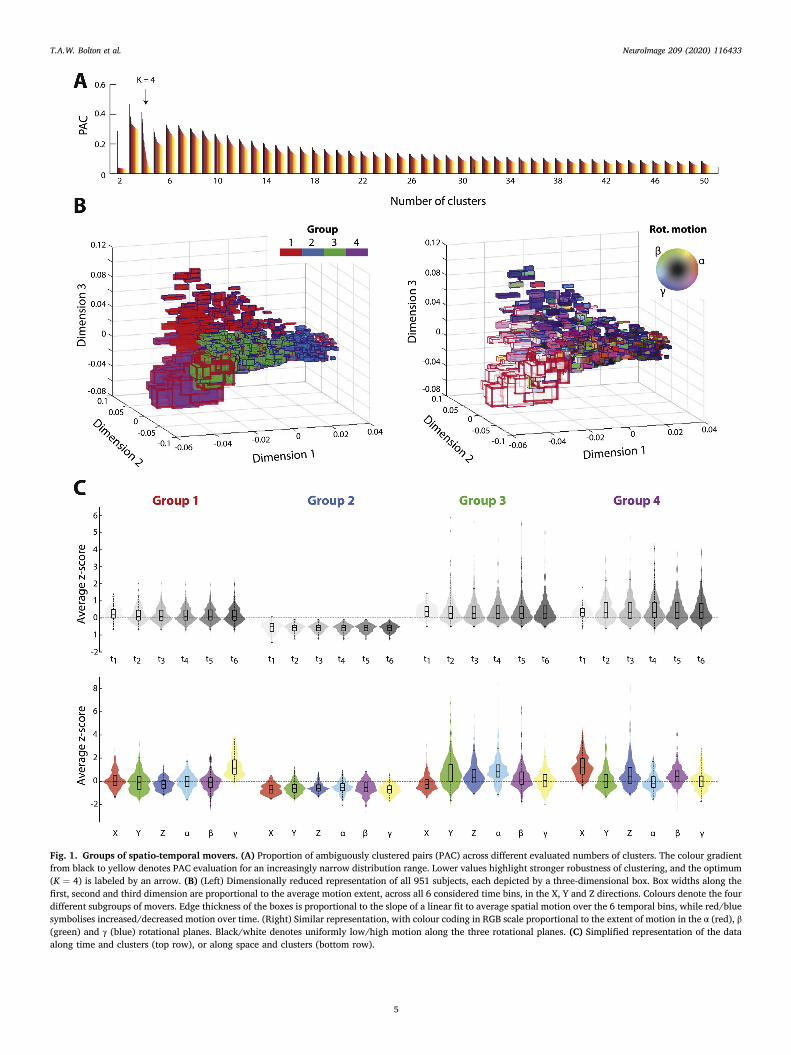
Fig. 1. Groups of spatio-temporal movers. (A) Proportion of ambiguously clustered pairs (PAC) across different evaluated numbers of clusters. The colour gradientfrom black to yellow denotes PAC evaluation for an increasingly narrow distribution range. Lower values highlight stronger robustness of clustering, and the optimum(K ¼ 4) is labeled by an arrow. (B) (Left) Dimensionally reduced representation of all 951 subjects, each depicted by a three-dimensional box. Box widths along thefirst, second and third dimension are proportional to the average motion extent, across all 6 considered time bins, in the X, Y and Z directions. Colours denote the fourdifferent subgroups of movers. Edge thickness of the boxes is proportional to the slope of a linear fit to average spatial motion over the 6 temporal bins, while red/bluesymbolises increased/decreased motion over time. (Right) Similar representation, with colour coding in RGB scale proportional to the extent of motion in the α (red), β(green) and γ (blue) rotational planes. Black/white denotes uniformly low/high motion along the three rotational planes. (C) Simplified representation of the dataalong time and clusters (top row), or along space and clusters (bottom row).
T.A.W. Bolton et al. NeuroImage 209 (2020) 116433
5
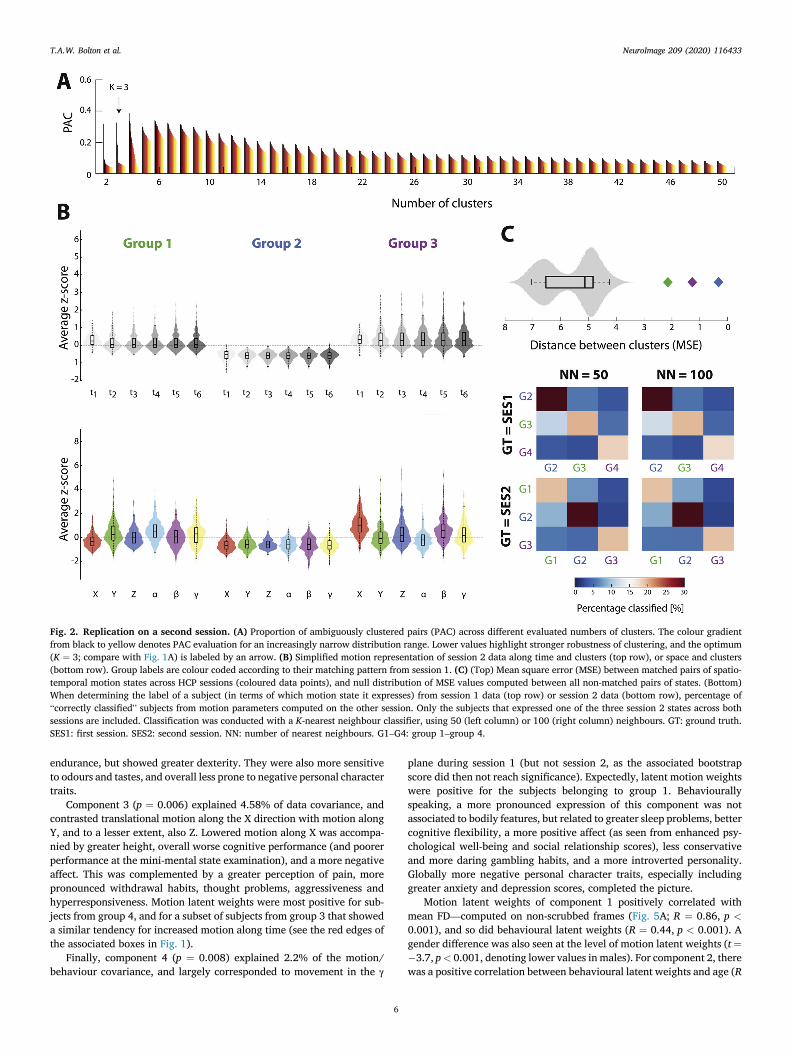
Fig. 2. Replication on a second session. (A) Proportion of ambiguously clustered pairs (PAC) across different evaluated numbers of clusters. The colour gradientfrom black to yellow denotes PAC evaluation for an increasingly narrow distribution range. Lower values highlight stronger robustness of clustering, and the optimum(K ¼ 3; compare with Fig. 1A) is labeled by an arrow. (B) Simplified motion representation of session 2 data along time and clusters (top row), or space and clusters(bottom row). Group labels are colour coded according to their matching pattern from session 1. (C) (Top) Mean square error (MSE) between matched pairs of spatio-temporal motion states across HCP sessions (coloured data points), and null distribution of MSE values computed between all non-matched pairs of states. (Bottom)When determining the label of a subject (in terms of which motion state it expresses) from session 1 data (top row) or session 2 data (bottom row), percentage of“correctly classified” subjects from motion parameters computed on the other session. Only the subjects that expressed one of the three session 2 states across bothsessions are included. Classification was conducted with a K-nearest neighbour classifier, using 50 (left column) or 100 (right column) neighbours. GT: ground truth.SES1: first session. SES2: second session. NN: number of nearest neighbours. G1–G4: group 1–group 4.
T.A.W. Bolton et al. NeuroImage 209 (2020) 116433
endurance, but showed greater dexterity. They were also more sensitiveto odours and tastes, and overall less prone to negative personal charactertraits.
Component 3 (p ¼ 0.006) explained 4.58% of data covariance, andcontrasted translational motion along the X direction with motion alongY, and to a lesser extent, also Z. Lowered motion along X was accompa-nied by greater height, overall worse cognitive performance (and poorerperformance at the mini-mental state examination), and a more negativeaffect. This was complemented by a greater perception of pain, morepronounced withdrawal habits, thought problems, aggressiveness andhyperresponsiveness. Motion latent weights were most positive for sub-jects from group 4, and for a subset of subjects from group 3 that showeda similar tendency for increased motion along time (see the red edges ofthe associated boxes in Fig. 1).
Finally, component 4 (p ¼ 0.008) explained 2.2% of the motion/behaviour covariance, and largely corresponded to movement in the γ
6
plane during session 1 (but not session 2, as the associated bootstrapscore did then not reach significance). Expectedly, latent motion weightswere positive for the subjects belonging to group 1. Behaviourallyspeaking, a more pronounced expression of this component was notassociated to bodily features, but related to greater sleep problems, bettercognitive flexibility, a more positive affect (as seen from enhanced psy-chological well-being and social relationship scores), less conservativeand more daring gambling habits, and a more introverted personality.Globally more negative personal character traits, especially includinggreater anxiety and depression scores, completed the picture.
Motion latent weights of component 1 positively correlated withmean FD—computed on non-scrubbed frames (Fig. 5A; R ¼ 0.86, p <
0.001), and so did behavioural latent weights (R ¼ 0.44, p < 0.001). Agender difference was also seen at the level of motion latent weights (t ¼�3.7, p< 0.001, denoting lower values in males). For component 2, therewas a positive correlation between behavioural latent weights and age (R

Fig. 3. Univariate links between spatio-temporal motion and anthropometry/cognition/personal character. (A) Across all 60 considered domains, Fisher scorein terms of discriminability across the four spatio-temporal mover groups. Black horizontal bars denote significance thresholds, derived non-parametrically andBonferroni-corrected for 60 tests. Grey bars denote significance thresholds upon FDR correction. The “[NEG]” label for a behavioural score reflects the fact that a morepositive value highlights a decrease in the assessed quantity. (B) For the 12 significant domain scores, post-hoc comparison of Fisher score values across moversubgroups. Positive values highlight stronger scores for the row group. One star (*) highlights significance without multiple testing corrections, and two stars (**)highlight significance upon Bonferroni correction for 72 tests (6 pair-wise comparisons for 12 scores). PicSeq: picture sequence memory. CardSort: dimensional changecard sort. PMAT: Penn progressive matrices. ReadEng: oral reading recognition. PicVocab: picture vocabulary. DDISC: delay discounting. VSPLOT: variable short Pennline orientation test. RT: response time. SCPT: short Penn continuous performance test. IWRD: Penn word memory test. ListSort: list sorting. ADHD: attention deficit/hyperactivity disorder. G1–G4: group 1–group 4.
T.A.W. Bolton et al. NeuroImage 209 (2020) 116433
¼ 0.21, p< 0.001), and a strongly significant gender difference seen bothfrom the viewpoint of motion latent weights (t ¼ �9.04, p < 0.001) andbehavioural latent weights (t ¼ �23.33, p < 0.001). Component 3 dis-played a significant gender difference for behavioural latent weights (t ¼7.35, p < 0.001). Finally, for component 4, behavioural latent weightsnegatively correlated with age (R ¼ �0.14, p < 0.001).
7
3.4. Validation on an independent dataset
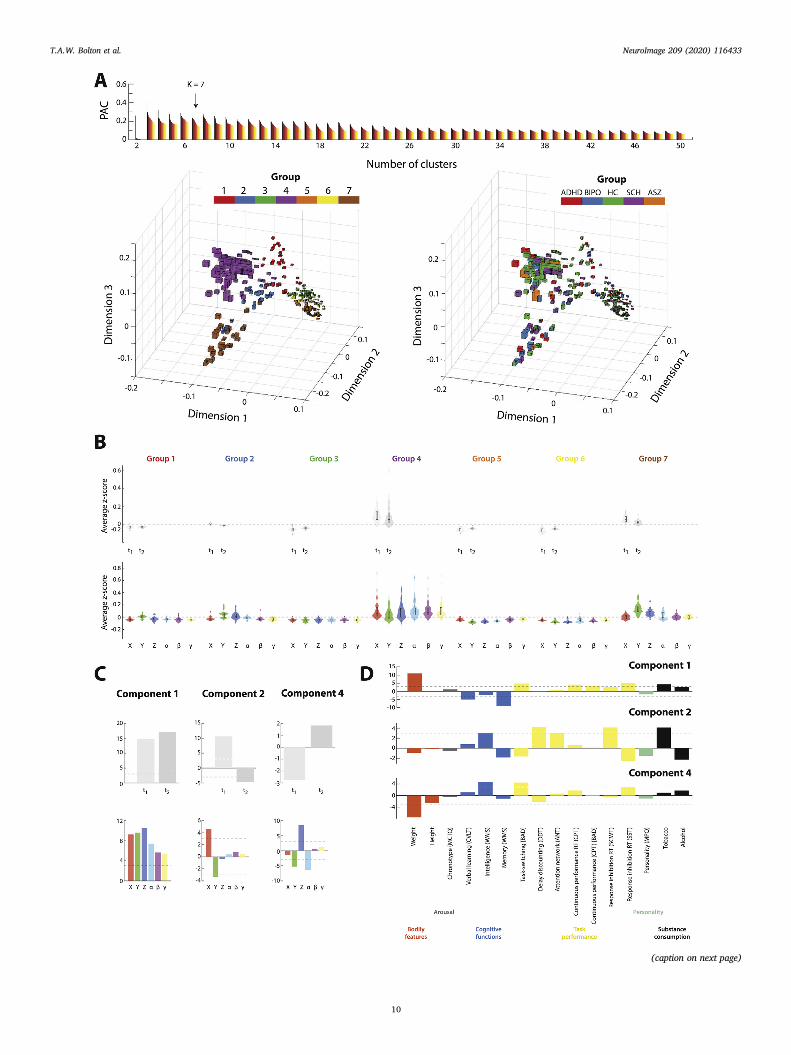
The results obtained on the UCLA dataset are presented in Fig. 6. Inthis case, movers were subdivided into 7 distinct subgroups (see Fig. 6A,where the PAC for K ¼ 7 reaches lower values than expected from theglobal trend). As seen from the low-dimensional summary representation

Fig. 4. Motion/behaviour covariance components. (A) For spatio-temporal motion saliences, bootstrap scores in terms of expression over time and spatial motionfeatures, for the first and second HCP sessions (top and bottom pairs of plots). Components 1 to 4 are presented from left to right, and significance thresholds (absolutebootstrap score larger than 3) are denoted by horizontal dashed lines. (B) Behavioural saliences for the four components (from top to bottom), with significancethresholds denoted by horizontal dashed lines. The “[NEG]” label for a behavioural score reflects the fact that a more positive value highlights a decrease in theassessed quantity. (C) For all four components, representation of motion latent weights in the dimensionally reduced space investigated in clustering analyses (seeFig. 1B). PicSeq: picture sequence memory. CardSort: dimensional change card sort. PMAT: Penn progressive matrices. ReadEng: oral reading recognition. PicVocab:picture vocabulary. DDISC: delay discounting. VSPLOT: variable short Penn line orientation test. RT: response time. SCPT: short Penn continuous performance test.IWRD: Penn word memory test. ListSort: list sorting. ADHD: attention deficit/hyperactivity disorder.
T.A.W. Bolton et al. NeuroImage 209 (2020) 116433
8
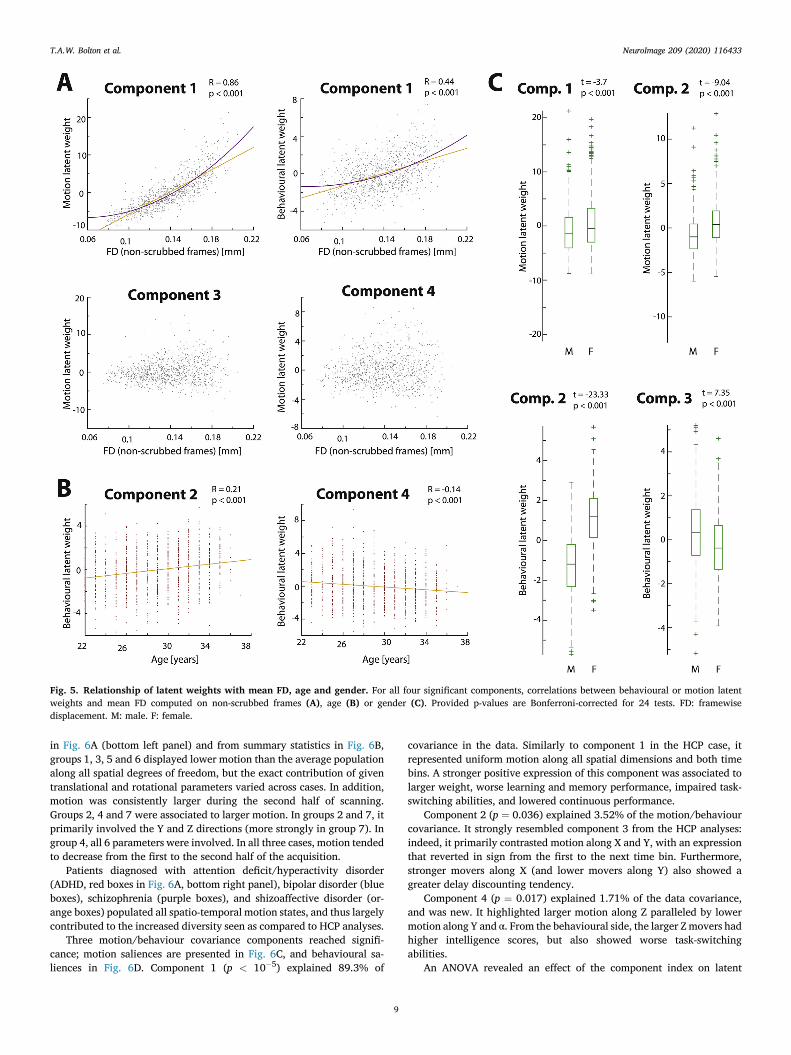
Fig. 5. Relationship of latent weights with mean FD, age and gender. For all four significant components, correlations between behavioural or motion latentweights and mean FD computed on non-scrubbed frames (A), age (B) or gender (C). Provided p-values are Bonferroni-corrected for 24 tests. FD: framewisedisplacement. M: male. F: female.
T.A.W. Bolton et al. NeuroImage 209 (2020) 116433
in Fig. 6A (bottom left panel) and from summary statistics in Fig. 6B,groups 1, 3, 5 and 6 displayed lower motion than the average populationalong all spatial degrees of freedom, but the exact contribution of giventranslational and rotational parameters varied across cases. In addition,motion was consistently larger during the second half of scanning.Groups 2, 4 and 7 were associated to larger motion. In groups 2 and 7, itprimarily involved the Y and Z directions (more strongly in group 7). Ingroup 4, all 6 parameters were involved. In all three cases, motion tendedto decrease from the first to the second half of the acquisition.
Patients diagnosed with attention deficit/hyperactivity disorder(ADHD, red boxes in Fig. 6A, bottom right panel), bipolar disorder (blueboxes), schizophrenia (purple boxes), and shizoaffective disorder (or-ange boxes) populated all spatio-temporal motion states, and thus largelycontributed to the increased diversity seen as compared to HCP analyses.
Three motion/behaviour covariance components reached signifi-cance; motion saliences are presented in Fig. 6C, and behavioural sa-liences in Fig. 6D. Component 1 (p < 10�5) explained 89.3% of
9
covariance in the data. Similarly to component 1 in the HCP case, itrepresented uniform motion along all spatial dimensions and both timebins. A stronger positive expression of this component was associated tolarger weight, worse learning and memory performance, impaired task-switching abilities, and lowered continuous performance.
Component 2 (p ¼ 0.036) explained 3.52% of the motion/behaviourcovariance. It strongly resembled component 3 from the HCP analyses:indeed, it primarily contrasted motion along X and Y, with an expressionthat reverted in sign from the first to the next time bin. Furthermore,stronger movers along X (and lower movers along Y) also showed agreater delay discounting tendency.
Component 4 (p ¼ 0.017) explained 1.71% of the data covariance,and was new. It highlighted larger motion along Z paralleled by lowermotion along Y and α. From the behavioural side, the larger Z movers hadhigher intelligence scores, but also showed worse task-switchingabilities.
An ANOVA revealed an effect of the component index on latent
(caption on next page)
T.A.W. Bolton et al. NeuroImage 209 (2020) 116433
10

Fig. 6. Results on validation dataset. (A) (Top) Proportion of ambiguously clustered pairs (PAC) across different evaluated numbers of clusters. The colour gradientfrom black to yellow denotes PAC evaluation for an increasingly narrow distribution range. Lower values highlight stronger robustness of clustering, and the optimum(K ¼ 7) is labeled by an arrow. (Bottom left) Dimensionally reduced representation of all 245 subjects, each depicted by a three-dimensional box. Box widths along thefirst, second and third dimension are proportional to the average motion extent, across both considered time bins, in the X, Y and Z directions. Colours denote theseven different subgroups of movers. (B) Simplified representation of the data along time and clusters (top row), or along space and clusters (bottom row). (C) Forspatio-temporal motion saliences, bootstrap scores in terms of expression over time and spatial motion features. Components 1, 2 and 4 are presented from left to right,and significance thresholds (absolute bootstrap score larger than 3) are denoted by horizontal dashed lines. (D) Behavioural saliences for the three components (fromtop to bottom), with significance thresholds denoted by horizontal dashed lines. The “[NEG]” label for a behavioural score reflects the fact that a more positive valuehighlights a decrease in the assessed quantity. ADHD: attention deficit/hyperactivity disorder. BIPO: bipolar disorder. HC: healthy control. SCH: schizophrenia. ASZ:schizoaffective disorder. MCTQ: Munich chronotype questionnaire. CVLT: California verbal learning test. WAIS: Wechsler adult intelligence scale. WMS: Wechslermemory scale. DDT: delay discounting task. ANT: attention network task. RT: response time. CPT: continuous performance task. SCWT: Stroop colour and word test.SST: stop signal task. MPQ: multidimensional personality questionnaire.
T.A.W. Bolton et al. NeuroImage 209 (2020) 116433
weights (F ¼ 10.83, p < 0.0001), as well as an effect of diagnosis (F ¼12.34, p < 0001). In addition, there was also a significant componentindex � diagnosis interaction (F ¼ 14.99, p < 0.0001), indicating thatmotion and behavioural latent weights are expressed with differentmagnitude across components in a way that depends on the diagnosis ofthe subject at hand. This parallels the findings from another PLS-basedinvestigation of functional connectivity/behaviour covariance, whichalso highlighted a diagnosis-dependent strength of expression (Kebetset al., 2019).
4. Discussion
4.1. A cartography of in-scanner spatio-temporal motion
In RS fMRI analyses, time points associated with excessive instanta-neous motion (as quantified by a composite FD score) are typicallyremoved/scrubbed. Two implied assumptions are made through thisprocess: the first is that motion in the retained, non-scrubbed time pointsis negligible and does not show any characteristic structure. The secondassumption is that FD is sufficient to characterise motion.
Our results question both of the above assumptions. Indeed, we wereable to separate scanned volunteers into four different mover subgroupseven when excluding time points with high motion as quantified by FD.These groups differed in the extent of motion displayed by subjects alongthe three translational (X, Y and Z) and three rotational (α, β and γ)motion directions, as well as in the temporal evolution of motion alongthe scanning session.
More specifically, a change in motion extent along the scanning ses-sion was observed, as seen by a significant time � group interaction inour ANOVA design, as well as by significantly non-null post-hoc regres-sion coefficients. The absence of time � space, or time � space � groupinteraction terms means that temporal changes were consistent across allmotion directions.
In space, there were strong group differences that contributed in largepart to the organisation revealed in the dimensionally reduced repre-sentation of Fig. 1B. Two mover subgroups were opposite extremes:group 2 subjects moved very little as compared to the average acrossspatial directions (hence depicted in black in Fig. 1B, right panel), whilethe subjects in group 4 consistently displayed very large displacements(hence represented in white), particularly along X, Z and β. Dis-tinguishing features of the last two groups were motion along Y and inthe α plane (group 3), or γ motion (group 1, as colour coded by a blueshade).
In addition to spatial motion properties, there were also significantchanges over time, and a closer inspection revealed that the main drive ofthis result was a modified extent of motion after the first sixth of thesession (see Fig. 1C): in subjects from group 4, motion increased after thefirst 2.4 min of recordings, while the opposite was seen for groups 1 and2.
Our replication analyses on a second HCP resting-state session (Fig. 2)enabled to clarify that these spatio-temporal motion characteristicsreflect a mix between subject traits and more punctual, session-specificsources: indeed, mover subgroups 2, 3 and 4 were found back in the
11
second session recordings, and the subjects that belonged to one during asession most often stayed in the same during the other run. This meansthat these motion configurations are inherent traits of the subjects, whowill always show an individualised motion profile.
Subjects from group 1, which highlighted γ motion, only expressedthat particular motion state during session 1. This implies that γmotion isnot a permanent trait, but rather denotes the adjustment to the scannerenvironment at the very start of an acquisition (indeed, in HCP re-cordings, session 1 is acquired immediately after the subject is positionedin the scanner, and session 2 is then acquired consecutively), as furthersupported by the fact that expression of that motion configurationsignificantly decreased along the course of session 1. This hypothesis isalso corroborated by our validation analyses: γ motion was not detectedthere, as in UCLA acquisitions, a structural scan precedes the acquisitionof the resting-state data.
The need for a few minutes before setting into a motion steady state,and presence of punctual, session-specific motion profiles, raise thepossibility of generally unaccounted sources of bias in the data, eitheracross resting-state sessions (if consecutively acquired), or even instructural scans if acquired first upon moving the subject in the scanner.Future work should more exhaustively investigate this possibility byrelating individual motion specificities to imaging features per se.
All in all, the presence of strongly differing spatial motion profilesacross subjects confirms the importance of subject-level motion correc-tion strategies through regression. Further, since our work focused oninstantaneous motion (t to tþ1 changes), our results may be interpretedas an additional argument in favour of more complete regression models,at least to the point of incorporating motion time courses and theirshifted counterparts (see below, however, for a more completediscussion).
Rather than considering four subgroups of movers, another perhapsmore relevant interpretation of our data is the presence of several axes ofmotion: the first is a global component, homogeneous across space. It isseen as the first dimension in our spectral clustering investigations(Fig. 1B), positioning it as the major discriminating factor across subjects.It is also found back as the first, most prominent component in thefollowing PLS analysis (Fig. 4A, left column). Other more subtle, butnonetheless significant spatial motion combinations then add up on top:for example, motion along the γ plane is jointly captured in dimensions 2and 3 in spectral clustering, and component 4 in the PLS analysis.
The two methodological approaches employed strongly differ in theircore properties: spectral clustering is a hard clustering technique inwhich each subject can only be assigned to one group, while PLS de-scribes the motion properties of each subject as a linear combination ofmotion saliences that co-vary with anthropometry and behaviour. Theconvergent findings obtained from both analytical perspectivesstrengthen our newly revealed cartography of spatio-temporal movers asa non-negligible feature. Furthermore, the fact that we also clearlydelineate a discrete set of mover subgroups in an independent validationdataset (Fig. 6A/B) is evidence that this spatio-temporal complexity is notspecific to fast TR acquisitions, but generalises to other more typicaldatasets.
Our findings question the accuracy of most motion correction
T.A.W. Bolton et al. NeuroImage 209 (2020) 116433
assessment approaches, which exclusively rely on averaged FD over time.A separate assessment across motion parameters (or more elaborate ap-proaches involving specific weighted combinations, such as our PLSmotion saliences) appears necessary to better understand which motionimpacts are removed, and which subsist in the data.
4.2. Agito ergo sum: bodily and behavioural underpinnings of motion
In 1644, Rene Descartes, in quest for a primal principle at the root ofall knowledge, formulated his notorious “cogito ergo sum” (I think,therefore I am).4 375 years later, we wish to summarise our findings byreformulating his words: “agito ergo sum” (I move, hence I am). By this,we mean that the defining aspects of someone (one’s bodily features,abilities to interact with the world and ways to respond to the environ-ment around) are reflected, in various and subtle ways, in how one movesduring scanning.
As an example of this principle, while subjects from groups 1 and 2moved less after the first sixth of the recording session, high movers fromgroup 4 moved more. Univariate evaluation following spectral clusteringrevealed that the latter mostly stood out in terms of anthropometric orfitness measures (Fig. 3B): weight, height, blood pressure and endurance.Conversely, group 2 subjects stood out by their better cognitive abilities.
These observations enable to sketch a global picture of how theresponse to the scanning environment differs across subjects: lowmovers, who are able to efficiently cope with changes in environmentalconditions and self-regulate themselves (for example, by better adjustingto the loud MRI noise fluctuations), rapidly start moving less and main-tain overall low head motion throughout scanning. Large movers, on theother hand, are intrinsically more prone to large head motions, possiblybecause of feeling more cramped inside the scanner, and becomeincreasingly uneasy with the contiguous MRI environment, thus movingmore.
A caveat of univariate approaches is the risk that more subtlebehavioural correlates of motion remain undetected. Our follow-upmultivariate PLS analysis confirmed this limitation: motion saliencesfrom the most prominent component (Fig. 4A, left panel) were positiveacross space and time, with an increase following the first session sixth.This means that subjects expressing this component more strongly movemore overall, and vice versa, as also confirmed by a strong positive cor-relation with FD (Fig. 5A, top row). This component thus highlightssimilar motion features as the ones discriminating mover groups 2 and 4.The array of associated behavioural saliences not only included thedominating anthropometric factors mentioned above, but also showedthat larger movers have lower fluid intelligence and perform worse intheory of mind or relational tasks. Further, they also exhibit moreaggressiveness, inattention and antisocial behaviours.
Overall, this global pattern is highly reminiscent of a positive-negative mode of population covariation previously described by Smithand colleagues (Smith et al., 2015), and put forward as relating behav-iour, demographics and FC. The similarity may partly come from the factthat the authors resorted to Canonical Correlation Analysis (CCA), amultivariate technique with strong similarities to PLS. Our results raisethe possibility that this mode may, at least in part, reflect differences inmotion across the considered subjects.
The main PLS component highlights the dominating factor of motion/behaviour covariance. On top of it, we also revealed subtler overlappingfactors. Component 2 contrasted motion along the X/Y/Z translationaldirections and the α/β rotational planes (i.e., more strongly expressingsubjects move more rotationally, but less translationally). Positive mo-tion and behavioural latent weights were seen in females, while theopposite was seen for male subjects (Fig. 5C), implying that gender maybe an underlying cause of that particular motion pattern. α reflects roll,
4 The first mention of that particular formulation indeed dates back from thePrincipia philosophiae, published in 1644.
12
occurring in the plane spanned by the X axis: motions along α and X arethus biophysically constrained to occur concurrently. The differentialrecruitment of both motions across genders may result from distinctanthropometric factors (larger weight, height and blood pressure inmales), or from behavioural specificities of one of the genders.
Component 3 primarily contrasted motion between the X and Ytranslational planes, and like component 1, was retrieved in both the HCPand UCLA datasets. When jointly considering the motion saliences overtime and space, one can understand this component as representing ashift, over time, from a configuration where X motion is stronger, to onewhen motion along Y takes over. Furthermore, this change occurs afterthe first 2.4 min of scanning, as the temporal salience weights thenlargely increase from around 0 (HCP session 1), or even revert in sign(HCP session 2 and UCLA). This adjustment of motion over the course ofthe acquisition arises from a mix between a large set of anthropometricfactors, cognitive abilities and personality character traits, as seen fromthe broad repertoire of significant behavioural salience weights.
Component 4 specifically showcased the γ motion seen in group 1:those subjects that express it strongly move a lot along γ. Note that, inaccordance with our results obtained from spectral clustering, γ motiononly occurs during session 1, but not session 2 (the bootstrap score doesthen not reach significance). No significant anthropometric associationswere detected, but the subjects expressing component 4 showed strongersleep disturbances, better cognitive flexibility, as well as a more intro-verted personality. This was accompanied by a wide scope of elevatedpersonal character trait scores, including anxiety, attention problems,aggressiveness, depression and hyper-responsiveness.
We conjecture that this component may reflect efforts of the subjectsto refrain from moving in the scanner: indeed, head motion along γ re-flects yaw, and may highlight attempts at limiting translational dis-placements along X or Z by forcing the head to remain anchored on thebed. The efforts leading to this typical motion signature may be regulatedby the subjects’ good cognitive abilities, and were perhaps influenced bytheir personal character traits. This extra care at limiting motion thendissipates progressively along recording time, and is not exerted anymoreduring subsequent acquisitions.
Interestingly, the expression of components 2 and 4 also correlatedwith age, despite considering a relatively narrow age range in the presentstudy (between 26 and 35 years old). Since head motion has been acentral question in developmental studies, it will be interesting toexamine, in future work, whether the characterisation of motion in termsof the translational/rotational balance (component 2), or along γ(component 4), may be a better strategy than through FD (especiallygiven that component 1, accounting for the global motion effect, showedno significant relationship to age).
In addition to the above, we note an interesting dependence betweenmotion latent weights and mean FD in the case of components 3 and 4: ascan be seen in the associated plots from Fig. 5A, these weights areexpressed with larger magnitude in larger movers, but with a polaritythat varies from a subject to the other, as seen by a V-shaped profile in theplots. The interpretation is that in a given subject, there is a baseline levelof overall uniform motion along space and time (symbolised by compo-nent 1); on top of this, additional trends add up in the case of larger meanFD subjects, and render the motion/behaviour relationships more com-plex in ways that are space- and time-dependent, and differentiallyimplicate anthropometric and cognitive scores.
4.3. Implications, limitations and future perspectives
Our results have strong implications regarding RS fMRI studies:indeed, the observation that a broad array of behavioural and clinicalcharacteristics relate to motion implies that the scope of studies reportingpossibly biased findings with regard to clinical or cognitive group-levelcomparisons is perhaps much wider than envisaged so far. On top ofpreviously questioned results regarding fluid intelligence (Finn et al.,2015)—see Fig. 6 of Siegel et al. (2016), former reports focusing on
T.A.W. Bolton et al. NeuroImage 209 (2020) 116433
sustained attention (Rosenberg et al., 2016) or extraversion (Hsu et al.,2018) may also need to be reconsidered.
Earlier on, we discussed how the widely used extended subject-levelregression designs enable to remove the spatio-temporally complexmotion effects introduced here. However, their intricate and overlappingrelationships with behaviour raise the danger that, akin to includingaverage FD as a covariate in group-level analyses, an unwanted bias withregard to clinical or cognitive analyses occurs at the single-subject levelstage.
Assume, for example, that an experimenter is interested in studyingpsychological well-being through assessments of FC at rest. From ourresults, subjects with a greater positive affect will exhibit a modulatedamount of motion along the γ axis, in a way that remains constant frompast the first few minutes of an acquisition (Figs. 1C and 4A). The use of aregressor encoding instantaneous motion changes along γ, as suggestedby most for optimal data preprocessing, may result in the removal of alarger signal fraction in individuals with more elevated psychologicalwell-being, possibly leading to the underestimation of the effect of in-terest. For this reason, we encourage experimenters, in future analyses, toinvestigate the fitting coefficients obtained upon regression so that it canbe verified whether a link exists between the extent of removed signal,and the behavioural feature of interest.
Of course, the exact impact of the regression step will depend on theprecise temporal expression of γ motion and of positive affect-relatedfMRI fluctuations, since one fitting coefficient is extracted dependingon frame-wise similarities between the considered motion and the voxel-wise fMRI time courses. The obvious next step to perform, and the majorlimitation of the present analyses, is that we have not yet pushed ourexploration to the level of fMRI time courses, but focused on motionestimates only. Our aim, with this report, was not to design a new effi-cient motion correction strategy, but to dig into the complexity of motionper se, and by this mean, put forward possible caveats and improvementsof existing approaches. Our code and results are fully available athttps://c4science.ch/source/MOT_ANA.git, and we encourage theinterested researchers to extend our current investigations at the level ofthe fMRI signal.
A second limitation of our work is that we solely analysed head mo-tion, although many more factors are known to corrupt the fMRI signal(Bianciardi et al., 2009; Birn, 2012; Liu, 2016). In addition, particularlyimportant for the present analyses is the recent demonstration that anarray of physiology-driven components directly contribute to the motiontime courses themselves: in the specific case of fast TR acquisitions, as forthe HCP data considered here, respiratory artefacts become particularlypronounced, and include mechanical motion of the head due to respi-ration, as well as quasi-periodic perturbations of the magnetic fieldresulting in additional pseudomotion components in the data (Chen et al.,2019).
Power et al. (2019a) further clarified that at least 5 distinctrespiration-related sources of motion are present in fast TR data: first,real motion along Z and β arises at the frequency of the respiratory cycle;second, additional true motion contributions come from short-lived ep-isodes of deep breathes; third, pseudomotion at the respiratory frequencyalso contaminates the phase-encode direction (in the case of HCP data,the X direction); fourth, deep breathes result in further pseudomotion at alower frequency around 0.12 Hz; fifth, motion along Y and Z is alsomodulated by the respiratory envelope. “True”, punctuate head motions,add to these, as well as “bleeding” of respiration-induced oscillationsfrom the main axes that are involved to the others.
At least part of the reported findings here can be expected to relate tosuch respiratory influences: the fact that weight and height significantlycontributed to all but one of the significant PLS components is an indi-cation towards this, as body mass index is strongly tied to respiratory rateas well as pseudomotion effects, due to different biophysical subjectproperties (Power et al., 2019a). Future analyses shall clarify the exactcontribution of respiration to our findings, for instance by resorting tovarious filtering strategies; however, such approaches are not trivial to
13
implement, as physiological rhythms occur at different frequencies acrosssubjects, and overlaps between pseudomotion-related and truemotion-related frequency spans occurs in some, but not all, cases.
It is important to specify that although regression-based approachesare one of the major preprocessing avenues, other motion correctionalternatives also exist and may less suffer from possible biases; theyinclude original twists on traditional regression designs (Patriat et al.,2015, 2017), more sophisticated variants over scrubbing (Patel andBullmore, 2015; Yang et al., 2019), and methods relying on an inde-pendent component analysis (ICA) decomposition of the data (Salimi--Khorshidi et al., 2014; Pruim et al., 2015).
Future motion correction strategies shall improve over current ones inseveral ways: first, through more elaborate acquisition schemes, such aswith multi-echo sequences (Power et al., 2018); second, through theexploration of other complementary denoising strategies, such as withfMRI simulators (Drobnjak et al., 2006) or prospective correction (Zait-sev et al., 2017); third, and perhaps most importantly, through an effi-cient cross-talk across these strategies. For example, it was recentlyshown that the use of customised head molds reduces motion duringscanning on young subjects (Power et al., 2019b); this could be pushedfurther by orienting the design in subject-specific manner, using motioncharacteristics such as the ones described here.
5. Conclusion
We demonstrated that headmotion in the MR scanner during RS fMRIacquisitions, an infamous confounding factor of this imaging modality,exhibits spatio-temporal structure that is not fully accounted for bymotion correction strategies. Strikingly, one’s motion characteristics caninform not only about one’s anthropometry, but, more surprisingly,about one’s behaviour and psychiatric functions. We hope that ourfindings will lead future clinical or cognitive fMRI studies to probe moreextensively for the presence of motion-related artefacts.
Authors’ contributions
Thomas Bolton performed all the analyses, and wrote the manuscript.Valeria Kebets provided the behavioural data of the validation dataset.Enrico Glerean provided the motion time courses of the validationdataset. Daniela Z€oller provided a Partial Least Squares MATLABimplementation from which part of the performed analyses were devel-oped. Jingwei Li and Thomas Yeo provided the behavioural data of themain dataset. C�esar Caballero-Gaudes and Dimitri Van De Ville providedextensive suggestions of improvement regarding the analyses and themanuscript content. All authors reread the manuscript.
Appendix A. Supplementary data
Supplementary data to this article can be found online at https://doi.org/10.1016/j.neuroimage.2019.116433.
References
Achenbach, T.M., 2009. The Achenbach System of Empirically Based Assessment(ASEBA): Development, Findings, Theory, and Applications. University of Vermont,Research Center for Children, Youth & Families.
Barch, D.M., Burgess, G.C., Harms, M.P., Petersen, S.E., Schlaggar, B.L., Corbetta, M.,Glasser, M.F., Curtiss, S., Dixit, S., Feldt, C., et al., 2013. Function in the humanconnectome: task-fMRI and individual differences in behavior. Neuroimage 80,169–189.
Bianciardi, M., Fukunaga, M., van Gelderen, P., Horovitz, S., de Zwart, J., Shmueli, K.,Duyn, J., 2009. Sources of functional magnetic resonance imaging signal fluctuationsin the human brain at rest: a 7 T study. Magn. Reson. Imag. 27, 1019–1029. https://doi.org/10.1016/j.mri.2009.02.004 pmid:19375260.
Birn, R.M., 2012. The role of physiological noise in resting-state functional connectivity.Neuroimage 62, 864–870. https://doi.org/10.1016/j.neuroimage.2012.01.016pmid:22245341.
Biswal, B., Zerrin Yetkin, F., Haughton, V.M., Hyde, J.S., 1995. Functional connectivity inthe motor cortex of resting human brain using echo-planar mri. Magn. Reson. Med.34, 537–541.

T.A.W. Bolton et al. NeuroImage 209 (2020) 116433
Bright, M.G., Murphy, K., 2015. Is fMRI “noise” really noise? Resting state nuisanceregressors remove variance with network structure. Neuroimage 114, 158–169.https://doi.org/10.1016/j.neuroimage.2015.03.070 pmid:25862264.
Burgess, G.C., Kandala, S., Nolan, D., Laumann, T.O., Power, J.D., Adeyemo, B.,Barch, D.M., 2016. Evaluation of denoising strategies to address motion-correlatedartifacts in resting-state functional magnetic resonance imaging data from the humanconnectome project. Brain Connect. 6, 669–680. https://doi.org/10.1089/brain.2016.0435 pmid:27571276.
Buysse, D.J., et al., 1989. The Pittsburgh Sleep Quality Index: a new instrument forpsychiatric practice and research. Psychiatry Res. 28, 193–213. https://doi.org/10.1016/0165-1781(89)90047-4 pmid:2748771.
Caballero-Gaudes, C., Reynolds, R.C., 2017. Methods for cleaning the BOLD fMRI signal.Neuroimage 154, 128–149. https://doi.org/10.1016/j.neuroimage.2016.12.018.https://ac.els-cdn.com/S1053811916307418/1-s2.0-S1053811916307418-main.pdf?{_}tid¼4d9da1b6-0cf3-11e8-b44b-00000aab0f26{&}acdnat¼1518110155{_}67628ffd221945d1474611a55f364f34.
Chen, J., Liu, J., Calhoun, V.D., 2019. Translational potential of neuroimaging genomicanalyses to diagnosis and treatment in mental disorders. Proc. IEEE 107, 912–927.
Ciric, R., Rosen, A.F., Erus, G., Cieslak, M., Adebimpe, A., Cook, P.A., Satterthwaite, T.,2018. Mitigating head motion artifact in functional connectivity MRI. Nat. Protoc. 13,2801. https://doi.org/10.1038/s41596-018-0065-y pmid:30446748.
Ciric, R., Wolf, D.H., Power, J.D., Roalf, D.R., Baum, G.L., Ruparel, K., Shinohara, R.T.,Elliott, M.A., Eickhoff, S.B., Davatzikos, C., Gur, R.C., Gur, R.E., Bassett, D.S.,Satterthwaite, T.D., 2017. Benchmarking of participant-level confound regressionstrategies for the control of motion artifact in studies of functional connectivity.Neuroimage 154, 174–187. https://doi.org/10.1016/j.neuroimage.2017.03.020arXiv:1608.03616. https://ac.els-cdn.com/S1053811917302288/1-s2.0-S1053811917302288-main.pdf?{_}tid¼4031e1d6-10bd-11e8-a578-00000aab0f02{&}acdnat¼1518526745{_}cc06c9eb781f7de222d112ec786e613d.
Couvy-Duchesne, B., Blokland, G.A.M., Hickie, I.B., Thompson, P.M., Martin, N.G., deZubicaray, G.I., McMahon, K.L., Wright, M.J., 2014. Heritability of head motionduring resting state functional mri in 462 healthy twins. Neuroimage 102, 424–434.
Couvy-Duchesne, B., Ebejer, J.L., Gillespie, N.A., Duffy, D.L., Hickie, I.B.,Thompson, P.M., Martin, N.G., de Zubicaray, G.I., McMahon, K.L., Medland, S.E.,et al., 2016. Head motion and inattention/hyperactivity share common geneticinfluences: implications for fmri studies of adhd. PLoS One 11, 0146271.
Damoiseaux, J.S., Rombouts, S.A.R., Barkhof, F., Scheltens, P., Stam, C.J., Smith, S.M.,Beckmann, C.F., 2006. Consistent resting-state networks across healthy subjects.Proc. Natl. Acad. Sci. 103, 13848–13853. https://doi.org/10.1073/pnas.0601417103. http://www.pnas.org/content/103/37/13848.short.
Deen, B., Pelphrey, K., 2012. Perspective: brain scans need a rethink. Nature 491, 20.https://doi.org/10.1038/491S20a pmid:23136657.
Drobnjak, I., Gavaghan, D., Süli, E., Pitt-Francis, J., Jenkinson, M., 2006. Development ofa functional magnetic resonance imaging simulator for modeling realistic rigid-bodymotion artifacts. Magn. Reson. Med. 56, 364–380.
Ekhtiari, H., Kuplicki, R., Yeh, H., Paulus, M.P., 2019. Physical characteristics notpsychological state or trait characteristics predict motion during resting state fmri.Sci. Rep. 9, 419.
Engelhardt, L.E., Roe, M.A., Juranek, J., DeMaster, D., Harden, K.P., Tucker-Drob, E.M.,Church, J.A., 2017. Children’s head motion during fmri tasks is heritable and stableover time. Dev. Cogn. Neurosci. 25, 58–68.
Finn, E.S., et al., 2015. Functional connectome fingerprinting: identifying individualsusing patterns of brain connectivity. Nat. Neurosci. 18, 1664. https://doi.org/10.1038/nn.4135 pmid:26457551.
Folstein, M.F., Lee, N.R., Helzer, J.E., 1983. The mini-mental state examination, 812–812Arch. Gen. Psychiatr. 40. https://doi.org/10.1001/archpsyc.1983.01790060110016.pmid:6860082.
Fox, M.D., Greicius, M., 2010. Clinical applications of resting state functionalconnectivity. Front. Syst. Neurosci. 4, 19. https://doi.org/10.3389/fnsys.2010.00019pmid:20592951.
Friston, K.J., Williams, S., Howard, R., Frackowiak, R.S.J., Turner, R., 1996. Movement-related effects in fMRI time-series. Magn. Reson. Med. 35, 346–355. https://doi.org/10.1002/mrm.1910350312.
Garrett, D.D., Kovacevic, N., McIntosh, A.R., Grady, C.L., 2010. Blood oxygen level-dependent signal variability is more than just noise. J. Neurosci. 30, 4914–4921.
Gershon, R.C., et al., 2010. Assessment of neurological and behavioural function: the NIHtoolbox. Lancet Neurol. 9, 138–139. https://doi.org/10.1016/S1474-4422(09)70335-7 pmid:20129161.
Gu, Q., Li, Z., Han, J., 2012. Generalized Fisher Score for Feature Selection. ArXiv (DOI:1202.3725).
Hodgson, K., Poldrack, R.A., Curran, J.E., Knowles, E.E., Mathias, S., G€oring, H.H.H.,Yao, N., Olvera, R.L., Fox, P.T., Almasy, L., et al., 2016. Shared genetic factorsinfluence head motion during mri and body mass index. Cerebr. Cortex 27,5539–5546.
Hsu, W.T., Rosenberg, M.D., Scheinost, D., Constable, R.T., Chun, M.M., 2018. Resting-state functional connectivity predicts neuroticism and extraversion in novelindividuals. Soc. Cogn. Affect. Neurosci. 13, 224–232. https://doi.org/10.1093/scan/nsy002 pmid:29373729.
Jenkinson, M., Bannister, P., Brady, M., Smith, S.M., 2002. Improved optimization for therobust and accurate linear registration and motion correction of brain images.Neuroimage 17, 825–841.
Jenkinson, M., Beckmann, C.F., Behrens, T.E.J., Woolrich, M.W., Smith, S.M., 2012. FSL.Neuroimage 62, 782–790.
Kebets, V., Holmes, A.J., Orban, C., Tang, S., Li, J., Sun, N., Kong, R., P, R.A., Yeo, B.T.T.,2019. Somatosensory-motor dysconnectivity spans multiple transdiagnosticdimensions of psychopathology. Biol. Psychiatry 86, 779–791.
14
Kong, X., Zhen, Z., Li, X., Lu, H., Wang, R., Liu, L., He, Y., Zang, Y., Liu, J., 2014.Individual differences in impulsivity predict head motion during magnetic resonanceimaging. PLoS One 9, 104989.
Krishnan, A., Williams, L.J., McIntosh, A.R., Abdi, H., 2011. Partial least squares (PLS)methods for neuroimaging: a tutorial and review. Neuroimage 56, 455–475. https://doi.org/10.1016/j.neuroimage.2010.07.034. http://www.sciencedirect.com/science/article/pii/S1053811910010074.
Kuhn, H.W., 1955. The Hungarian method for the assignment problem. Nav. Res. Logist.Q. 2, 83–97.
Laumann, T.O., Snyder, A.Z., Mitra, A., Gordon, E.M., Gratton, C., Adeyemo, B.,Gilmore, A.W., Nelson, S.M., Berg, J.J., Greene, D.J., et al., 2016. On the stability ofbold fmri correlations. Cerebr. Cortex 27, 4719–4732.
Lemieux, L., Salek-Haddadi, A., Lund, T.E., Laufs, H., Carmichael, D., 2007. Modellinglarge motion events in fMRI studies of patients with epilepsy. Magn. Reson. Imag. 25,894–901. https://doi.org/10.1016/j.mri.2007.03.009. https://ac.els-cdn.com/S0730725X07002214/1-s2.0-S0730725X07002214-main.pdf?{_}tid¼92ab5ebe-10e1-11e8-896b-00000aab0f6b{&}acdnat¼1518542345{_}95c2427b8c8503be33bf2746e05ba024.
Liu, T.T., 2016. Noise contributions to the fMRI signal: an overview. Neuroimage 143,141–151. https://doi.org/10.1016/j.neuroimage.2016.09.008 pmid:27612646.
Makowski, C., Lepage, M., Evans, A., 2019. Head motion: the dirty little secret ofneuroimaging in psychiatry. J. Psychiatry Neurosci. 44, 62. https://doi.org/10.1503/jpn.180022 pmid:30565907.
McCrae, R.R., Costa Jr., P.T., 2004. A contemplated revision of the neo five-factorinventory. Personal. Individ. Differ. 36, 587–596.
McIntosh, A.R., Lobaugh, N.J., 2004. Partial least squares analysis of neuroimaging data:applications and advances. Neuroimage 23, 250–263. https://doi.org/10.1016/j.neuroimage.2004.07.020. http://www.sciencedirect.com/science/article/pii/S1053811904003866.
Parkes, L., Fulcher, B., Yücel, M., Fornito, A., 2018. An evaluation of the efficacy,reliability, and sensitivity of motion correction strategies for resting-state functionalMRI. Neuroimage 171, 415–436. https://doi.org/10.1016/j.neuroimage.2017.12.073 pmid:29278773.
Patel, A.X., Bullmore, E.T., 2015. A wavelet-based estimator of the degrees of freedom indenoised fmri time series for probabilistic testing of functional connectivity and braingraphs. Neuroimage 142, 14–26.
Patriat, R., Molloy, E.K., Birn, R.M., 2015. Using edge voxel information to improvemotion regression for rs-fMRI connectivity studies. Brain Connect. 5, 582–595.https://doi.org/10.1089/brain.2014.0321 pmid:26107049.
Patriat, R., Reynolds, R.C., Birn, R.M., 2017. An improved model of motion-related signalchanges in fMRI. Neuroimage 144, 74–82. https://doi.org/10.1016/j.neuroimage.2016.08.051 pmid:27570108.
Poldrack, R.A., Congdon, E., Triplett, W., Gorgolewski, K.J., Karlsgodt, K.H.,Mumford, J.A., Sabb, F.W., Freimer, N.B., London, E.D., Cannon, T.D., et al., 2016.A phenome-wide examination of neural and cognitive function. Sci. Data 3, 160110.
Power, J.D., Barnes, K.A., Snyder, A.Z., Schlaggar, B.L., Petersen, S.E., 2012. Spurious butsystematic correlations in functional connectivity MRI networks arise from subjectmotion. Neuroimage 59, 2142–2154.
Power, J.D., Cohen, A.L., Nelson, S.M., Wig, G.S., Barnes, K.A., Church, J.A., Vogel, A.C.,Laumann, T.O., Miezin, F.M., Schlaggar, B.L., et al., 2011. Functional networkorganization of the human brain. Neuron 72, 665–678.
Power, J.D., Mitra, A., Laumann, T.O., Snyder, A.Z., Schlaggar, B.L., Petersen, S.E., 2014.Methods to detect, characterize, and remove motion artifact in resting state fMRI.Neuroimage 84, 320–341. https://doi.org/10.1016/j.neuroimage.2013.08.048arXiv:NIHMS150003. http://linkinghub.elsevier.com/retrieve/pii/S1053811913009117.
Power, J.D., Plitt, M., Gotts, S.J., Kundu, P., Voon, V., Bandettini, P.A., Martin, A., 2018.Ridding fMRI data of motion-related influences: removal of signals with distinctspatial and physical bases in multiecho data. Proc. Natl. Acad. Sci. 115, 2105–2114.https://doi.org/10.1073/pnas.1720985115 pmid:29440410.
Power, J.D., Schlaggar, B.L., Petersen, S.E., 2015. Recent progress and outstanding issuesin motion correction in resting state fmri. Neuroimage 105, 536–551.
Power, J.D., Silver, B.M., Dubin, M.J., Martin, A., Jones, R.M., 2019a. Distinctions AmongReal and Apparent Respiratory Motions in Human fMRI Data.
Power, J.D., Silver, B.M., Silverman, M.R., Ajodan, E.L., Bos, D.J., Jones, R.M., 2019b.Customized head molds reduce motion during resting state fmri scans. Neuroimage189, 141–149.
Preti, M.G., Bolton, T.A.W., Van De Ville, D., 2017. The dynamic functional connectome:state-of-the-art and perspectives. Neuroimage 160, 41–54. https://doi.org/10.1016/j.neuroimage.2016.12.061 arXiv:1511.02976. https://ac.els-cdn.com/S1053811916307881/1-s2.0-S1053811916307881-main.pdf?{_}tid¼740fef8f-835b-4993-86d3-a6f60b841679{&}acdnat¼1523360042{_}29ea611d8892cbd9e44c8ac92ff16e62.
Pruim, R.H., Mennes, M., van Rooij, D., Llera, A., Buitelaar, J.K., Beckmann, C.F., 2015.ICA-AROMA: a robust ICA-based strategy for removing motion artifacts from fMRIdata. Neuroimage 112, 267–277. https://doi.org/10.1016/j.neuroimage.2015.02.064 pmid:25770991.
Rosenberg, M.D., Finn, E.S., Scheinost, D., Papademetris, X., Shen, X., Constable, R.T.,Chun, M.M., 2016. A neuromarker of sustained attention from whole-brain functionalconnectivity. Nat. Neurosci. 19, 165. https://doi.org/10.1038/nn.4179 pmid:26595653.
Salimi-Khorshidi, G., Douaud, G., Beckmann, C., Glasser, M., Griffanti, L., Smith, S., 2014.Automatic denoising of functional MRI data: combining independent componentanalysis and hierarchical fusion of classifiers. Neuroimage 90, 449–468. https://doi.org/10.1016/j.neuroimage.2013.11.046 pmid:24389422.

T.A.W. Bolton et al. NeuroImage 209 (2020) 116433
Satterthwaite, T.D., Elliott, M.A., Gerraty, R.T., Ruparel, K., Loughead, J., Calkins, M.E.,Eickhoff, S.B., Hakonarson, H., Gur, R.C., Gur, R.E., Wolf, D.H., 2013. An improvedframework for confound regression and filtering for control of motion artifact in thepreprocessing of resting-state functional connectivity data. Neuroimage 64, 240–256.https://doi.org/10.1016/j.neuroimage.2012.08.052 arXiv:NIHMS150003.https://ac.els-cdn.com/S1053811912008609/1-s2.0-S1053811912008609-main.pdf?{_}tid¼6eb8e364-10b9-11e8-a7ff-00000aab0f6b{&}acdnat¼1518525105{_}f7e9a92d77f9084f6b5d4fee9fd3afcf.
Satterthwaite, T.D., Wolf, D.H., Loughead, J., Ruparel, K., Elliott, M.A., Hakonarson, H.,Gur, R.C., Gur, R.E., 2012. Impact of in-scanner head motion on multiple measures offunctional connectivity : relevance for studies of neurodevelopment in youth.Neuroimage 60, 623–632. https://doi.org/10.1016/j.neuroimage.2011.12.063.http://ac.els-cdn.com/S1053811911014650/1-s2.0-S1053811911014650-main.pdf?{_}tid¼edf9d138-e3ce-11e6-bb29-00000aab0f6c{&}acdnat¼1485439037{_}633f9a9e6b0b068775f861fadf339f66.
Siegel, J.S., Mitra, A., Laumann, T.O., Seitzman, B.A., Raichle, M., Corbetta, M.,Snyder, A.Z., 2016. Data quality influences observed links between functionalconnectivity and behavior. Cerebr. Cortex 27, 4492–4502.
Smith, S.M., Beckmann, C.F., Andersson, J., Auerbach, E.J., Bijsterbosch, J., Douaud, G.,Duff, E., Feinberg, D.A., Griffanti, L., Harms, M.P., et al., 2013. Resting-state fmri inthe human connectome project. Neuroimage 80, 144–168.
Smith, S.M., Nichols, T.E., Vidaurre, D., Winkler, A.M., Behrens, T.E.J., Glasser, M.F.,Ugurbil, K., Barch, D.M., Van Essen, D.C., Miller, K.L., 2015. A positive-negativemode of population covariation links brain connectivity, demographics and behavior.Nat. Neurosci. 18, 1565–1567. https://doi.org/10.1038/nn.4125. http://www.nature.com/doifinder/10.1038/nn.4125.
Van Dijk, K.R., Hedden, T., Venkataraman, A., Evans, K.C., Lazar, S.W., Buckner, R.L.,2009. Intrinsic functional connectivity as a tool for human connectomics: theory,properties, and optimization. J. Neurophysiol. 103, 297–321. https://doi.org/10.1152/jn.00783.2009 pmid:19889849.
Van Dijk, K.R., Sabuncu, M.R., Buckner, R.L., 2012. The influence of head motion onintrinsic functional connectivity MRI. Neuroimage 59, 431–438. https://doi.org/10.1016/j.neuroimage.2011.07.044 pmid:21810475.
15
Von Luxburg, U., 2007. A tutorial on spectral clustering. Stat. Comput. 17, 395–416.Watanabe, T., Sasaki, Y., Shibata, K., Kawato, M., 2017. Advances in fMRI real-time
neurofeedback. Trends Cogn. Sci. 21, 997–1010. https://doi.org/10.1016/j.tics.2017.09.010 pmid:29031663.
Wilke, M., 2014. Isolated assessment of translation or rotation severely underestimatesthe effects of subject motion in fMRI data. PLoS One 9, 106498. https://doi.org/10.1371/journal.pone.0106498 pmid:25333359.
Wylie, G.R., Genova, H., DeLuca, J., Chiaravalloti, N., Sumowski, J.F., 2014. Functionalmagnetic resonance imaging movers and shakers: does subject-movement causesampling bias? Hum. Brain Mapp. 35, 1–13.
Yan, C., Cheung, B., Kelly, C., Colcombe, S., Craddock, R.C., Di Martino, A., Li, Q., Zuo, X.,Castellanos, F.X., Milham, M.P., 2013. A comprehensive assessment of regionalvariation in the impact of head micromovements on functional connectomics.Neuroimage 76, 183–201.
Yang, Z., Zhuang, X., Screenivasan, K., Mishra, V., Cordes, D., 2019. Robust motionregression of resting-state data using a convolutional neural network model. Front.Neurosci. 13, 169. https://doi.org/10.3389/fnins.2019.00169 pmid:31057348.
Yeo, B.T.T., Krienen, F.M., Sepulcre, J., Sabuncu, M.R., Lashkari, D., Hollinshead, M.,Roffman, J.L., Smoller, J.W., Z€ollei, L., Polimeni, J.R., et al., 2011. The organizationof the human cerebral cortex estimated by intrinsic functional connectivity.J. Neurophysiol. 106, 1125–1165.
Zaitsev, M., Akin, B., LeVan, P., Knowles, B.R., 2017. Prospective motion correction infunctional mri. Neuroimage 154, 33–42.
Zeng, L., Wang, D., Fox, M.D., Sabuncu, M., Hu, D., Ge, M., Buckner, R.L., Liu, H., 2014.Neurobiological basis of head motion in brain imaging. Proc. Natl. Acad. Sci. 111,6058–6062.
Z€oller, D., Schaer, M., Scariati, E., Padula, M., Eliez, S., Van De Ville, D., 2017.Disentangling resting-state BOLD variability and PCC functional connectivity in22q11. 2 deletion syndrome. Neuroimage 149, 85–97. https://doi.org/10.1016/j.neuroimage.2017.01.064 pmid:28143774.