bol08439 00 security cover:20-f -...
TRANSCRIPT
bp.com/form20F
Annual Reporton Form 20–F2009
What’s inside?
beyond petroleum®
BP A
nnual Report on Form
20–F 2009
5 Business re view6 Grou ovep rview18 Exploration and Production32 Re fining and Marketing38 Other businesses and corporate40 Research and technology42 Corporate re sponsibility48 Relationships with suppliers and contractors48 Regulation of the group’s business48 Organization stral ucture49 Financia pel rformance57 Liquidity and capital resources
61 Board performance and biographies62 Directors and senior management65 Board performance report
77 Directors’ remuneration report78 Part 1 Summary80 Part 2 Executive directors’ remuneration87 Part 3 Non-executive directors’ remuneration
A89 dditional information forshareholders90 Critical accounting policies92 Property, plants and equipment 92 Share ownership94 Major shareholders and related party transactions94 Dividends95 Lega prl oceedings96 Share prices and listings97 Memorandum and Articles of Association99 Exchange co ntrols99 Taxation101 Documents on display101 Controls and procedures102 Code of ethics102 Principal accountants’ fees and services102 Corporate governance practices103 Purchases of equity securities by the issuer
affi li and ated purchasers103 Fees and charges payable by a holder of ADSs104 Fees and payments made by the Depositary to the issuer104 Called-up share capital 104 Administration104 Annual general meeting105 Exhibits
107 Financial statements108 Consolidated fi nancial statements of the BP group114 Notes on fi nancial statements
S183 upplementary information on oil andnatural gas (unaudited)

UNITED STATESSECURITIES AND EXCHANGE COMMISSION
Washington, D.C. 20549
FORM 20-F(Mark One)
REGISTRATION STATEMENT PURSUANT TO SECTION 12(b) or (g)OF THE SECURITIES EXCHANGE ACT OF 1934
ORANNUAL REPORT PURSUANT TO SECTION 13 OR 15(d)
OF THE SECURITIES EXCHANGE ACT OF 1934
For the fiscal year ended 31 December 2009OR
TRANSITION REPORT PURSUANT TO SECTION 13 OR 15(d) OF THE SECURITIES EXCHANGE ACT OF 1934OR
SHELL COMPANY REPORT PURSUANT TO SECTION 13 OR 15(d) OF THE SECURITIES EXCHANGE ACT OF 1934Commission file number: 1-6262
BP p.l.c.(Exact name of Registrant as specified in its charter)
England and Wales(Jurisdiction of incorporation or organization)
1 St James’s Square, London SW1Y 4PDUnited Kingdom
(Address of principal executive offices)
Dr Byron E GroteBP p.l.c.
1 St James’s Square, London SW1Y 4PDUnited Kingdom
Tel +44 (0) 20 7496 4000Fax +44 (0) 20 7496 4630
(Name, Telephone, E-mail and/or Facsimile number and Address of Company Contact Person)
Title of each class Name of each exchange on which registeredOrdinary Shares of 25c each New York Stock Exchange*
4 7/8% Guaranteed Notes due 2010 New York Stock ExchangeFloating Rate Guaranteed Extendible Notes New York Stock ExchangeFloating Rate Guaranteed Notes due 2010 New York Stock Exchange
5.25% Guaranteed Notes due 2013 New York Stock ExchangeFloating Rate Guaranteed Notes due 2011 New York Stock Exchange
1.55% Guaranteed Notes due 2011 New York Stock Exchange3.125% Guaranteed Notes due 2012 New York Stock Exchange3.625% Guaranteed Notes due 2014 New York Stock Exchange3.875% Guaranteed Notes due 2015 New York Stock Exchange4.75% Guaranteed Notes due 2019 New York Stock Exchange
*Not for trading, but only in connection with the registration of American DepositaryShares, pursuant to the requirements of the Securities and Exchange Commission
Securities registered or to be registered pursuant to Section 12(g) of the Act.None
Securities for which there is a reporting obligation pursuant to Section 15(d) of the Act.None
Indicate the number of outstanding shares of each of the issuer’s classes of capital or common stock as of the close of the period covered by the annual report.
Ordinary Shares of 25c each 18,759,888,123Cumulative First Preference Shares of £1 each 7,232,838Cumulative Second Preference Shares of £1 each 5,473,414
Indicate by check mark if the registrant is a well-known seasoned issuer, as defined in Rule 405 of the Securities Act.
Yes No
If this report is an annual or transition report, indicate by check mark if the registrant is not required to file reports pursuant to Section 13 or 15(d) of the SecuritiesExchange Act of 1934.
Yes No
Note — Checking the box above will not relieve any registrant required to file reports pursuant to Section 13 or 15(d) of the Securities Exchange Act of 1934 fromtheir obligations under those Sections.
Indicate by check mark whether the Registrant (1) has filed all reports required to be filed by Section 13 or 15(d) of the Securities Exchange Act of 1934 during thepreceding 12 months (or for such shorter period that the Registrant was required to file such reports), and (2) has been subject to such filing requirements for the past90 days.
Yes No
Indicate by check mark whether the registrant has submitted electronically and posted on its corporate website, if any, every Interactive Data File required to besubmitted and posted pursuant to Rule 405 of Regulation S-T (§ 232.405 of this chapter) during the preceding 12 months (or for such shorter period that the registrantwas required to submit and post such files).*
Yes No
*This requirement does not apply to the registrant until its fiscal year ending December 31, 2011.
Indicate by check mark whether the registrant is a large accelerated filer, an accelerated filer, or a non-accelerated filer. See definition of ‘‘accelerated filer and largeaccelerated filer’’ in Rule 12b-2 of the Exchange Act. (Check one):
Large accelerated filer Accelerated filer Non-accelerated filer
Indicate by check mark which basis of accounting the registrant has used to prepare the financial statements included in this filing:International Financial Reporting Standards as issued by the
U.S. GAAP International Accounting Standards Board Other
If “Other” has been checked in response to the previous question, indicate by check mark which financial statement item the registrant has elected to follow.
Item 17 Item 18
If this is an annual report, indicate by check mark whether the registrant is a shell company (as defined in Rule 12b-2 of the Exchange Act).
Yes No
BOL08439_p000 COVS:20 F 5/3/10 17:30 Page 1 Bleed: 0�mm Scale: 100%

2
Cross reference to Form 20-F
Page
Item 1. Identity of Directors, Senior Management and Advisors n/aItem 2. Offer Statistics and Expected Timetable n/aItem 3. Key Information
A. Selected financial data 12B. Capitalization and indebtedness n/aC. Reasons for the offer and use of proceeds n/aD. Risk factors 14-16
Item 4. Information on the CompanyA. History and development of the company 6-7B. Business overview 18-48C. Organizational structure 48D. Property, plants and equipment 92
Item 4A. Unresolved Staff Comments NoneItem 5. Operating and Financial Review and Prospects
A. Operating results 49-56B. Liquidity and capital resources 57-59C. Research and development, patent and licenses 40-41, 132D. Trend information 58E. Off-balance sheet arrangements 58F. Tabular disclosure of contractual commitments 59G. Safe harbour 17
Item 6. Directors, Senior Management and EmployeesA. Directors and senior management 62-64B. Compensation 78-88, 172-173C. Board practices 62-76, 80-81, 172-173D. Employees 46-47E. Share ownership 76, 84-85, 92-94, 170-172
Item 7. Major Shareholders and Related Party TransactionsA. Major shareholders 94B. Related party transactions 94, 140-141C. Interests of experts and counsel n/a
Item 8. Financial InformationA. Consolidated statements and other financial information 94-96, 107-197B. Significant changes None
Item 9. The Offer and ListingA. Offer and listing details 96-97B. Plan of distribution n/aC. Markets 96-97D. Selling shareholders n/aE. Dilution n/aF. Expenses of the issue n/a
Item 10. Additional InformationA. Share capital n/aB. Memorandum and articles of association 97-99C. Material contracts NoneD. Exchange controls 99E. Taxation 99-101F. Dividends and paying agents n/aG. Statements by experts n/aH. Documents on display 101I. Subsidiary information n/a
Item 11. Quantitative and Qualitative Disclosures about Market Risk 142-147, 150-155Item 12. Description of securities other than equity securities
A. Debt Securities n/aB. Warrants and Rights n/aC. Other Securities n/aD. American Depositary Shares 103-104
Item 13. Defaults, Dividend Arrearages and Delinquencies NoneItem 14. Material Modifications to the Rights of Security Holders and Use of Proceeds NoneItem 15. Controls and Procedures 101-102Item 16A. Audit Committee Financial Expert 71Item 16B. Code of Ethics 102Item 16C. Principal Accountant Fees and Services 102Item 16D. Exemptions from the Listing Standards for Audit Committees n/aItem 16E. Purchases of Equity Securities by the Issuer and Affiliated Purchases 103Item 16F. Change in Registrant’s Certifying Accountant. NoneItem 16G. Corporate governance 102Item 17. Financial Statements n/aItem 18. Financial Statements 22-24, 107-197Item 19. Exhibits 105
BOL08439_p000 COVS:20 F 5/3/10 17:31 Page 2 Bleed: 0�mm Scale: 100%

3
Miscellaneous terms
In this document, unless the contextotherwise requires, the following termsshall have the meaning set out below.
ADR
American depositary receipt.
ADS
American depositary share.
AGM
Annual general meeting.
Amoco
The former Amoco Corporation and its subsidiaries.
Atlantic Richfield
Atlantic Richfield Company and its subsidiaries.
Associate
An entity, including an unincorporatedentity such as a partnership, over whichthe group has significant influence andthat is neither a subsidiary nor a jointventure. Significant influence is thepower to participate in the financial andoperating policy decisions of an entitybut is not control or joint control overthose policies.
Barrel
42 US gallons.
b/d
barrels per day.
boe
barrels of oil equivalent.
BP, BP group or the group
BP p.l.c. and its subsidiaries.
Burmah Castrol
Burmah Castrol PLC and itssubsidiaries.
Cent or c
One-hundredth of the US dollar.
The company
BP p.l.c.
Dollar or $
The US dollar.
EU
European Union.
Gas
Natural gas.
Hydrocarbons
Crude oil and natural gas.
IFRS
International Financial ReportingStandards.
Joint control
Joint control is the contractually agreedsharing of control over an economicactivity, and exists only when thestrategic financial and operatingdecisions relating to the activity requirethe unanimous consent of the partiessharing control (the venturers).
Joint venture
A contractual arrangement wherebytwo or more parties undertake aneconomic activity that is subject to joint control.
Jointly controlled asset
A joint venture where the venturersjointly control, and often have a directownership interest in the assets of theventure. The assets are used to obtainbenefits for the venturers. Eachventurer may take a share of the outputfrom the assets and each bears anagreed share of the expenses incurred.
Jointly controlled entity
A joint venture that involves theestablishment of a corporation,partnership or other entity in whicheach venturer has an interest. Acontractual arrangement between theventurers establishes joint control overthe economic activity of the entity.
Liquids
Crude oil, condensate and natural gas liquids.
LNG
Liquefied natural gas.
London Stock Exchange or LSE
London Stock Exchange plc.
LPG
Liquefied petroleum gas.
mb/d
thousand barrels per day.
mboe/d
thousand barrels of oil equivalent per day.
mmBtu
million British thermal units.
mmboe
million barrels of oil equivalent.
mmcf
million cubic feet.
mmcf/d
million cubic feet per day.
MTBE
Methyl tertiary butyl ether.
MW
Megawatt.
NGLs
Natural gas liquids.
OPEC
Organization of Petroleum ExportingCountries.
Ordinary shares
Ordinary fully paid shares in BP p.l.c. of25c each.
Pence or p
One-hundredth of a pound sterling.
Pound, sterling or £
The pound sterling.
Preference shares
Cumulative First Preference Shares andCumulative Second Preference Sharesin BP p.l.c. of £1 each.
PSA
A production-sharing agreement (PSA)is an arrangement through which an oilcompany bears the risks and costs ofexploration, development andproduction. In return, if exploration issuccessful, the oil company receivesentitlement to variable physicalvolumes of hydrocarbons, representingrecovery of the costs incurred and astipulated share of the productionremaining after such cost recovery.
SEC
The United States Securities andExchange Commission.
Subsidiary
An entity that is controlled by the BPgroup. Control is the power to governthe financial and operating policies ofan entity so as to obtain the benefitsfrom its activities.
Tonne
2,204.6 pounds.
UK
United Kingdom of Great Britain andNorthern Ireland.
US
United States of America.
BOL08439_p003 p05:20 F 5/3/10 17:31 Page 3 Bleed: 0�mm Scale: 100%

4
BOL08439_p003 p05:20 F 5/3/10 17:31 Page 4 Bleed: 0�mm Scale: 100%

Business review
6 Group overview
18 Exploration and Production
32 Refining and Marketing
38 Other businesses and corporate
40 Research and technology
42 Corporate responsibility
48 Relationships with suppliers andcontractors
48 Regulation of the group’s business
48 Organizational structure
49 Financial performance
57 Liquidity and capital resources Bu
sin
ess r
evie
w
Bu
sin
ess re
vie
w
BOL08439_p003 p05:20 F 5/3/10 17:31 Page 5 Bleed: 0�mm Scale: 100%

Group overview
Our organizationBP is one of the world’s leading international oiland gas companiesa. We operate in more than 80 countries, providing our customers with fuelfor transportation, energy for heat and light,retail services and petrochemicals products foreveryday items.
As a global group, our interests and activities are held or operatedthrough subsidiaries, jointly controlled entities or associates establishedin – and subject to the laws and regulations of – many differentjurisdictions. These interests and activities covered two businesssegments in 2009: Exploration and Production and Refining andMarketing. BP’s activities in low-carbon energy are managed through ourAlternative Energy business, which is reported within Other businessesand corporate.
Exploration and Production’s activities cover three key areas.Upstream activities include oil and natural gas exploration, fielddevelopment and production. Midstream activities include pipeline,transportation and processing activities related to our upstreamactivities. Marketing and trading activities include the marketing andtrading of natural gas, including liquefied natural gas (LNG), togetherwith power and natural gas liquids (NGLs).
Refining and Marketing’s activities include the supply and trading,refining, manufacturing, marketing and transportation of crude oil,petroleum and petrochemicals products and related services.
The two business segments each comprise a number ofstrategic performance units (SPUs), which are organized along eithergeographic or activity-related lines. The role of the SPU includes thedevelopment of local capability and the fostering of external stakeholderrelationships. Each SPU is of a scale that allows for a close focus onperformance delivery by its respective segment, which includes theappropriate management of costs.
aOn the basis of market capitalization, proved reserves and production.
Our group functions and regions support the work of our segments andbusinesses. Their key objectives are to establish and monitor fit-for-purpose functional standards across the group; to act as centres of deepfunctional expertise; to access significant leverage with third-partysuppliers; and to establish and maintain capabilities among thefunctional staff employed within our operating businesses. In addition,the head of each region provides the required integration andco-ordination of group activities in a particular geographic area andrepresents BP to external parties.
Where we operate
BP’s worldwide headquarters is in London. The UK is a centre fortrading, legal, finance and other business functions as well as three of BP’s major global research and technology groups.
We have well-established operations in Europe, the US, Canada,Russia, South America, Australasia, Asia and parts of Africa. Currently,around 67% of the group’s capital is invested in Organisation forEconomic Co-operation and Development (OECD) countries, witharound 40% of our fixed assets located in the US and around 20%in Europe.
Business review
6
Exploration and Production
BP’s major areas of production in 2009
BOL08439_p006-p17_Group over:20-F 5/3/10 19:16 Page 6
• BP subsidiary• Equity-accounted entity
Unless otherwise indicated, information in this document reflects 100% of the assets and operations of the company and its subsidiaries that were consolidated at the date or for the periods indicated, including minority interests. The company wasincorporated in 1909 in England and Wales and changed its name to BP p.l.c. in 2001. BP’s primary share listing is the London Stock Exchange. Ordinary shares are also traded on the Frankfurt Stock Exchange in Germany and, in the US, the company’s securities are traded in the form of ADSs. (See pages 96 to 97 for more details.)
Our worldwide headquarters is located at:1 St James’s Square, London SW1Y 4PD, UK.Tel +44 (0)20 7496 4000.
Our agent in the US is BP America Inc., 501 Westlake Park Boulevard, Houston, Texas 77079.Tel +1 281 366 2000.

Our Exploration and Production segment conducts upstream andmidstream activities in 30 countries and we are the largest producer ofoil and gas in North America. The segment’s geographical coverage inthese activities currently includes Angola, Azerbaijan, Canada, Egypt,Russia, Trinidad & Tobago (Trinidad), Norway, the UK, the US andlocations within Asia Pacific, Latin America, North Africa and the MiddleEast. Our Exploration and Production segment also includes gasmarketing and trading activities, primarily in Canada, Europe and the US. In Russia, we have an important associate through our 50%shareholding in TNK-BP, a major oil company with exploration assets,refineries and other downstream infrastructure.
In Refining and Marketing, we market our products in more than80 countries, with a particularly strong presence in the US and Europe,as well as major activities in Australia, Southern Africa, India and China.In the US, we own or have a share in five refineries and market primarilyunder the Amoco, ARCO, BP and Castrol brands. We are one of thelargest gasoline retailers in that country. In Europe, we own or have ashare in seven refineries and we market extensively across the region,primarily under the Aral, BP and Castrol brands. Our long-establishedsupply and trading activity is responsible for delivering value across thecrude and oil products supply chain. Our petrochemicals businessmaintains a manufacturing position globally, with an emphasis on growthin Asia. We continue to seek opportunities to broaden our activities ingrowth markets such as China and India.
Refining and Marketing
BP’s global presencea
• BP refinery (wholly or partly owned)• Petrochemicals site (s)
aThe green shading indicates the approximate coverage of BP’sintegrated fuels value chains.
Our marketEnergy markets remained volatile in 2009,reflecting the dramatic drop in world economicactivity early in the year and indications ofeconomic recovery in the second half. Lookingahead, the long-term outlook is one of growingdemand for energya, particularly in Asia,alongside challenges for the industry in meetingthis demand. Rising incomes and expandingurban populations are expected to drivedemand, while the evolution towards a lower-carbon economy will require technology,innovation and investment.
World oil consumption declined for a second successive year during2009, with growing demand in non-OECD countries once again morethan offset by falling consumption in OECD countries. Average crude oil prices for 2009 were lower than in the previous year, breaking anunprecedented string of seven consecutive annual increases. Naturalgas prices also weakened in 2009 and were highly volatile. Refiningmargins fell sharply as oil demand contracted and substantial amountsof new refining capacity came onstream.
Economic context
The world economy began to show signs of recovery in the latter partof 2009 and this is expected to continue through 2010, but economicgrowth in 2010 is likely to be muted in the OECD countries. Growth inglobal oil consumption is expected to resume as the world economyrecovers from recession.
In 2009, concerns about the volatility of commodity and financialmarkets, combined with renewed focus on climate change and the earlyexperiences with efforts to reduce CO2 emissions in the EU andelsewhere, led to an increased focus on the appropriate role for markets,government oversight and other policy measures relating to the supplyand consumption of energy.
The concept of peak oil – the time after which less oil is availableto the world – continues to hold the interest of some commentators,although global proved reserves have tended to rise over time andremain sufficient to support higher levels of production. Meanwhile, theconsumer response to higher prices and an increased focus on energyefficiency have served to constrain demand. We expect regulation andtaxation of the energy industry and energy users to increase in manyareas over the short to medium term.
aWorld Energy Outlook 2009. ©OECD/IEA 2009, pages 622-623: ‘Reference Scenario, World’.
Business review
7
Bu
sin
ess r
evie
w
Bu
sin
ess re
vie
w –
Gro
up
overv
iew
BOL08439_p006-p17_Group over:20-F 5/3/10 19:16 Page 7

8
Business review
BOL08439_p006 p17_Group over:20 F 5/3/10 17:31 Page 8 Bleed: 0�mm Scale: 100%
Crude oil and gas prices, and refining margins($ per barrel of oil equivalent)
120
150
2004
Dated Brent oil priceHenry Hub gas price (First of Month Index)Global indicator refining margin (GIM)a
2005 2006 2007 2008 2009
30
90
60
Source: Platts/BP.
Crude oil prices
Dated Brent for the year averaged $61.67 per barrel, about 37% below2008’s record average of $97.26 per barrel. Prices began the year at theirlowest point as the world economy grappled with the sharpest downturnin modern economic history.
Global oil consumption reflected the economic slowdown, fallingby roughly 1.3 million b/d for the year (1.5%)b, the largest annual declinesince 1982. The biggest reductions were early in the year, with OECDcountries accounting for the entire global decline. Crude oil prices rosesharply in the second quarter in response to sustained OPEC productioncuts and emerging signs of stabilization in the world economy, despitevery high commercial oil inventories in the OECD. OPEC memberssustained roughly 2.5 million b/d of production cutsb implemented in late2008 and throughout 2009. Additional price increases later in the yearwere sustained by further positive economic news and signs that theinventory overhang was beginning to correct.
In 2008, the average dated Brent price of $97.26 per barrel was34% higher than the $72.39 per barrel average seen in 2007. Daily pricesbegan 2008 at $96.02 per barrel, peaked at $144.22 per barrel on 3 July2008, and fell to $36.55 per barrel at the end of the year. The sharp dropin prices was due to falling demand in the second half of the year, causedby the OECD falling into recession and the lagged effect on demand ofhigh prices in the first half of the year. OPEC had increased productionsignificantly through the first three quarters and, as a result of fallingconsumption and rising OPEC production, inventories rose. As pricescontinued to decline, OPEC responded with successive announcementsof production cuts in September, October and December.
Looking ahead, in 2010 we expect oil price movements tocontinue to be driven by the extent of global economic growth and itsresulting implications for oil consumption, and by OPEC productiondecisions.
a See footnote d on page 33.b Adapted from Oil Market Report (February 2009). ©OECD/IEA 2009.
Natural gas prices
Natural gas prices weakened in 2009 and were volatile. The average USHenry Hub First of Month Index fell to $3.99/mmBtu in 2009, a 56%decrease from the record $9.04/mmBtu average seen in 2008.Recession-induced demand declines and strong production caused pricesto drop from $6.16/mmBtu at the start of the year to $2.84/mmBtu inSeptember. However, over the course of the year, the impact was partlyoffset as US regional gas price differentials narrowed, driven partly by theRockies Express Pipeline extension allowing the transportation of largerquantities of gas out of the Rockies area. Reduced imports from Canada,slowing US production growth and cooler temperatures allowed prices torecover to $4.49/mmBtu by the end of the year. Prices at the UK NationalBalancing Point similarly fell to an average of 30.85 pence per therm,47% below the 2008 average price of 58.12 pence per therm. In 2009,there was a switch of uncontracted LNG cargoes from Asia to Europe,reflecting a shift in relative spot prices. LNG imports to Europe havecompeted with pipeline imports, where the gas price is often indexed tooil prices, as well as with marginal European gas production. Gas priceswere often at or below parity with coal, when translated into the cost ofgenerating power, which led to gas displacing coal in power generation inEurope and the US.
In 2008, average natural gas prices in the US and the UK werehigher than in 2007. The Henry Hub First of Month Index, at$9.04/mmBtu, was 32% higher than the 2007 average of $6.86/mmBtu.2008’s prices peaked at $13.11/mmBtu in July amid robust demand andfalling US gas imports, but fell to $6.90/mmBtu in December as demandweakened and production remained strong. In the UK, 2008 averageprices of 58.12 pence per therm at the National Balancing Point, were94% above the 2007 average of 29.95 pence per therm.
Looking ahead, gas markets in 2010 are expected to followdevelopments in the global economy, but any price movements are likelyto be impacted by significant new LNG capacity as it becomes available.
Refining margins
Refining margins fell sharply in 2009 as demand for oil products reducedin the wake of the global economic recession and new refining capacitycame onstream, mostly in Asia Pacific. The BP global indicator refiningmargin (GIM)a averaged $4 per barrel last year, down $2.50 per barrelcompared with 2008. Margins in the Far East were particularly badly hit –averaging close to zero in Singapore – because new refining capacity hasbeen added in the region.
Margins in Europe were about half the 2008 level as the reductionin economic activity meant weaker demand for commercial transport and therefore lower middle distillate consumption. In the US, whererefining is more highly upgraded and the transport market moregasoline-orientated, margins were stronger than in Europe.
Refining margins in 2008 were lower than in 2007, with the BPGIM decreasing to an average of $6.50 per barrel from $9.94 per barrel in2007. The premium for light products above fuel oils remained high,reflecting a continuing shortage of upgrading capacity and the favouringof fully upgraded refineries over less complex sites.
Looking ahead, refining margins are likely to remain underpressure through 2010, with capacity already exceeding demand andadditional new capacity expected to come onstream during the year.
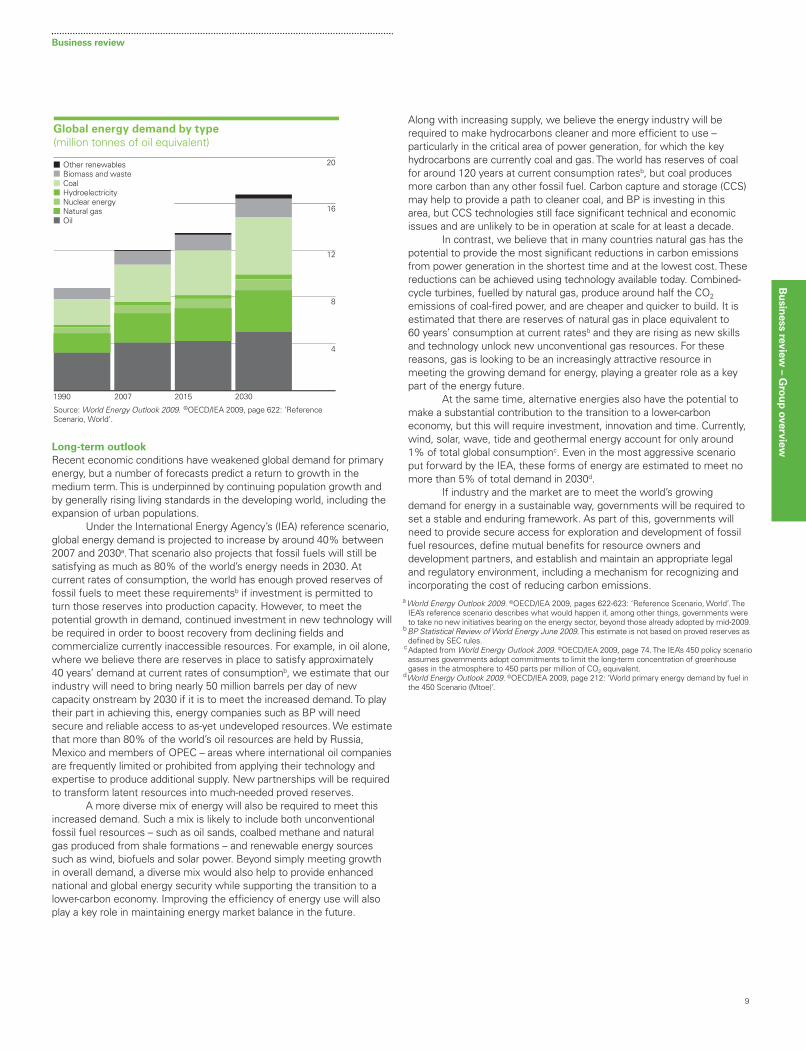
Global energy demand by type (million tonnes of oil equivalent)
4
8
12
16
20Other renewablesBiomass and wasteCoalHydroelectricityNuclear energyNatural gasOil
1990 2007 2015 2030
Source: World Energy Outlook 2009. ©OECD/IEA 2009, page 622: ‘ReferenceScenario, World’.
Long-term outlook
Recent economic conditions have weakened global demand for primaryenergy, but a number of forecasts predict a return to growth in themedium term. This is underpinned by continuing population growth andby generally rising living standards in the developing world, including theexpansion of urban populations.
Under the International Energy Agency’s (IEA) reference scenario,global energy demand is projected to increase by around 40% between2007 and 2030a. That scenario also projects that fossil fuels will still besatisfying as much as 80% of the world’s energy needs in 2030. Atcurrent rates of consumption, the world has enough proved reserves offossil fuels to meet these requirementsb if investment is permitted toturn those reserves into production capacity. However, to meet thepotential growth in demand, continued investment in new technology willbe required in order to boost recovery from declining fields andcommercialize currently inaccessible resources. For example, in oil alone,where we believe there are reserves in place to satisfy approximately40 years’ demand at current rates of consumptionb, we estimate that ourindustry will need to bring nearly 50 million barrels per day of newcapacity onstream by 2030 if it is to meet the increased demand. To playtheir part in achieving this, energy companies such as BP will needsecure and reliable access to as-yet undeveloped resources. We estimatethat more than 80% of the world’s oil resources are held by Russia,Mexico and members of OPEC – areas where international oil companiesare frequently limited or prohibited from applying their technology andexpertise to produce additional supply. New partnerships will be requiredto transform latent resources into much-needed proved reserves.
A more diverse mix of energy will also be required to meet thisincreased demand. Such a mix is likely to include both unconventionalfossil fuel resources – such as oil sands, coalbed methane and naturalgas produced from shale formations – and renewable energy sourcessuch as wind, biofuels and solar power. Beyond simply meeting growth in overall demand, a diverse mix would also help to provide enhancednational and global energy security while supporting the transition to alower-carbon economy. Improving the efficiency of energy use will alsoplay a key role in maintaining energy market balance in the future.
Along with increasing supply, we believe the energy industry will berequired to make hydrocarbons cleaner and more efficient to use –particularly in the critical area of power generation, for which the keyhydrocarbons are currently coal and gas. The world has reserves of coalfor around 120 years at current consumption ratesb, but coal producesmore carbon than any other fossil fuel. Carbon capture and storage (CCS)may help to provide a path to cleaner coal, and BP is investing in thisarea, but CCS technologies still face significant technical and economicissues and are unlikely to be in operation at scale for at least a decade.
In contrast, we believe that in many countries natural gas has thepotential to provide the most significant reductions in carbon emissionsfrom power generation in the shortest time and at the lowest cost. Thesereductions can be achieved using technology available today. Combined-cycle turbines, fuelled by natural gas, produce around half the CO2
emissions of coal-fired power, and are cheaper and quicker to build. It isestimated that there are reserves of natural gas in place equivalent to60 years’ consumption at current ratesb and they are rising as new skillsand technology unlock new unconventional gas resources. For thesereasons, gas is looking to be an increasingly attractive resource inmeeting the growing demand for energy, playing a greater role as a keypart of the energy future.
At the same time, alternative energies also have the potential tomake a substantial contribution to the transition to a lower-carboneconomy, but this will require investment, innovation and time. Currently,wind, solar, wave, tide and geothermal energy account for only around1% of total global consumptionc. Even in the most aggressive scenarioput forward by the IEA, these forms of energy are estimated to meet nomore than 5% of total demand in 2030d.
If industry and the market are to meet the world’s growingdemand for energy in a sustainable way, governments will be required toset a stable and enduring framework. As part of this, governments willneed to provide secure access for exploration and development of fossilfuel resources, define mutual benefits for resource owners anddevelopment partners, and establish and maintain an appropriate legaland regulatory environment, including a mechanism for recognizing andincorporating the cost of reducing carbon emissions.
a World Energy Outlook 2009. ©OECD/IEA 2009, pages 622-623: ‘Reference Scenario, World’. TheIEA’s reference scenario describes what would happen if, among other things, governments wereto take no new initiatives bearing on the energy sector, beyond those already adopted by mid-2009.
bBP Statistical Review of World Energy June 2009. This estimate is not based on proved reserves asdefined by SEC rules.
cAdapted from World Energy Outlook 2009. ©OECD/IEA 2009, page 74. The IEA’s 450 policy scenarioassumes governments adopt commitments to limit the long-term concentration of greenhousegases in the atmosphere to 450 parts per million of CO2 equivalent.
dWorld Energy Outlook 2009. ©OECD/IEA 2009, page 212: ‘World primary energy demand by fuel inthe 450 Scenario (Mtoe)’.
9
Business review
Bu
sin
ess r
evie
w
Bu
sin
ess re
vie
w –
Gro
up
overv
iew
BOL08439_p006 p17_Group over:20 F 5/3/10 17:31 Page 9 Bleed: 0�mm Scale: 100%

Business review
10
Our strategyThe priorities that drove our success in 2009 –safety, people and performance – remain thefoundation of our agenda as we build on ourmomentum and work to further enhance ourcompetitive position.
Our strategy is to invest competitively to grow oil and gas productionwhile working to drive performance across the group through enhancedoperating efficiency, capital efficiency and cost efficiency.
To meet growing world demand, BP is committed to exploring,developing and producing more fossil fuel resources; manufacturing,processing and delivering better and more advanced products; andenabling the transition to a lower-carbon future. We aim to do this whileoperating safely, reliably and in compliance with the law. We strive to runour business within the discipline of a clear financial framework.
In 2009, we improved our overall competitive performance byenhancing operating performance and reducing complexity and costs.We believe we can continue to compete successfully through our abilityto access resources and deliver high-quality products and service to ourcustomers. We intend to remain focused on the application of technologyand developing relationships based on a commitment to long-termpartnerships and mutual advantage. Our intention is to generate andsustain business momentum and growth through a rigorous process of continuous improvement and an ongoing focus on safety, people and performance.
Safety, reliability, compliance and continuous improvement
Safe, reliable and compliant operations remain the group’s first priority. A key enabler for this is the BP operating management system (OMS),which provides a common framework for all BP operations, designed toachieve consistency and continuous improvement in safety andefficiency. OMS includes mandatory practices, such as integritymanagement and incident investigation, which are designed to addressparticular risks. In addition, it enables each site to focus on the mostimportant risks in its own operations and sets out procedures on how tomanage them in accordance with the group-wide framework. Furtherinformation on our safety priorities and performance can be found onpage 42.
The right people, skills and capability
It is vital that we develop and deploy people with the skills, capability and behaviours required to meet our objectives. Despite a tight globalrecruitment market for some of our core technical disciplines, we havebeen successful in building capacity and getting the right people with theright skills in the right place. We are now going further, strengthening theculture within BP through a commitment to continuous improvement inoperations and enhancing the capabilities, technical expertise andorganizational quality needed to drive performance.
Our people strategy has already resulted in refreshed groupleadership and senior management teams, recruitment focused onindividuals with strong operational and technical expertise, andappropriate reward for performance at all levels.
Enhanced performance and efficiency
Our strategy aims to create value for shareholders by investing to delivergrowth in our Exploration and Production business together withenhanced efficiency and high-quality earnings and returns throughout our operations.
In Exploration and Production, our strategy is to invest to growproduction safely, reliably and efficiently. We intend to achieve this bystrengthening our portfolio of leadership positions in the world’s mostprolific hydrocarbon basins, enabled by the development and applicationof technology and the building of strong relationships based on mutualadvantage. We also intend to sustainably drive cost and capital efficiencyin accessing, finding, developing and producing resources, enabled bydeep technical capability and a culture of continuous improvement.
In Refining and Marketing, our strategic focus is on enhancingportfolio quality, integrating activities across value chains andperformance efficiency. We expect to continue building our businessaround advantaged assets in material and significant energy marketswhile improving the safety and reliability of our operations. Our objectiveis to achieve sector-leading levels of performance on a sustainable basis.To achieve this, we need to continue upgrading the manufacturingcapabilities within our integrated fuels value chains to achieve the bestcapacity utilization and margin capture. We continue to exploreappropriate opportunities to deploy downstream capital into faster-growing non-OECD markets. We also intend to continue our selectiveinvestment in our international businesses, which include petrochemicals and lubricants, where we see potential to deliver strongand sustainable returns.
In Alternative Energy, we have focused our investments in theareas where we believe we can create the greatest competitiveadvantage. We have substantial businesses in wind and solar power andare developing advanced biofuels and low-carbon energy technologiessuch as hydrogen power and carbon capture and storage.
Our determination to drive efficiency through our businesses hasproved vital to our performance during a period of recession and webelieve that it will remain critical to our future prospects as the globaleconomy recovers and evolves.
Looking further ahead
As discussed in the ‘Our market’ section of this Annual Report onForm 20-F (see pages 7 to 9), we expect that the world will require amore diverse energy mix as the basis for a secure supply of energy overtime. We intend to play a central role in meeting the world’s continuedneed for hydrocarbons, with our Exploration and Production and Refiningand Marketing activities remaining at the core of our strategy. We arealso creating long-term options for the future in new energy technologyand low-carbon energy businesses. Current investment is focused onwind, solar and biofuels as potential sources of resource diversificationfor the world, and we are investing in carbon capture and storage as anenabling technology. We believe that this focused portfolio has thepotential to be a material source of value creation for BP in the longerterm (see pages 38 to 39). We are also enhancing our capabilities innatural gas, which is likely to play a greater role as a key part of theenergy future. We intend to lead and shape this transition, includingthrough the application of advanced technology to unlock sources ofunconventional gas, while working to achieve sector-leading levels ofreturn for our shareholders.
BOL08439_p006 p17_Group over:20 F 5/3/10 17:31 Page 10 Bleed: 0�mm Scale: 100%

Business review
11
Our performance2009 has been a successful year for BP, withpositive financial and operational momentumdespite an extremely turbulent global financialenvironment.
Safety
Good progress has been made on underpinning improved safetyperformance in 2009. Throughout the year, we continued to focus ontraining and enhancing procedures across the organization. Significantly,2009 was an important year in the development of OMS. By the end of 2009, around 80% of our operating sites were using the system,including all our operated refineries and petrochemicals plants. (SeeSafety on page 42 for more information on OMS.)
In 2009, a third-party-operated helicopter carrying contractorsfrom BP’s Miller platform crashed in the North Sea, resulting in the tragicloss of 16 lives. In addition, BP sustained two fatalities within our ownoperations. We deeply regret the loss of these lives.
Recordable injury frequency (RIF, a measure of the number ofreported injuries per 200,000 hours worked) was 0.34, significantly below2008 and 2007 levels of 0.43 and 0.48, respectively. Reported oil spillsgreater than one barrel were 234 in 2009 compared with 335 in 2008 and340 in 2007. Our environmental measure that tracks greenhouse gas(GHG) emissionsa increased in 2009 to 65.0 million tonnes of carbondioxide equivalent, compared with 61.4 million tonnes in 2008. Theprimary reason for this increase is the growth of our business, includingthe significant increase in our US refining throughputs, the start-up of ourTangguh LNG project in Indonesia and the continued success of our Gulfof Mexico deepwater operations, including Thunder Horse.
People
During 2009 we made further significant progress in generating a stronger performance focus and in fostering a culture that attributesmore value to deep specialist skills and expertise. At the same time, wecontinued to improve operational efficiency and reduce overheads.
Non-retail headcount was reduced by 4,400 (6%) in 2009. Overall,the number of employees (including retail staff) was reduced by 11,700in 2009.
Performance
Against the backdrop of the global recession, we delivered a strongperformance in 2009. Profit and cash flow were lower than in 2008, dueprimarily to a much weaker price environment, although the impact waspartially offset by better operational performance and lower costs acrossthe group as we implemented our efficiency programmes. Notableachievements include:
Exploration and Production• Replacing 129% of our proved reserves, on a combined basis of
subsidiaries and equity-accounted entities. • Delivering a 5% underlying growth in productionb. • Reducing unit production costs by 12%. • Achieving a strong gas marketing and trading performance. • Accessing new resources in Egypt, the Gulf of Mexico, Indonesia,
Iraq and Jordan. • Making the Tiber discovery in the Gulf of Mexico at a depth of over
35,000 feet, the deepest oil and gas discovery well ever drilled.• Making three further discoveries in Block 31, Angola. • Starting up Tangguh in Indonesia and six other major projects in the
Gulf of Mexico, Trinidad and Russia.
Refining and Marketing• Restoring our overall performance so that it is once again competitive
with our supermajor peers.• Achieving a Solomon refining availabilityc of 93.6%, which is an
increase of almost five percentage points compared with 2008.• Reducing costs across the segment by more than 15%d.• Delivering a strong supply and trading performance.• Performing strongly in our international businesses, despite the weak
environment.• Delivering simplification and lower costs through integration in the
fuels value chains.• Simplifying the segment’s footprint in aviation and lubricants and
completing the transfer of our US convenience retail business to afranchise operation.
• Successfully exiting from our ground fuels marketing business inGreece.
aSee footnote a in Environment on page 43.bUnderlying production growth excludes the effect of entitlement changes in our production-sharingagreements (driven by changes in oil and gas prices) and the effect of OPEC quota restrictions.
cRefining availability represents Solomon Associates’ operational availability, which is defined as thepercentage of the year that a unit is available for processing after subtracting the annualized timelost due to turnaround activity and all planned mechanical, process and regulatory maintenancedowntime.
dBased on Refining and Marketing’s share of production and manufacturing expenses plusdistribution and administration expenses.
Bu
sin
ess r
evie
w
Bu
sin
ess re
vie
w –
Gro
up
overv
iew
BOL08439_p006 p17_Group over:20 F 5/3/10 17:31 Page 11 Bleed: 0�mm Scale: 100%

Selected financial and operatinginformationThis information, insofar as it relates to 2009, has been extracted orderived from the audited consolidated financial statements of the BPgroup presented on pages 107 to 182. Note 1 to the financial
Business review
statements includes details on the basis of preparation of these financialstatements. The selected information should be read in conjunction withthe audited financial statements and related notes elsewhere herein.
$ million except per share amounts
2009 2008 2007 2006 2005
Income statement dataSales and other operating revenues from continuing operationsa 239,272 361,143 284,365 265,906 239,792Profit before interest and taxation from continuing operationsa 26,426 35,239 32,352 35,658 32,182Profit from continuing operationsa 16,759 21,666 21,169 22,626 22,133Profit for the year 16,759 21,666 21,169 22,601 22,317Profit for the year attributable to BP shareholders 16,578 21,157 20,845 22,315 22,026Capital expenditure and acquisitionsb 20,309 30,700 20,641 17,231 14,149Per ordinary share – cents
Profit for the year attributable to BP shareholdersBasic 88.49 112.59 108.76 111.41 104.25Diluted 87.54 111.56 107.84 110.56 103.05
Profit from continuing operations attributable to BP shareholdersa
Basic 88.49 112.59 108.76 111.54 103.38Diluted 87.54 111.56 107.84 110.68 102.19
Dividends paid per share – cents 56.00 55.05 42.30 38.40 34.85– pence 36.417 29.387 20.995 21.104 19.152
Ordinary share datac
Average number outstanding of 25 cent ordinary shares (shares million undiluted) 18,732 18,790 19,163 20,028 21,126Average number outstanding of 25 cent ordinary shares (shares million diluted) 18,936 18,963 19,327 20,195 21,411Balance sheet dataTotal assets 235,968 228,238 236,076 217,601 206,914Net assets 102,113 92,109 94,652 85,465 80,450Share capital 5,179 5,176 5,237 5,385 5,185BP shareholders’ equity 101,613 91,303 93,690 84,624 79,661Finance debt due after more than one year 25,518 17,464 15,651 11,086 10,230Net debt to net debt plus equityd 20% 21% 22% 20% 17%
aExcludes Innovene, which was treated as a discontinued operation in accordance with IFRS 5 ‘Non-current Assets Held for Sale and Discontinued Operations’ in 2005 and 2006.b2008 included capital expenditure of $2,822 million and an asset exchange of $1,909 million, both in respect of our transaction with Husky, as well as capital expenditure of $3,667 million in respect of
our transactions with Chesapeake (see page 49). 2007 included $1,132 million for the acquisition of Chevron’s Netherlands manufacturing company. Capital expenditure in 2006 included $1 billion inrespect of our investment in Rosneft. All capital expenditure and acquisitions during the past five years have been financed from cash flow from operations, disposal proceeds and external financing.
c The number of ordinary shares shown has been used to calculate per share amounts.dNet debt and the ratio of net debt to net debt plus equity ratio are non-GAAP measures. We believe that these measures provide useful information to investors. Net debt enables investors to see the
economic effect of gross debt, related hedges and cash and cash equivalents in total. The net debt ratio enables investors to see how significant net debt is relative to equity from shareholders.
Profits
Profit attributable to BP shareholders for the year ended 31 December2009 was $16,578 million, including inventory holding gains, net of tax,of $2,623 million and a net charge for non-operating items, after tax, of$1,067 million. In addition, fair value accounting effects had a favourableimpact, net of tax, of $445 million relative to management’s measureof performance. Inventory holding gains and losses, net of tax,are described in footnote (a) on page 49. More information onnon-operating items and fair value accounting effects can be found onpages 54-55.
Profit attributable to BP shareholders for the year ended31 December 2008 was $21,157 million, including inventory holdinglosses, net of tax, of $4,436 million and a net charge for non-operatingitems, after tax, of $796 million. In addition, fair value accounting effectshad a favourable impact, net of tax, of $146 million relative tomanagement’s measure of performance.
Profit attributable to BP shareholders for the year ended 31 December2007 was $20,845 million, including inventory holding gains, net of tax,of $2,475 million and a net charge for non-operating items, after tax, of$373 million. In addition, fair value accounting effects had anunfavourable impact, net of tax, of $198 million relative tomanagement’s measure of performance.
The primary additional factors affecting profit for 2009, comparedwith 2008, were lower realizations and refining margins, partly offset byhigher production, stronger operational performance and lower costs.
The primary additional factors reflected in profit for 2008,compared with 2007, were higher realizations, a higher contributionfrom the gas marketing and trading business, improved oil supply andtrading performance, improved marketing performance and strong costmanagement; however, these positive effects were partly offset byweaker refining margins, particularly in the US, higher production taxes,higher depreciation, and adverse foreign exchange impacts.
BOL08439_p006 p17_Group over:20 F 5/3/10 17:31 Page 12 Bleed: 0�mm Scale: 100%
12

Business review
13
Our total hydrocarbon production during 2009 averaged 3,998mboe/d(2,684mboe/d for subsidiaries and 1,314mboe/d for equity-accountedentities). This represents an increase of 4% (an increase of 6% forliquids and an increase of 2% for gas) when compared with 2008. In aggregate, after adjusting for entitlement impacts in our production-sharing agreements (PSAs) and the effect of OPEC quota restrictions,production was 5% higher than 2008. Our total hydrocarbon productionduring 2008 averaged 3,838mboe/d (2,517mboe/d for subsidiaries and1,321mboe/d for equity accounted-entities). This represented anincrease of 0.5% (a decrease of 0.5% for liquids and an increase of 2%for gas) when compared with 2007. In aggregate, after adjusting forentitlement impacts in our PSAs, 2008 production was 5% higher than 2007.
Acquisitions and disposals
There were no significant acquisitions in 2009. Disposal proceeds in2009 were $2,681 million, principally from the sale of our interests in BPWest Java Limited, Kazakhstan Pipeline Ventures LLC and LukArco, andthe sale of our ground fuels marketing business in Greece and retailchurn in the US, Europe and Australasia. Further proceeds from the sale of LukArco are receivable in the next two years. See Financialstatements – Note 3 on page 122.
In 2008, we completed an asset exchange with Husky EnergyInc., and asset purchases from Chesapeake Energy Corporation asdescribed on page 49.
In 2007, BP acquired Chevron’s Netherlands manufacturingcompany, Texaco Raffiniderij Pernis B.V. The acquisition includedChevron’s 31% minority shareholding in Nerefco and certain associatedassets. Disposal proceeds were $4,267 million, which included $1,903million from the sale of the Coryton refinery and $605 million from thesale of our exploration and production gas infrastructure business in the Netherlands.
Production and net proved oil and natural gas reserves
The following table shows our production for the past five years and the estimated net proved oil and natural gas reserves at the end of each of those years.
Production and net proved reservesa
2009f 2008 2007 2006 2005
Crude oil production for subsidiaries (thousand barrels per day) 1,400 1,263 1,304 1,351 1,423Crude oil production for equity-accounted entities (thousand barrels per day) 1,135 1,138 1,110 1,124 1,139Natural gas production for subsidiaries (million cubic feet per day) 7,450 7,277 7,222 7,412 7,512Natural gas production for equity-accounted entities (million cubic feet per day) 1,035 1,057 921 1,005 912Estimated net proved crude oil reserves for subsidiaries (million barrels)b 5,658 5,665 5,492 5,893 6,360Estimated net proved crude oil reserves for equity-accounted entities (million barrels)c 4,853 4,688 4,581 3,888 3,205Estimated net proved natural gas reserves for subsidiaries (billion cubic feet)d 40,388 40,005 41,130 42,168 44,448Estimated net proved natural gas reserves for equity-accounted entities
(billion cubic feet)e 4,742 5,203 3,770 3,763 3,856
a Crude oil includes natural gas liquids (NGLs) and condensate. Production and proved reserves exclude royalties due to others, whether payable in cash or in kind, where the royalty owner has a directinterest in the underlying production and the option and ability to make lifting and sales arrangements independently, and include minority interests in consolidated operations.
b Includes 23 million barrels (21 million barrels at 31 December 2008 and 20 million barrels at 31 December 2007) in respect of the 30% minority interest in BP Trinidad and Tobago LLC.c Includes 243 million barrels (216 million barrels at 31 December 2008 and 210 million barrels at 31 December 2007) in respect of the 6.86% minority interest in TNK-BP (6.80% at 31 December 2008 and
6.51% at 31 December 2007).d Includes 3,068 billion cubic feet of natural gas (3,108 billion cubic feet at 31 December 2008 and 3,211 billion cubic feet at 31 December 2007) in respect of the 30% minority interest in BP Trinidad and
Tobago LLC.e Includes 131 billion cubic feet (131 billion cubic feet at 31 December 2008 and 68 billion cubic feet at 31 December 2007) in respect of the 5.79% minority interest in TNK-BP (5.92% at 31 December
2008 and 5.88% at 31 December 2007).fOn 31 December 2008, the SEC published a revision of Rule 4-10 (a) of Regulation S-X for the estimation of reserves. These revised rules form the basis of the 2009 year-end estimation of provedreserves and the application of the technical aspects resulted in an immaterial increase of less than one per cent to BP’s total proved reserves.
Total net proved reserves 2009a b
(million barrels of oil equivalent)
aCombined basis of subsidiaries and equity-accounted entities, on a basis consistent with generalindustry practice.
bOn 31 December 2008 the SEC published a revision of Rule 4-10 (a) of Regulation S-X for theestimation of reserves. These revised rules form the basis of the 2009 year-end estimation ofproved reserves and the application of the technical aspects resulted in an immaterial increase ofless than 1% to BP‘s total proved reserves.
cCrude oil, condensate and natural gas liquids.
During 2009, 1,908 million barrels of oil and natural gas, on an oilequivalenta basis (mmboe), were added, excluding purchases and sales,to BP’s proved reserves (1,113mmboe for subsidiaries and 795mmboefor equity-accounted entities). At 31 December 2009, BP’s provedreserves were 18,292mmboe (12,621mmboe for subsidiaries and5,671mmboe for equity-accounted entities). Our proved reserves insubsidiaries are located in the US (45%), South America (15%),Australasia (10%), Africa (10%) and the UK (9%). Our proved reserves inequity-accounted entities are located in Russia (69%), South America(21%), and Rest of Asia (9%).
a Natural gas is converted to oil equivalent at 5.8 billion cubic feet (bcf) = 1 million barrels.
Bu
sin
ess r
evie
w
Bu
sin
ess re
vie
w –
Gro
up
overv
iew
BOL08439_p006 p17_Group over:20 F 5/3/10 17:31 Page 13 Bleed: 0�mm Scale: 100%
10,511
7,781
Liquidsc
Natural gas
Business review
14
Risk factorsWe urge you to consider carefully the risks described below. If any ofthese risks occur, we might fail to deliver on our strategic priorities, whichare expressed in terms of safety, people and performance (see page 10).Our business, financial condition and results of operations could sufferand the trading price and liquidity of our securities could decline.
In the current uncertain financial and economic environment, certain risksmay gain more prominence either individually or when taken together. Oiland gas prices are likely to remain volatile with average prices andmargins influenced by changes in supply and demand. This is likely toexacerbate competition in all businesses, which may impact costs andmargins. At the same time, governments are facing greater pressure onpublic finances, which may increase their motivation to intervene in thefiscal and regulatory frameworks for the oil and gas industry, includingthe risk of increased taxation. The financial and economic situation mayhave a negative impact on third parties with whom we do, or may do,business. Any of these factors may affect our results of operations,financial condition and liquidity.
Capital markets have regained some confidence after the recentcrisis but if there are extended periods of constraints in these markets, ata time when cash flows from our business operations may be underpressure, our ability to maintain our long-term investment programmemay be impacted with a consequent effect on our growth rate, and mayimpact shareholder returns, including dividends and share buybacks, orshare price. Decreases in the funded levels of our pension plans may alsoincrease our pension funding requirements.
Our system of risk management identifies and provides theresponse to risks of group significance through the establishment ofstandards and other controls. Inability to identify, assess and respond torisks through this and other controls could lead to an inability to captureopportunities, threats materializing, inefficiency and non-compliance withlaws and regulations.
The risks are categorized against the following areas: strategic;compliance and control; and operational.
Strategic risks
Access and renewalSuccessful execution of our group plan depends critically onimplementing activities to renew and reposition our portfolio. Thechallenges to renewal of our upstream portfolio are growing due toincreasing competition for access to opportunities globally. Lack ofmaterial positions in new markets and/or inability to complete disposalscould result in an inability to grow or even maintain our production.
Prices and marketsOil, gas and product prices are subject to international supply anddemand. Political developments and the outcome of meetings of OPECcan particularly affect world supply and oil prices. Previous oil priceincreases have resulted in increased fiscal take, cost inflation and moreonerous terms for access to resources. As a result, increased oil pricesmay not improve margin performance. In addition to the adverse effecton revenues, margins and profitability from any fall in oil and natural gasprices, a prolonged period of low prices or other indicators would lead to
further reviews for impairment of the group’s oil and natural gasproperties. Such reviews would reflect management’s view of long-termoil and natural gas prices and could result in a charge for impairment thatcould have a significant effect on the group’s results of operations in theperiod in which it occurs. Rapid material and/or sustained change in oil,gas and product prices can impact the validity of the assumptions onwhich strategic decisions are based and, as a result, the ensuing actionsderived from those decisions may no longer be appropriate. A prolongedperiod of low oil prices may impact our ability to maintain our long-terminvestment programme with a consequent effect on our growth rate andmay impact shareholder returns, including dividends and share buybacks,or share price. Periods of global recession could impact the demand forour products, the prices at which they can be sold and affect the viabilityof the markets in which we operate.
Refining profitability can be volatile, with both periodic oversupplyand supply tightness in various regional markets. Sectors of thechemicals industry are also subject to fluctuations in supply and demandwithin the petrochemicals market, with a consequent effect on pricesand profitability.
Climate change and carbon pricingCompliance with changes in laws, regulations and obligations relating toclimate change could result in substantial capital expenditure, taxes,reduced profitability from changes in operating costs, and revenuegeneration and strategic growth opportunities being impacted. Ourcommitment to the transition to a lower-carbon economy may createexpectations for our activities, and the level of participation in alternativeenergies carries reputational, economic and technology risks.
Socio-politicalWe have operations in countries where political, economic and socialtransition is taking place. Some countries have experienced politicalinstability, changes to the regulatory environment, expropriation or nationalization of property, civil strife, strikes, acts of war andinsurrections. Any of these conditions occurring could disrupt orterminate our operations, causing our development activities to becurtailed or terminated in these areas or our production to decline andcould cause us to incur additional costs. In particular, our investments inRussia could be adversely affected by heightened political and economicenvironment risks.
We set ourselves high standards of corporate citizenship andaspire to contribute to a better quality of life through the products andservices we provide. If it is perceived that we are not respecting oradvancing the economic and social progress of the communities in whichwe operate, our reputation and shareholder value could be damaged.
CompetitionThe oil, gas and petrochemicals industries are highly competitive. There isstrong competition, both within the oil and gas industry and with otherindustries, in supplying the fuel needs of commerce, industry and thehome. Competition puts pressure on product prices, affects oil productsmarketing and requires continuous management focus on reducing unitcosts and improving efficiency. The implementation of group strategyrequires continued technological advances and innovation includingadvances in exploration, production, refining, petrochemicalsmanufacturing technology and advances in technology related to energyusage. Our performance could be impeded if competitors developed oracquired intellectual property rights to technology that we required or ifour innovation lagged the industry.
BOL08439_p006 p17_Group over:20 F 5/3/10 17:31 Page 14 Bleed: 0�mm Scale: 100%

Business review
15
Investment efficiencyOur organic growth is dependent on creating a portfolio of quality optionsand investing in the best options. Ineffective investment selection couldlead to loss of value and higher capital expenditure.
Reserves replacementSuccessful execution of our group strategy depends critically onsustaining long-term reserves replacement. If upstream resources arenot progressed in a timely and efficient manner, we will be unable tosustain long-term replacement of reserves.
Liquidity, financial capacity and financial exposureThe group has established a financial framework to ensure that it is ableto maintain an appropriate level of liquidity and financial capacity and toconstrain the level of assessed capital at risk for the purposes ofpositions taken in financial instruments. Failure to operate within ourfinancial framework could lead to the group becoming financiallydistressed leading to a loss of shareholder value. Commercial credit riskis measured and controlled to determine the group’s total credit risk.Inability to determine adequately our credit exposure could lead tofinancial loss. A credit crisis affecting banks and other sectors of theeconomy could impact the ability of counterparties to meet their financialobligations to the group. It could also affect our ability to raise capital tofund growth.
Crude oil prices are generally set in US dollars, while sales ofrefined products may be in a variety of currencies. Fluctuations inexchange rates can therefore give rise to foreign exchange exposures,with a consequent impact on underlying costs and revenues.
For more information on financial instruments and financial riskfactors see Financial statements – Note 24 on page 142.
Compliance and control risks
RegulatoryThe oil industry is subject to regulation and intervention by governmentsthroughout the world in such matters as the award of exploration andproduction interests, the imposition of specific drilling obligations,environmental and health and safety protection controls, controls overthe development and decommissioning of a field (including restrictionson production) and, possibly, nationalization, expropriation, cancellation or non-renewal of contract rights. We buy, sell and trade oil and gasproducts in certain regulated commodity markets. Failure to respond to changes in trading regulations could result in regulatory action anddamage to our reputation. The oil industry is also subject to the paymentof royalties and taxation, which tend to be high compared with thosepayable in respect of other commercial activities, and operates in certaintax jurisdictions that have a degree of uncertainty relating to theinterpretation of, and changes to, tax law. As a result of new laws andregulations or other factors, we could be required to curtail or ceasecertain operations, or we could incur additional costs.
For more information on environmental regulation, seeEnvironment on pages 43-45.
Ethical misconduct and non-complianceOur code of conduct, which applies to all employees, defines ourcommitment to integrity, compliance with all applicable legalrequirements, high ethical standards and the behaviours and actions weexpect of our businesses and people wherever we operate. Incidents of ethical misconduct or non-compliance with applicable laws andregulations could be damaging to our reputation and shareholder value.Multiple events of non-compliance could call into question the integrity of our operations.
For certain legal proceedings involving the group, see Legalproceedings on pages 95-96.
Liabilities and provisionsChanges in the external environment, such as new laws and regulations,market volatility or other factors, could affect the adequacy of ourprovisions for pensions, tax, environmental and legal liabilities.
ReportingExternal reporting of financial and non-financial data is reliant on theintegrity of systems and people. Failure to report data accurately and incompliance with external standards could result in regulatory action, legalliability and damage to our reputation.
Operational risks
Process safetyInherent in our operations are hazards that require continuous oversightand control. There are risks of technical integrity failure and loss ofcontainment of hydrocarbons and other hazardous material at operatingsites or pipelines. Failure to manage these risks could result in injury orloss of life, environmental damage, or loss of production and could resultin regulatory action, legal liability and damage to our reputation.
Personal safetyInability to provide safe environments for our workforce and the publiccould lead to injuries or loss of life and could result in regulatory action,legal liability and damage to our reputation.
EnvironmentalIf we do not apply our resources to overcome the perceived trade-offbetween global access to energy and the protection or improvement ofthe natural environment, we could fail to live up to our aspirations of no orminimal damage to the environment and contributing to human progress.Failure to comply with environmental laws, regulations and permits couldlead to damage to the environment and could result in regulatory action,legal liability and damage to our reputation.
SecuritySecurity threats require continuous oversight and control. Acts ofterrorism against our plants and offices, pipelines, transportation orcomputer systems could severely disrupt business and operations andcould cause harm to people.
Product qualitySupplying customers with on-specification products is critical tomaintaining our licence to operate and our reputation in the marketplace.Failure to meet product quality standards throughout the value chaincould lead to harm to people and the environment and loss of customers.
Drilling and productionExploration and production require high levels of investment and aresubject to natural hazards and other uncertainties, including thoserelating to the physical characteristics of an oil or natural gas field. Thecost of drilling, completing or operating wells is often uncertain. We maybe required to curtail, delay or cancel drilling operations because of avariety of factors, including unexpected drilling conditions, pressure orirregularities in geological formations, equipment failures or accidents,adverse weather conditions and compliance with governmentalrequirements.
TransportationAll modes of transportation of hydrocarbons involve inherent risks. A lossof containment of hydrocarbons and other hazardous material couldoccur during transportation by road, rail, sea or pipeline. This is asignificant risk due to the potential impact of a release on theenvironment and people and given the high volumes involved.
Bu
sin
ess r
evie
w
Bu
sin
ess re
vie
w –
Gro
up
overv
iew
BOL08439_p006 p17_Group over:20 F 5/3/10 17:31 Page 15 Bleed: 0�mm Scale: 100%

Business review
16
Major project deliverySuccessful execution of our group plan depends critically onimplementing the activities to deliver the major projects over the planperiod. Poor delivery of any major project that underpins productiongrowth and/or a major programme designed to enhance shareholdervalue could adversely affect our financial performance.
Digital infrastructureThe reliability and security of our digital infrastructure are critical tomaintaining our business applications availability. A breach of our digitalsecurity could cause serious damage to business operations and, insome circumstances, could result in injury to people, damage to assets,harm to the environment and breaches of regulations.
Business continuity and disaster recoveryContingency plans are required to continue or recover operationsfollowing a disruption or incident. Inability to restore or replace criticalcapacity to an agreed level within an agreed timeframe would prolong the impact of any disruption and could severely affect business and operations.
Crisis managementCrisis management plans and capability are essential to deal withemergencies at every level of our operations. If we do not respond or are perceived not to respond in an appropriate manner to either anexternal or internal crisis, our business and operations could be severely disrupted.
People and capabilitySuccessful recruitment of new staff, employee training, development andlong-term renewal of skills, in particular technical capabilities such aspetroleum engineers and scientists, are key to implementing our plans.Inability to develop the human capacity and capability across theorganization could jeopardize performance delivery.
Treasury and trading activitiesIn the normal course of business, we are subject to operational riskaround our treasury and trading activities. Control of these activities ishighly dependent on our ability to process, manage and monitor a largenumber of complex transactions across many markets and currencies.Shortcomings or failures in our systems, risk management methodology,internal control processes or people could lead to disruption of ourbusiness, financial loss, regulatory intervention or damage to ourreputation.
Our systems of controlThe board is responsible for the direction and oversight of BP. The boardhas set an overall goal for BP, which is to maximize long-term shareholdervalue through the allocation of its resources to activities in the oil, naturalgas, petrochemicals and energy businesses. The board delegatesauthority for achieving this goal to the group chief executive (GCE).
The board maintains five permanent committees that arecomposed entirely of non-executives. The board and its committeesmonitor, among other things, the identification and management of thegroup’s risks – both financial and non-financial. During the year, theboard’s committees engaged with executive management, the generalauditor and other monitoring and assurance providers (such as the groupcompliance and ethics officer and the external auditor) on a regular basisas part of their oversight of the group’s risks. Significant incidents thatoccurred and management’s response to them were considered by theappropriate committee and reported to the board. (See Boardperformance report on pages 65 to 76.)
The GCE maintains a comprehensive system of internal control.This comprises the holistic set of management systems, organizationalstructures, processes, standards and behaviours that are employed toconduct our business and deliver returns for shareholders. The system isdesigned to meet the expectations of internal control of the CombinedCode in the UK and of COSO (committee of the sponsoring organizationsfor the Treadway Commission) in the US. It addresses risks and how weshould respond to them as well as the overall control environment. Eachcomponent of the system has been designed to respond to a particulartype or collection of risks. Material risks are described within the Riskfactors section (see pages 14 to 16).
Key elements of our system of internal control are: the controlenvironment; the management of risk and operational performance(including in relation to financial reporting); and the management ofpeople and individual performance. Controls include the BP code ofconduct, our leadership framework and our principles for delegation ofauthority, which are designed to make sure employees understand whatis expected of them.
As part of the control system, the GCE’s senior team – known as the executive team – is supported by sub-committees that areresponsible for and monitor specific group risks. These include the groupoperations risk committee (GORC), the group financial risk committee(GFRC), the group people committee (GPC), and the group disclosurescommittee (GDC), which reviews the disclosures, controls andprocedures over reporting.
Operations and investments are conducted and reported inaccordance with, and associated risks are thereby managed through,relevant standards and processes. These range from group standards,which set out processes for major areas such as safety and integrity,through to detailed administrative instructions on issues such as fraudreporting. The GCE conducts regular performance reviews with thesegments and key functions to monitor performance and themanagement of risk and to intervene if necessary. People managementis based on performance objectives, through which individuals areaccountable for delivering specific elements of the group plan withinagreed boundaries.
BOL08439_p006 p17_Group over:20 F 5/3/10 17:31 Page 16 Bleed: 0�mm Scale: 100%

Business review
17
Forward-looking statementsIn order to utilize the ‘Safe Harbor’ provisions of the United States PrivateSecurities Litigation Reform Act of 1995, BP is providing the followingcautionary statement. This document contains certain forward-lookingstatements with respect to the financial condition, results of operationsand businesses of BP and certain of the plans and objectives of BP withrespect to these items. These statements may generally, but not always,be identified by the use of words such as ‘will’, ‘expects’, ‘is expected to’,‘aims’, ‘should’, ‘may’, ‘objective’, ‘is likely to’, ‘intends’, ‘believes’, ‘plans’,‘we see’ or similar expressions. In particular, among other statements,(i) certain statements in Business review (pages 6-59), including underthe headings ‘Outlook’, with regard to strategy, management aims andobjectives, future capital expenditure, the future scrip dividendprogramme, future hydrocarbon production volume and the group’s abilityto satisfy its long-term sales commitments from future supplies availableto the group, date(s) or period(s) in which production is scheduled orexpected to come onstream or a project or action is scheduled orexpected to begin or be completed, capacity of planned plants or facilitiesand impact of health, safety and environmental regulations; (ii) thestatements in Business review (pages 6-48) with regard to anticipatedenergy demand and consumption, global economic recovery, oil and gasprices, global reserves, expected future energy mix and the potential forcleaner and more efficient sources of energy, management aims andobjectives, strategy, production, petrochemical and refining margins,anticipated investment in Alternative Energy, anticipated future projectdevelopments, growth of the international businesses, Refining andMarketing investments, reserves increases through technologicaldevelopments, with regard to planned investment or other projects,timing and ability to complete announced transactions and futureregulatory actions; and (iii) the statements in Business review (pages 49-59) with regard to the plans of the group, the cost of and provision forfuture remediation programmes and environmental operating and capitalexpenditures, taxation, liquidity and costs for providing pension and otherpost-retirement benefits; and including under ‘Liquidity and capitalresources’ – Trend Information, with regard to global economic recovery,oil and gas prices, petrochemical and refining margins, production,demand for petrochemicals, production and production growth,depreciation, underlying average quarterly charge from Other businessesand corporate, costs, foreign exchange and energy costs, capitalexpenditure, timing and proceeds of divestments, balance of cashinflows and outflows, dividend and optional scrip dividend, cash flows,shareholder distributions, gearing, working capital, guarantees, expectedpayments under contractual and commercial commitments and purchaseobligations; are all forward-looking in nature.
By their nature, forward-looking statements involve risk anduncertainty because they relate to events and depend on circumstancesthat will or may occur in the future and are outside the control of BP.Actual results may differ materially from those expressed in suchstatements, depending on a variety of factors, including the specificfactors identified in the discussions accompanying such forward-lookingstatements; the timing of bringing new fields onstream; future levels ofindustry product supply, demand and pricing; operational problems;general economic conditions; political stability and economic growth inrelevant areas of the world; changes in laws and governmentalregulations; actions by regulators; exchange rate fluctuations;development and use of new technology; the success or otherwise ofpartnering; the actions of competitors; natural disasters and adverseweather conditions; changes in public expectations and other changes tobusiness conditions; wars and acts of terrorism or sabotage; and otherfactors discussed elsewhere in this report including under ‘Risk factors’on pages 14-16. In addition to factors set forth elsewhere in this report,those set out above are important factors, although not exhaustive, thatmay cause actual results and developments to differ materially fromthose expressed or implied by these forward-looking statements.
Statements regarding competitive positionStatements referring to BP’s competitive position are based on thecompany’s belief and, in some cases, rely on a range of sources,including investment analysts’ reports, independent market studies andBP’s internal assessments of market share based on publicly availableinformation about the financial results and performance of marketparticipants.
Further note on certain activitiesDuring the period covered by this report, non-US subsidiaries or othernon-US entities of BP, conducted limited activities in, or with personsfrom, certain countries identified by the US Department of State as StateSponsors of Terrorism (‘Sanctioned Countries’). These activities continueto be insignificant to the group’s financial condition and results ofoperations.
BP has interests in, and is the operator of, two fields and apipeline located outside Iran in which the National Iranian Oil Company(NIOC) and an affiliated entity have interests. BP buys crude oil, refineryand petrochemicals feedstocks, blending components and LPG of Iranianorigin or from Iranian counterparties primarily for sale to third parties inEurope and a small portion is used by BP in its own facilities in SouthAfrica and Europe. Until recently BP held an equity interest in an Iranianjoint venture that has a blending facility and markets lubricants for sale todomestic consumers. In January 2010, BP restructured its interest in thejoint venture and currently maintains its involvement through certaincontractual arrangements, which it keeps under review in light of pendinglegislative developments in the US. BP does not seek to obtain from thegovernment of Iran licences or agreements for oil and gas projects inIran, is not conducting any technical studies in Iran and does not own oroperate any refineries or petrochemicals plants in Iran.
BP sells lubricants in Cuba through a 50:50 joint venture there andin 2009 purchased a cargo of naphtha from a non-Cuban counterpartythat was loaded in Cuba. In Syria, lubricants are sold through a distributorand BP obtains crude oil and refinery feedstocks for sale to third partiesin Europe. In addition, BP sells crude oil and refined products into Syria.
BP supplies fuels and lubricants to airlines and shippingcompanies from Sanctioned Countries at airports and ports locatedoutside these countries.
BP monitors its activities with Sanctioned Countries and keepsthem under review to ensure compliance with applicable laws andregulations of the US and other countries where BP operates.
Bu
sin
ess r
evie
w
Bu
sin
ess re
vie
w –
Gro
up
overv
iew
BOL08439_p006 p17_Group over:20 F 5/3/10 17:31 Page 17 Bleed: 0�mm Scale: 100%

Exploration and ProductionOur Exploration and Production segment includes upstream andmidstream activities in 30 countries, including Angola, Azerbaijan,Canada, Egypt, Russia, Trinidad & Tobago (Trinidad), Norway, the UK, theUS and locations within Asia Pacific, Latin America, North Africa and theMiddle East, as well as gas marketing and trading activities, primarily inCanada, Europe and the US. Upstream activities involve oil and naturalgas exploration and field development and production. Our explorationprogramme is currently focused around Angola, Egypt, the deepwaterGulf of Mexico, Libya, the North Sea, Oman and onshore US. Majordevelopment areas include Algeria, Angola, Asia Pacific, Azerbaijan, Egyptand the deepwater Gulf of Mexico. During 2009, production came from21 countries. The principal areas of production are Angola, Asia Pacific,Azerbaijan, Egypt, Latin America, the Middle East, Russia, Trinidad, theUK and the US.
Midstream activities involve the ownership and management ofcrude oil and natural gas pipelines, processing facilities and exportterminals, LNG processing facilities and transportation, and our NGLextraction businesses in the US, the UK, Canada and Indonesia. Ourmost significant midstream pipeline interests are the Trans-AlaskaPipeline System in the US, the Forties Pipeline System and the CentralArea Transmission System pipeline, both in the UK sector of the NorthSea, the South Caucasus Pipeline (SCP), which takes gas from Azerbaijanthrough Georgia to the Turkish border and the Baku-Tbilisi-Ceyhanpipeline, running through Azerbaijan, Georgia and Turkey. Major LNGactivities are located in Trinidad, Indonesia and Australia. BP is alsoinvesting in the LNG business in Angola.
Additionally, our activities include the marketing and trading ofnatural gas, power and natural gas liquids. These activities provide routesinto liquid markets for BP’s gas and power, and generate margins andfees associated with the provision of physical and financial products tothird parties and additional income from asset optimization and trading.
Our oil and natural gas production assets are located onshore andoffshore and include wells, gathering centres, in-field flow lines,processing facilities, storage facilities, offshore platforms, exportsystems (e.g. transit lines), pipelines and LNG plant facilities.
Upstream operations in Argentina, Bolivia, Chile, Abu Dhabi,Kazakhstan, Venezuela and Russia, as well as some of our operations inAngola, Canada and Indonesia, are conducted through equity-accountedentities.
Our market
The market environment in which we operate was particularly challengingduring 2009, with crude oil and natural gas prices at lower levels than wehave experienced in recent history.
The annual average crude oil price declined in 2009 for the firsttime since 2001, breaking an unprecedented string of seven consecutiveannual increases. Dated Brent for the year averaged $61.67 per barrel,about 37% below 2008’s record average of $97.26 per barrel. Priceswere lowest at the beginning of the year as the world economy grappledwith the sharpest downturn in modern economic history.
In 2010, we expect oil market movements to continue to bedriven by developments in the world economy, by their resultingimplications for oil consumption, and by OPEC production decisions.
Natural gas prices weakened in 2009 and were volatile. Theaverage US Henry Hub First of Month Index fell to $3.99/mmBtu in 2009,a 56% decrease from the record $9.04/mmBtu average seen in 2008.
Recession-induced demand declines and strong production caused pricesto drop from $6.16/mmBtu at the start of the year to $2.84/mmBtu inSeptember. However, over the course of the year, the impact was partlyoffset as US regional gas price differentials narrowed, driven partly by theRockies Express Pipeline extension allowing the transportation of largerquantities of gas out of the Rockies area. Reduced imports from Canada,slowing US production growth and cooler temperatures allowed prices torecover to $4.49/mmBtu by the end of the year. Prices at the UK NationalBalancing Point similarly fell to an average of 30.85 pence per therm,47% below the 2008 average price of 58.12 pence per therm.
In 2009, there was a switch of uncontracted LNG cargoes fromAsia to Europe, reflecting a shift in relative spot prices. LNG imports toEurope have competed with pipeline imports, where the gas price isoften indexed to oil prices, as well as with marginal European gasproduction. On an energy equivalent basis, gas prices were often ator below parity with coal, which led to gas displacing coal in powergeneration in Europe and the US.
In the event of any recovery in the economy in 2010, both the USand UK gas markets are expected to benefit although the price upside islikely to be constrained as a result of a record amount of LNG expectedto become available globally.
Our strategy
Our strategy is to invest to grow production safely, reliably and efficientlyby:• Strengthening our portfolio of leadership positions in the world’s most
prolific hydrocarbon basins, enabled by the development andapplication of technology and strong relationships based on mutualadvantage.
• Sustainably driving cost and capital efficiency in accessing, finding,developing and producing resources, enabled by deep technicalcapability and a culture of continuous improvement.
Our performance
In Exploration and Production, safety, both personal and process, remainsour highest priority. 2009 brought further improvements in personalsafety with our reported recordable injury frequency improving from 0.43in 2008 to 0.39 in 2009. We also achieved improvements in the numberof reported process safety-related incidents and a significant reduction inthe number of reported spills.
BP’s operating management system (OMS) provides us witha systematic framework for safe, reliable and efficient operations.Throughout 2009, OMS helped us to deliver continuous improvement inthe way we manage our people, processes, plant and performance.
From onshore production facilities to offshore platforms, a totalof 47 exploration and production sites had completed their transition toOMS by the end of 2009. The remaining seven sites are on track totransition to OMS in 2010.
18
Business review
BOL08439_p018 p22_Bus rev:20 F 5/3/10 17:31 Page 18 Bleed: 0�mm Scale: 100%

We continually seek to access resources and in 2009 this included Iraq,where, together with China National Petroleum Corporation (CNPC), weentered into a contract with the state-owned South Oil Company (SOC)to expand production from the Rumaila field; Jordan, where on 3 January2010, we received approval from the Government of Jordan to join thestate-owned National Petroleum Company (NPC) to exploit the onshoreRisha concession in the north east of the country; further access inEgypt, where we were awarded two blocks in an offshore area of theNile Delta; Indonesia, where we signed a production-sharing agreement(PSA) for the exploration and development of coalbed methane in theSanga-Sanga block, supplying gas to Indonesia’s largest LNG exportfacility and, subject to Government of Indonesia approval, farmed intoChevron’s West Papua I & III blocks; and the Gulf of Mexico, where wewere awarded 61 blocks through the Outer Continental Shelf Lease Sales208 and 210.
In 2009, we were involved in a number of discoveries. The mostsignificant of these were in the deepwater Gulf of Mexico with the Tiberwell; Angola, where we made three further discoveries in the ultradeepwater Block 31; and Canada, where we discovered natural gas withthe Ellice J27 well.
Seven major projects came onstream. We continue to grow ourposition and leverage our experience as the largest producer in the Gulfof Mexico, starting up three projects ahead of schedule, including thesecond phase of Atlantis. In addition, production commenced at ourSavonette field in Trinidad, at our Tangguh LNG project in Indonesia and,through TNK-BP, we saw the start-up of a further two projects, in thenorthern hub of Kamennoye, and the Urna and Ust-Tegus fields in theUvat area.
Production from our established centres – including the NorthSea, Alaska, North America Gas and Trinidad – was on plan, withimproved operating efficiency for the segment as a whole, and we hadstrong production growth in the Gulf of Mexico, including excellentperformance from Thunder Horse. Production from Egypt and TNK-BPalso made a strong contribution to our growth.
Production for the year was up more than 4% from last year. Afteradjusting for the effect of entitlement changes in our PSAs and the effectof OPEC quota restrictions, underlying production growtha was 5%higher than 2008.
aUnderlying production growth excludes the effect of entitlement changes in our PSAs (driven bychanges in oil and gas prices) and the effect of OPEC quota restrictions.
We also reduced unit production costs through a combination of high-grading activity, improving execution efficiency, capturing the benefitsof the deflationary cost environment at the beginning of the year andfavourable foreign exchange effects. During 2009 we improved thequality of our procurement and supply chain management organization,systems and processes, which we expect will help deliver sustained costefficiency in the future.
The replacement cost profit before interest and tax was$24.8 billion, a 35% decrease compared with the record level in 2008.This result was primarily driven by lower oil and gas realizations, lowerincome from equity-accounted entities and higher depreciation, partlyoffset by strong underlying production growth and improved costmanagement, which contributed to a 12% reduction in unit productioncosts. Our financial results are discussed in more detail on pages 51-52.
Total capital expenditure including acquisitions and assetexchanges in 2009 was $14.9 billion (2008 $22.2 billion and 2007$14.2 billion). In 2009, capital expenditure included $306 million relatingto the award of the contract to redevelop the Rumaila field in Iraq.
Development expenditure of subsidiaries incurred in 2009,excluding midstream activities, was $10,396 million, compared with$11,767 million in 2008 and $10,153 million in 2007.
Key statistics
19
Business review
Bu
sin
ess r
evie
w
Bu
sin
ess re
vie
w
BOL08439_p018 p22_Bus rev:20 F 5/3/10 17:31 Page 19 Bleed: 0�mm Scale: 100%
$ million
2009 2008 2007
Sales and other operating revenuesa 57,626 86,170 65,740Replacement cost profit before
interest and taxb 24,800 38,308 27,602Total assets 140,149 136,665 125,736Capital expenditure and acquisitions 14,896 22,227 14,207
$ per barrel
Average BP liquids realizationsc d 56.26 90.20 67.45
$ per thousand cubic feet
Average BP natural gas realizationsc 3.25 6.00 4.53
aIncludes sales between businesses.b Includes profit after interest and tax of equity-accounted entities.cRealizations are based on sales of consolidated subsidiaries only, which excludes equity-accountedentities.
dCrude oil and natural gas liquids.
The table below presents our average sales price per unit of production.$ per unit of productiona
Europe North South Africa Asia Australasia Total groupAmerica America average
Rest ofRest of North Rest of
UK Europe US America Russia Asia
Average sales priceb
2009
Liquidsc 62.19 60.73 53.68 30.77 52.48 57.40 – 61.27 57.22 56.26
Gas 4.68 7.62 3.07 3.53 2.50 3.61 – 3.30 5.25 3.25
2008Liquidsc 89.82 93.77 89.22 64.42 91.61 89.44 – 97.20 86.33 90.20Gas 8.41 6.96 6.77 7.87 4.90 4.46 – 3.63 9.22 6.002007Liquidsc 69.17 70.41 64.18 48.24 65.54 67.81 – 73.00 70.56 67.45Gas 6.40 5.84 5.43 6.24 3.25 3.93 – 3.05 5.96 4.53
a Units of production are barrels for liquids and thousands of cubic feet for gas.b Realizations are based on sales of consolidated subsidiaries only (including transfers between businesses), which excludes equity-accounted entities.c Crude oil and natural gas liquids.

Business review
BOL08439_p018 p22_Bus rev:20 F 5/3/10 17:31 Page 20 Bleed: 0�mm Scale: 100%
The table below presents our average production cost per unit of production.$ per unit of productiona
Europe North South Africa Asia Australasia Total groupAmerica America average
Rest ofRest of North Rest of
UK Europe US America Russia Asia
The average production cost per unit of productiona
2009 12.38 10.72 7.26 14.45 2.20 6.05 – 4.35 1.60 6.39
2008 12.19 8.74 9.02 15.35 2.34 6.72 – 5.24 1.74 7.242007 14.00 7.17 9.03 14.04 2.69 6.43 – 3.81 1.75 7.14
aUnits of production are barrels for liquids and thousands of cubic feet for gas. Amounts do not include ad valorem and severance taxes; and are based on production cost of consolidated subsidiaries only,which excludes equity-accounted entities.
Outlook
Our priorities remain the same – safety, people and performance,focusing on the delivery of safe, reliable and efficient operations.
In 2010, we aim to use the momentum generated in 2009 tocontinue to improve operational, cost and capital efficiency, whileensuring we maintain our priorities of safe, reliable and efficientoperations. We intend to continue to focus on building personnel andtechnological capability for the future. We believe our portfolio of assetsis strong and well positioned to compete and grow in a range of externalconditions. Also in 2010, we intend to create a centralized developmentsorganization to deliver our major projects. By bringing our projectexpertise into one team, we expect to continue our drive for improvedcapital efficiency by fully optimizing our project designs and improvingproject execution.
Upstream activities
ExplorationThe group explores for oil and natural gas under a wide range oflicensing, joint venture and other contractual agreements. We may dothis alone or, more frequently, with partners. BP acts as operator formany of these ventures.
Our exploration and appraisal costs, excluding lease acquisitions,in 2009 were $2,805 million, compared with $2,290 million in 2008 and$1,892 million in 2007. These costs include exploration and appraisaldrilling expenditures, which are capitalized within intangible fixed assets,and geological and geophysical exploration costs, which are charged toincome as incurred. Approximately 68% of 2009 exploration and appraisalcosts were directed towards appraisal activity. In 2009, we participated in503 gross (107 net) exploration and appraisal wells in 12 countries. The principal areas of exploration and appraisal activity were Angola,Egypt, the deepwater Gulf of Mexico, Libya, the North Sea, Oman and onshore US.
Total exploration expense in 2009 of $1,116 million (2008$882 million and 2007 $756 million) included the write-off of expensesrelated to unsuccessful drilling activities in the deepwater Gulf of Mexico($391 million), India ($31 million), Angola ($28 million), Egypt ($27 million),and others ($31 million).
In most cases, reserves booking from new discoveries willdepend on the results of ongoing technical and commercial evaluations,including appraisal drilling.
Reserves and production
Resource progressionBP manages its hydrocarbon resources in three major categories:prospect inventory, contingent resources and proved reserves. When adiscovery is made, volumes usually transfer from the prospect inventoryto the contingent resources category. The contingent resources movethrough various sub-categories as their technical and commercialmaturity increases through appraisal activity.
At the point of final investment decision, most proved reserveswill be categorized as proved undeveloped (PUD). Volumes willsubsequently be recategorized from PUD to proved developed (PD) as aconsequence of development activity. When part of a well’s provedreserves depends on a later phase of activity, only that portion of provedreserves associated with existing, available facilities and infrastructuremoves to PD. The first PD bookings will typically occur at the point of firstoil or gas production. Major development projects typically take one tofour years from the time of initial booking of proved reserves to the startof production. Changes to proved reserves bookings may be made dueto analysis of new or existing data concerning production, reservoirperformance, commercial factors, acquisition and divestment activity andadditional reservoir development activity.
Contingent resources in a field will only be recategorized asproved reserves when all the criteria for attribution of proved status havebeen met and the proved reserves are included in the business plan andscheduled for development, typically within five years. Where, onoccasion, the group decides to book proved reserves wheredevelopment is scheduled to commence after five years, these provedreserves will be booked only where they satisfy the SEC’s criteria forattribution of proved status. There are material volumes of provedundeveloped reserves in Angola, Trinidad, the US, and Canada which arepart of ongoing development activities for which BP has a historical trackrecord of completing comparable projects. In all cases, the volumes arebeing progressed as part of an adopted development plan which calls fordrilling of wells over an extended period of time given the magnitude ofthe development.
In 2009, we converted approximately 2,061mmboe provedundeveloped reserves to proved developed reserves through ongoinginvestment in our upstream development activities. Total developmentexpenditure in Exploration and Production, excluding midstreamactivities, was $12,392 million in 2009 ($10,396 million for subsidiariesand $1,996 million for equity-accounted entities). The major areasconverted in 2009 were Azerbaijan, Indonesia, Russia, Trinidad andthe US.
20

BP bases its proved reserves estimates on the requirement ofreasonable certainty with rigorous technical and commercialassessments based on conventional industry practice. BP only appliestechnologies that have been field tested and have been demonstrated toprovide reasonably certain results with consistency and repeatability inthe formation being evaluated or in an analogous formation. BP applieshigh resolution seismic data for the identification of reservoir extent andfluid contacts only where there is an overwhelming track record ofsuccess in its local application. In certain deepwater fields, such as fieldsin the Gulf of Mexico, BP has booked proved reserves before productionflow tests are conducted, in part because of the significant safety, costand environmental implications of conducting these tests. The industryhas made substantial technological improvements in understanding,measuring and delineating reservoir properties without the need for flowtests. To determine reasonable certainty of commercial recovery, BPemploys a general method of reserves assessment that relies on theintegration of three types of data: (1) well data used to assess the localcharacteristics and conditions of reservoirs and fluids; (2) field scaleseismic data to allow the interpolation and extrapolation of thesecharacteristics outside the immediate area of the local well control; and(3) data from relevant analogous fields. Well data includes appraisal wellsor sidetrack holes, full logging suites, core data and fluid samples. BPconsiders the integration of this data in certain cases to be superior to aflow test in providing understanding of overall reservoir performance. Thecollection of data from logs, cores, wireline formation testers, pressuresand fluid samples calibrated to each other and to the seismic data canallow reservoir properties to be determined over a greater volume thanthe localized volume of investigation associated with a short-term flowtest. There is a strong track record of proved reserves recorded usingthese methods, validated by actual production levels.
GovernanceBP’s centrally controlled process for proved reserves estimation approvalforms part of a holistic and integrated system of internal control. Itconsists of the following elements:• Accountabilities of certain officers of the group to ensure that there
is review and approval of proved reserves bookings independent ofthe operating business and that there are effective controls in theapproval process and verification that the proved reserves estimatesand the related financial impacts are reported in a timely manner.
• Capital allocation processes, whereby delegated authority isexercised to commit to capital projects that are consistent with thedelivery of the group’s business plan. A formal review process existsto ensure that both technical and commercial criteria are met prior tothe commitment of capital to projects.
• Internal Audit, whose role includes systematically examining theeffectiveness of the group’s financial controls designed to assure thereliability of reporting and safeguarding of assets and examining thegroup’s compliance with laws, regulations and internal standards.
• Approval hierarchy, whereby proved reserves changes above certainthreshold volumes require central authorization and periodic reviews.The frequency of review is determined according to field size andensures that more than 80% of the BP proved reserves baseundergoes central review every two years and more than 90% isreviewed centrally every four years.
BP’s segment resources authority is the petroleum engineer primarilyresponsible for overseeing the preparation of the reserves estimate.He has over 35 years of diversified industry experience with the past 10spent as the head of the reservoir management function within BP. He isa member of the Society of Petroleum Engineers (SPE) and the Instituteof Materials, Minerals and Mining. On the retirement of the current
segment resources authority in 2010, his responsibilities for reservesestimation, governance and compliance will be taken by the current vicepresident of segment reserves. The current vice president of segmentreserves has over 25 years of diversified industry experience with thepast seven spent managing the governance and compliance of BP’sreserves estimation. He is a sitting member of the SPE Oil and GasReserves Committee and the United Nations Economic Commissionfor Europe Expert Group on Resource Classification.
For the executive directors and senior management, no specificportion of compensation bonuses is directly related to proved reservestargets. Additions to proved reserves is one of several indicators bywhich the performance of the Exploration and Production segment isassessed by the remuneration committee for the purposes ofdetermining compensation bonuses for the executive directors. Otherindicators include a number of financial and operational measures.
BP’s variable pay programme for the other senior managers in theExploration and Production segment is based on individual performancecontracts. Individual performance contracts are based on agreed itemsfrom the business performance plan, one of which, if chosen, couldrelate to proved reserves.
Proved reserves replacementTotal hydrocarbon proved reserves, on an oil equivalent basis includingequity-accounted entities, comprised 18,292mmboe (12,621mmboe forsubsidiaries and 5,671mmboe for equity-accounted entities) at31 December 2009, an increase of 0.8% (increase of 0.5% forsubsidiaries and increase of 1.5% for equity-accounted entities)compared with 31 December 2008. Natural gas represents about 43%(55% for subsidiaries and 14% for equity-accounted entities) of thesereserves. The increase includes a net decrease from acquisitions anddivestments of 282mmboe, (59mmboe net decrease for subsidiaries and 223mmboe net decrease for equity-accounted entities) largelycomprising a number of assets in Bolivia, Indonesia, Kazakhstan, Pakistanand the UK.
The proved reserves replacement ratio is the extent to whichproduction is replaced by proved reserves additions. This ratio isexpressed in oil equivalent terms and includes changes resulting fromrevisions to previous estimates, improved recovery and extensions anddiscoveries, and may be expressed as a replacement ratio excludingacquisitions and divestments or as a total replacement ratio includingacquisitions and divestments. For 2009 the proved reserves replacementratio excluding acquisitions and divestments was 129% (121% in 2008and 112% in 2007) for subsidiaries and equity-accounted entities, 112%for subsidiaries alone and 164% for equity-accounted entities alone.
In 2009, net additions to the group’s proved reserves (excludingproduction, sales and purchases of reserves-in-place and equity-accounted entities) amounted to 1,113mmboe (795mmboe for equity-accounted entities), principally through improved recovery from, andextensions to, existing fields and discoveries of new fields. Of oursubsidiary reserves additions through improved recovery from, andextensions to, existing fields and discoveries of new fields, approximately55% are associated with new projects and are proved undevelopedreserves additions. Volumes added in 2009 principally relied on theapplication of conventional technologies. The remaining additions are inexisting developments where they represent a mixture of proveddeveloped and proved undeveloped reserves. The principal reservesadditions in our subsidiaries were in the US (Arkoma, Mad Dog, PrudhoeBay, Thunder Horse), the UK (Clair), Trinidad (Kapok), Angola (Pazflor) andAustralia (Jansz-Io). The principal reserves additions in our equity-accounted entities were in Argentina (Cerro Dragon, Cuenca MarinaAustral) and in Russia (Kamennoye, Samatlor).
21
Business review
Bu
sin
ess r
evie
w
Bu
sin
ess re
vie
w
BOL08439_p018 p22_Bus rev:20 F 5/3/10 17:31 Page 21 Bleed: 0�mm Scale: 100%

22
Business review
BOL08439_p018 p22_Bus rev:20 F 5/3/10 17:31 Page 22 Bleed: 0�mm Scale: 100%
ComplianceInternational Financial Reporting Standards (IFRSs) do not providespecific guidance on reserves disclosures. BP estimates proved reservesin accordance with SEC Rule 4-10 (a) of Regulation S-X and relevantCompliance and Disclosure Interpretations (C&DI) and Staff AccountingBulletins as issued by the SEC staff. On 31 December 2008, the SECpublished a revision of Rule 4-10 (a) of Regulation S-X for the estimationof reserves. These revised rules form the basis of the 2009 year-endestimation of proved reserves and the application of the technical aspectsresulted in an immaterial increase of less than 1% to BP’s total provedreserves. The reasons for the increase are primarily due to the applicationof reliable technologies and inclusion of proved reserves more than onespacing away from existing penetrations as discussed below.
By their nature, there is always some risk involved in the ultimatedevelopment and production of proved reserves, including, but notlimited to, final regulatory approval, the installation of new or additionalinfrastructure as well as changes in oil and gas prices, changes inoperating and development costs and the continued availability ofadditional development capital. All the group’s proved reserves held insubsidiaries and equity-accounted entities are estimated by the group’spetroleum engineers.
Our proved reserves are associated with both concessions (taxand royalty arrangements) and agreements where the group is exposedto the upstream risks and rewards of ownership, but where title to thehydrocarbons is not conferred, such as PSAs. In a concession, theconsortium of which we are a part is entitled to the proved reserves thatcan be produced over the licence period, which may be the life of thefield. In a PSA, we are entitled to recover volumes that equate to costsincurred to develop and produce the proved reserves and an agreedshare of the remaining volumes or the economic equivalent. As part ofour entitlement is driven by the monetary amount of costs to berecovered, price fluctuations will have an impact on both productionvolumes and reserves. Fourteen percent of our proved reserves areassociated with PSAs. The main countries in which we operate underPSAs are Algeria, Angola, Azerbaijan, Egypt, Indonesia and Vietnam.
We disclose our share of proved reserves held in equity-accounted entities (jointly controlled entities and associates), althoughwe do not control these entities or the assets held by such entities.
Production
Our total hydrocarbon production during 2009 averaged 3,998 thousandbarrels of oil equivalent per day (mboe/d). This comprised 2,684mboe/dfor subsidiaries and 1,314mboe/d for equity-accounted entities, anincrease of 6.6% and a decrease of 0.5% respectively compared with2008. For subsidiaries, 40% of our production was in the US, 17% inTrinidad and 10% in the UK. For equity-accounted entities, 71% ofproduction was from Russia, 14% in the United Arab Emirates and 11%in Argentina.
The strong growth in production in 2009 benefited by about40mboe/d on an annual basis from a combination of the absence of asignificant hurricane season and from the make-up of a prior periodunderlift. As a result, we expect production in 2010 to be slightly lowerthan in 2009. The actual growth rate will depend on a number of factors,including our pace of capital spending, the efficiency of that spend, theoil price and its impact on PSAs, as well as OPEC quota restrictions.
The group and its equity-accounted entities have numerous long-term sales commitments in their various business activities, all of whichare expected to be sourced from supplies available to the group whichare not subject to priorities, curtailments or other restrictions. No singlecontract or group of related contracts is material to the group.
The following tables show BP’s estimated net proved reserves as at31 December 2009.
Estimated net proved reserves of liquids at 31 December 2009a b
million barrels
Developed Undeveloped Total
UK 403 291 694Rest of Europe 83 184 267US 1,862 1,211 3,073c
Rest of North America 11 1 12South America 49 56 105d
Africa 422 454 876Rest of Asia 182 334 516Australasia 58 57 115Subsidiaries 3,070 2,588 5,658Equity-accounted entities 3,121 1,732 4,853e
Total 6,191 4,320 10,511
Estimated net proved reserves of natural gas at 31 December 2009a b
billion cubic feet
Developed Undeveloped Total
UK 1,602 670 2,272Rest of Europe 49 397 446US 9,583 5,633 15,216Rest of North America 716 453 1,169South America 3,177 7,393 10,570f
Africa 1,107 1,454 2,561Rest of Asia 1,579 249 1,828Australasia 3,219 3,107 6,326Subsidiaries 21,032 19,356 40,388Equity-accounted entities 3,035 1,707 4,742g
Total 24,067 21,063 45,130
Net proved reserves on an oil equivalent basis
million barrels of oil equivalent
Developed Undeveloped Total
Subsidiaries 6,696 5,925 12,621Equity-accounted entities 3,644 2,027 5,671Total 10,340 7,952 18,292
aProved reserves exclude royalties due to others, whether payable in cash or in kind, where theroyalty owner has a direct interest in the underlying production and the option and ability to makelifting and sales arrangements independently, and include minority interests in consolidatedoperations. We disclose our share of reserves held in jointly controlled entities and associates thatare accounted for by the equity method although we do not control these entities or the assetsheld by such entities.
bThe 2009 marker prices used were Brent $59.91/bbl (2008 $36.55/bbl and 2007 $96.02/bbl) andHenry Hub $3.82/mmBtu (2008 $5.63/mmBtu and 2007 $7.10/mmBtu).
cProved reserves in the Prudhoe Bay field in Alaska include an estimated 68 million barrels on whicha net profits royalty will be payable over the life of the field under the terms of the BP Prudhoe BayRoyalty Trust.
d Includes 23 million barrels of crude oil in respect of the 30% minority interest in BP Trinidad andTobago LLC.
e Includes 243 million barrels of crude oil in respect of the 6.86% minority interest in TNK-BP.f Includes 3,068 billion cubic feet of natural gas in respect of the 30% minority interest in BP Trinidadand Tobago LLC.
g Includes 131 billion cubic feet of natural gas in respect of the 5.79% minority interest in TNK-BP.

Business review
Bu
sin
ess r
evie
w
Bu
sin
ess re
vie
w
88
16
5
7
2
BOL08439_p023 p34_Bus rev:20 F 5/3/10 17:31 Page 23 Bleed: 0�mm Scale: 100%
23
The following tables show BP’s net production by major field for 2009, 2008 and 2007.
Liquids
thousand barrels per day
BP net share of productiona
Field or area 2009 2008 2007UKb ETAPc 34 27 32
Foinavend 29 26 37Other 105 120 132
Total UK 168 173 201Norway Various 40 43 51Total Rest of Europe 40 43 51Total Europe 208 216 252Alaska Prudhoe Bayd 69 72 74
Kuparuk 45 48 52Milne Pointd 24 27 28Other 43 50 55
Total Alaska 181 197 209Lower 48 onshoreb Various 97 97 108Gulf of Mexico deepwater Thunder Horsed 133 24 –
Atlantisd 54 42 2Mad Dogd 35 31 25Mars 29 28 30Na Kikad 27 29 32Horn Mountaind 25 18 18Kingd 22 23 22Other 62 49 67
Total Gulf of Mexico deepwater 387 244 196Total US 665 538 513Canadab Variousd 8 9Total Rest of North America 8 9Total North America 673 547 521Colombia Variousd 23 24 28Trinidad & Tobago Variousd 38 38 30Venezuelab Various – 4Total South America 61 66 74Angola Greater Plutoniod 70 69 12
Kizomba C Dev 43 30 –Dalia 32 34 31Girassol FPSO 22 22 20Other 44 46 77
Total Angola 211 201 140Egypt Gupco 55 41 36
Other 16 16 7Total Egypt 71 57 43Algeria Various 22 19 12Total Africa 304 277 195Azerbaijan Azeri-Chirag-Gunashlid 94 97 200
Other 7 8Total Azerbaijan 101 105 205Western Indonesiab Various 5 7Other Various 17 16 16Total Rest of Asiab 123 128 228Total Asia 123 128 228Australia Various 31 29 34Total Australasia 31 29 34Total subsidiariese 1,400 1,263 1,304Equity-accounted entities (BP share)Russia – TNK-BPb Various 840 826 832Total Russia 840 826 832Abu Dhabif Various 182 210 192Other Various 12 10 9Total Rest of Asiab 194 220 201Total Asia 1,034 1,046 1,033Argentina Various 75 70 69Venezuelab Various 25 19 6Boliviab Various 1 3Total South America 101 92 77Total equity-accounted entities 1,135 1,138 1,110Total subsidiaries and equity-accounted entities 2,535 2,401 2,414
a Production excludes royalties due to others whether payable in cash or in kind where the royalty owner has a direct interest in the underlying production and the option and ability to make lifting and sales arrangementsindependently.
b In 2009, BP assumed operatorship of the Mirpurkhas and Khipro blocks in Pakistan, swapped a number of assets with BG Group plc in the UK sector of the North Sea, divested some minor interests in the US Lower 48,divested its holdings in Indonesia’s Offshore Northwest Java to Pertamina, divested its interests in LukArco to Lukoil and the Bolivian government nationalized, with compensation payable, Pan American Energy’s shares ofChaco. In 2008, BP concluded the migration of the Cerro Negro operations to an incorporated joint venture with PDVSA while retaining its equity position and TNK-BP disposed of some non-core interests. In 2007, BPdivested its producing properties in the Netherlands and some producing properties in the US Lower 48 and Canada. TNK-BP disposed of its interests in several non-core properties.
c Volumes relate to six BP-operated fields within ETAP. BP has no interests in the remaining three ETAP fields, which are operated by Shell.dBP-operated.eIncludes 26 net mboe/d of NGLs from processing plants in which BP has an interest (2008 19mboe/d and 2007 54mboe/d).f The BP group holds interests, through associates, in onshore and offshore concessions in Abu Dhabi, expiring in 2014 and 2018 respectively. During the second quarter of 2007, we updated our reporting policy in Abu Dhabi to be consistent with general industry practice and as a result we report production and reserves there gross of production taxes.
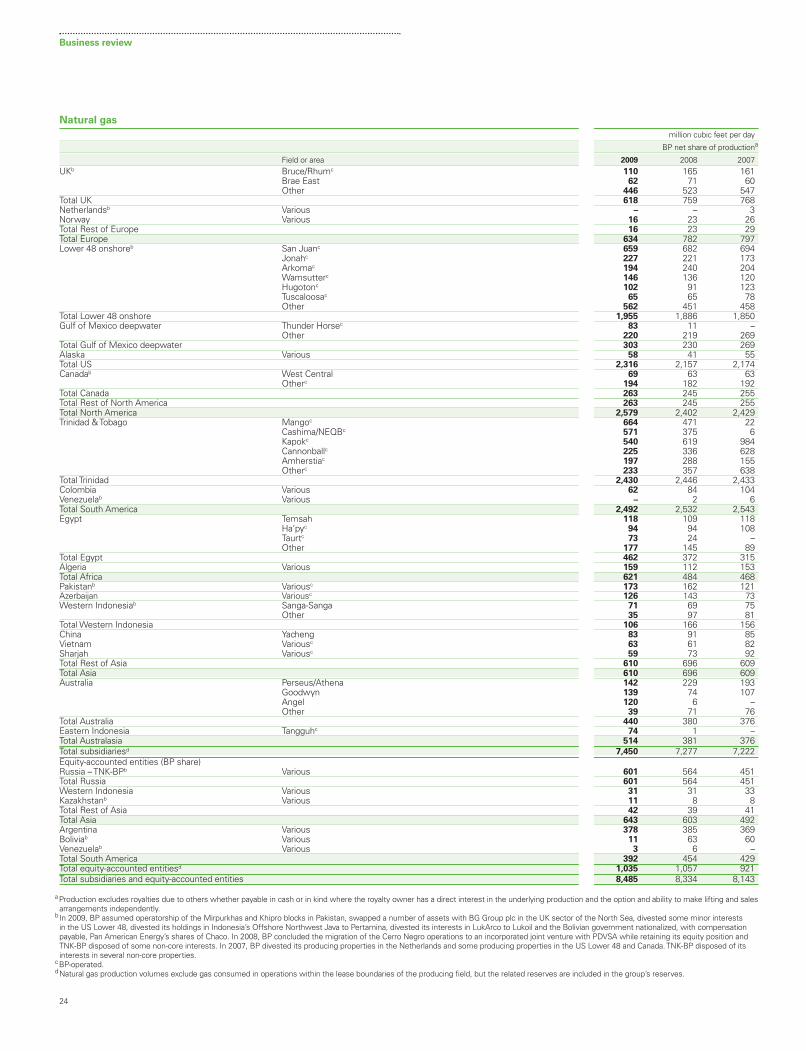
Business review
3
6
–
–
8
–
BOL08439_p023 p34_Bus rev:20 F 5/3/10 17:31 Page 24 Bleed: 0�mm Scale: 100%
24
Natural gas
million cubic feet per day
BP net share of productiona
Field or area 2009 2008 2007UKb Bruce/Rhumc 110 165 161
Brae East 62 71 60Other 446 523 547
Total UK 618 759 768Netherlandsb Various – –Norway Various 16 23 26Total Rest of Europe 16 23 29Total Europe 634 782 797Lower 48 onshoreb San Juanc 659 682 694
Jonahc 227 221 173Arkomac 194 240 204Wamsutterc 146 136 120Hugotonc 102 91 123Tuscaloosac 65 65 78Other 562 451 458
Total Lower 48 onshore 1,955 1,886 1,850Gulf of Mexico deepwater Thunder Horsec 83 11 –
Other 220 219 269Total Gulf of Mexico deepwater 303 230 269Alaska Various 58 41 55Total US 2,316 2,157 2,174Canadab West Central 69 63 63
Otherc 194 182 192Total Canada 263 245 255Total Rest of North America 263 245 255Total North America 2,579 2,402 2,429Trinidad & Tobago Mangoc 664 471 22
Cashima/NEQBc 571 375 6Kapokc 540 619 984Cannonballc 225 336 628Amherstiac 197 288 155Otherc 233 357 638
Total Trinidad 2,430 2,446 2,433Colombia Various 62 84 104Venezuelab Various – 2Total South America 2,492 2,532 2,543Egypt Temsah 118 109 118
Ha’pyc 94 94 108Taurtc 73 24 –Other 177 145 89
Total Egypt 462 372 315Algeria Various 159 112 153Total Africa 621 484 468Pakistanb Variousc 173 162 121Azerbaijan Variousc 126 143 73Western Indonesiab Sanga-Sanga 71 69 75
Other 35 97 81Total Western Indonesia 106 166 156China Yacheng 83 91 85Vietnam Variousc 63 61 82Sharjah Variousc 59 73 92Total Rest of Asia 610 696 609Total Asia 610 696 609Australia Perseus/Athena 142 229 193
Goodwyn 139 74 107Angel 120 6Other 39 71 76
Total Australia 440 380 376Eastern Indonesia Tangguhc 74 1Total Australasia 514 381 376Total subsidiariesd 7,450 7,277 7,222Equity-accounted entities (BP share)Russia – TNK-BPb Various 601 564 451Total Russia 601 564 451Western Indonesia Various 31 31 33Kazakhstanb Various 11 8Total Rest of Asia 42 39 41Total Asia 643 603 492Argentina Various 378 385 369Boliviab Various 11 63 60Venezuelab Various 3 6Total South America 392 454 429Total equity-accounted entitiesd 1,035 1,057 921Total subsidiaries and equity-accounted entities 8,485 8,334 8,143
aProduction excludes royalties due to others whether payable in cash or in kind where the royalty owner has a direct interest in the underlying production and the option and ability to make lifting and salesarrangements independently.
b In 2009, BP assumed operatorship of the Mirpurkhas and Khipro blocks in Pakistan, swapped a number of assets with BG Group plc in the UK sector of the North Sea, divested some minor interestsin the US Lower 48, divested its holdings in Indonesia’s Offshore Northwest Java to Pertamina, divested its interests in LukArco to Lukoil and the Bolivian government nationalized, with compensationpayable, Pan American Energy’s shares of Chaco. In 2008, BP concluded the migration of the Cerro Negro operations to an incorporated joint venture with PDVSA while retaining its equity position andTNK-BP disposed of some non-core interests. In 2007, BP divested its producing properties in the Netherlands and some producing properties in the US Lower 48 and Canada. TNK-BP disposed of itsinterests in several non-core properties.
cBP-operated.dNatural gas production volumes exclude gas consumed in operations within the lease boundaries of the producing field, but the related reserves are included in the group’s reserves.

25
Business review
Bu
sin
ess r
evie
w
Bu
sin
ess re
vie
w
The following narrative reviews operations in our Exploration andProduction business by continent and country, and lists associatedsignificant events that occurred in 2009. Where relevant, BP’s percentageworking interest in oil and gas assets is shown in brackets. Workinginterest is the cost-bearing ownership share of an oil or gas lease. Thepercentages disclosed for certain agreements do not necessarily reflectthe percentage interests in reserves and production.
North America
United StatesOur activities within the US take place in three main areas: deepwaterGulf of Mexico, Lower 48 states and Alaska.
Deepwater Gulf of Mexico:Deepwater Gulf of Mexico is our largest area of growth in the US.In addition, we are the largest producer and acreage holder in the region.
Significant events were:• In May 2009, BP announced it had begun production from the Dorado
(BP 75% and operator) and King South (BP 100%) projects. Bothprojects are subsea tiebacks to the existing BP Marlin Tension LegPlatform (TLP) infrastructure. Dorado comprises three new subseawells located about two miles from the Marlin TLP. King Southcomprises a single subsea well located 18 miles from the Marlin TLP.Both projects leverage existing subsea and topsides infrastructureand the latest subsea and drilling technology to enable the efficientdevelopment of the fields. Dorado utilizes dual completion technologyenabling production from five Miocene zones and King South isproduced through the existing King subsea pump.
• In June 2009, the Atlantis Phase 2 (BP 56%) project achieved first oilahead of schedule, signalling the official start-up.
• In July 2009, BP announced the drilling of a successful appraisal wellin a previously untested southern segment of the Mad Dog field (BP60.5% and operator). The 826-5 well is located in the Green Canyonblock 826, approximately 100 miles south of Grand Isle, Louisiana,in about 5,100 feet of water. The results from this well continue thesuccessful phased development of the Mad Dog field and build uponthe success from 2008.
• In September 2009, BP announced the Tiber discovery in thedeepwater Gulf of Mexico (BP 62% and operator). The discovery well,located in Keathley Canyon block 102, approximately 250 miles south-east of Houston, is in 4,132 feet of water. It was drilled to a totaldepth of approximately 35,055 feet making it the deepest oil and gasdiscovery well ever drilled. The well found oil in multiple LowerTertiary reservoirs. Appraisal will be required to determine the sizeand commerciality of the discovery.
Lower 48 states:Our North America Gas business operates onshore in the Lower 48states producing natural gas, natural gas liquids and coalbed methaneacross 14 states. In 2009, we drilled almost 300 wells as operator andcontinued to maintain a stable programme of drilling activity throughoutthe year. Shale gas assets are becoming an increasingly important part ofour North America Gas business:
Significant events were:• In the fourth quarter of 2009, BP further expanded its shale gas
portfolio by securing new access in the Eagle Ford Shale in SouthTexas. Combined with our 2008 acquisitions of interests inChesapeake Energy Corporation’s Woodford and Fayetteville Shaleassets in the Arkoma Basin and our incumbent position in theHaynesville Shale in East Texas, BP now has a material shale gasposition in the Lower 48 states.
• Since taking over operations of the Woodford shale properties,BP gross operated production has increased from 60mmcf/d inNovember 2008 to over 100mmcf/d by the end of 2009, a 67%increase. BP delivered 23 wells by the end of the year with an
average 30-day rate of 4.6mmcf/d per well, approximately 50% higherthan initial expectations.
• In 2009, BP net production from the Fayetteville shale properties hasgrown from approximately 55mmcf/d to 87mmcf/d at the end of theyear, an increase of approximately 60%. Individual well performancecontinues to exceed expectations by approximately 25%.
• In 2009, BP drilled four wells appraising the Haynesville Shale assetand plans to increase horizontal well drilling in 2010. BP’s position inthe Haynesville Shale in North Louisiana and East Texas covers anarea of approximately 150,000 net acres.
• The business has made good progress in restructuring its activity anddriving down costs to a level that is consistent with the economicenvironment.
Alaska:BP operates 15 North Slope oil fields (including Prudhoe Bay, Endicott,Northstar, and Milne Point) and four North Slope pipelines, and owns asignificant interest in six other producing fields.
Two key aspects of BP’s business strategy in Alaska arecommercializing the large undeveloped natural gas resource within our26.4% interest in Prudhoe Bay and unlocking the large undevelopedheavy oil resources within existing North Slope fields through theapplication of advanced technology.
Significant events were:• In 2009, we progressed the previously announced development
activities for the Liberty oilfield, which is located on federal leasesabout six miles offshore in the Beaufort Sea, and east of the PrudhoeBay oilfield. The planned development includes up to six ultra-extended reach wells, including four producers and two injectors, tobe drilled from existing infrastructure in the BP-operated Endicott fieldto minimize the onshore and offshore environmental footprint. Thesewells are expected to be the longest horizontal wells ever drilled andcompleted in the industry, extending two miles deep and as far aseight miles horizontally. A specialized rig for drilling in the Arctic hasbeen built for the project, and it is the world’s largest and mostpowerful onshore drilling rig. Key project milestones achieved during2009 include expansion of the BP-operated Endicott field satellitedrilling island (SDI) in April; and sealift delivery of the ultra-extendedreach drilling rig to the Endicott SDI in August. Drilling is expected tostart in 2010, with first oil expected in 2011. BP drilled the Libertydiscovery well in 1997, and is the operator and sole owner of the field.
• On 27 January 2009, the Commissioner of the State of AlaskaDepartment of Natural Resources (DNR) issued a ‘Conditional InterimDecision’ in connection with the appeal of the Point Thomson arealease terminations. The Point Thomson Unit (PTU) was terminated byadministrative decision of the DNR in November 2006 (BP 32%). InFebruary 2007, the DNR notified the PTU owners of its decision toterminate the Point Thomson area leases as well. ExxonMobil,operator, and the other unit owners including BP, are pursuing anappeal of the unit termination in the Alaska Superior Court; and thelease terminations are under administrative appeal with the DNR. The27 January 2009 Conditional Interim Decision permitted ExxonMobilto conduct drilling operations on two of the 31 terminated leasescomprising the former PTU. The DNR’s interim decision provided thatthe two leases would be reinstated if certain conditions were met.On 11 January 2010, the Alaska Superior Court reversed the DNRCommissioner’s administrative decision to terminate the PTU. Theparties have been ordered to provide the Court further briefingregarding whether the Court should again remand the matter for anadministrative proceeding with DNR, or retain jurisdiction with theAlaska Superior Court and conduct a de novo proceeding.
BOL08439_p023 p34_Bus rev:20 F 5/3/10 17:31 Page 25 Bleed: 0�mm Scale: 100%

26
Business review
CanadaIn Canada, BP operates in five provinces and two territories, exploring for,developing, producing and processing natural gas and heavy crude oil.We also hold an interest in an oil sands joint venture with Husky EnergyInc., we market natural gas and we are the largest marketer of naturalgas liquids.• In 2009, BP conducted a successful 3D seismic programme over the
primary area of interest on the exploration licences acquired in 2008in the Canadian Beaufort Sea. The programme was the mostnortherly 3D seismic programme ever conducted, with approximately1,600 square kilometres of 3D data acquired. The project also had thelargest array of towed marine streamers deployed in the high Arctic.BP has 2,392,101 acres (968,049 hectares) of significant discoverylicences and exploration licences in the Beaufort Sea.
South America
VenezuelaBP has been in Venezuela since 1994 and currently participates in threeequity-accounted entities.• In 2009, production cuts due to OPEC quota restrictions were
assigned to the Petromonagas and Petroperija entities.Petromonagas’s OPEC quota restrictions resulted in a completeproduction shutdown until 12 July 2009. There is uncertaintyregarding the duration of the quota restrictions in Petroperija.
ColombiaOur main activity in Colombia is concentrated on operating a producingfield complex in the Casanare region. In addition, we operate fourprincipal processing plants and own pipeline interests. BP also holdsexploration rights over two blocks off Colombia’s northern coast in theCaribbean Sea.• During 2009, seismic data processing and interpretation was carried
out at the RC4 and RC5 Caribbean offshore blocks (BP 40.6%) inorder to determine potential prospects. A decision whether to drill awell is expected to be taken in 2010.
• During 2009, the strategy and detailed plan for the termination of theSantiago de las Atalayas field contract by June 2010, and itssubsequent operation by Ecopetrol, was designed and implemented.
Argentina, Bolivia and ChileBP conducts activity in the Southern Cone region of South America(Argentina, Bolivia and Chile) through Pan American Energy (PAE), a jointventure company in which BP holds a 60% interest. As the venture isjointly controlled with Bridas Corporation, it is accounted for using theequity method of accounting. Most of the PAE production comes fromthe Cerro Dragon field in the provinces of Chubut and Santa Cruz.• The Cerro Dragon field is now producing at its highest level since the
licence was granted in 1958, and further expansion programmes areplanned. PAE also has other gas and liquids producing assets in theArgentine provinces of Salta, Neuquen and Tierra del Fuego, and inBolivia. PAE also has interests in exploration areas, pipelines, andother midstream infrastructure assets, primarily in Argentina.
• On 26 November 2008, the Argentine government issued a decree bywhich a new regime on oil and by-products exports, called PetróleoPlus was put in place. This programme provides fiscal relief in theform of fiscal credit certificates, which can be used to offset exporttariffs on oil, LPG and by-products. The goal is to incentivizeinvestment to increase oil production and reserves. As PAE achievedthe targets for both reserves replacement and production growthstipulated in the programme, it has obtained and applied fiscal creditcertificates since January 2009.
• On 23 January 2009, the president of Bolivia issued a decreenationalizing PAE’s investment in 8,049,660 shares of Chaco. Thedecree establishes a compensation value per share, which representsa total amount of $233 million (BP share $140 million), subject toeventual adjustments. The partners assert that this is not an adequatecompensation for the nationalized shares. PAE will pursue anadequate compensation for the nationalized assets.
• On 28 January and 22 May 2009, PAE entered into two agreementswith the Neuquen province in Argentina that provide for the extensionof concession terms related to the exploration and development ofthe Aguada Pichana and San Roque blocks and of the LinderoAtravesado block, respectively.
Trinidad & TobagoBP holds exploration and production licences covering 904,000 acresoffshore of the east coast. Facilities include 12 offshore platforms andone onshore processing facility. Production is comprised of oil, gas andNGLs.• On 27 October 2009, the Savonette offshore field development
began production on a normally unmanned installation platform (NUI).Savonette is located in 290 feet (88 metres) of water approximately50 miles off Trinidad’s south-east coast. Production from the platformis tied in to BP Trinidad and Tobago’s Mahogany B platform and willsupply the Trinidad domestic market as well as Atlantic LNG’sliquefaction plant for export as LNG to international markets. TheSavonette platform, installed in February 2009, is the fourth in aseries of NUIs designed and constructed locally in Trinidad using astandardized ‘clone’ concept. The first three NUIs were Cannonball,Mango and Cashima.
Europe
United KingdomWe are the largest producer of oil, the second largest producer of gasand the largest overall producer of hydrocarbons in the UK. Key aspectsof our activities in the North Sea include a focus on in-field drilling andselected new field developments. Our development expenditure(excluding midstream) in the UK was $751 million in 2009, comparedwith $907 million in 2008 and $804 million in 2007. BP operates one NGLplant in the UK.
Significant events were:• On 31 August 2009, the exchange of assets between BP and BG
Group was formally completed. The exchange is expected tostrengthen BP’s position as a major operator in the southern NorthSea and to facilitate development activity and investment in the UKContinental Shelf. BP acquired BG’s 24.2% interest in the BP-operated Amethyst field and all its interests in the EasingtonCatchment Area fields, including a 73.3% interest in the Mercuryfield, a 79% interest in the Neptune field, a 65% interest in theMinerva, Apollo and Artemis fields and BG’s 30.8% interest in the BP-operated Whittle and Wollaston fields. In return, BG Groupacquired BP’s interest and operatorship in the Everest (BP 21.1%)and Lomond (BP 22.2%) fields, BP’s 18.2% interest in the BG-operated Armada field and 32% of the Chevron-operated Erskine field(BP retained 18% equity in Erskine).
• Drilling performance moved from fourth quartile in 2007 to firstquartile in 2008a, and generated additional drilling capital efficienciesin 2009.
aSource: BP Drilling and Completions Global Benchmarking.
BOL08439_p023 p34_Bus rev:20 F 5/3/10 17:31 Page 26 Bleed: 0�mm Scale: 100%

27
Business review
Bu
sin
ess r
evie
w
Bu
sin
ess re
vie
w
Rest of EuropeOur activities in the Rest of Europe are in Norway.• Development expenditure (excluding midstream) in the Rest of
Europe was $1,054 million, compared with $695 million in 2008 and$443 million in 2007. Progress continued on the Skarv and Valhallredevelopment projects.
Africa
AngolaBP is present in four major deepwater licences offshore Angola (Blocks15, 17, 18 and 31) and is operator in Blocks 18 and 31. In addition, BPholds a 13.6% equity share in the first Angolan LNG project. Technicalskills developed in similar deepwater basins around the world have beenapplied extensively in BP’s operations in Angola.• On 29 December 2008, BP began a comprehensive seismic survey
on Block 31 (BP 26.67% and operator) using a wide azimuth towedstreamer (WATS) to gain improved imaging quality of sub-salt strata.WATS seismic is an acquisition configuration developed by BP toimage areas of complex geology below salt. The WATS survey willsignificantly improve the imaging and understanding of the fields, andmore significantly, the data acquired will also support the definition ofhubs which will form part of BP’s development programme. This isthe first such survey to be conducted by BP outside the Gulf ofMexico, and is the first WATS survey conducted in Angola.
• In 2009, BP announced its seventeenth through nineteenthdiscoveries in the ultra deepwater Block 31. On 3 March 2009, BPannounced the discovery of the Leda field. Leda was drilled in a waterdepth of 2,070 metres and reached a total depth of nearly 6kilometres below sea level. It is located in the central northern portionof Block 31, some 415 kilometres north-west of Luanda. This is thefifth discovery in Block 31 in which the exploration well has beendrilled through salt to access the oil-bearing sandstone reservoirbeneath. On 27 May 2009, BP announced the Oberon oil discovery.Oberon-1 was drilled in a water depth of 1,624 metres and reached atotal depth of 3,622 metres below sea level. On 1 October 2009, BPannounced the Tebe oil discovery. The Tebe well was drilled in a waterdepth of 1,752 metres and a total depth of 3,325 metres below sealevel.
AlgeriaBP is a partner with Sonatrach and Statoil in the In Salah (BP 33.15%)and In Amenas (BP 45.89%) projects, which supply gas to the domesticand European markets. BP is also in partnership with Sonatrach in theRhourde El Baguel (REB) oilfield (BP 60%), an enhanced oil recoveryproject 75 kilometres east of the Hassi Messaoud oilfield. In addition, BPis in partnership with Sonatrach in the Bourarhet Sud block, located to thesouth-west of In Amenas.• In 2008, Sonatrach and BP announced a discovery with the Tin
Zaouatene-1 (TZN-1) exploration well. BP is currently in the secondprospecting period, which runs until September 2010. Seismicoperations started in February 2009 and were completed in October2009. Drilling activities commenced in December 2009.
LibyaIn Libya, BP is in partnership with the Libyan Investment Corporation(LIC) to explore the onshore Ghadames and offshore Sirt basins.• In 2009, BP continued the onshore and offshore seismic operations
started in 2008 on the acreage covered under the exploration andproduction sharing agreement ratified in December 2007 (BP 85%).
• In October 2009, BP completed a large offshore 3D survey in thedeepwaters of the Libyan Gulf of Sirt. The programme, started inSeptember 2008, was conducted by the seismic vessel GeowaveEndeavour (operated by CGGV-Wavefield Inseis), and covered 17,000square kilometres, 60% of BP’s Sirt exploration acreage.
• BP is also progressing its onshore seismic operations in the desertsof Libya’s Ghadames basin. This is the first full application of a new,cutting-edge seismic technique developed by BP, known asIndependent Simultaneous Sweeping (ISS): the technology allowsgreater acquisition (in excess of 10,000 vibration points per daycompared with conventional technology of 1,500 per day) and costefficiency. Exploration drilling is scheduled to commence during 2010in both onshore and offshore blocks.
EgyptBP is the single largest foreign investor in Egypt, with investments closeto $15 billion to date. With its partners, BP has produced almost 40% ofEgypt’s entire oil production and close to 30% of its gas production. TheGulf of Suez Petroleum Company (GUPCO), BP’s joint venture with theEgyptian General Petroleum Corporation, has been an industry leader inEgypt and the entire region and covers operations in the Gulf of Suez andthe Western Desert.• During the second quarter of 2009, BP was awarded two blocks in
the Egyptian Offshore Nile Delta. BP has a 100% working interestand is the operator of Block 2, North Tineh, which is in a deepwaterarea of the Eastern Nile Delta. BP will also be the operator of Block 3,North Damietta Offshore, which is adjacent to Block 2, with Shell andPetronas as partners with a one-third working interest each. Theseawards build on the existing portfolio in Egypt, providing an additionalplatform for growth. BP’s expertise in exploring deepwater, high-pressure and high-temperature deep targets maximizes the chancesof unlocking the potential in this area.
• During the third quarter of 2009, the Egyptian parliament approvedthe amendments to two Gulf of Suez (GOS) concessions: SouthBelayim (BP 100%) and South Ghara (BP 75%). The amendmentsprovide BP with enhanced commercial structure and extend the termof both concessions by 20 years in return for increased investmentlevels. This marks a significant step in the development of theSouthern GOS assets.
Asia
Western IndonesiaBP has a joint interest in Virginia Indonesia Company LLC (VICO), theoperator of the Sanga-Sanga PSA (BP 38%) supplying gas to Indonesia’slargest LNG export facility, the Bontang LNG plant in Kalimantan.• During 2009, VICO successfully completed a joint evaluation of the
coalbed methane (CBM) opportunities in the Sanga-Sanga area. InNovember, VICO signed a PSA with the Government of Indonesia, forthe exploration and development of these CBM resources.
• On 1 July 2009, BP divested its entire 46% holding in the OffshoreNorthwest Java (ONWJ) PSA to Indonesia’s national oil company,Pertamina.
VietnamOur upstream business in Vietnam is concentrated on the Block 6.1offshore gas field. BP participates in one of the country’s largest foreigninvestment projects, the Nam Con Son gas project. This is an integratedresource and infrastructure project, which includes offshore gasproduction, a pipeline transportation system and a power plant.• BP Block 6.1 Lan Do development project was sanctioned in
December 2009, with first gas scheduled in 2012.• BP’s withdrawal from Blocks 5.2 (BP 55.9% and operator) and 5.3
(BP 75% and operator) was completed in December 2009.
ChinaBP’s upstream asset in the country is the Yacheng offshore gas field (BP34.3%) in the South China Sea, one of the biggest offshore gas fields inChina. Yacheng supplies the Castle Peak Power Company gas for up to70% of Hong Kong’s gas-fired electricity generation. Additional gas is alsosold to the Hainan Holdings Fuel & Chemical Corporation Limited.
BOL08439_p023 p34_Bus rev:20 F 5/3/10 17:31 Page 27 Bleed: 0�mm Scale: 100%

28
Business review
• The Platform A development project approved at the end of 2008 ison track to deliver first gas in 2010.
AzerbaijanBP is the largest foreign investor in the country. BP operates two PSAs,Azeri-Chirag-Gunashli (ACG) and Shah Deniz, and also holds otherexploration leases.• A comprehensive review of the subsurface gas release that occurred
beneath the Central Azeri platform in September 2008, andsubsequent remedial works, have resulted in bringing the level ofproduction from the platform to over 220mboe/d from 12 wells.Further minor remedial work is planned during 2010.
• On 13 July 2009, BP and the State Oil Company of the Republic ofAzerbaijan (SOCAR) signed a memorandum of understanding (MOU)to jointly explore and develop the Shafag and Asiman structures inthe Azerbaijan sector of the Caspian Sea. The MOU gives BP theexclusive right to negotiate the PSA. The block covers an area ofsome 1,100 square kilometres and has never been explored before.It is located in a deepwater section of about 650-800 metres withreservoir depth of about 7,000 metres.
RussiaTNK-BPTNK-BP, an associate owned by BP (50%) and Alfa Group and Access-Renova (AAR) (50%), is an integrated oil company operating in Russia andthe Ukraine. BP’s investment in TNK-BP is reported in the Exploration andProduction segment. The TNK-BP group’s major assets are held in OAOTNK-BP Holding. Other assets include the BP-branded retail sites in theMoscow region and interests in OAO Rusia Petroleum and the OAOSlavneft group. The workforce comprises more than 52,000 people.• Downstream, TNK-BP has interests in six refineries in Russia and the
Ukraine (including Ryazan and Lisichansk and Slavneft’s Yaroslavlrefinery), with throughput of approximately 683 thousand barrels perday. TNK-BP supplies approximately 1,400 branded filling stations inRussia and the Ukraine and has more than 20% market share of theMoscow retail market.
• On 9 January 2009, BP reached final agreement on amendments tothe shareholder agreement with its Russian partners in TNK-BP. Therevised agreement is aimed at improving the balance of interestsbetween the company’s owners, and focusing the business moreexplicitly on value growth. The former evenly balanced main boardstructure has been replaced by one with four representatives eachfrom BP and AAR, plus three independent directors. Unanimousboard support is required for certain matters including substantialacquisitions, divestments and contracts, and projects outside thebusiness plan, together with approval of key changes to the TNK-BPgroup’s financial framework and related-party transactions. A numberof other matters will be decided by approval of a majority of theboard, so that the independent directors will have the ability todecide in the event of disagreement between the shareholderrepresentatives on the board. BP will continue to nominate the chiefexecutive officer (CEO), subject to main board approval, and AAR willcontinue to appoint the chairman. The three independent directorsappointed to the restructured main board are Gerhard Schroeder,former chancellor of the Federal Republic of Germany, James Leng,former chairman of Corus Steel and Alexander Shokhin, president ofthe Russian Union of Industrialists and Entrepreneurs. In addition,significant TNK-BP subsidiaries will have directors appointed by BPand AAR on their boards. Our investment was reclassified from ajointly controlled entity to an associate with effect from 9 January2009; however, the results of TNK-BP continue to be accounted forunder the equity method. On 6 August 2009, TNK-BP announced thatWilliam Schrader was appointed chief operating officer. Mr. Schradertook office during the fourth quarter of 2009, replacing Tim Summers.In November, the TNK-BP board of directors unanimously agreed to
appoint Maxim Barsky, TNK-BP executive vice president for strategyand business development, as the TNK-BP group’s future CEO,effective 1 January 2011. Until that time, Mikhail Fridman has agreedto continue to act as interim CEO, in addition to his role as executivechairman of the board of directors of TNK-BP Limited.
• On 16 February 2009, TNK-BP announced that the company hadlaunched commercial production from the Urna and Ust-Tegus fieldsin the Uvat area of the Tyumen region, Russia. Urna and Ust-Tegus arelocated in the eastern part of Uvat. TNK-BP completed construction ofa 264-kilometre pipeline and a central crude oil gathering facility,which facilitate transportation of oil from the fields westwards toenter the Transneft pipeline system. Investment in field developmentand construction of the infrastructure is expected to amount to over$1.5 billion.
• On 2 June 2009, TNK-BP announced that the company had launchedcommercial production in the Northern Hub of the Kamennoye field,one month earlier than planned. The Kamennoye field, in the Khanty-Mansiisk region of West Siberia, is one of the largest greenfieldprojects developed by TNK-BP. Aitor and Poima form the NorthernHub of the producing Kamennoye field. Thirty-five wells were drilledand completed in Aitor and, going forward, the primary focus is ondrilling 194 wells in Poima. Infrastructure construction includesupgrading of the gathering and treatment facilities, construction andupgrade of the pipeline and water flood systems as well as the powersupply system. This strategy and development plan is aimed atmaximizing the use of existing facilities and minimizing the impacton the ecologically sensitive territory. Between 2004 and 2009,investment in the Kamennoye project amounted to over $800 million.
• On 29 July 2009, TNK-BP and Weatherford International Ltd(Weatherford) announced that TNK-BP completed the sale of its OilField Services (OFS) enterprises to Weatherford pursuant to the salesand purchase agreement signed on 29 May 2009. Via this transaction,Weatherford acquired 10 OFS companies providing drilling, well work-over and cementing services operating in West Siberia, East Siberiaand the Volga-Urals region.
• In 2007, BP and TNK-BP signed heads of agreement to createstrategic business alliances with OAO Gazprom. Under the terms ofthis agreement, TNK-BP agreed to sell to Gazprom its stake in OAORusia Petroleum, the company that owns the licence for the Kovyktagas condensate field in East Siberia and its interest in East SiberiaGas Company. Discussions to conclude this disposal continue.
Sakhalin• BP has material interests in Sakhalin through two joint venture
companies, Elvary Neftegaz and Vostok Shmidt Neftegaz. BP has a49% equity interest in each joint venture, and its partner, Rosneft,holds the remaining 51% interest. During the year, both jointventures, via their Russian affiliates, held Geological and GeophysicalStudies licences with the Russian Ministry of Natural Resources(MNR) to perform exploration seismic and drilling operations in theselicence areas off the east coast of Russia. To date, 3D seismic datahas been acquired in relation to both licences. In the Elvary Neftegazlicence additional 2D and 3D seismic data was acquired during 2009in preparation for future drilling commitments.
BOL08439_p023 p34_Bus rev:20 F 5/3/10 17:31 Page 28 Bleed: 0�mm Scale: 100%

29
Business review
Bu
sin
ess r
evie
w
Bu
sin
ess re
vie
w
Kazakhstan• On 11 December 2009, BP announced that it has divested its interest
in Kazakhstan’s Tengiz oil field and the Caspian Pipeline Consortium(CPC) pipeline, carrying oil between Kazakhstan and Russia, by sellingits 46% stake in LukArco to Russia’s Lukoil. Lukoil, which alreadyowns 54% of LukArco, will pay $1.6 billion in cash in threeinstalments over two years from December 2009.
Middle East and PakistanProduction in the Middle East consists principally of the productionentitlement of associates in Abu Dhabi, where we have equity interestsof 9.5% and 14.67% in onshore and offshore concessions respectively.• In Sharjah, the joint agreement between BP, the Government of
Sharjah, Itochu and Tokyo Beki, for the operation and maintenance ofLPG facilities and the production and marketing of LPG products,expired on 22 March 2009 after a period of 25 years. BP relinquishedits 25% ownership, in accordance with the joint venture agreement,and negotiated terms that retain BP as the operator of the facilitiesthrough an operating fee structure.
• In Block 61 in Oman, the challenges posed by the world’s largestonshore wide-azimuth 3D seismic survey led the BP Oman team touse a ground-breaking new technique known as distance separatedsimultaneous sweeping (DS3). BP’s appraisal programme continuesto make good progress evaluating the resources in place in theKhazzan/Makarem gas fields. Five appraisal wells have been drilledin 2009. Fracture stimulation and testing of these wells continues.Infrastructure to facilitate long-term wells tests is under constructionand expected to be ready for service in the second half of 2010.
• On 3 January 2010, we received approval from the Government ofJordan to join the state-owned National Petroleum Company toexploit the onshore Risha concession in the north-east of the country.
• With effect from 1 January 2009 BP assumed operatorship of theMirpurkhas and Khipro onshore blocks in the southern Sindh provinceof Pakistan.
• In the third quarter of 2009, BP won bids for two new explorationblocks, Digri and Sanghar South, in Pakistan. These blocks areadjacent to BP’s Mirpurkhas and Khipro concession areas and addanother 5,000 square kilometres to the group’s existing portfolio of5,300 square kilometres. BP has committed to invest approximately$30 million in these blocks for seismic and wells over the next threeyears.
Iraq• In November 2009, BP and China National Petroleum Company
(CNPC) entered into a contract with the state-owned Southern OilCompany of Iraq to expand production from the Rumaila oilfield nearBasra in southern Iraq. This followed a successful bid for the contractin Baghdad in June 2009. The Rumaila field currently producesapproximately one million barrels of oil per day. BP and CNPC plan toinvest approximately $15 billion over the next 20 years to enhance theRumaila production to a plateau rate of 2.85mmb/d, around 3% ofglobal oil production. BP will hold a 38% working interest, CNPC willhold 37% and the remaining 25% will be held by the State OilMarketing Organisation (SOMO) representing the Iraqi government.
Australasia
AustraliaBP is one of seven partners in the North West Shelf (NWS) venture. Sixpartners (including BP) hold an equal 16.67% interest in the infrastructureand oil reserves and an equal 15.78% interest in the gas and condensatereserves, with a seventh partner owning the remaining 5.32% of gas andcondensate reserves. The NWS venture is currently the principal supplierto the domestic market in Western Australia and one of the largest LNGexport projects in Asia with five LNG trains in operation.
• The North Rankin 2 project linking a second platform to the existingNorth Rankin A platform sanctioned in 2008, is on schedule. Oncompletion, the North Rankin A and North Rankin B platforms willoperate as a single integrated facility and recover low pressure gasfrom the North Rankin and Perseus gas fields.
• The joint venture partners (Chevron, ExxonMobil and Shell) approvedthe Greater Gorgon project on 14 September 2009 with the AustralianGovernment also awarding production licences for the Jansz-Io field(BP 5.375%). The Jansz-Io field will be developed as part of theGreater Gorgon project, which will comprise three LNG trains, eachwith a capacity of 5 million tonnes per annum (mtpa), on BarrowIsland with first gas expected in 2014. As part of this, a unitizationand unit operating agreement has been executed with the jointventure partners and sales and purchase agreements for the wellheadsale of raw gas and repurchase of LNG ex-Barrow Island have beenexecuted between BP and Shell.
Midstream activities
Oil and natural gas transportationThe group has direct or indirect interests in certain crude oil and naturalgas transportation systems. The following narrative details the significantevents that occurred during 2009 by country.
BP’s onshore US crude oil and product pipelines and relatedtransportation assets are included under Refining and Marketing (seepage 32).
AlaskaBP owns a 46.9% interest in the Trans-Alaska Pipeline System (TAPS),with the balance owned by four other companies. BP also owns a 50%interest in a joint venture company called ‘Denali – The Alaska GasPipeline’ (Denali). Denali has begun work on an Alaska gas pipelineproject, consisting of a gas treatment plant on Alaska’s North Slope,a large diameter pipeline that is intended to pass through Alaska intoCanada, and should it be required, a large-diameter pipeline from Albertato the Lower 48 states. When completed, the pipeline is expected totransport approximately 4 billion cubic feet of natural gas per day tomarket. Following a successful open season, Denali will seek certificationfrom the Federal Energy Regulatory Commission (FERC) of the US andthe National Energy Board (NEB) of Canada to move forward with projectconstruction. Denali will manage the project, and will own and operatethe pipeline when completed. BP may consider other equity partners,including pipeline companies, who can add value to the project and helpmanage the risks involved.
Significant events were:• Work on the strategic reconfiguration project to upgrade and
automate four TAPS pump stations continued to progress in 2009.This project involves installing electrically driven pumps at four criticalpump stations, along with increased automation and upgradedcontrol systems. Two of the reconfigured pump stations came onlineduring 2007 and a third reconfigured pump station came online inMay 2009. Reconfiguration of the remaining pump station in theprogramme plan will commence in 2010, with installation currentlyplanned for 2012.
BOL08439_p023 p34_Bus rev:20 F 5/3/10 17:31 Page 29 Bleed: 0�mm Scale: 100%

30
Business review
• On 16 April 2009, the US FERC issued an initial ruling on shipperchallenges of TAPS interstate tariff rates for the years 2007 and 2008,ordering interim refunds to be paid to shippers based on the January2009 tariff rate filings. As a result of this order, BP, as a TAPS carrier,paid refunds of $7.3 million to third-party shippers covering the periodfrom 1 January 2007 to 30 June 2009, based on its January 2009tariff rate filing of $3.45/bbl. Shippers had also filed challenges of theTAPS carriers’ 2009 interstate tariff rates, based on the FERC rulingsissued related to 2005 through 2008 tariff rates. On 12 January 2010,an agreement to settle all remaining challenges to TAPS carrierinterstate tariff rate filings for the years 2008 and the first half of 2009was signed by all the TAPS carriers and shippers. Under the terms ofthe settlement, BP will pay additional refunds to third-party shippersfor the period from January 2007 through June 2009 of $0.12/bbl,representing the difference between the $3.45/bbl tariff rate onwhich the interim refunds for this period were based, and the$3.33/bbl tariff rate in the settlement agreement. The signedsettlement agreement has been submitted to the FERC for finalregulatory approval. In 2009, interstate transport representedapproximately 90% of total TAPS throughput.
North SeaIn the UK sector of the North Sea, BP operates the Forties PipelineSystem (FPS) (BP 100%), an integrated oil and NGLs transportation andprocessing system that handles production from more than 50 fields inthe Central North Sea. The system has a capacity of more than onemillion barrels per day, with average throughput in 2009 of 671mb/d. BPalso operates and has a 29.5% interest in the Central Area TransmissionSystem (CATS), a 400-kilometre natural gas pipeline system in the centralUK sector of the North Sea. The pipeline has a transportation capacity of1,700mmcf/d to a natural gas terminal at Teesside in north-east England.CATS offers natural gas transportation and processing services. Inaddition, BP operates the Dimlington/Easington gas processingterminal (BP 100%) on Humberside and the Sullom Voe oil and gasterminal in Shetland.
AsiaBP, as operator, manages and holds a 30.1% interest in theBaku-Tbilisi-Ceyhan (BTC) oil pipeline. The 1,768-kilometre pipelinetransports oil from the BP-operated ACG oil field in the Caspian Sea tothe eastern Mediterranean port of Ceyhan. BP is technical operator of,and holds a 25.5% interest in, the 693-kilometre South Caucasus Pipeline(SCP), which takes gas from Azerbaijan through Georgia to the Turkishborder. In addition, BP operates the Azerbaijan section of the WesternExport Route Pipeline between Azerbaijan and the Black Sea coast ofGeorgia (as operator of Azerbaijan International Operating Company).
Significant events were:• On 23 April 2009, BP completed the sale of its 49.9% interest in
Kazakhstan Pipeline Ventures (KPV) to Kazakhstan state oil and gascompany KazMunayGas (KMG) for $250 million. KPV holds a 1.75%interest in the Caspian Pipeline Consortium (CPC) that carries crudeoil from Kazakhstan’s largest producing oil field, Tengiz, to the Russianport of Novorossiysk on the Black Sea.
• On 11 December 2009, BP also divested its interest in the CPCpipeline (held through LukArco) by selling its 46% stake in LukArco toLukoil.
Liquefied natural gasOur LNG activities are focused on building competitively advantagedliquefaction projects, establishing diversified market positions to createmaximum value for our upstream natural gas resources and capturingthird-party LNG supply to complement our equity flows.
Assets and significant events included:• In Trinidad, BP’s net share of the capacity of Atlantic LNG Trains 1, 2, 3
and 4 is 6 million tonnes of LNG per year (369 billion cubic feetequivalent regasified), with the Atlantic LNG Train 4 (BP 37.8%)designed to produce 5.2mtpa (294 billion cubic feet per annum) ofLNG. All of the LNG from Atlantic Train 1 and most of the LNG fromTrains 2 and 3 is sold to third parties in the US and Spain under long-term contracts. All of BP’s LNG entitlement from Atlantic LNG Train 4and some of its LNG entitlement from Trains 2 and 3 is marketed viaBP’s LNG marketing and trading business to a variety of marketsincluding the US, the Dominican Republic, Spain, the UK and theFar East.
• We have a 10% equity shareholding in the Abu Dhabi GasLiquefaction Company, which in 2009 supplied 5.4 million tonnes(279,000mmcf) of LNG.
• BP has a 13.6% share in the Angola LNG project, which is expectedto receive approximately one billion cubic feet of associated gas perday from offshore producing blocks and to produce 5.2 million tonnesper year of LNG (gross), as well as related gas liquids products.Construction and implementation of the project is proceeding andis expected to start up in 2012.
• In Indonesia, BP is involved in two of the three LNG centres in thecountry. BP participates in Indonesia’s LNG exports through itsholdings in the Sanga-Sanga PSA (BP 38%). Sanga-Sanga currentlydelivers around 13% of the total gas feed to Bontang, one of theworld’s largest LNG plants. The Bontang plant produced more than17 million tonnes of LNG in 2009.
• Also in Indonesia, the Tangguh project (BP 37.16% and operator) inPapua Barat, Indonesia, started LNG production in June 2009,delivering its first commercial LNG delivery in July. Tangguh is BP’sfirst operated LNG plant. The first phase of Tangguh comprises twooffshore platforms, two pipelines and an LNG plant with twoproduction trains with a total capacity of 7.6mtpa. Tangguh adopteda fully integrated approach to development and its impact on localcommunities. The Tangguh project has five long-term contracts inplace to supply LNG to purchasers in China, South Korea, Mexicoand Japan.
• In Australia, we are one of seven partners in the North West Shelf(NWS) venture. The joint venture operation covers offshoreproduction platforms, trunklines, onshore gas and LNG processingplants and LNG carriers. BP’s net share of the capacity of NWS LNGTrains 1-5 is 2.7mtpa of LNG.
• BP has a 30% equity stake in the 7mtpa capacity Guangdong LNGregasification and pipeline project in south-east China, making it theonly foreign partner in China’s LNG import business. The terminal isalso supplied under a long-term contract with Australia’s NWS project.
• In both the Atlantic and Asian regions, BP is marketing LNG using BPLNG shipping and contractual rights to access import terminalcapacity in the liquid markets of the US (via Cove Point and ElbaIsland), the UK (via the Isle of Grain) and Italy (Rovigo), and issupplying Asian customers in Japan, South Korea and Taiwan.
BOL08439_p023 p34_Bus rev:20 F 5/3/10 17:31 Page 30 Bleed: 0�mm Scale: 100%

31
Business review
Bu
sin
ess r
evie
w
Bu
sin
ess re
vie
w
Gas marketing and trading activities
Gas and power marketing and trading activity is undertaken primarily inthe US, Canada and Europe to market both BP production and third-partynatural gas, support LNG activities and manage market price risk as wellas to create incremental trading opportunities through the use ofcommodity derivative contracts. Additionally, this activity generates feeincome and enhanced margins from sources such as the management ofprice risk on behalf of third-party customers. These markets are large,liquid and volatile.
In connection with the above activities, the group uses a range ofcommodity derivative contracts and storage and transport contracts.These include commodity derivatives such as futures, swaps and optionsto manage price risk and forward contracts used to buy and sell gas andpower in the marketplace. Using these contracts, in combination withrights to access storage and transportation capacity, allows the group toaccess advantageous pricing differences between locations, time periodsand arbitrage between markets. Natural gas futures and options aretraded through exchanges, while over-the-counter (OTC) options andswaps are used for both gas and power transactions through bilateraland/or centrally cleared arrangements. Futures and options are primarilyused to trade the key index prices such as Henry Hub, while swaps canbe tailored to price with reference to specific delivery locations wheregas and power can be bought and sold. OTC forward contracts haveevolved in both the US and UK markets, enabling gas and power to besold forward in a variety of locations and future periods. These contractsare used both to sell production into the wholesale markets and astrading instruments to buy and sell gas and power in future periods.Storage and transportation contracts allow the group to store andtransport gas, and transmit power between these locations. The grouphas developed a risk governance framework to manage and oversee thefinancial risks associated with this trading activity, which is described inNote 24 to the Financial statements on pages 142-147.
The range of contracts that the group enters into is describedbelow in more detail.
Exchange-traded commodity derivativesExchange-traded commodity derivatives include gas and power futurescontracts. Though potentially settled physically, these contracts aretypically settled financially. Gains and losses, otherwise referred to asvariation margins, are settled on a daily basis with the relevant exchange.Realized and unrealized gains and losses on exchange-traded commodityderivatives are included in sales and other operating revenues foraccounting purposes.
OTC contractsThese contracts are typically in the form of forwards, swaps and options.Some of these contracts are traded bilaterally between counterparties;others may be cleared by a central clearing counterparty. These contractscan be used for both trading and risk management activities. Realizedand unrealized gains and losses on OTC contracts are included in salesand other operating revenues for accounting purposes. Highly developedmarkets exist in North America and the UK where gas and power can bebought and sold for delivery in future periods. These contracts arenegotiated between two parties to purchase and sell gas and power at aspecified price, with delivery and settlement at a future date. Typically,these contracts specify delivery terms for the underlying commodity.Certain of these transactions are not settled physically. This can beachieved by transacting offsetting sale or purchase contracts for thesame location and delivery period that are offset during the schedulingof delivery or dispatch. The contracts contain standard terms such asdelivery point, pricing mechanism, settlement terms and specification ofthe commodity. Typically, volume and price are the main variable terms.Swaps can be contractual obligations to exchange cash flows betweentwo parties. One usually references a floating price and the other a fixedprice, with the net difference of the cash flows being settled. Optionsgive the holder the right, but not the obligation, to buy or sell natural gasproducts or power at a specified price on or before a specific future date.Amounts under these derivative financial instruments are settled atexpiry, typically through netting agreements to limit credit exposure andsupport liquidity.
Spot and term contractsSpot contracts are contracts to purchase or sell a commodity at themarket price, typically an index price prevailing on the delivery date whentitle to the inventory passes. Term contracts are contracts to purchase orsell a commodity at regular intervals over an agreed term. Though spotand term contracts may have a standard form, there is no offsettingmechanism in place. These transactions result in physical delivery withoperational and price risk. Spot and term contracts relate typically topurchases of third-party gas and sales of the group’s gas production tothird parties. For accounting purposes, spot and term sales are includedin sales and other operating revenues, when title passes. Similarly, spotand term purchases are included in purchases for accounting purposes.
BOL08439_p023 p34_Bus rev:20 F 5/3/10 17:31 Page 31 Bleed: 0�mm Scale: 100%

32
Business review
Refining and MarketingOur Refining and Marketing business is responsible for the supply andtrading, refining, manufacturing, marketing and transportation of crudeoil, petroleum, petrochemicals products and related services towholesale and retail customers. BP markets its products in more than80 countries. We have significant operations in Europe and NorthAmerica and also manufacture and market our products acrossAustralasia, in China and other parts of Asia, Africa and Central andSouth America.
Our organization is managed through two main businessgroupings: fuels value chains (FVCs) and international businesses (IBs).The FVCs integrate the activities of refining, logistics, marketing, supplyand trading, on a regional basis, recognizing the geographic nature of themarkets in which we compete. This provides the opportunity to optimizeour activities from crude oil purchases to end-consumer sales through ourphysical assets (refineries, terminals, pipelines and retail stations). TheIBs include the manufacturing, supply and marketing of lubricants,petrochemicals, aviation fuels and liquefied petroleum gas (LPG).
Our market
The 2009 operating environment was again challenging. Global oildemand contracted by approximately 1.3 million barrels per day withdemand in the OECD falling for the fourth consecutive year. Crude oilprices more than doubled during the course of the year, from a datedBrent price of $36.55 per barrel on 1 January 2009 to $77.67 per barrel atthe end of 2009, contributing to margin volatility.
Refining margins fell sharply in 2009 as demand for oil productsreduced in the wake of the global economic recession and new refiningcapacity came onstream, mostly in Asia. During 2009, distillateinventories were consistently above the top of the range of the past fiveyears. Gasoline inventories grew steadily and were generally at or slightlyabove the average level of the past five years. As a result, the BP globalindicator refining margin (GIM) averaged $4 per barrel in 2009, down$2.50 per barrel compared with 2008, with the average for the fourth-quarter of 2009 at only $1.49 per barrel, the lowest for almost 15 years.This margin decline had a significant adverse impact on the financialperformance of the segment.
In Europe, where diesel accounts for a large proportion of regionaldemand, refining margins were hit by reduced demand from commercialtransport because of the economic recession. In the US, where refining ismore highly upgraded and the transport market is more gasoline oriented,margins deteriorated less. Refining margins in Asia Pacific were thehardest hit due to substantial additions to refining capacity in the region.
During 2009, upgrading margins were particularly poor due tostronger relative fuel oil prices and narrow light-heavy crude spreads. Thisadversely impacted our highly upgraded refineries and had an adverseimpact on our financial performance in 2009 compared with 2008.
The end of 2008 and the first quarter of 2009 saw unprecedentedlevels of market volatility, driven by turmoil in the financial sector anddisruptions in the supply chain resulting from the economic downturn.This high level of volatility, combined with our proprietary asset base andtrading skills, enabled us to deliver a particularly strong supply and tradingresult in the first quarter of 2009. Subsequent to the first quarter,volatility returned to more normal levels.
In our IBs, we saw a decline in demand for lubricants due to thefinancial crisis. During the year we saw a partial recovery in the demandfor our petrochemicals products.
Our strategy
Our purpose is to be the product- and service-led arm of BP, focused onfuels, lubricants, petrochemicals products and related services. We aimto be excellent in the markets we choose to be in – those that allow BPto serve the major energy markets of the world. We are in pursuit ofcompetitive returns and enduring growth, as we serve customers andpromote BP and our brands through quality products.
We believe that key to our continued success in Refining andMarketing is holding a portfolio of quality, integrated, efficient positionsand accessing available market growth in emerging markets. We intendto do this through holding positions in advantaged integrated FVCs wherewe will invest to strengthen our established positions. We also intend toretain and grow our IBs.
In 2007, we identified that the segment’s financial performancelagged that of our competitors, based on our analysis of our positioncompared with our supermajor peers, and we launched a programme torestore our financial performance. Our objective was to restore ourperformance over a period of three to four years by focusing on achievingsafe, reliable and compliant operations, restoring missing revenues anddelivering sustainable competitive returns and cash flows.
We believe our overall performance has now returned to beingcompetitive with our supermajor peers, but that there is significantpotential for further performance improvements. In the future, we intendto build on this by focusing on further improvements in operations, assetquality and overall efficiency, in order to be a leading player in each of themarkets in which we choose to participate.
Our performance
Our 2009 performance has benefited from the fundamentalimprovements we have been making across the business, including themeasures we have taken to restore the availability of our refining system,reduce costs and simplify the organization. The replacement cost profitbefore interest and tax was $0.7 billion for 2009, compared with$4.2 billion in 2008. The result was heavily impacted by non-operatingitems, which included a significant level of restructuring charges and a$1.6 billion one-off charge to write off all the segment’s goodwill in theUS West Coast FVC relating to our 2000 ARCO acquisition. This resultedfrom our annual review of goodwill as required under IFRS and reflectsthe prevailing weak refining environment that, together with a review offuture margin expectations in the FVC, has led to a reduction in theexpected future cash flows. The decrease in profit was also driven by thevery significantly weaker environment, where refining margins fell byalmost 40%. This was partly offset by significantly stronger operationalperformance in the fuels value chains, with 93.6% Solomon refiningavailability, lower costs and improved performance in the internationalbusinesses. Our financial results are discussed in more detail onpages 52-53.
Safety, both process and personal, remains our top priority. During2009, we continued the migration to the BP operating managementsystem (OMS) with a continuing focus on process safety. The OMS isdescribed in further detail in Safety (see page 42). At the end of 2009, allour operated refineries and petrochemicals plants were using the OMS.Within our US refineries, we continued to implement therecommendations of the BP US Refineries Independent Safety ReviewPanel and regulatory bodies (further information can be found in Safetyon page 42 and in Legal proceedings on page 95). The focus onoperational integrity continues to yield positive results across thesegment. Since 2005, when we started identifying incidents by type, wehave reduced the overall number of major incidents by 90%. None of themajor incidents reported in 2009 was integrity-management related. Wehave also reduced the number of reported oil spills and the recordableinjury frequency in our workforce to the lowest level for 10 years. In2009, there were no reported workforce fatalities associated with ourrefining and marketing operations.
BOL08439_p023 p34_Bus rev:20 F 5/3/10 17:31 Page 32 Bleed: 0�mm Scale: 100%
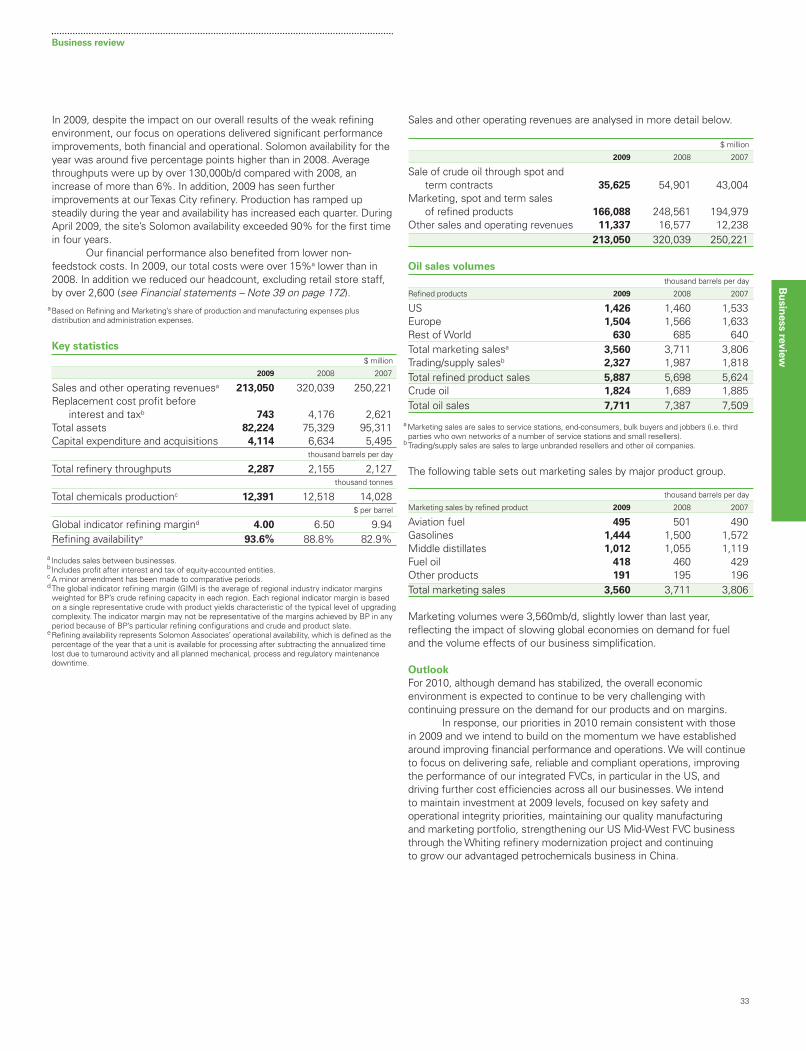
33
Business review
Bu
sin
ess r
evie
w
Bu
sin
ess re
vie
w
BOL08439_p023 p34_Bus rev:20 F 5/3/10 17:31 Page 33 Bleed: 0�mm Scale: 100%
In 2009, despite the impact on our overall results of the weak refiningenvironment, our focus on operations delivered significant performanceimprovements, both financial and operational. Solomon availability for theyear was around five percentage points higher than in 2008. Averagethroughputs were up by over 130,000b/d compared with 2008, anincrease of more than 6%. In addition, 2009 has seen furtherimprovements at our Texas City refinery. Production has ramped upsteadily during the year and availability has increased each quarter. DuringApril 2009, the site’s Solomon availability exceeded 90% for the first timein four years.
Our financial performance also benefited from lower non-feedstock costs. In 2009, our total costs were over 15%a lower than in2008. In addition we reduced our headcount, excluding retail store staff,by over 2,600 (see Financial statements – Note 39 on page 172).
aBased on Refining and Marketing’s share of production and manufacturing expenses plusdistribution and administration expenses.
Key statistics
$ million
2009 2008 2007
Sales and other operating revenuesa 213,050 320,039 250,221Replacement cost profit before
interest and taxb 743 4,176 2,621Total assets 82,224 75,329 95,311Capital expenditure and acquisitions 4,114 6,634 5,495
thousand barrels per day
Total refinery throughputs 2,287 2,155 2,127thousand tonnes
Total chemicals productionc 12,391 12,518 14,028$ per barrel
Global indicator refining margind 4.00 6.50 9.94Refining availabilitye 93.6% 88.8% 82.9%
aIncludes sales between businesses.b Includes profit after interest and tax of equity-accounted entities.c A minor amendment has been made to comparative periods.d The global indicator refining margin (GIM) is the average of regional industry indicator margins
weighted for BP’s crude refining capacity in each region. Each regional indicator margin is basedon a single representative crude with product yields characteristic of the typical level of upgradingcomplexity. The indicator margin may not be representative of the margins achieved by BP in anyperiod because of BP’s particular refining configurations and crude and product slate.
eRefining availability represents Solomon Associates’ operational availability, which is defined as thepercentage of the year that a unit is available for processing after subtracting the annualized timelost due to turnaround activity and all planned mechanical, process and regulatory maintenancedowntime.
Sales and other operating revenues are analysed in more detail below.
$ million
2009 2008 2007
Sale of crude oil through spot and term contracts 35,625 54,901 43,004
Marketing, spot and term sales of refined products 166,088 248,561 194,979
Other sales and operating revenues 11,337 16,577 12,238213,050 320,039 250,221
Oil sales volumes
thousand barrels per day
Refined products 2009 2008 2007
US 1,426 1,460 1,533Europe 1,504 1,566 1,633Rest of World 630 685 640Total marketing salesa 3,560 3,711 3,806Trading/supply salesb 2,327 1,987 1,818Total refined product sales 5,887 5,698 5,624Crude oil 1,824 1,689 1,885Total oil sales 7,711 7,387 7,509
aMarketing sales are sales to service stations, end-consumers, bulk buyers and jobbers (i.e. thirdparties who own networks of a number of service stations and small resellers).
bTrading/supply sales are sales to large unbranded resellers and other oil companies.
The following table sets out marketing sales by major product group.
thousand barrels per day
Marketing sales by refined product 2009 2008 2007
Aviation fuel 495 501 490Gasolines 1,444 1,500 1,572Middle distillates 1,012 1,055 1,119Fuel oil 418 460 429Other products 191 195 196Total marketing sales 3,560 3,711 3,806
Marketing volumes were 3,560mb/d, slightly lower than last year,reflecting the impact of slowing global economies on demand for fueland the volume effects of our business simplification.
Outlook
For 2010, although demand has stabilized, the overall economicenvironment is expected to continue to be very challenging withcontinuing pressure on the demand for our products and on margins.
In response, our priorities in 2010 remain consistent with thosein 2009 and we intend to build on the momentum we have establishedaround improving financial performance and operations. We will continueto focus on delivering safe, reliable and compliant operations, improvingthe performance of our integrated FVCs, in particular in the US, anddriving further cost efficiencies across all our businesses. We intendto maintain investment at 2009 levels, focused on key safety andoperational integrity priorities, maintaining our quality manufacturingand marketing portfolio, strengthening our US Mid-West FVC businessthrough the Whiting refinery modernization project and continuingto grow our advantaged petrochemicals business in China.

Fuels value chainsWe have six regionally organized integrated FVCs, covering the WestCoast and Mid-West regions of the US, the Rhine region, SouthernAfrica, Australasia (ANZ) and Iberia. Each of these is a material business,optimizing activities across the supply chain – from crude delivery to therefineries; manufacture of high-quality fuels to meet market demand;pipeline and terminal infrastructure and marketing and sales to ourcustomers. The Texas City refinery is not part of an integrated FVC but isoperated as a standalone, predominantly merchant, refining business thatalso supports our marketing operations on the east and Gulf coasts ofthe US.
We also have a number of regionally focused fuels marketingbusinesses that are not integrated into a refinery, covering the UK, Franceand Turkey.
In 2009, the FVCs accounted for roughly three-quarters of theoperating capital employeda in Refining and Marketing and generated justunder half of the profit, after adjusting for non-operating items and fairvalue accounting effects. Without these adjustments, the result for theFVCs was a significant loss in 2009, with the most significant factor beingthe impairment charge to write off all the segment’s goodwill in theWest Coast fuels value chain.
Significant events in the FVCs in 2009 were as follows:• In February 2009, a new 20,000b/d coker was commissioned at our
Castellón refinery in Spain. This was the culmination of a four-yearproject to convert the Castellón refinery to one capable of upgradingall fuel oil to higher value products. This will allow the refinery toproduce about 50% more diesel than it did before, for sale to thelocal Spanish market and will also improve the ability of the refineryto process higher-margin heavy crude oils.
• The Whiting refinery modernization project is more than one year intoconstruction. The engineering design is now almost complete andmany of the large foundations are in place. For further details onpermit issues relating to our planned upgrades see Environmenton page 45.
• In July 2009, BP announced that it would not be progressing with theproject with Irving Oil to build a refinery at Eider Rock in Saint John,New Brunswick, Canada as a result of global economic and industryconditions.
• In December 2009, BP completed the sale of our ground fuelsmarketing business in Greece, to Hellenic Petroleum for $0.5 billion.The sale included a BP brand licence agreement for at leastthree years.
• In November 2007, BP announced that it would sell all of itscompany-owned and company-operated convenience sites in the US.The sites will be supplied with BP or ARCO branded fuels under a20-year contract and will continue to market BP-branded fuels in theeastern US and ARCO-branded fuels in the western US. By the endof 2009, we were no longer operating any of these sites and hadcompleted the sale of all but around 30.
• In the fourth quarter of 2009, we announced that we would exploreoptions to divest a number of non-strategic pipelines and terminals inthe US Mid-West, Gulf Coast and West Coast during 2010 and 2011.
• In February 2010, we announced that we had received an offer fromDelek Europe B.V. for the retail fuels and convenience business andselected fuels terminals in France. As a result, BP has agreed a periodof exclusivity with Delek Europe B.V. to negotiate the terms for thesale and to allow consultation with the relevant works councils. Anytransaction will be subject to regulatory approval. Any transaction isexpected to include a BP brand licence agreement.
aOperating capital employed is total assets (excluding goodwill) less total liabilities, excluding financedebt and current and deferred taxation.
Refineries
BP’s global refining strategy is to own and operate strategicallyadvantaged refineries that benefit from vertical integration with ourmarketing and trading operations, as well as synergies with other parts ofthe group’s business. Our refining focus is to maintain and improve ourcompetitive position through sustainable, safe, reliable, compliant andefficient operations of the refining system and disciplined investment forintegrity management, to achieve competitively advantaged configurationand growth.
For BP, the strategic advantage of a refinery relates to its location,scale and configuration to produce fuels from lower-cost feedstocks inline with the demand of the region. Strategic investments in ourrefineries are focused on securing the safety and reliability of our assetswhile improving our competitive position. In addition, we continue toinvest to develop the capability to produce the cleaner fuels that meetthe requirements of our customers and their communities.
Business review
34
BOL08439_p023 p34_Bus rev:20 F 5/3/10 17:31 Page 34 Bleed: 0�mm Scale: 100%

Business review
Bu
sin
ess r
evie
w
Bu
sin
ess re
vie
w
BOL08439_p035 pp45_Bus rev:20 F 5/3/10 17:31 Page 35 Bleed: 0�mm Scale: 100%
35
The following table summarizes the BP group’s interests in refineries and average daily crude distillation capacities at 31 December 2009. In July2009, BP disposed of its 17.1% interest in Kenya Petroleum Refineries Ltd to Essar Energy Overseas Ltd.
thousand barrels per day
Crude distillation capacitiesa
Group interestb BPRefinery Fuels value chain % Total share
Europe
Germany Bayernoil Rhine 22.5% 215 48Gelsenkirchenc Rhine 50.0% 266 133Karlsruhe Rhine 12.0% 323 39Lingenc Rhine 100.0% 93 93Schwedt Rhine 18.8% 226 42
Netherlands Rotterdamc Rhine 100.0% 386 386Spain Castellónc Iberia 100.0% 110 110Total Europe 1,619 851US
California Carsonc US West Coast 100.0% 265 265Washington Cherry Pointc US West Coast 100.0% 234 234Indiana Whitingc US Mid-West 100.0% 405 405Ohio Toledoc US Mid-West 50.0% 160 80Texas Texas Cityc – 100.0% 475 475Total US 1,539 1,459Rest of World
Australia Bulwerc ANZ 100.0% 102 102Kwinanac ANZ 100.0% 137 137
New Zealand Whangerei ANZ 23.7% 112 27South Africa Durban Southern Africa 50.0% 180 90Total Rest of World 531 356Total 3,689 2,666
aCrude distillation capacity is gross rated capacity, which is defined as the highest average sustained unit rate for a consecutive 30-day period.bBP share of equity, which is not necessarily the same as BP share of processing entitlements.c Indicates refineries operated by BP.
The following table outlines by region the volume of crude oil and feedstock processed by BP for its own account and for third parties. CorrespondingBP refinery capacity utilization data is summarized.
thousand barrels per day
Refinery throughputsa 2009 2008 2007
US 1,238 1,121 1,064Europe 755 739 758Rest of World 294 295 305Total 2,287 2,155 2,127Refinery capacity utilizationCrude distillation capacity at 31 Decemberb 2,666 2,678 2,769Refinery utilizationc 86% 81% 77%
US 85% 77% 69%Europe 89% 87% 88%Rest of World 83% 80% 83%
aRefinery throughputs reflect crude oil and other feedstock volumes.bCrude distillation capacity is gross rated capacity, which is defined as the highest average sustained unit rate for a consecutive 30-day period.cRefinery utilization is annual throughput divided by crude distillation capacity, expressed as a percentage. The measure has been redefined in 2009 to be more consistent with industry standards.Prior periods have been restated.

36
Business review
Refining throughputs in 2009 increased by 6% relative to 2008, drivenprincipally by improved operational performance in the US. Higher USthroughputs were largely attributable to the recovery at the Texas Cityrefinery, partially offset by the reduced equity interest in the Toledorefinery stemming from the Husky joint venture.
Supply and trading
The group has a long-established integrated supply and trading functionresponsible for delivering value across the overall crude and oil productssupply chain. This structure enables the optimization of BP’s FVCs tomaintain a single interface with the oil trading markets and to operatewith a single set of trading compliance processes, systems and controls.The business is organized along global commodity lines and with tradingoffices in Europe, the US and Asia, the function is able to maintain apresence in the regionally connected global markets. The supply andtrading function has supported the Refining and Marketing segmentthrough a period of higher volatility of crude and oil product prices andincreased credit risk following the global financial crisis.
The function seeks to identify the best markets and prices for ourcrude oil, source optimal feedstocks for our refineries and providecompetitive supply for our marketing businesses. In addition, whererefinery production is surplus to marketing requirements or can besourced more competitively, it is sold into the market. Wherever possible,the group will look to optimize value across the supply chain. Forexample, BP will often sell its own crude production into the marketand purchase alternative crude for its refineries where this will provideincremental margin.
Along with the supply activity described above, the function seeksto create incremental trading opportunities. It enters into the full range ofexchange-traded commodity derivatives, over-the-counter (OTC) contractsand spot and term contracts that are described in detail below. In order tofacilitate the generation of trading margin from arbitrage, blending andstorage opportunities, it also both owns and contracts for storage andtransport capacity. The group has developed a risk governance frameworkto manage and oversee the financial risks associated with this tradingactivity, which is described in the Financial statements – Note 24 onpages 142-147.
The range of transactions that the group enters into is describedbelow.
Exchange-traded commodity derivativesThese contracts are typically in the form of futures and options traded ona recognized exchange, such as Nymex, SGX, ICE and Chicago Board ofTrade. Such contracts are traded in standard specifications for the mainmarker crude oils, such as Brent and West Texas Intermediate and themain product grades, such as gasoline and gasoil. Gains and losses,otherwise referred to as variation margins, are settled on a daily basiswith the relevant exchange. These contracts are used for the trading andrisk management of both crude oil and refined products. Realized andunrealized gains and losses on exchange-traded commodity derivativesare included in sales and other operating revenues for accountingpurposes.
OTC contractsThese contracts are typically in the form of forwards, swaps and options.Some of these contracts are traded bilaterally between counterparties;others may be cleared by a central clearing counterparty. These contractscan be used both as part of trading and risk management activities.Realized and unrealized gains and losses on OTC contracts are includedin sales and other operating revenues for accounting purposes.
BOL08439_p035 pp45_Bus rev:20 F 5/3/10 17:31 Page 36 Bleed: 0�mm Scale: 100%
The main grades of crude oil bought and sold forward using standardcontracts are West Texas Intermediate and a standard North Sea crudeblend (Brent, Forties and Osberg or BFO). Although the contracts specifyphysical delivery terms for each crude blend, a significant volume are notsettled physically. The contracts typically contain standard delivery, pricingand settlement terms. Additionally, the BFO contract specifies a standardvolume and tolerance given that the physically settled transactions aredelivered by cargo. Swaps are often contractual obligations to exchangecash flows between two parties: a typical swap transaction usuallyreferences a floating price and a fixed price with the net difference of thecash flows being settled. Options give the holder the right, but not theobligation, to buy or sell crude or oil products at a specified price on orbefore a specific future date. Amounts under these derivative financialinstruments are settled at expiry, typically through netting agreements,to limit credit exposure and support liquidity.
Spot and term contractsSpot contracts are contracts to purchase or sell crude and oil products atthe market price prevailing on or around the delivery date when title tothe inventory is taken. Term contracts are contracts to purchase or sell acommodity at regular intervals over an agreed term. Though spot andterm contracts may have a standard form, there is no offsettingmechanism in place. These transactions result in physical delivery withoperational and price risk. Spot and term contracts relate typically topurchases of crude for a refinery, purchases of products for marketing,sales of the group’s oil production and sales of the group’s oil products.For accounting purposes, spot and term sales are included in sales andother operating revenues, when title passes. Similarly, spot and termpurchases are included in purchases for accounting purposes.
Fuels marketing and logistics
Our fuels strategy focuses on optimizing the integrated value of each FVCthat is responsible for the delivery of ground fuels to the market. We dothis by co-ordinating our marketing, refining and trading activities tomaximize synergies across the whole value chain. Our priorities are tooperate an advantaged infrastructure and logistics network (whichincludes pipelines, storage terminals and road or rail tankers), driveexcellence in operating and transactional processes and delivercompelling customer offers in the various markets where we operate.The fuels business markets a comprehensive range of refined oilproducts primarily focused on the ground fuels sector.
The ground fuels business supplies fuel and related convenienceservices to retail consumers through company-owned and franchisedretail sites as well as other channels including wholesalers and jobbers.It also supplies commercial customers within the transport and industrialsectors.
Our retail network is largely concentrated in Europe and the USbut also has established operations in Australasia, southern and easternAfrica. We are developing networks in China in two separate jointventures, one with Petrochina and the other with China Petroleum andChemical Corporation (Sinopec).
Number of retail sites operated under a BP brand
Retail sitesa b 2009 2008 2007
US 11,500 11,700 12,200Europe 8,600 8,600 8,600Rest of World 2,300 2,300 2,500Total 22,400 22,600 23,300
aThe number of retail sites includes sites not operated by BP but instead operated by dealers,jobbers, franchisees or brand licensees that operate under a BP brand. These may move to or fromthe BP brand as their fuel supply or brand licence agreements expire and are renegotiated in thenormal course of business.
bExcludes our interest in equity-accounted entities which are dual-branded.

37
Business review
Bu
sin
ess r
evie
w
Bu
sin
ess re
vie
w
At 31 December 2009, BP’s worldwide network consisted of some22,400 sites branded BP, Amoco, ARCO and Aral, around the same as inthe previous year. We continue to improve the efficiency of our retailnetwork and increase the consistency of our site offer through a processof regular review. In 2009, we sold over 600 company-owned sites todealers, jobbers and franchisees who continue to operate these sitesunder the BP brand. In addition we sold around 1,200 sites in Greeceto Hellenic Petroleum, which will continue to be operated under the BPbrand through a brand licensing agreement. We also divested around100 company-owned sites to third parties.
Our retail convenience operations offer consumers a range offood, drink and other consumables and services on the fuel forecourt in aconvenient and innovative manner. The convenience offer includes brandssuch as ampm, Wild Bean Café and Petit Bistro.
During 2009, we continued the implementation of our ampmconvenience retail franchise model in the US. We expect this model toprovide a reliable, long-term sales outlet for transport fuels from ourrefinery systems, together with reduced costs and lower levels of capitalinvestment. Overall in the US, by the end of 2009 there were 11,500branded retail sites of which 1,200 were branded ampm, compared with11,700 and 1,100 respectively at the beginning of 2009.
In Europe, we are one of the largest forecourt convenienceretailers, with about 2,500 convenience retail sites in 10 countries.We are growing our food-on-the-go and fresh grocery services throughBP-owned brands and partnerships with leading retailers such as Marks& Spencer. In addition, at the end of 2009, we had approximately 500sites outside Europe and the US in countries such as Australia, NewZealand and South Africa.
International businessesOur IBs provide quality products and offers to customers in more than 80countries worldwide with a significant focus on Europe, North Americaand Asia. Our products include aviation fuels, lubricants that meet theneeds of various industries and consumers, LPG, and a range ofpetrochemicals that are sold for use in the manufacture of other productssuch as fabrics, fibres and various plastics. We believe each of these IBsis competitively advantaged in the markets in which we have chosen toparticipate. Such advantage is derived from several factors, includinglocation, proximity of manufacturing assets to markets, physical assetquality, operational efficiency, technology advantage and the strength ofour brands. Each business has a clear strategy focused on investing in itskey assets and market positions in order to deliver value to its customersand outperform its competitors.
In 2009, the IBs accounted for just under a quarter of thesegment’s operating capital employeda and just over half the profit, afteradjusting for non-operating items and fair value accounting effects.Without these adjustments, the profit for the IBs more than offset theloss for the FVCs.
Significant events in the international businesses in 2009 were:• Our expanded purified terephthalic acid (PTA) facility in Geel, Belgium
was successfully commissioned in the first quarter of 2009. Theexpansion, which has a design capacity of 350 thousand tonnes perannum (ktepa), has improved operating costs and by the end of 2009had already increased the site’s PTA capacity by 255ktepa.
• SECCO completed its first major turnaround in the third quarter of2009 and at the same time expanded production capacity, creatingChina’s largest ethylene cracker capable of producing 1.3mtpa ofethylene per year, an increase of 25%.
a Operating capital employed is total assets (excluding goodwill) less total liabilities, excludingfinance debt and current and deferred taxation.
• Construction of the new 500ktepa acetic acid plant in Jiangsuprovince, China by BP YPC Acetyls Company (Nanjing) Limited(BYACO) was completed. This is a BP joint venture with YangziPetrochemical Co. Ltd (a subsidiary of Sinopec). Commercialproduction is expected to begin in the second quarter of 2010.
• BP and Sinopec continued to progress the project to add a new aceticacid plant at their Yangtze River Acetyls Co. (YARACO) joint venturesite in Chongqing, China. This world-scale (650ktepa) acetic acid plantwill use BP’s leading Cativa™ technology. The expected plant start-update is under review due to current market conditions. Whencomplete, total production at the YARACO site is expected to be inexcess of one million tonnes per annum, making this one of thelargest acetic acid production locations in the world.
Lubricants
We manufacture and market lubricants and related products and servicesto the automotive, industrial, marine and energy markets across theworld. Following a decision to simplify and focus our channels of trade,we now sell products direct to our customers in around 46 countries anduse approved local distributors for the remaining locations. Customerfocus, distinctive brands, superior technology and relationships remainthe cornerstones of our long-term strategy.
BP markets primarily through its major brands of Castrol and BP,and also the Aral brand in some specific markets. Castrol is recognized asone of the most powerful lubricants brands worldwide and we believe itprovides us with a significant competitive advantage. In the automotivelubricants sector, we supply lubricants and other related products andservices to intermediate customers such as retailers and workshops.These, in turn, serve end-consumers such as car, truck and motorcycleowners in the mature markets of Western Europe and North Americaas well as the markets of Russia, China, India, the Middle East, SouthAmerica and Africa, which we believe have the potential for significantlong-term growth. In 2009, more than 30% of pre-tax operating incomewas generated from emerging markets.
BP marine lubricants is one of the largest global suppliers oflubricants to the marine industry. We supply many types of vessels frombulkers to container ships to dredgers and cruise ships, with globalpresence in over 850 ports. BP’s industrial lubricants business is aleading supplier to those sectors of the market involved in themanufacture of automobiles, trucks, machinery components andsteel. BP is also a leading supplier of lubricants for the offshore oiland aviation industries.
Petrochemicals
Our petrochemicals operations comprise the global Aromatics & Acetylsbusinesses (A&A) and the Olefins & Derivatives (O&D) businesses,predominantly in Asia. New investments are targeted principally in thehigher-growth Asian markets.
In A&A we manufacture and market three main product lines:purified terephthalic acid (PTA), paraxylene (PX) and acetic acid. Ourstrategy is to leverage our industry-leading technology in selectedmarkets, to grow the business and to deliver industry-leading returns.PTA is a raw material used in the manufacture of polyesters used infibres, textiles and film, and polyethylene terephthalate (PET) bottles.Acetic acid is a versatile intermediate chemical used in a variety ofproducts such as paints, adhesives and solvents, as well as its use in theproduction of PTA. We have a strong global market share in the PTA andacetic acid markets with a major manufacturing presence in Asia,particularly China. PX is a feedstock for PTA production. In addition tothese three main products, we produce a number of other specialitypetrochemicals products. We have a total of 14 manufacturing sitesoperating in the UK, the US, Belgium, China, Indonesia, Korea, Malaysiaand Taiwan, including our joint ventures.
In O&D, we crack naptha and ethane as feedstocks to produceethylene and other products and derivatives, within equity-accountedentities.
BOL08439_p035 pp45_Bus rev:20 F 5/3/10 17:31 Page 37 Bleed: 0�mm Scale: 100%

38
Business review
BOL08439_p035 pp45_Bus rev:20 F 5/3/10 17:31 Page 38 Bleed: 0�mm Scale: 100%
Our O&D business has operations in both China and Malaysia. In China,our SECCO joint venture between BP, Sinopec and its subsidiary,Shanghai Petrochemical Company, is the largest olefins cracker in China.SECCO is BP’s single largest investment in China. This naphtha crackerproduces ethylene and propylene plus derivatives acrylonitrile,polyethylene, polypropylene, styrene, polystyrene, butadiene and otherproducts. In Malaysia, BP participates in two joint ventures: EthyleneMalaysia Sdn. Bhd. (EMSB), which produces ethylene from gas feedstockin a joint venture between BP, Petronas and Idemitsu; while PolyethyleneMalaysia Sdn. Bhd. (PEMSB) produces polyethylene in a joint venturebetween BP and Petronas. BP also owns one other naphtha crackersite outside of Asia, which is integrated with our Gelsenkirchenrefinery in Germany.
The following table shows BP’s petrochemicals productioncapacity at 31 December 2009. This production capacity is based on theoriginal design capacity of the plants plus expansions.
BP share of petrochemicals production capacitya b
thousand tonnes per year
AceticGeographic area PTA PX acid Other O&D Total
US 2,385 2,373 583 151 – 5,492Europe 1,330 624 532 158 1,629 4,273Rest of World 3,704 – 1,035 108 3,217 8,064
7,419 2,997 2,150 417 4,846 17,829
aPetrochemicals capacity is the maximum proven sustainable daily rate (msdr) multiplied by thenumber of days in the respective period, where msdr is the highest average daily rate ever achievedover a sustained period.
b Includes BP share of equity-accounted entities.
Global fuels
The supply of aviation fuels and LPG is run globally in the global fuels SPU.Air BP is one of the world’s largest and best known aviation fuels
suppliers, serving many of the major commercial airlines as well as thegeneral aviation and military sectors. During 2009, which was anothertough year for the aviation industry, we continued to simplify ourgeographical footprint by exiting non-core countries and we now supplycustomers in 64 countries. This has allowed us to reduce working capitaland improve returns on operating capital employed.
We have annual marketing sales in excess of 25 billion litres. AirBP’s strategic aim is to grow its position in the core locations of Europe,the US, Australasia and the Middle East, while focusing its portfoliotowards airports that offer long-term competitive advantage.
The LPG business sells bulk, bottled, automotive and wholesaleLPG products to a wide range of customers in 12 countries. During thepast few years, our LPG business has consolidated its position andintroduced new consumer offers in established markets, developedopportunities in growth markets and pursued new demand such as theGerman Autogas market. In 2009, we have divested non-core operationsand focused our asset base around sustainable marketing operations.Annual sales are in excess of 2 million tonnes per annum.
Other businesses and corporateOther businesses and corporate comprises the Alternative Energybusiness, Shipping, the group’s aluminium asset, Treasury (whichincludes interest income on the group’s cash and cash equivalents), andcorporate activities worldwide.
The financial results of Other businesses and corporate arediscussed on page 53.
Key statistics
$ million
2009 2008 2007
Sales and other operating revenuesa 2,843 4,634 3,698Replacement cost profit (loss) before
interest and taxb (2,322) (1,223) (1,209)Total assets 17,954 19,079 20,595Capital expenditure and acquisitions 1,299 1,839 939
aIncludes sales between businesses.b Includes profit after interest and tax of equity-accounted entities.
Alternative Energy
Alternative Energy comprises BP’s low-carbon businesses and futuregrowth options outside oil and gas. Alternative Energy is focused on fourkey businesses, which we believe have the potential to be a materialsource of low-carbon energy and are aligned with BP’s core capabilities.These are biofuels, wind, solar, and hydrogen power and carbon captureand storage (CCS).
Our marketIt is now well accepted that a more diverse mix of energy will be requiredto meet future demand. The International Energy Association (IEA)a
estimates that world energy demand could be 40% higher than atpresent by 2030, driven largely by China and India. The IEA also projectsthat higher fossil-fuel prices, as well as increasing concerns over energysecurity and climate change, could boost the share of wind and solarelectricity generation from 1% in 2007 to 6% in 2030, and the biofuelsshare of transport fuels from 1% in 2007 to 4% in 2030b.
Our performanceAlternative Energy made good progress in 2009. Our wind business hasadded 279MW of capacity including the construction of two wind farmsin the US – Fowler Ridge II in Indiana and Titan I in South Dakota – takingthe total capacity in commercial operation to 711MW (1,237MW gross)at the end of 2009. In our solar business, we completed the restructuringof our manufacturing facilities and increased unit sales 25% over 2008.Our biofuels business is investing in advanced technologies. We have ourfirst joint-venture ethanol refinery in Brazil and another joint-venturefacility is under construction in the UK.
Since 2005, we have invested more than $4 billionc in AlternativeEnergy, in line with our commitment to invest $8 billion by 2015.
a Adapted from World Energy Outlook 2009. ©OECD/IEA 2009, page 73.bWorld Energy Outlook 2009. ©OECD/IEA 2009, pages 622-623: ‘Reference Scenario, World’.c The majority of costs have been capitalized, some were expensed under IFRS.
2009 2008 2007
Wind – net rated capacity at year-end (megawatts)a 711 432 172
Solar – module sales (megawatts)b 203 162 115
aNet wind capacity is the sum of the rated capacities of the assets/turbines that have entered intocommercial operation, including BP’s share of equity-accounted entities. The equivalent capacitieson a gross-JV basis (which includes 100% of the capacity of equity-accounted entities where BPhas partial ownership) were 1,237MW in 2009, 785MW in 2008 and 373MW in 2007. This includes32MW of capacity in the Netherlands that is managed by our Refining and Marketing segment.
bSolar sales are the total sales of solar modules to third-party customers, expressed in MW.Previously we reported the theoretical cell production capacity of our in-house solar manufacturingfacilities. Reporting sales volumes operating data brings us into line with the broader solar industry.

39
Business review
Bu
sin
ess r
evie
w
Bu
sin
ess re
vie
w
BiofuelsBP has a key role to play in enabling the transport sector to respond tothe dual challenges of energy security and climate change. We haveembarked on a focused programme of biofuels development basedaround the most efficient transformation of sustainable and low-costsugars into a range of fuel molecules. BP continues to invest throughoutthe entire biofuels value chain from sustainable feedstocks that minimizepressure on food supplies through to the development of the advantagedfuel molecule biobutanol. BP has production facilities operating, or in theplanning and construction phases, in the US, Brazil and the UK.
In 2009, we announced a $45-million investment in a jointventure with Verenium which plans to construct a facility to producelignocellulosic bioethanol in Florida, US. This investment builds on the$90-million investment made by BP in 2008 to further develop existingVerenium technical work and develop a demonstration plant atcommercial scale. In August, BP also announced a $10-million multi-yearagreement with Martek Biosciences Corporation to establish proof ofconcept for large-scale microbial biodiesel production through thefermentation of sugars.
The blending and distribution of biofuels continues to be carriedout by our Refining and Marketing segment, in line with regulation. BP isone of the largest blenders and marketers of biofuels in the world.
WindIn wind power, BP has focused its portfolio in the US, where we believethe most attractive opportunities exist and where we have developedone of the leading wind portfolios.
During 2009, we announced the completion of phase I of the100MW Flat Ridge Wind Farm in Barber County, Kansas. BP and WestarEnergy, Inc. each own 50% of phase 1 of the wind farm. BP sells itsshare of the output to Westar. In addition, commercial operationscommenced at the Fowler Ridge Wind Farm in Benton County, Indiana,the largest wind farm in the US Midwest at 600MW, where BP andDominion are equal partners in 300MW. BP and Sempra Generation areequal partners in 200MW, and 100MW is wholly-owned by BP. Fullcommercial operation also began at our wholly-owned 25MW Titan IWind Farm in South Dakota.
As a result, BP has increased its net wind generation capacity to711MW during 2009, an increase of 65% over the prior year. This netincrease in capacity includes the disposal of 78MW of our wind interestsin India as part of our focus on US wind.
Solar2009 was quite challenging in the solar market due to weak demand inthe first half year and a significant decrease in module sales prices ofabout 40%. However, BP Solar was successful in increasing unit salesby 41MW to 203MW, an increase of 25% over 2008.
BP Solar’s organization, with over 1,700 employees worldwide,is headquartered in San Francisco, California, in the US. BP Solar isstructured to serve the residential, commercial, and utility markets withsales and marketing offices in major markets around the world. Ourmanufacturing facilities are located in Frederick, Maryland, US; and jointventure manufacturing is located in Xi’an, China and Bangalore, Indiaa.
During 2009, BP Solar continued to restructure manufacturing toreduce costs and, as part of this programme, module assembly wasphased out in Maryland and our cell manufacture and module assemblyfacilities in Madrid, Spain, were closed. Wafer and cell manufacturingfacilities in Maryland and joint venture manufacturing sites in China andIndia continue to supply BP Solar.
aOur Indian manufacturing operations are accounted for as a consolidated subsidiary.
Hydrogen power and CCSBP has played a leading role in the CCS industry for more than 10 years,and today focuses on both full-scale projects and a continuingprogramme of research and technology development. The HydrogenEnergy International Limited joint venture, which was formed to develophydrogen power projects in 2007, is now wholly owned by BP followingan agreement with Rio Tinto to sell its 50% share.
The two companies are continuing to develop the HydrogenEnergy California 250MW power project with CCS through theHydrogen Energy International LLC joint venture, which secured$308 million of Department of Energy (DoE) funding during 2009.The funding award was made to California as part of the AmericanRecovery Reinvestment Act of 2009 and is part of the third round ofthe DoE’s Clean Coal Power Initiative.
Separately, the 400MW Hydrogen Power Abu Dhabi project withCCS reached an important milestone, with the Abu Dhabi environmentalregulator’s approval of the environment and social impact assessment.The project is a joint venture between BP (40%) and Masdar (60%).
Shipping
We transport our products across oceans, around coastlines and alongwaterways, using a combination of BP-operated, time-chartered andspot-chartered vessels. All vessels conducting BP activities are subjectto our health, safety, security and environmental requirements. Theprimary purpose of our shipping and chartering activities is thetransportation of our hydrocarbon products. In addition, we may usesurplus capacity to transport third-party products.
International fleetThe size of our managed international fleet has not changed since 2008.At the end of 2009, we had 54 international vessels (37 medium-sizecrude and product carriers, four very large crude carriers, one North Seashuttle tanker, eight LNG carriers and four LPG carriers). All these shipsare double-hulled. Of the eight LNG carriers, BP manages one on behalfof a joint venture in which it is a participant and operates seven LNGcarriers.
Regional and specialist vesselsIn Alaska, we retain a fleet of four double-hulled vessels. Outside theUS, we had 14 specialist vessels (two double-hulled lubricants oil bargesand 12 offshore support vessels).
Time-charter vesselsBP has 104 hydrocarbon-carrying vessels above 600 deadweight tonneson time-charter, of which 102 are double-hulled. All these vesselsparticipate in BP’s Time Charter Assurance Programme.
Spot-charter vesselsBP spot-charters vessels, typically for single voyages. These vessels arealways vetted for safety assurance prior to use.
Other vesselsBP uses various craft such as tugs, crew boats and seismic vessels insupport of the group’s business. We also use sub-600 deadweight tonnebarges to carry hydrocarbons on inland waterways.
BOL08439_p035 pp45_Bus rev:20 F 5/3/10 17:31 Page 39 Bleed: 0�mm Scale: 100%

40
Business review
Maritime security issuesAt a strategic level, BP avoids known areas of pirate attack or armedrobbery; where this is not possible for trading reasons and we consider itsafe to do so, we will continue to trade vessels through these areas,subject to the adoption of heightened security measures.
2009 has seen continuing pirate activity in the Gulf of Aden,extending into the Indian Ocean (from the east coast of Somalia tobeyond the Seychelles) and a significant increase in the number ofinternational shipping incidents. The number of vessels actuallyhijacked has remained roughly the same as 2008, as a result ofheightened awareness to the threat, and protective measures adopted bytransiting ships.
At present, we follow available military and government agencyadvice and are participating in protective group transits through the Gulfof Aden Maritime Security Patrol Area transit corridor. BP supports theprotective measures recommended in the international shipping industryguide Best Management Practices to Deter Piracy in the Gulf of Adena.
Aluminium
Our aluminium business is a non-integrated producer and marketer ofrolled aluminium products, headquartered in Louisville, Kentucky, US.Production facilities are located in Logan County, Kentucky, and are jointlyowned with Novelis. The primary activity of our aluminium business is thesupply of aluminium coil to the beverage can business, which itmanufactures primarily from recycled aluminium.
Treasury
Treasury manages the financing of the group centrally, ensuring liquiditysufficient to meet group requirements and manages key financial risksincluding interest rate, foreign exchange, pension and financial institutioncredit risk. From locations in the UK, the US and the Asia Pacific region,Treasury provides the interface between BP and the internationalfinancial markets and supports the financing of BP’s projects around theworld. Treasury trades foreign exchange and interest rate products in thefinancial markets, hedging group exposures and generating incrementalvalue through optimizing and managing flows. Trading activities areunderpinned by the compliance, control, and risk managementinfrastructure common to all BP trading activities.
Insurance
The group generally restricts its purchase of insurance to situationswhere this is required for legal or contractual reasons. This is becauseexternal insurance is not considered an economic means of financinglosses for the group. Losses are therefore borne as they arise, ratherthan being spread over time through insurance premiums with attendanttransaction costs. This position is reviewed periodically.
aJointly published and supported by Industry bodies, including OCIMF.
Research and technologyResearch and technology (R&T) has a critical role to play in addressing theworld’s energy challenges, from fundamental research through to wide-scale deployment. BP’s model is one of selective technology leadership,where we have chosen 20 major technology programmes – 10 inExploration and Production, seven in Refining and Marketing and threefocused on lower-carbon value chains.
Inside the business segments, the full breadth of these activitiesis carried out in service of competitive business performance and newbusiness development, through research and development (R&D) oracquisition of new technologies. The central R&T group providesleadership and assurance for scientific and technological activities acrossBP with a focus on having the right capability in critical areas, overseeingthe quality of BP’s major technology programmes, and illuminating thepotential of emerging science. External assurance is achieved throughthe Technology Advisory Council, which advises the board and executivemanagement on the state of research and technology within BP. TheCouncil comprises typically eight to 10 world-leading and eminentindustrialists and academics.
R&D is carried out using a balance of internal and externalresources. Involving third parties in the various steps of technologydevelopment and application enables a wider range of ideas andtechnologies to be considered and implemented, improving the impact ofresearch and development activities and the leverage of our spend.
Across the group, expenditure on R&D for 2009 was $587 million,compared with $595 million in 2008 and $566 million in 2007. SeeFinancial statements – Note 11 on page 132. Despite the economicdownturn of 2009, R&D spending remained roughly flat. In addition weincreased our focus on value realization from the application oftechnology (including field trials), and capability development, which arenot included in the headline R&D expenditure.
In our Exploration and Production segment, we selectively focuson 10 ‘flagship’ technology programmes which have the greatestbusiness impact. We consider that each has the potential to add morethan one billion boe to reserves through their development anddeployment in our assets worldwide. These technologies continue tocontribute to exploration and production success in Alaska, Angola,Azerbaijan, Egypt, North Africa, the North Sea, Trinidad and thedeepwater Gulf of Mexico. 2009 highlights from four of these flagshipsinclude:• Advanced seismic imaging – BP’s expertise leads the industry, with
cutting-edge ‘simultaneous sweeping’ techniques being successfullyapplied in onshore seismic surveys in Libya and Oman. Offshore, BPcompleted its largest ever 3D surveys in Libya’s deepwater, carriedout the most northerly 3D seismic programme ever conducted (in theCanadian Beaufort Sea), and deployed a wide azimuth towedstreamer in Angola – an acquisition configuration developed byBP to image areas of complex geology below salt. These imagingtechniques significantly reduce time and costs needed to acquireseismic data over vast areas.
• Enhanced oil recovery (EOR) technologies are pushing recoveryfactors to new limits. By increasing the overall recovery factor fromour fields by 1%, we believe we can add 2 billion boe to our reserves.At the Endicott field in Alaska, BP completed a field trial of its LoSalTM
EOR technology, which uses injection water with a much lower thanusual salt content to flush out or displace extra oil from the reservoir.Following the success of this trial, the technology is now beingactively considered for application in several new projects. BP hasnow performed 38 Bright Water™ treatments in Alaska, Argentinaand Pakistan, which have delivered an increase of more than 9 millionbarrels to our recoverable volumes at a development cost of less than$6 per barrel.
BOL08439_p035 pp45_Bus rev:20 F 5/3/10 17:31 Page 40 Bleed: 0�mm Scale: 100%

41
Business review
Bu
sin
ess r
evie
w
Bu
sin
ess re
vie
w
• Field-of-the-FutureTM (FotF) exploits digital technologies to improveperformance and optimize production. For example, ISIS, aproprietary system designed by BP engineers, gathers subsurfaceinformation from wells in real time using field sensors that measureparameters such as pressures and temperatures. ISIS has nowbeen deployed as a virtual flow meter and has improved productionrates at Thunder Horse and other fields. BP has deployed FotF to 35operations using a common platform, leading the industry in thisarea.
• Inherently reliable facilities – BP conducted a high reliabilitychemical injection skid field trial at Wytch Farm in the UK, as part ofthis flagship’s objectives of improving corrosion inhibition, extendingthe life of BP’s assets and ensuring safe, reliable and efficientoperations.
In our Refining and Marketing segment, technology is deliveringperformance improvements across all businesses. For example:• Refining technology advances are enabling better understanding and
processing of feedstocks of varying quality and optimization of ourassets in real time, enhancing the flexibility and reliability of ourrefineries and improving margins. The reconfiguration at Whitingrefinery to process heavier crudes is on track, incorporatingtechnologically advanced coking operations. BP’s Refinery-of-the-Future programme develops and deploys state-of-the-artmeasurement, monitoring and predictive technologies to improverefinery safety, integrity, availability and utilization, and to optimizefeedstock selection and blending. For example, BP has completedlarge-scale field trials of wireless, online, sensors for remotecorrosion monitoring, and deployment across our refineries is nowunder way.
• BP’s leading technologies in fuels and lubricants mean that it cankeep ahead of increasingly stringent regulations, balancing greaterfuel efficiency and performance and developing superior formulationsacross its entire product slate. In 2009, BP completed the launch ofCastrol EDGE Sport, a range of highly advanced synthetic engine oilsthat outperform conventional, high mileage, part synthetic andbenchmark synthetic motor oils. BP’s strong relationship with Fordhas contributed to important technological advances in fuel andlubricants products, including a joint UK Government-backed projectto improve fuel efficiency, which has achieved reductions in frictionand a significant overall reduction in fuel usage for next generationengines.
• Our proprietary processing technologies and operational experiencecontinue to reduce the manufacturing costs and environmentalimpact of our petrochemicals plants, helping to maintain competitiveadvantage in purified terephthalic acid (PTA) and acetic acid. Learningfrom successful project implementations in Asia, continuousimprovement of our CATIVA® technology for manufacture of aceticacid maintains BP’s world-class capital and conversion cost position.
• In the field of conversion technology, our Fischer-Tropschdemonstration plant programme in Nikiski, Alaska, has beencompleted, proving the performance of BP’s fixed-bed process. Thistechnology is now ready for commercial deployment and available forthird-party licensing. The process is particularly well suited for thechemical conversion of biomass-derived feedstocks to liquids.
BP’s Alternative Energy portfolio covers a wide range of renewable andlow-carbon energy technologies.• In 2009, our biofuels business extended its reach and capability
through joint ventures with Dupont (to develop, produce and marketnext-generation biofuels from biobutanol), Verenium (two 50:50 JVsaccelerating the development and commercialization of biofuels fromlignocellulosic feedstocks), and Martek Biosciences (developingtechnology to convert sugars into diesel).
• In our solar business, BP has joined forces with InteruniversityMicroelectronics Centre (IMEC) and other partners to demonstratehigh-efficiency, low-cost silicon Mono2TM solar cells. This newtechnology is producing cells ranging up to 18% efficiency, comparedwith multicrystalline cells that are typically around 15%-15.8%efficiency. Mono2 cells are fabricated using BP Solar’s proprietarycasting technique to produce monocrystalline wafers. BP Solar hasalso developed and is in the process of commercializing a fullportfolio of module technology. This uses advanced heatmanagement and internal microcircuits to optimize energyproduction, safety, and ease of operation and maintenance.
• Our carbon capture and storage projects in Abu Dhabi andCalifornia are making progress, with environmental regulator approvalfor the former and Department of Energy funding for the latter.
Collaboration plays an important role across the breadth of BP’s researchand development activities, but particularly in those areas that benefitfrom fundamental scientific research:• BP has 11 significant, long-term research programmes with major
universities and research institutions around the world, exploringareas from energy bioscience and conversion technology to carbonmitigation and nanotechnology in solar power. In 2009, weestablished an EOR exploratory research programme with threeEuropean universities to improve our understanding, foster innovationand provide a ‘springboard’ for new technologies.
• At our Energy Biosciences Institute at Berkeley, we have locatedBP researchers at the institute to collaborate with the academicresearchers. Several foundational research platforms have beenestablished (including second-generation biofuel technologies andmicrobially-enhanced oil and gas recovery) and the first patents andinventions have started to emerge.
• BP is an industry member of the UK’s Energy Technologies Institute
(ETI) – a public/private partnership to accelerate low-carbontechnology development. In 2009, the ETI commissioned over£50 million ($80 million) of work covering 10 projects across a widerange of technologies. The ETI has also developed a model of the UKenergy system which projects out to 2050.
• In 2009, BP launched the Energy Sustainability Challenge, a three-year study into how changes in availability of and demand for naturalresources and ecosystem services will affect future energy supplyand demand, the technologies that could enable more efficient useof natural resources, and the policies that will be necessary to bringthese into effect.
BOL08439_p035 pp45_Bus rev:20 F 5/3/10 17:31 Page 41 Bleed: 0�mm Scale: 100%

42
Business review
Corporate responsibilitySafetySafety, people and performance are BP’s top priorities. We constantlyseek to improve our safety performance through the procedures,processes and training programmes that we implement in pursuit ofour goal of ‘no accidents, no harm to people and no damage to theenvironment’.
In 2009, a third-party-operated helicopter carrying contractorsfrom BP’s Miller platform crashed in the North Sea resulting in the tragicloss of 16 lives. In addition, BP sustained two fatalities within our ownoperations, one, when a rig worker was lost overboard during drillingoperations in Azerbaijan and a second, in a crush injury on a well padin Alaska.
We deeply regret the loss of these lives.
Safety and operational performance
In 2009, BP’s safety record continued to improve, as indicated bymeasures of personal safety including reported recordable injuryfrequency (RIF) and days away from work case frequency (DAFWC).
Our overall RIF of 0.34 was significantly lower than the rate of0.43 in 2008 and 0.48 in 2007. Our DAFWCF was 0.069, an improvementon the level of 0.080 in 2008.
In 2009, eight work-related major incidents were reported,compared with 21 in 2008. Major incidents include incidents resulting infatalities, significant property damage or significant environmentalimpacts. All fatalities and other major incidents and many that have thepotential to become major incidents, are discussed by the groupoperations risk committee (GORC), chaired by the group chief executive.Our mandatory internal requirement to undertake incident investigationsseeks to ensure that we learn as much as possible from each incidentand take action to prevent re-occurrence.
There were 234 oil spills of one barrel or more reported in 2009, asignificant reduction on the 335 spills that occurred in 2008. The reportedvolume of oil spilled in 2009 was approximately 1,191 million litres, areduction of 65% compared with 2008.
This performance follows several years of intense focus ontraining and procedures across BP. BP’s operating managementsystem (OMS), which provides a single operating framework for all BPoperations, is a key part of continuing to drive a rigorous approachto safe operations. 2009 marked an important year in the continuingimplementation of OMS.
Safe, reliable and responsible operations
Having been introduced at eight operating sites in 2008, implementationof the OMS gathered pace in 2009. The system was up and running at70 operations across the business by the end of the year, including all ouroperated refineries and petrochemicals plants. This represents around80% of the operations for which OMS implementation is planned, withthe remainder scheduled to be live by the end of 2010.
Taking a systematic approach is integral to improving safety andoperating performance in every BP site. Our OMS covers all areas fromprocess safety, to personal health, to environmental performance. Byapplying consistent principles and processes across the BP group’soperations, the system provides for an integrated and consistent way ofworking. These principles and processes are designed to simplify theorganization, improve productivity, enable consistent execution and focusBP on performance.
Capability development
Having built a safety and operations learning framework to enhance thecapability of our staff to deliver safe, reliable, responsible and efficientoperations, we defined target populations for these programmes moreaccurately in 2009.
More than 2,700 front-line operational leaders across our globaloperations have started one or more of the modules within the OperatingEssentials programme which seeks to embed the BP way of operatingas defined by OMS. Our Operations Academy (OA), a partnership withthe Massachusetts Institute of Technology (MIT), is also now wellestablished. Seven cadres of senior operations staff have alreadyattended this academy and three of these have graduated: all areapplying their learning and having a deep influence in the operationscommunity. We also have an Executive Operations Programme whichhas continued to support the executive team and senior business leadersin the development of their unique operations capability requirements.
Process safety management
We continued to implement the 2007 recommendations made by the BPUS Refineries Independent Safety Review Panel (Panel), which followingthe incident at Texas City in 2005, reviewed process safety managementat our US refineries and our safety management culture.
In accordance with those recommendations, we appointed anIndependent Expert for a five-year term to monitor their implementation.We again co-operated closely with the Independent Expert in 2009,providing him access to our sites, personnel and documentation androutinely supplying him with progress reports. In the IndependentExpert’s second annual report, published in 2009, he acknowledged BP’ssustained focus on its safety and operations agenda and the prioritygiven by executive management and the board to safe, reliable andresponsible operations. The report identified areas for continued focusand highlighted the progress made in several areas, including thedevelopment of capability programmes, OMS implementation, safety andoperations auditing, and the improvement of metrics to monitor processsafety performance. During the course of 2009, we also provided regularprogress updates to the Safety, Ethics and Environment AssuranceCommittee of the board.
See Legal proceedings on pages 95-96 in respect of ongoingTexas City refinery matters.
By the end of 2009 our safety and operations audit team hadaudited a total of 94 BP businesses, including all major operating sites,within a three-year period. The audits, which in 2009 included pilot auditsfor analysis against the requirements of the OMS, have provided arigorous process for assessing our businesses against BP’s relevantstandards and requirements.
We also participated in industry-wide forums on process safety.We chaired the API/ANSI multi-stakeholder group developing a standardfor public reporting of leading and lagging process safety indicators.Through this and other bodies, we shared our learning with otherorganizations within and outside the oil and gas industry.
‘Six-point plan’
Our efforts on process safety included taking action to close out oursix-point plan for process safety, which was launched in 2006 to addressimmediate priorities for improving process safety and minimizing risk atour operations worldwide. We have either completed the required actionsor integrated the few continuing requirements within the OMS, fortracking to completion. We established a clear approach for futuremonitoring of these within the internal HSE & Operations IntegrityReport. This report, which is the key source of management informationrelating to safety and operations in BP, is prepared quarterly for theGORC.
BOL08439_p035 pp45_Bus rev:20 F 5/3/10 17:32 Page 42 Bleed: 0�mm Scale: 100%

43
Business review
Bu
sin
ess r
evie
w
Bu
sin
ess re
vie
w
EnvironmentClimate change
BP recognizes that climate change is a global concern representing asignificant challenge for society, the energy industry, and BP.
We monitor and report on greenhouse gas (GHG) emissionsa, andwe manage our GHG emissions through a focus on operational energyefficiency. Each year since 2002, we have estimated the reduction in ourreported annual emissions due to efficiency projects and the runningtotal of these estimated reductions is now 7.9 million tonnes (Mte),including 0.3Mte estimated for the last year.
However, last year’s sustainable reductions have been morethan offset by additional emissions from increased operational activity.As such, we are reporting 65.0Mte of GHG emissions for the year 2009,3.6Mte higher than the 61.4Mte reported for 2008. Increased throughputfrom US refineries, the start-up of our Tangguh LNG project in Indonesiaand deepwater production platforms in the Gulf of Mexico account formuch of this increase.
We expect that additional regulation of GHG emissions in thefuture and international accords aimed at addressing climate changewill have an increasing impact on our businesses, operating costs andstrategic planning, but may also offer opportunities in the development oflow-carbon technologies and businesses. See Regulation – Greenhousegas regulation on page 44.
To address this expectation, we factor a carbon cost into ourinvestment appraisals and the engineering design of new projects. Wedo this by requiring projects to make realistic assumptions about the likelycarbon price during the lifetime of the project. This is used as a basis forassessing the economic value of the investment, and for assessingoptions to optimize the way the project is engineered. This is our way ofevaluating investments to ensure they are competitive not only in today’sworld but in a future where carbon has a more robust price.
Environmental management
During 2009, we began integrating our environmental managementsystems into our operating management system (OMS) and piloted anintegrated approach to identify potential environmental and socialimpacts in new projects. These are intended to improve our consistencyand effectiveness in identifying and mitigating the environmental andsocial impacts of our operations. Our major operating sites are allcertified under the international environmental management systemstandard ISO 14001, with the exception of the Texas City petrochemicalsplant which is seeking certification in 2010.
None of our new projects entered a protected area in 2009.Our protected areas classification includes the International Union forthe Conservation of Nature (IUCN) I-IV, Ramsar and World Heritagedesignations.
We continue to strengthen our processes for managingcompliance with environmental regulations in each of the countries inwhich we operate. In addition, each employee is required to comply withthe health, safety and environmental requirements of the BP code ofconduct. We expect our partners, suppliers and contractors to complywith legal requirements and operate consistently with the principles ofour code of conduct.
Information on the environmental impact of our operations andour efforts to manage resources responsibly are discussed in our annualBP Sustainability Report which is available on our website atwww.bp.com/sustainability.
aWe report greenhouse gas (GHG) emissions, and emission reductions, on a CO2-equivalent basisincluding CO2 and methane. This represents all consolidated entities and BP’s share of equity-accounted entities except TNK-BP.
Technology development
BP invests in, or jointly funds, research and development seekingopportunities to reduce our potential environmental impacts, for example,sound and marine life research, a range of water management projectsand advanced drill cuttings treatment. BP also participates in public andprivate partnerships to develop new technologies. These include:• the Energy Biosciences Institute (EBI) in the US, which conducts
research into biofuel technologies, improved oil and gas recovery andcarbon sequestration;
• the Energy Technologies Institute (ETI) in the UK, which seeks toaccelerate the development of energy technologies to reduce GHGemissions including offshore wind and for marine, tidal and waveenergy; and
• the Carbon Mitigation Initiative at Princeton University, to researchthe fundamental environmental, and technological issues in carbonmanagement.
Regulation
BP operates in more than 80 countries and is subject to a wide varietyof environmental regulations concerning our products, operations andactivities. Current and proposed fuel and product specifications,emission controls and climate change programmes under a number ofenvironmental laws may have a significant effect on the production, saleand profitability of many of our products.
There also are environmental laws that require us to remediateand restore areas damaged by the accidental or unauthorized release ofhazardous materials or petroleum associated with our operations. Theselaws may apply to sites that BP currently owns or operates, sites that itpreviously owned or operated, or sites used for the disposal of its andother parties’ waste. Provisions for environmental restoration andremediation are made when a clean-up is probable and the amountof BP’s legal obligation can be reliably estimated. The cost of futureenvironmental remediation obligations is often inherently difficult toestimate. Uncertainties can include the extent of contamination, theappropriate corrective actions, technological feasibility and BP’s share ofliability. See Financial statements – Note 34 on page 158 for the amountsprovided in respect of environmental remediation and decommissioning.
A number of pending or anticipated governmental proceedingsagainst BP and certain subsidiaries under environmental laws could resultin monetary sanctions of $100,000 or more. We are also subject toenvironmental claims for personal injury and property damage allegingthe release or exposure to hazardous substances. The costs associatedwith such future environmental remediation obligations, governmentalproceedings and claims could be significant and may be material to theresults of operations in the period in which they are recognized, but it isnot expected that such costs will be material to the group’s overall resultsof operations, our financial position or liquidity. However, we cannotaccurately predict the effects of future developments on the group, suchas stricter environmental laws or enforcement policies or future eventsat our facilities, and there can be no assurance that material liabilities andcosts will not be incurred in the future. For a discussion of the group’senvironmental expenditure see page 56.
BOL08439_p035 pp45_Bus rev:20 F 5/3/10 17:32 Page 43 Bleed: 0�mm Scale: 100%

44
Business review
Greenhouse gas regulation
Increasing concerns about climate change have led to a number ofinternational, national and regional measures to limit greenhouse gasemissions; additional stricter measures can be expected in the future.Current measures and developments affecting our businesses includethe following:• The Kyoto Protocol currently commits 38 ratified parties to meet
emissions targets in the commitment period 2008 to 2012.• The UN summit in Copenhagen in December 2009 where Parties to
the UN Framework Convention on Climate Change (UNFCCC) tooknote of the Copenhagen Accord. The Accord recognizes the scientificview that the increase in global temperature should be below 2°C.Signatories to the Accord are to append to it their emissions targetsfor 2020 or their proposed GHG mitigation measures. By the end ofJanuary 2010 the UNFCCC had received submissions of nationalpledges to cut and limit greenhouse gases by 2020 from 55countries. According to the UNFCCC, these countries togetheraccount for 78% of global emissions from energy use.
• The European Union (EU) Climate Action and Renewable EnergyPackage which requires increased greenhouse gas reductions,improvements in energy efficiency and increased renewable energyuse by 2020 as well as including the Revision of the EU EmissionsTrading Scheme (EU ETS) directive. This regulates approximatelyone-fifth of our reported 2009 global CO2 emissions and can beexpected to require additional expenditure from 2013 when therevision of the scheme (EU ETS Phase 3) comes into effect.
• Australia has committed to reduce its GHG emissions by between5-25% below 2000 levels by 2020, depending on the extent ofinternational action. Australia has also developed an emissions tradingscheme. If passed in law, it will cover around 70% of the nation’sGHG emissions including stationary energy and transport emissions.
• New Zealand has agreed to cut GHG emissions by 10-20% from1990 levels by 2020, subject to certain conditions. New Zealand isextending the scope of its Emission Trading Scheme in July 2010.
• In the US, recent national legislation has imposed stricter automobilefuel emissions standards and biofuel mandates and legislativeproposals would impose GHG emission limits through cap-and-tradeprogrammes as well as mandates for alternative energy andincreases in energy efficiency.• The US Environmental Protection Agency (EPA) released a GHG
endangerment finding in late 2009 giving it authority to regulateGHG emissions under the Clean Air Act; it has also issued a GHGreporting rule covering major stationary emission sources andupstream fuel suppliers.
• A number of additional state and regional initiatives in the US willaffect our operations including regulation in California seeking toreduce GHG emissions to 1990 levels by 2020, includingreductions in the carbon intensity of transport fuel sold in thestate.
• Canada has adopted an action plan to reduce emissions to 20%below 2006 levels by 2020 and the national government seeks acoordinated approach with the US on environmental and energyobjectives, such as a North America-wide cap-and-trade system.
Each of these measures can increase our production costs for certainproducts, increase demand for competing energy alternatives or productswith lower-carbon intensity and affect the sales of many of our products.
US and EU regulations
Approximately 60% of our fixed assets are located in the US and the EU.US and EU environment and health and safety regulations significantlyaffect BP’s exploration and production, refining, marketing, transportationand shipping operations. Significant legislation in the US and the EUaffecting our businesses and profitability includes the following:
United States
• The Clean Air Act (CAA) regulates air emissions, permitting, fuelspecifications and other aspects of our production, distribution andmarketing activities. Stricter limits on sulphur and benzene in fuelswill affect us going forward. Additionally, many states have separatelaws similar to the CAA.
• The Energy Policy Act of 2005 and The Energy Independence andSecurity Act of 2007 affect our US fuel markets by, among otherthings, imposing renewable fuel mandate and imposing GHGemission thresholds for certain renewable fuels. States such asCalifornia also impose additional carbon fuel standards.
• The Clean Water Act (CWA) regulates wastewater and other effluentdischarges from BP’s facilities, and BP is required to obtain dischargepermits, install control equipment and implement operational controlsand preventative measures.
• The Resource Conservation and Recovery Act (RCRA) regulates thegeneration, handling, and disposal of wastes associated with ouroperations and can require corrective action at locations where suchwastes have released.
• The Comprehensive Environmental Response, Compensation andLiability Act (CERCLA), can, in certain circumstances, impose theentire cost of investigation and remediation on a party who owned oroperated a contaminated site or arranged for waste disposal at thesite. BP has incurred, or expects to incur, liability under CERCLA orsimilar state laws, including costs attributed to insolvent orunidentified parties. BP is also subject to claims for remediation costsunder other federal and state laws, and to claims for natural resourcedamages (NRD) under CERCLA, the OPA 90 and other federal andstate laws.
• The Toxic Substances Control Act regulates BP’s import, export andsale of new chemical products.
• The Occupational Safety and Health Act (OSHA), imposes workplacesafety and health requirements on our operations along withsignificant process safety management obligations.
• The Emergency Planning and Community Right-to-Know Act, requiresemergency planning and hazardous substance release notification aswell as public disclosure of our chemical usage and emissions.
• The US Department of Transportation (DOT) regulates the transportof BP’s petroleum products such as crude oil, gasoline andpetrochemicals.
• The Marine Transportation Security Act and the DOT HazardousMaterials (HAZMAT) and the Chemical Facility Anti-TerrorismStandard (CFATS) regulations impose security compliance regulationson BP and require security vulnerability assessments, securitymitigation plans and require security upgrades that increase our costof operations.
BOL08439_p035 pp45_Bus rev:20 F 5/3/10 17:32 Page 44 Bleed: 0�mm Scale: 100%

45
Business review
Bu
sin
ess r
evie
w
Bu
sin
ess re
vie
w
The US refineries of BP Products North America Inc (BP Products) aresubject to a consent decree with the EPA to resolve alleged violations ofthe CAA and implementation of the decree’s requirements continues. A2009 amendment to the decree resolves remaining alleged air violationsat the Texas City refinery through the payment of a $12 million civil fine, a$6 million supplemental environmental project and enhanced CAAcompliance measures estimated to cost approximately $150 million. Thefine has been paid and BP Products is implementing the other provisions.For further disclosures relating to Texas City refinery, please see Legalproceedings on pages 95-96.
Various environmental groups and the EPA have challengedcertain aspects of the operating permit issued by the Indiana Departmentof Environmental Management (IDEM) for our upgrades to the Whitingrefinery. In response to these challenges, IDEM has reviewed thepermits and responded formally to the EPA. The EPA either throughIDEM or directly can cause the permit to be modified, reissued or inextremis terminated or revoked. BP is in discussions with the EPA andIDEM over these issues and clean air act violations at the Whiting, Toledo,Carson and Cherry Point refineries. Settlement negotiations continue inan effort to resolve these matters.
European Union
BP’s operations in the EU are subject to a number of current andproposed regulatory requirements that affect our operations andprofitability. These include:• The EU Climate Action and Renewable Energy Package and the
Emissions Trading Scheme (ETS) Directive (see Greenhouse gasregulation above).
• The EU European Integrated Pollution Prevention and Control (IPPC)Directive imposes a unified environmental permit requirement on ourmajor European sites including refineries and chemical facilities andrequires assessments and some upgrades to our facilities. Aproposed Industrial Emission Directive would replace the IPPCDirective. It would merge several existing industrial emissiondirectives, impose tighter emission standards for large combustionplants and be more prescriptive as to the Best Available Techniques(BAT) to be used to achieve emission limits. This may result inrequirements for further emission reductions at our EU sites.
• The EC Thematic Strategy on Air Pollution and the related work onrevisions to the Gothenburg Protocol and National Emissions CeilingDirective (NECD). This will establish national ceilings for emissions ofa variety of air pollutants in order to achieve EU-wide health andenvironmental improvement targets. The EC is also considering theuse of a NOX and SO2 trading scheme as a tool to achieve emissionreductions. This may result in requirements for further emissionreductions at our EU sites.
• The EU Regulation on ozone depleting substances (ODS), whichimplements the Montreal Protocol on ODS was most recently revisedin 2009 requires BP to reduce the use of ozone depleting substances(ODS) and phase out certain ODS substances. BP continues toreplace ODS in refrigerants and/or equipment, in the EU andelsewhere, in accordance with the Protocol and related legislation.Methyl bromide (an ODS) is a minor byproduct in the production byour petrochemicals operations of purified terephthalic acid and theprogressive phase out of methyl bromide uses may result in futurepressure to reduce our emissions of methyl bromide.
• The EU Fuel Quality Directive affects our production and marketing offuels. Proposed changes to this directive would require BP to achievelife cycle GHG emission reductions in fuels we sell and would alsofacilitate the introduction of biofuels into gasoline and diesel.
• The EU Registration, Evaluation and Authorization of Chemicals(REACH) legislation requires that we register chemical substances wemanufacture or import into the EU with a complete set of hazard andrisk data. Existing manufactured and imported substances were allpreregistered by 1 December 2008 and qualified for a timed phase-infor full registration during the period 2010-2018. Crude oil and naturalgas are exempt from registration requirements, while fuels areexempt from authorization but not registration. REACH affects ourrefining, petrochemicals and other manufacturing operations.
• International marine fuel regulations under International MaritimeOrganisation (IMO) and International Convention for the Prevention ofPollution from Ships (Marpol) regimes impose stricter sulphuremission restrictions on ships in EU ports and inland waterways andthe North and Baltic seas beginning in 2010 and with a stricter globalcap on marine sulphur emissions beginning in 2012. Furtherreductions are to be phased in thereafter. These restrictions requirethe use of compliant heavy fuel oil (HFO) or distillate, or theinstallation of abatement technologies on ships. These regulations willplace additional costs on refineries producing marine fuel, includingcosts to dispose of sulphur, as well as increased CO2 emissions andenergy costs for additional refining.
• In the UK, significant health and safety legislation affecting BPincludes the Health and Safety at Work Act and regulations and theControl of Major Accident Hazards Regulations.
Maritime regulations
BP Shipping’s operations are subject to extensive national andinternational regulations governing liability, operations, training,spill prevention and insurance. These include:• In US waters, the Oil Pollution Act of 1990 (OPA 90) imposes liability
and spill prevention and planning requirements governing, amongstothers, tankers, barges and offshore facilities and mandates a levyon oil imported and produced domestically to fund oil spill response.Some states, including Alaska, Washington, Oregon and California,impose additional liability for oil spills.
• Outside US territorial waters, BP Shipping tankers are subject tointernational liability, spill response and preparedness regulationsunder the UN’s International Maritime Organization, including theInternational Convention on Civil Liability for Oil Pollution, theInternational Convention for the Prevention of Pollution from Ships,the International Convention on Oil Pollution, Preparedness,Response and Co-operation and the International Conventionon Civil Liability for Bunker Oil Pollution Damage.
To meet its financial responsibility requirements, BP Shipping maintainsmarine liability pollution insurance to a maximum limit of $1 billion foreach occurrence through mutual insurance associations (P&I Clubs) butthere can be no assurance that a spill will necessarily be adequatelycovered by insurance or that liabilities will not exceed insurancerecoveries.
BOL08439_p035 pp45_Bus rev:20 F 5/3/10 17:32 Page 45 Bleed: 0�mm Scale: 100%

46
Business review
BOL08439_p046 pp60_Bus rev:20 F 5/3/10 17:32 Page 46 Bleed: 0�mm Scale: 100%
EmployeesNumber of employees at 31 December US Non-US Total
2009
Exploration and Production 8,000 13,500 21,500
Refining and Marketinga 12,700 38,900 51,600
Other businesses and corporate 2,100 5,100 7,200
22,800 57,500 80,300
2008Exploration and Production 7,700 13,700 21,400Refining and Marketinga 19,000 42,500 61,500Other businesses and corporate 2,600 6,500 9,100
29,300 62,700 92,0002007Exploration and Production 7,800 14,000 21,800Refining and Marketinga 22,700 44,500 67,200Other businesses and corporate 2,500 6,600 9,100
33,000 65,100 98,100
aIncludes 13,900 (2008 21,200 and 2007 24,500) service station staff.
People and their capabilities are fundamental to our sustainability as abusiness. To build an enduring business in an increasingly complex andcompetitive industry, we need people with world-class capabilities,ranging from deepwater drilling and operating refineries to negotiatingwith governments and planning wind farms.
We had approximately 80,300 employees at 31 December 2009,compared with approximately 92,000 at 31 December 2008. Thisreduction principally reflects the transfer of our convenience retail sitesto a franchise model and the progress we have made in making BP asimpler, more efficient organization.
Our focus in 2009 has been on ensuring we have the right peoplein the right roles including renewal of the group leader population. We areseeking to promote continuous improvement by embedding the BPleadership framework throughout the organization. This framework setsout how BP leaders are expected to behave in delivering our strategy andachieving sustained high performance. We are striving for deeper skillsdevelopment and continuing to align reward frameworks to promoteour desired behaviours and outcomes. Diversity and inclusion (D&I) isan important part of all our people processes in BP and involvesacknowledging, valuing and leveraging our similarities and differencesfor business success.
We have made significant progress in changing the culture of thegroup to one with a stronger performance focus and which places morevalue on deep specialist skills and expertise. Creating this culture hasrequired us to enhance our approach to performance management at the business, team and individual level and to align performance andreward outcomes.
We have completed the second cycle of our redesignedperformance management and reward process to ensure that there is adirect link between performance and incentive reward. Throughout theorganization we have also achieved greater differentiation of performance ratings and, as a result, in incentive compensation spend.We believe this will continue to improve the performance focus ofbusinesses and individuals.
In managing our people, we seek to attract, develop and retainhighly talented individuals in order to maintain BP’s capability to deliverour strategy and plans. Our three-year graduate development programmecurrently has 1,400 participants from all over the world.
We are focusing on the need for deep specialist skills.Accordingly, we have increased external hiring in infrastructure andtechnical areas. The energy industry faces a shortage of professionalssuch as petroleum engineers. The number of experienced workersretiring is expected to exceed that of new graduate hires. To help addressthis issue we are developing more robust resourcing plans supported by
initiatives aimed at increasing the numbers of recruits and diversifyingthe sources from which we recruit. The external hiring initiatives aresupported by plans for accelerated discipline development, prioritizeddeployment and retention schemes.
The continuous improvement we are making to performancemanagement and reward will help ensure that BP meets theexpectations of these new recruits who are highly mobile and whoseskills are in high demand.
We aim to ensure equal opportunity in recruitment, careerdevelopment, promotion, training and reward for all employees, including those with disabilities. Where existing employees becomedisabled, our policy is to provide continuing employment and trainingwherever practicable.
We have revitalized our approach to D&I. In 2009, the focushas been to re-establish D&I as a corporate priority. There is nowclear ownership by the business of D&I plans which are the directresponsibility of the relevant SPU or function. Each SPU and function hasa D&I plan against which progress is measured. In addition the groupchief executive chairs the global D&I council. This council is supported bya North American regional council and segment councils. We are creatingmomentum which we expect will lead to sustainable progress on D&I.
The group people committee, formed in 2007, continues to takeoverall responsibility for policy decisions relating to employees. In 2009,this included senior level talent review and succession planning,embedding of D&I plans in the businesses and the structure of long-termincentive plans.
We continue to increase the number of local leaders andemployees in our operations so that they reflect the communities inwhich we operate. For example, in Colombia, national employees nowmake up 98% of BP’s team, while in Azerbaijan, the proportion is around85%. By 2020, more than half our operations are expected to be innon-OECD countries and we see this as an opportunity to developa new generation of experts and skilled employees.
At the end of 2009, 14% of our top 492 group leaders werefemale and 21% came from countries other than the UK and the US.When we started tracking the composition of our group leadership in2000, these percentages were 9% and 14% respectively. We continue toraise our senior leaders’ awareness of D&I, and further training is plannedin 2010.
We aim to develop our leaders internally, although we recruitoutside the group when we do not have specialist skills in-house or when exceptional people are available. In 2009, we appointed 40 peopleto positions in the group leadership population. Of these, 20 wereinternal candidates.

47
Business review
The Leadership Framework is being embedded through access tomanagement development programmes and progress will be measuredby a new 360° feedback tool. The group-wide management developmentprogramme, Managing Essentials – Effective PerformanceConversations, has now run in 41 countries. A further five programmeshave been developed in 2009 which address particular leadershipchallenges faced by the group leader, senior level leader and first levelleader populations.
We provide development opportunities for all our employees,including external and on-the-job training, international assignments,mentoring, team development days, workshops, seminars and onlinelearning. We encourage all employees to take five training days per year.
Through our ShareMatch plan, run in around 65 countries, wematch BP shares purchased by employees.
Communications with employees include magazines, intranetsites, DVDs, targeted emails and face-to-face communication. Teammeetings are the core of our employee engagement, complementedby formal processes through works councils in parts of Europe. Thesecommunications, along with training programmes, are designed tocontribute to employee development and motivation by raisingawareness of financial, economic, social and environmental factorsaffecting our performance.
The group seeks to maintain constructive relationships withlabour unions.
In 2008, we received feedback through our employee engagementsurveys that, while there was still very high loyalty to BP as a company,employee engagement was declining as we worked through the difficultactions needed to turn around our performance. In response, we havemade it a priority to ensure that BP’s group leaders are better equippedto tell our story and engage their staff in supporting our strategy.
The progress we have made in employee engagement is evidentfrom the results from our 2009 employee survey. The response rate forthe survey improved year on year with 57% of people completing thesurvey, up from 42% in 2008. The Employee Satisfaction Index and ourPulse survey scores for Performance culture and Safety and Complianceculture all improved year on year.
We continue to make significant efforts to communicate theintent and progress of our ongoing cost-efficiency programmes, tominimize any potential negative perceptions within the business. Wehave moved quickly to manage these people and performance changeswhile keeping the focus on safety, continuous improvement andsustainable change. These improvements are expected to continue in2010, but we have already delivered material reductions in complexity,cost and headcount.
The code of conduct
We have a code of conduct designed to ensure that all employeescomply with legal requirements and our own standards. The code defineswhat BP expects of its people in key areas such as safety, workplacebehaviour, bribery and corruption and financial integrity. Our employeeconcerns programme, OpenTalk, enables employees to seek guidanceon the code of conduct as well as to report suspected breaches ofcompliance or other concerns. The number of cases raised throughOpenTalk in 2009 was 874, compared with 925 in 2008.
In the US, former US district court judge Stanley Sporkin actsas an ombudsperson. Employees and contractors can contact himconfidentially to report any suspected breach of compliance, ethics orthe code of conduct, including safety concerns.
We take steps to identify and correct areas of non-complianceand take disciplinary action where appropriate. In 2009, 524 dismissalswere reported by BP’s businesses for non-compliance or unethicalbehaviour. This number excludes dismissals of staff employed at ourretail service station sites, for incidents such as thefts of small amountsof money.
BP continues to apply a policy that the group will not participate directlyin party political activity or make any political contributions, whether incash or in kind. Specifically, BP made no donations to UK or other EUpolitical parties or organizations in 2009.
Social and community issuesContributing to communities
We seek to make a positive difference wherever we operate. To do this,we take action that is relevant to local circumstances, mutually beneficialand designed to create enduring, as opposed to short-term, solutions.Our investments in education and local enterprise development aim tobuild local capability as part of our business agenda, either through ourlocal employees or through the provision of goods and services.
As a global energy company, BP operates in a diverse rangeof countries and in a variety of environmental and social conditions.A common feature of these operations is the lifespan of our projects– some BP projects might last as long as 30-40 years. This longevityrequires that BP seeks to cultivate and maintain enduring relationshipswith the communities and governments in these areas. To do this, BP iscommitted to finding solutions that create mutual benefit: work with localcommunities, agencies and organizations on finding solutions to issuesthat can bring benefit to both the local operations as well as help to meetcommunity development needs over a project’s lifespan.
We always seek solutions that are aligned to the strategy of ourlocal businesses. For example, in education we support projects thatcontribute to the wider sustainable development agenda of the particularcountry but also develop skills and capabilities that are relevant to BP.In doing this, we involve ourselves, as appropriate, in supporting theenhancement of the availability, quality and relevance of educationofferings, particularly technical education. This can range from thedevelopment of new geo-science and petro-technical offerings atuniversities, to the support for English language-based technical training, to the support for a broader understanding of the legal aspectsof oil and gas management for policy makers, to the basics of the oilindustry for journalists.
In some instances we get involved in supporting elements ofmacro-economic planning to ensure that issues such as good revenuemanagement practices can enable wider national development. In doingthis we usually facilitate access to world class policy thinkers on a range of issues through BP’s global relationships with leadingeducation institutions.
We also seek to support the development of the local supplychain as a way of deepening the involvement of local enterprise in BPbusiness activities. The way we do this depends on local conditions but can include training, business advisory services or financing programmes that aim to help develop existing business products andservices, improve internal standards and practices, or create newsmall enterprises.
We support various voluntary, multi-stakeholder initiatives aimedat sharing best practice and improving industry-wide management of keysocial and economic challenges. We are a member of the ExtractiveIndustries Transparency Initiative (EITI), which supports the creation of astandardized process for transparent reporting of company payments andgovernment revenues from oil, gas and mining. We are also members ofthe Voluntary Principles on Security and Human Rights through which wehave developed a robust internal process designed to ensure that thesecurity of our operations around the world is maintained in a mannerconsistent with our group stance on human rights.
We make direct contributions to communities through communityprogrammes. Our total contribution in 2009 was $106.8 million, whichincluded $1.3 million to UK charities. The majority of our communityexpenditure was directed towards education and technicaltraining projects.
Bu
sin
ess r
evie
w
Bu
sin
ess re
vie
w
BOL08439_p046 pp60_Bus rev:20 F 5/3/10 17:32 Page 47 Bleed: 0�mm Scale: 100%

48
Business review
In 2009, we spent $55 million promoting education, with investmentin three broad areas: tertiary and post secondary level support forengineering; energy industry-related areas such as geo-science andbusiness leadership skills; and supporting the improvement of scienceand technology teaching within basic education.
Relationships with suppliers and contractorsEssential contracts
BP has contractual and other arrangements with numerous third partiesin support of its business activities. This report does not containinformation about any of these third parties as none of our arrangementswith them are considered to be essential to the business of BP.
Suppliers and contractors
Our processes are designed to enable us to choose suppliers carefullyon merit, avoiding conflicts of interest and inappropriate gifts andentertainment. We expect suppliers to comply with legal requirementsand we seek to do business with suppliers who act in line with BP’scommitments to compliance and ethics, as outlined in our code ofconduct. We engage with suppliers in a variety of ways, includingperformance review meetings to identify mutually advantageousways to improve performance.
Creditor payment policy and practice
Statutory regulations issued under the UK Companies Act 2006 requirecompanies to make a statement of their policy and practice in respect ofthe payment of trade creditors. In view of the international nature of thegroup’s operations there is no specific group-wide policy in respect ofpayments to suppliers. Relationships with suppliers are, however,governed by the group’s policy commitment to long-term relationshipsfounded on trust and mutual advantage. Within this overall policy,individual operating companies are responsible for agreeing terms andconditions for their business transactions and ensuring that suppliers areaware of the terms of payment.
Regulation of the group’s businessBP’s activities, including its oil and gas exploration and production,pipelines and transportation, refining and marketing, petrochemicalsproduction, trading, alternative energy and shipping activities, areconducted in many different countries and are therefore subject toa broad range of EU, US, international, regional and local legislationand regulations, including legislation that implements internationalconventions and protocols. These cover virtually all aspects of ouractivities and include matters such as licence acquisition, productionrates, royalties, environmental, health and safety protection, fuelspecifications and transportation, trading, pricing, anti-trust, export,taxes and foreign exchange.
The terms and conditions of the leases, licences and contracts underwhich our oil and gas interests are held vary from country to country.These leases, licences and contracts are generally granted by or enteredinto with a government entity or state company and are sometimesentered into with private property owners. These arrangements withgovernmental or state entities usually take the form of licences orproduction-sharing agreements (PSAs). Arrangements with privateproperty owners are usually in the form of leases.
Licences (or concessions) give the holder the right to explore forand exploit a commercial discovery. Under a licence, the holder bears therisk of exploration, development and production activities and providesthe financing for these operations. In principle, the licence holder isentitled to all production, minus any royalties that are payable in kind.A licence holder is generally required to pay production taxes or royalties,which may be in cash or in kind. Less typically, BP may explore for andexploit hydrocarbons under a service agreement with the host entity inexchange for reimbursement of costs and/or a fee paid in cash ratherthan production.
PSAs entered into with a government entity or state companygenerally require BP to provide all the financing and bear the risk ofexploration and production activities in exchange for a share of theproduction remaining after royalties, if any.
In certain countries, separate licences are required for explorationand production activities and, in certain cases, production licences arelimited to a portion of the area covered by the exploration licence. Bothexploration and production licences are generally for a specified period oftime (except for licences in the US, which typically remain in effect untilproduction ceases). The term of BP’s licences and the extent to whichthese licences may be renewed vary by area.
Frequently, BP conducts its exploration and production activitiesin joint ventures with other international oil companies, state companiesor private companies.
In general, BP is required to pay income tax on income generatedfrom production activities (whether under a licence or PSAs). In addition,depending on the area, BP’s production activities may be subject toa range of other taxes, levies and assessments, including specialpetroleum taxes and revenue taxes. The taxes imposed on oil and gasproduction profits and activities may be substantially higher than thoseimposed on other activities, particularly in Abu Dhabi, Angola, Egypt,Norway, the UK, the US, Russia, South America and Trinidad & Tobago.
For a discussion of environmental and certain health and safetyregulations and environmental proceedings, see Environment onpages 43-45. See also Legal proceedings on pages 95-96.
Organizational structureThe significant subsidiaries of the group at 31 December 2009 and thegroup percentage of ordinary share capital (to the nearest whole number)are set out in Financial statements – Note 43 on pages 175-176. SeeFinancial statements – Notes 22 and 23 on pages 140 and 141respectively for information on significant jointly controlled entitiesand associates of the group.
BOL08439_p046 pp60_Bus rev:20 F 5/3/10 17:32 Page 48 Bleed: 0�mm Scale: 100%

49
Business review
Bu
sin
ess r
evie
w
Bu
sin
ess re
vie
w
BOL08439_p046 pp60_Bus rev:20 F 5/3/10 17:32 Page 49 Bleed: 0�mm Scale: 100%
Financial performanceGroup results
The following summarizes the group’s results.$ million except per share amounts
2009 2008 2007
Sales and other operating revenues 239,272 361,143 284,365Profit for the year 16,759 21,666 21,169Profit for the year attributable to BP shareholders 16,578 21,157 20,845Profit attributable to BP shareholders per ordinary share – cents 88.49 112.59 108.76Dividends paid per ordinary share – cents 56.00 55.05 42.30
For a discussion of the business environment in 2007-2009, see Group overview on page 8.
Profit attributable to BP shareholders
Profit attributable to BP shareholders for the year ended 31 December2009 was $16,578 million, including inventory holding gains, net of tax,of $2,623 million and a net charge for non-operating items, after tax, of$1,067 million. In addition, fair value accounting effects had a favourableimpact, net of tax, of $445 million relative to management’s measureof performance. Inventory holding gains and losses, net of tax, aredescribed in footnote (a) below. Further information on non-operatingitems and fair value accounting effects can be found on pages 54-55.
Profit attributable to BP shareholders for the year ended31 December 2008 was $21,157 million, including inventory holdinglosses, net of tax, of $4,436 million and a net charge for non-operatingitems, after tax, of $796 million. In addition, fair value accounting effectshad a favourable impact, net of tax, of $146 million relative tomanagement’s measure of performance. Inventory holdings gains orlosses, net of tax, are described in footnote (a) below.
Profit attributable to BP shareholders for the year ended31 December 2007 was $20,845 million, including inventory holdinggains, net of tax, of $2,475 million and a net charge for non-operatingitems, after tax, of $373 million. In addition, fair value accounting effectshad an unfavourable impact, net of tax, of $198 million relative tomanagement’s measure of performance. Further information on non-operating items and fair value accounting effects can be found onpages 54-55.
The primary additional factors reflected in profit for 2009,compared with 2008, were lower realizations and refining margins andhigher depreciation, partly offset by higher production, strongeroperational performance and lower costs.
The primary additional factors reflected in profit for 2008,compared with 2007, were higher realizations, a higher contribution fromthe gas marketing and trading business, improved oil supply and tradingperformance, improved marketing performance and strong costmanagement; however, these positive effects were partly offset byweaker refining margins, particularly in the US, higher production taxes,higher depreciation, and adverse foreign exchange impacts.
Profits and margins for the group and for individual businesssegments can vary significantly from period to period as a result ofchanges in such factors as oil prices, natural gas prices and refiningmargins. Accordingly, the results for the current and prior periods donot necessarily reflect trends, nor do they provide indicators of resultsfor future periods.
Employee numbers were approximately 80,300 at 31 December2009, 92,000 at 31 December 2008 and 98,100 at 31 December 2007.
a Inventory holding gains and losses represent the difference between the cost of sales calculatedusing the average cost to BP of supplies incurred during the year and the cost of sales calculatedon the first-in first-out (FIFO) method including any changes in provisions where the net realizablevalue of the inventory is lower than its cost. Under the FIFO method, which we use for IFRSreporting, the cost of inventory charged to the income statement is based on the historic cost ofacquisition or manufacture rather than the current replacement cost. In volatile energy markets,this can have a significant distorting effect on reported income. The amounts disclosed representthe difference between the charge to the income statement on a FIFO basis (and any related
movements in net realizable value provisions) and the charge that would arise using average costof supplies incurred during the period. For this purpose, average cost of supplies incurred duringthe period is calculated by dividing the total cost of inventory purchased in the period by thenumber of barrels acquired. The amounts disclosed are not separately reflected in the financialstatements as a gain or loss. No adjustment is made in respect of the cost of inventories held aspart of a trading position and certain other temporary inventory positions.
Management believes this information is useful to illustrate to investors the fact that crudeoil and product prices can vary significantly from period to period and that the impact on ourreported result under IFRS can be significant. Inventory holding gains and losses vary from periodto period due principally to changes in oil prices as well as changes to underlying inventory levels.In order for investors to understand the operating performance of the group excluding the impactof oil price changes on the replacement of inventories, and to make comparisons of operatingperformance between reporting periods, BP’s management believes it is helpful to disclose thisinformation.
Capital expenditure and acquisitions
$ million
2009 2008 2007
Exploration and Production 14,696 22,026 13,904Refining and Marketing 4,114 4,710 4,356Other businesses and corporate 1,191 1,450 934Capital expenditure 20,001 28,186 19,194Acquisitions and asset exchanges 308 2,514 1,447
20,309 30,700 20,641Disposals (2,681) (929) (4,267)Net investment 17,628 29,771 16,374
Capital expenditure and acquisitions in 2009, 2008 and 2007 amountedto $20,309 million, $30,700 million and $20,641 million respectively.In 2008, this included $4,731 million in respect of our transaction withHusky Energy Inc. and $3,667 million in respect of our purchase of all ofChesapeake Energy Corporation’s interest in the Arkoma Basin WoodfordShale assets and the purchase of a 25% interest in Chesapeake’sFayetteville Shale assets. Acquisitions in 2007 included the remaining31% of the Rotterdam (Nerefco) refinery from Chevron’s Netherlandsmanufacturing company.
Excluding acquisitions and asset exchanges, capital expenditurefor 2009 was $20,001 million compared with $28,186 million in 2008 and$19,194 million in 2007.

50
Business review
Finance costs and net finance expense relating to pensions and
other post-retirement benefits
Finance costs comprise interest payable less amounts capitalized, andinterest accretion on provisions and long-term other payables. Financecosts in 2009 were $1,110 million compared with $1,547 million in 2008and $1,393 million in 2007. The decrease in 2009, when compared with2008, is largely attributable to the reduction in interest rates. The increasein 2008, when compared with 2007, is largely the outcome of reductionsin capitalized interest as capital construction projects concluded.
Net finance expense relating to pensions and other post-retirement benefits in 2009 was $192 million compared with net financeincome of $591 million and $652 million in 2008 and 2007 respectively.The expected return on assets decreased significantly in 2009 as thepension asset base reduced, consistent with falls in equity marketsduring 2008.
Taxation
The charge for corporate taxes in 2009 was $8,365 million, comparedwith $12,617 million in 2008 and $10,442 million in 2007. The effectivetax rate was 33% in 2009, 37% in 2008 and 33% in 2007. The groupearns income in many countries and, on average, pays taxes at rateshigher than the UK statutory rate of 28%. The decrease in the effectivetax rate in 2009 compared with 2008 primarily reflects a higherproportion of income from associates and jointly controlled entitieswhere tax is included in the pre-tax operating result, foreign exchangeeffects and changes to the geographical mix of the group’s income.The increase in the effective rate in 2008 compared with 2007 primarilyreflects the change in the country mix of the group’s income, resultingin a higher overall tax burden.
Segment results
Profit before interest and taxation, which is before finance costs, netfinance income or expense, taxation and minority interests, was$26,426 million in 2009, $35,239 million in 2008 and $32,352 millionin 2007.
BOL08439_p046 pp60_Bus rev:20 F 5/3/10 17:32 Page 50 Bleed: 0�mm Scale: 100%
Analysis of replacement cost profit before interest and tax and reconciliation to profit before taxationa
$ million
2009 2008 2007
By businessExploration and Production
US 6,685 11,724 7,929Non-US 18,115 26,584 19,673
24,800 38,308 27,602Refining and Marketing
US (2,578) (644) (1,232)Non-US 3,321 4,820 3,853
743 4,176 2,621Other businesses and corporate
US (728) (902) (960)Non-US (1,594) (321) (249)
(2,322) (1,223) (1,209)23,221 41,261 29,014
Consolidation adjustment (717) 466 (220)Replacement cost profit before interest and taxb 22,504 41,727 28,794Inventory holding gains (losses)
Exploration and Production 142 (393) 127Refining and Marketing 3,774 (6,060) 3,455Other businesses and corporate 6 (35) (24)
Profit before interest and tax 26,426 35,239 32,352Finance costs 1,110 1,547 1,393Net finance expense (income) relating to
pensions and other post-retirement benefits 192 (591) (652)Profit before taxation 25,124 34,283 31,611Replacement cost profit before interest and taxBy geographical area
US 2,806 10,678 5,581Non-US 19,698 31,049 23,213
22,504 41,727 28,794
aIFRS requires that the measure of profit or loss disclosed for each operating segment is the measure that is provided regularly to the chief operating decision maker for the purposes of performanceassessment and resource allocation. For BP, this measure of profit or loss is replacement cost profit before interest and tax. In addition, a reconciliation is required between the total of the operatingsegments’ measures of profit or loss and the group profit or loss before taxation.
bReplacement cost profit reflects the replacement cost of supplies. The replacement cost profit for the period is arrived at by excluding from profit inventory holding gains and losses and their associatedtax effect. Replacement cost profit for the group is not a recognized GAAP measure. Further information on inventory holding gains and losses is provided on page 49.

Business review
Bu
sin
ess r
evie
w
Bu
sin
ess re
vie
w
BOL08439_p046 pp60_Bus rev:20 F 5/3/10 17:32 Page 51 Bleed: 0�mm Scale: 100%
51
Exploration and Production
For the year ended 31 December $ million
2009 2008 2007
Sales and other operating revenuesa 57,626 86,170 65,740Replacement cost profit before interest and taxb 24,800 38,308 27,602
million barrels of oil equivalent
Net proved reserves for subsidiaries 12,621 12,562 12,583Net proved reserves for equity-accounted entities 5,671 5,585 5,231Total of subsidiaries and equity-accounted entities 18,292 18,147 17,814
$ per barrel
Average BP crude oil realizationsc 59.86 95.43 69.98Average BP NGL realizationsc 29.60 52.30 46.20Average BP liquids realizationsc d 56.26 90.20 67.45Average West Texas Intermediate oil price 61.92 100.06 72.20Average Brent oil price 61.67 97.26 72.39
$ per thousand cubic feet
Average BP natural gas realizationsc 3.25 6.00 4.53Average BP US natural gas realizationsc 3.07 6.77 5.43
$ per million British thermal units
Average Henry Hub gas pricee 3.99 9.04 6.86
pence per therm
Average UK National Balancing Point gas price 30.85 58.12 29.95
thousand barrels per day
Total liquids production for subsidiariesd f 1,400 1,263 1,304Total liquids production for equity-accounted entitiesd f 1,135 1,138 1,110Total of subsidiaries and equity-accounted entitiesd f 2,535 2,401 2,414
million cubic feet per day
Natural gas production for subsidiariesf 7,450 7,277 7,222Natural gas production for equity-accounted entitiesf 1,035 1,057 921Total of subsidiaries and equity-accounted entitiesf 8,485 8,334 8,143
thousand barrels of oil equivalent per day
Total production for subsidiariesf g 2,684 2,517 2,549Total production for equity-accounted entitiesf g 1,314 1,321 1,269Total of subsidiaries and equity-accounted entitiesf g 3,998 3,838 3,818
aIncludes sales between businesses.b Includes profit after interest and tax of equity-accounted entities.cRealizations are based on sales of consolidated subsidiaries only, which excludes equity-accounted entities.dCrude oil and natural gas liquids.eHenry Hub First of Month Index.fNet of royalties.gExpressed in thousands of barrels of oil equivalent per day (mboe/d). Natural gas is converted to oil equivalent at 5.8 billion cubic feet = 1 million barrels.

52
Business review
Sales and other operating revenues for 2009 were $58 billion, comparedwith $86 billion in 2008 and $66 billion in 2007. The decrease in 2009primarily reflected lower oil and gas realizations. The increase in 2008compared with 2007 primarily reflected higher oil and gas realizations;gas marketing sales also increased primarily as a result of higher prices.
The replacement cost profit before interest and tax for the yearended 31 December 2009 was $24,800 million. This included a net creditfor non-operating items of $2,265 million (see page 54), with the mostsignificant items being gains on the sale of operations (primarily from thedisposal of our 46% stake in LukArco, the sale of our 49.9% interest inKazakhstan Pipeline Ventures LLC and the sale of BP West Java Limitedin Indonesia) and fair value gains on embedded derivatives. In addition,fair value accounting effects had a favourable impact of $919 millionrelative to management’s measure of performance (see page 55).
The replacement cost profit before interest and tax for the yearended 31 December 2008 was $38,308 million. This included a netcharge for non-operating items of $990 million (see page 54), with themost significant items being net impairment charges and net fair valuelosses on embedded derivatives, partly offset by the reversal of certainprovisions. The impairment charge included a $517 million write-down ofour investment in Rosneft based on its quoted market price at the end ofthe year. In addition, fair value accounting effects had an unfavourableimpact of $282 million relative to management’s measure of performance(see page 55).
The replacement cost profit before interest and tax for the yearended 31 December 2007 was $27,602 million. This included a net creditfrom non-operating items of $491 million (see page 54), with the mostsignificant items being net gains from the sale of assets (primarily fromthe disposal of our production and gas infrastructure in the Netherlands,our interests in non-core Permian assets in the US and our interests inthe Entrada field in the Gulf of Mexico), partly offset by a restructuringcharge and a charge in respect of the reassessment of certain provisions.In addition, fair value accounting effects had a favourable impactof $48 million relative to management’s measure of performance(see page 55).
The primary additional factor contributing to the 35% decrease in thereplacement cost profit before interest and tax for the year ended31 December 2009 compared with the year ended 31 December 2008was lower realizations. In addition, the result was impacted by lowerincome from equity-accounted entities and higher depreciation but theresult benefited from higher production and lower costs, as a result ofour continued focus on cost management.
The primary additional factor contributing to the 39% increase inthe replacement cost profit before interest and tax for the year ended31 December 2008 compared with the year ended 31 December 2007was higher realizations. In addition, the result reflected a highercontribution from the gas marketing and trading business but wasimpacted by higher production taxes and higher depreciation. The impactof inflation within other costs was mitigated by rigorous cost control anda focus on simplification and efficiency.
Reported production for 2009 was 3,998mboe/d (2,684mboe/d forsubsidiaries and 1,314mboe/d for equity-accounted entities) comparedwith 3,838mboe/d in 2008 (2,517mboe/d for subsidiaries and1,321mboe/d for equity-accounted entities), an increase of 4%. Afteradjusting for entitlement impacts in our PSAs and the effect of OPECquota restrictions, the increase was 5%. This reflected continued strongoperational performance and the start-up of seven major projects in2009.
Reported production for 2008 was 3,838mboe/d (2,517mboe/dfor subsidiaries and 1,321mboe/d for equity-accounted entities),compared with 3,818mboe/d in 2007 (2,549mboe/d for subsidiaries and1,269mboe/d for equity-accounted entities). In aggregate, after adjustingfor the effect of lower entitlement in our PSAs, 2008 production was 5%higher than 2007. This reflected strong performance from our existingassets, the continued ramp-up of production following the start-up ofmajor projects in late 2007 and the start-up of nine major projectsin 2008.
Refining and Marketing
abc
d
BOL08439_p046 pp60_Bus rev:20 F 5/3/10 17:32 Page 52 Bleed: 0�mm Scale: 100%
$ million
2009 2008 2007
Sales and other operating revenuesa 213,050 320,039 250,221Replacement cost profit before interest and taxb 743 4,176 2,621
$ per barrel
Global indicator refining margin (GIM)c
Northwest Europe 3.26 6.72 4.99US Gulf Coast 4.63 6.78 13.48Midwest 5.43 5.17 12.81US West Coast 5.88 7.42 15.05Singapore 0.21 6.30 5.29BP average 4.00 6.50 9.94
%
Refining availabilityd 93.6 88.8 82.9
thousand barrels per day
Refinery throughputs 2,287 2,155 2,127
Includes sales between businesses.Includes profit after interest and tax of equity-accounted entities.The global indicator refining margin (GIM) is the average of regional indicator margins weighted for BP’s crude refining capacity in each region. Each regional indicator margin is based on a singlerepresentative crude with product yields characteristic of the typical level of upgrading complexity. The regional indicator margins may not be representative of the margins achieved by BP in any periodbecause of BP’s particular refinery configurations and crude and product slate.Refining availability represents Solomon Associates’ operational availability, which is defined as the percentage of the year that a unit is available for processing after subtracting the annualized time lostdue to turnaround activity and all planned mechanical, process and regulatory maintenance downtime.

53
Business review
Bu
sin
ess r
evie
w
Bu
sin
ess re
vie
w
BOL08439_p046 pp60_Bus rev:20 F 5/3/10 17:32 Page 53 Bleed: 0�mm Scale: 100%
Sales and other operating revenues are explained in more detail below.
$ million
2009 2008 2007
Sale of crude oil through spot and term contracts 35,625 54,901 43,004Marketing, spot and term sales of refined products 166,088 248,561 194,979Other sales and operating revenues 11,337 16,577 12,238
213,050 320,039 250,221
thousand barrels per day
Sale of crude oil through spot and term contracts 1,824 1,689 1,885Marketing, spot and term sales of refined products 5,887 5,698 5,624
Sales and other operating revenues for 2009 were $213 billion, comparedwith $320 billion in 2008 and $250 billion in 2007. The decrease in 2009compared with 2008 primarily reflected a decrease in prices. The increasein 2008 compared with 2007 primarily reflected an increase in revenuesfrom marketing, spot and term sales of refined products, mainly driven byhigher prices. Additionally, revenues from sales of crude oil through spotand term contracts increased as a result of higher prices, partly offset bylower volumes.
The replacement cost profit before interest and tax for the yearended 31 December 2009 was $743 million. This included a net chargefor non-operating items of $2,603 million (see page 54). The mostsignificant non-operating items were restructuring charges and a$1.6 billion one-off, non-cash, loss to impair all the segment’s goodwill inthe US West Coast fuels value chain relating to our 2000 ARCOacquisition. In addition, fair value accounting effects had an unfavourableimpact of $261 million relative to management’s measure of performance(see page 55).
The replacement cost profit before interest and tax for the yearended 31 December 2008 was $4,176 million. This included a net creditfor non-operating items of $347 million (see page 54). The mostsignificant non-operating items were net gains on disposal (primarily inrespect of the gain recognized on the contribution of the Toledo refineryto a joint venture with Husky Energy Inc.) partly offset by restructuringcharges. In addition, fair value accounting effects had a favourable impactof $511 million relative to management’s measure of performance (seepage 55).
The replacement cost profit before interest and tax for the yearended 31 December 2007 was $2,621 million. This included a net chargefor non-operating items of $952 million (see page 54). The mostsignificant non-operating items were net disposal gains (primarily relatedto the sale of BP’s Coryton refinery in the UK, its interest in the WestTexas pipeline system in the US and its interest in the SamsungPetrochemical Company in South Korea), net impairment charges(primarily related to the sale of the majority of our US convenience retailbusiness, a write-down of certain assets at our Hull site in the UK and awrite-down of our retail assets in Mexico) and a charge related to theMarch 2005 Texas City refinery incident. In addition, fair value accountingeffects had an unfavourable impact of $357 million relative tomanagement’s measure of performance (see page 55).
During 2009, our performance was also driven by the significantlyweaker environment, where refining margins fell by almost 40%. Thiswas partly offset by significantly stronger operational performance in thefuels value chains, with 93.6% refining availability; lower costs andimproved performance in the international businesses.
During 2008, significant performance improvements in both our fuelsvalue chains and international businesses mitigated cost inflation and, toa large extent, the much weaker environment. The main sources ofimprovement were from restoring the revenues of our refiningoperations; improved supply and trading performance; improvedmarketing performance, particularly from the international businesses,and reduced costs. The cost reductions were driven by the simplificationof our business structure through the establishment of fuels value chainsand a reduction in our geographical footprint, as well as by strong costmanagement. The most significant environmental factor was the weakerrefining environment compared with 2007, particularly due to lowerrefining margins in the US and the adverse impact in the second half of2008 of prior-month pricing of domestic pipeline barrels for our USrefining system, but there were also adverse foreign exchange effects.
Refining throughputs in 2009 were 2,287mb/d, 132mb/d higherthan in 2008. Refining availability was 93.6%, 4.8 percentage pointshigher than in 2008, the increase being driven primarily by the restorationof availability at our Texas City refinery. Marketing volumes at 3,560mb/dwere around 4.1% lower than in 2008.
Other businesses and corporate
$ million
2009 2008 2007
Sales and other operating revenuesa 2,843 4,634 3,698Replacement cost profit (loss) before
interest and taxb (2,322) (1,223) (1,209)
a Includes sales between businesses.b Includes profit after interest and tax of equity-accounted entities.
Other businesses and corporate comprises the Alternative Energybusiness, Shipping, the group’s aluminium asset, Treasury (whichincludes interest income on the group’s cash, cash equivalents), andcorporate activities worldwide.
The replacement cost loss before interest and tax for the yearended 31 December 2009 was $2,322 million and included a net chargefor non-operating items of $489 million (see page 54).
The primary additional factors affecting 2009’s result comparedwith that of 2008 were a weaker margin environment for Shipping andour BP Solar business and adverse foreign exchange effects.
The replacement cost loss before interest and tax for the yearended 31 December 2008 was $1,223 million and included a net chargefor non-operating items of $633 million (see page 54).
The replacement cost loss before interest and tax for the yearended 31 December 2007 was $1,209 million and included a net chargefor non-operating items of $262 million (see page 54).

Business review
BOL08439_p046 pp60_Bus rev:20 F 5/3/10 17:32 Page 54 Bleed: 0�mm Scale: 100%
54
Non-operating items
Non-operating items are charges and credits arising in consolidatedentities that BP discloses separately because it considers suchdisclosures to be meaningful and relevant to investors. The maincategories of non-operating items in the periods presented are:impairments; gains or losses on sale of fixed assets and the sale of
businesses; environmental remediation costs; restructuring, integrationand rationalization costs; and changes in the fair value of embeddedderivatives. These disclosures are provided in order to enable investorsbetter to understand and evaluate the group’s financial performance.These items are not separately recognized under IFRS. An analysis ofnon-operating items is shown in the table below.
$ million
2009 2008 2007
Exploration and Production
Impairment and gain (loss) on sale of businesses and fixed assets 1,574 (1,015) 857Environmental and other provisions 3 (12) (12)Restructuring, integration and rationalization costs (10) (57) (186)Fair value gain (loss) on embedded derivatives 664 (163) –Other 34 257 (168)
2,265 (990) 491Refining and Marketing
Impairment and gain (loss) on sale of businesses and fixed assetsa (1,604) 801 (35)Environmental and other provisions (219) (64) (138)Restructuring, integration and rationalization costs (907) (447) (118)Fair value gain (loss) on embedded derivatives (57) 57 –Other 184 – (661)
(2,603) 347 (952)Other businesses and corporate
Impairment and gain (loss) on sale of businesses and fixed assets (130) (166) (14)Environmental and other provisions (75) (117) (35)Restructuring, integration and rationalization costs (183) (254) (34)Fair value gain (loss) on embedded derivatives – (5) (7)Other (101) (91) (172)
(489) (633) (262)Total before taxation (827) (1,276) (723)Taxation credit (charge)b (240) 480 350Total after taxation (1,067) (796) (373)
a Includes $1,579 million in relation to the impairment of goodwill allocated to the US West Coast fuels value chain.b The amounts shown for taxation are based upon the effective tax rate on group profit. In 2009, no tax credit has been calculated on the goodwill impairment in Refining and Marketing because the
charge is not tax deductible.

Business review
Bu
sin
ess r
evie
w
Bu
sin
ess re
vie
w
BOL08439_p046 pp60_Bus rev:20 F 5/3/10 17:32 Page 55 Bleed: 0�mm Scale: 100%
55
Non-GAAP information on fair value accounting effects
BP uses derivative instruments to manage the economic exposurerelating to inventories above normal operating requirements of crude oil,natural gas and petroleum products as well as certain contracts to supplyphysical volumes at future dates. Under IFRS, these inventories andcontracts are recorded at historic cost and on an accruals basisrespectively. The related derivative instruments, however, are required tobe recorded at fair value with gains and losses recognized in incomebecause hedge accounting is either not permitted or not followed,principally due to the impracticality of effectiveness testing requirements.Therefore, measurement differences in relation to recognition of gainsand losses occur. Gains and losses on these inventories and contractsare not recognized until the commodity is sold in a subsequentaccounting period. Gains and losses on the related derivative commoditycontracts are recognized in the income statement from the time thederivative commodity contract is entered into on a fair value basis usingforward prices consistent with the contract maturity.
IFRS requires that inventory held for trading be recorded at its fairvalue using period end spot prices whereas any related derivativecommodity instruments are required to be recorded at values based onforward prices consistent with the contract maturity. Depending onmarket conditions, these forward prices can be either higher or lowerthan spot prices resulting in measurement differences.
BP enters into contracts for pipelines and storage capacity that, underIFRS, are recorded on an accruals basis. These contracts are risk-managed using a variety of derivative instruments which are fair valuedunder IFRS. This results in measurement differences in relation torecognition of gains and losses.
The way that BP manages the economic exposures describedabove, and measures performance internally, differs from the way theseactivities are measured under IFRS. BP calculates this difference forconsolidated entities by comparing the IFRS result with management’sinternal measure of performance, under which the inventory and thesupply and capacity contracts in question are valued based on fair valueusing relevant forward prices prevailing at the end of the period. Webelieve that disclosing management’s estimate of this differenceprovides useful information for investors because it enables investors tosee the economic effect of these activities as a whole. The impacts of fairvalue accounting effects, relative to management’s internal measure ofperformance, are shown in the table below. A reconciliation to GAAPinformation is set out below.
$ million
2009 2008 2007
Exploration and Production
Unrecognized gains (losses) brought forward from previous period 389 107 155Unrecognized (gains) losses carried forward 530 (389) (107)Favourable (unfavourable) impact relative to management’s measure of performance 919 (282) 48Refining and Marketing
Unrecognized gains (losses) brought forward from previous period (82) 429 72Unrecognized (gains) losses carried forward (179) 82 (429)Favourable (unfavourable) impact relative to management’s measure of performance (261) 511 (357)
658 229 (309)Taxation credit (charge)a (213) (83) 111
445 146 (198)By region
Exploration and Production
US 687 (231) (77)Non-US 232 (51) 125
919 (282) 48Refining and Marketing
US 16 231 (165)Non-US (277) 280 (192)
(261) 511 (357)
a The amounts shown for taxation are based upon the effective tax rate on group profit.
Reconciliation of non-GAAP information
$ million
2009 2008 2007
Exploration and Production
Replacement cost profit before interest and tax adjusted for fair value accounting effects 23,881 38,590 27,554Impact of fair value accounting effects 919 (282) 48Replacement cost profit before interest and tax 24,800 38,308 27,602Refining and Marketing
Replacement cost profit before interest and tax adjusted for fair value accounting effects 1,004 3,665 2,978Impact of fair value accounting effects (261) 511 (357)Replacement cost profit before interest and tax 743 4,176 2,621

56
Business review
BOL08439_p046 pp60_Bus rev:20 F 5/3/10 17:32 Page 56 Bleed: 0�mm Scale: 100%
Environmental expenditure
$ million
2009 2008 2007
Operating expenditure 701 755 662Clean-ups 70 64 62Capital expenditure 955 1,104 1,033Additions to environmental remediation provision 588 270 373Additions to decommissioning provision 169 327 1,163
Operating and capital expenditure on the prevention, control, abatementor elimination of air, water and solid waste pollution is often not incurredas a separately identifiable transaction. Instead, it may form part of alarger transaction that includes, for example, normal maintenanceexpenditure. The figures for environmental operating and capitalexpenditure in the table are therefore estimates, based on the definitionsand guidelines of the American Petroleum Institute.
Environmental operating expenditure of $701 million in 2009was lower than in 2008, due to a reduction in new projects undertaken.In addition, there was a significant reduction in the sulphur oil premiumpaid due to a greater use of low-sulphur fuel.
Environmental operating expenditure of $755 million in 2008 washigher than in 2007 and reflected continuing integrity managementactivity. There were no individually significant factors driving the increase.
Similar levels of operating and capital expenditures are expectedin the foreseeable future. In addition to operating and capitalexpenditures, we also create provisions for future environmentalremediation. Expenditure against such provisions normally occurs insubsequent periods and is not included in environmental operatingexpenditure reported for such periods. The charge for environmentalremediation provisions in 2009 included $582 million resulting from areassessment of existing site obligations and $6 million in respect ofprovisions for new sites.
Provisions for environmental remediation are recognized whena clean-up is probable and the amount of the obligation can be reliablyestimated. Generally, this coincides with the commitment to a formalplan of action or, if earlier, on divestment or on closure of inactive sites.
The extent and cost of future environmental restoration, remediation andabatement programmes are inherently difficult to estimate. They oftendepend on the extent of contamination, and the associated impact andtiming of the corrective actions required, technological feasibility andBP’s share of liability. Though the costs of future programmes could besignificant and may be material to the results of operations in the periodin which they are recognized, it is not expected that such costs will bematerial to the group’s overall results of operations or financial position.
In addition, we recognize provisions on installation of our oil- andgas-producing assets and related pipelines to meet the cost of eventualdecommissioning. On installation of an oil or natural gas productionfacility a provision is established that represents the discounted value ofthe expected future cost of decommissioning the asset. Additionally, weundertake periodic reviews of existing provisions. These reviews takeaccount of revised cost assumptions, changes in decommissioningrequirements and any technological developments. The level of increasein the decommissioning provision varies with the number of new fieldscoming onstream in a particular year and the outcome of the periodicreviews.
Provisions for environmental remediation and decommissioningare usually recognized on a discounted basis, as required by IAS 37‘Provisions, Contingent Liabilities and Contingent Assets’.
Further details of decommissioning and environmental provisionsappear in Financial statements – Note 34 on page 158. See alsoEnvironment on pages 43-45.

57
Business review
Bu
sin
ess r
evie
w
Bu
sin
ess re
vie
w
BOL08439_p046 pp60_Bus rev:20 F 5/3/10 17:32 Page 57 Bleed: 0�mm Scale: 100%
Liquidity and capital resourcesCash flow
The following table summarizes the group’s cash flows.
$ million
2009 2008 2007
Net cash provided by operating activities 27,716 38,095 24,709Net cash used in investing activities (18,133) (22,767) (14,837)Net cash used in financing activities (9,551) (10,509) (9,035)Currency translation differences relating to cash and cash equivalents 110 (184) 135Increase (decrease) in cash and cash equivalents 142 4,635 972Cash and cash equivalents at beginning of year 8,197 3,562 2,590Cash and cash equivalents at end of year 8,339 8,197 3,562
Net cash provided by operating activities for the year ended31 December 2009 was $27,716 million compared with $38,095 millionfor 2008 reflecting a decrease in profit before taxation of $9,159 million,an increase in working capital requirements of $8,944 million and adecrease in dividends from jointly controlled entities and associates of$725 million; these were partly offset by a decrease in income taxespaid of $6,500 million, higher depreciation, depletion, amortization andimpairment charges of $1,329 million and an increase in charges forprovisions of $948 million.
Net cash provided by operating activities for the year ended31 December 2008 was $38,095 million compared with $24,709 millionfor 2007 reflecting a decrease in working capital requirements of$11,250 million, an increase in profit before taxation of $2,672 million andan increase in dividends from jointly controlled entities and associates of$1,255 million; these were partly offset by an increase in income taxespaid of $3,752 million.
Net cash used in investing activities was $18,133 million in 2009,compared with $22,767 million and $14,837 million in 2008 and 2007respectively. The decrease in 2009 reflected a decrease in capitalexpenditure and acquisitions of $2,356 million and an increase in disposalproceeds of $1,752 million. The increase in 2008 reflected a reduction indisposal proceeds of $3,338 million and an increase in capital expenditureof $5,303 million.
Net cash used in financing activities was $9,551 million in 2009compared with $10,509 million in 2008 and $9,035 million in 2007. Thedecrease in 2009 reflects a $2,774 million decrease in the net repurchaseof shares and an increase in net proceeds from long-term financing of$1,406 million; these were partly offset by an increase in net repaymentsof short-term debt of $3,090 million. The increase in 2008 reflects adecrease in short-term debt of $2,809 million and an increase individends paid of $2,434 million; these were partly offset by a$4,546 million decrease in the net repurchase of shares.
The group has had significant levels of capital investment formany years. Cash flow in respect of capital investment, excludingacquisitions, was $21.4 billion in 2009, $23.7 billion in 2008 and$18.4 billion in 2007. Sources of funding are completely fungible, but themajority of the group’s funding requirements for new investment comefrom cash generated by existing operations. The group’s level of net debt,that is debt less cash and cash equivalents, was $26.2 billion at the endof 2009, $25.0 billion at the end of 2008 and was $26.8 billion at the endof 2007.
During the period 2007 to 2009, our total sources of cash amountedto $100 billion, whilst our total uses of cash amounted to $105 billion.The net cash usage of $5 billion was financed by an increase in financedebt of $11 billion over the three-year period, offset by an increase in ourbalance of cash and cash equivalents of $6 billion. During this period,the price of Brent has averaged $77.11 per barrel. The following tablesummarizes the three-year sources and uses of cash.
$ billion
Sources of cash
Net cash provided by operating activities 91Divestments 9
100Uses of cash
Capital expenditure 64Acquisitions 2Net repurchase of shares 9Dividends to BP shareholders 29Dividends to minority interests 1
105Net use of cash (5)Financed by
Increase in finance debt (11)Increase in cash and cash equivalents 6
(5)
Acquisitions made for cash were more than offset by divestmentproceeds received during the three-year period. Net investment duringthe same period averaged $19 billion per year. Dividends to BPshareholders, which grew on average by 14% per year in dollar terms,used $29 billion. Net repurchase of shares was $9 billion, which included$11 billion in respect of our share buyback programme less net proceedsfrom shares issued in connection with employee share schemes. Finally,cash was used to strengthen the financial condition of certain of ourpension plans. In the past three years, $2 billion has been contributed tofunded pension plans. This is reflected in net cash provided by operatingactivities in the table above.

58
Business review
Trend information
In the US and the major economies of Europe, we expect recovery fromthe recession to be slow and gradual. The oil markets look well supportedby OPEC, but we expect gas markets to remain volatile. Demand forpetrochemicals products is recovering only slowly, and there is significantrefining over-capacity particularly in the Atlantic Basin. As a consequence,refining margins are likely to remain depressed for the foreseeable future.
In Exploration and Production, production growth was very strongin 2009, benefiting by about 40mboe/d on an annual basis from acombination of the absence of a significant hurricane season and themake-up of a prior-period underlift. As a result, we expect production in2010 to be slightly lower than in 2009.
In Refining and Marketing, we expect refining margins to remainweak in 2010.
We expect the quarterly loss in Other businesses and corporate,excluding non-operating items, to average around $400 million in 2010. Thiswill, as in previous years, remain volatile on an individual quarterly basis.
We expect capital expenditure, excluding acquisitions and assetexchanges, to be around $20 billion in 2010, and we expect divestmentsto be between $2 and $3 billion.
In 2009 the cash inflows and outflows of the group were broadlyin balance despite much weaker than expected refining margins andNorth American gas prices. Looking forward we expect to be able tocontinue to balance cash inflows and outflows even if conditions areequally challenging.
Dividends and other distributions to shareholders
The total dividend paid to BP shareholders in 2009 was $10,483 million,compared with $10,342 million for 2008. The dividend paid per share was56 cents, an increase of 2% compared with 2008. In sterling terms, thedividend increased 24% due to the strengthening of the dollar relative tosterling. We determine the dividend in US dollars, the economic currencyof BP.
During 2009, the company did not repurchase any of its ownshares.
Our aim is to strike the right balance for shareholders, betweencurrent returns via the dividend, sustained investment for long-termgrowth, and maintaining a prudent gearing level. At the beginning of2008, we rebalanced our distributions away from share buybacks infavour of dividends.
Subject to shareholder approval at the Annual General Meeting on15 April, an optional scrip dividend programme, allowing shareholders tochoose to receive dividends in the form of new fully paid ordinary sharesin BP p.l.c. instead of cash, will be available for future dividends. Thiswould replace the company’s current dividend reinvestment plans.
The discussion above and following contains forward-lookingstatements particularly those regarding global economic recovery andoutlook for oil and gas markets, oil and gas prices, refining margins,production, demand for petrochemicals products, underlying averagequarterly loss from Other businesses and corporate, effective tax rate,operating and capital expenditure, timing and proceeds of divestments,contractual commitments, balance of cash inflows and outflows anddividend and optional scrip dividend. These forward-looking statementsare based on assumptions that management believes to be reasonablein the light of the group’s operational and financial experience. However,no assurance can be given that the forward-looking statements will berealized. You are urged to read the cautionary statement under ‘Forward-looking statements’ on page 17 and ‘Risk factors’ on pages 14-16, whichdescribe the risks and uncertainties that may cause actual results anddevelopments to differ materially from those expressed or impliedby these forward-looking statements. The company provides nocommitment to update the forward-looking statements or to publishfinancial projections for forward-looking statements in the future.
Financing the group’s activities
The group’s principal commodity, oil, is priced internationally in USdollars. Group policy has been to minimize economic exposure tocurrency movements by financing operations with US dollar debtwherever possible, otherwise by using currency swaps when fundshave been raised in currencies other than US dollars.
The group’s finance debt is almost entirely in US dollars and at31 December 2009 amounted to $34,627 million (2008 $33,204 million)of which $9,109 million (2008 $15,740 million) was short term.
Net debt was $26,161 million at the end of 2009, an increase of$1,120 million compared with 2008. We believe that a net debt ratio, thatis net debt to net debt plus equity, of 20-30% provides an efficient capitalstructure and the appropriate level of financial flexibility. The net debt ratiowas 20% at the end of 2009 and 21% at the end of 2008, the lower endof our target band. Net debt, which BP uses as a measure of financialgearing, includes the fair value of associated derivative financialinstruments that are used to hedge foreign exchange and interest raterisks relating to finance debt, for which hedge accounting is claimed.
The maturity profile and fixed/floating rate characteristics of thegroup’s debt are described in Financial statements – Note 24 onpage 142 and Note 32 on page 156.
We have in place a European Debt Issuance Programme (DIP)under which the group may raise $20 billion of debt for maturities ofone month or longer. At 31 December 2009, the amount drawn downagainst the DIP was $11,403 million (2008 $10,334 million).
In addition, the group has in place an unlimited US ShelfRegistration under which it may raise debt with maturities of one monthor longer.
Commercial paper markets in the US and Europe are a primarysource of liquidity for the group. At 31 December 2009, the outstandingcommercial paper amounted to $398 million (2008 $4,268 million).
The group also has access to significant sources of liquidity inthe form of committed facilities and other funding through the capitalmarkets. At 31 December 2009, the group had available undrawncommitted borrowing facilities of $4,950 million (2008 $4,950 million).
BP believes that, taking into account the substantial amounts ofundrawn borrowing facilities available, the group has sufficient workingcapital for foreseeable requirements.
Off-balance sheet arrangements
At 31 December 2009, the group’s share of third-party finance debt ofequity-accounted entities was $6,483 million (2008 $6,675 million). Theseamounts are not reflected in the group’s debt on the balance sheet.
The group has issued third-party guarantees under whichamounts outstanding at 31 December 2009 are $319 million (2008 $223million) in respect of liabilities of jointly controlled entities and associatesand $667 million (2008 $613 million) in respect of liabilities of other thirdparties. Of these amounts, $286 million (2008 $215 million) of the jointlycontrolled entities and associates guarantees relate to borrowings and forother third-party guarantees, $633 million (2008 $582 million) relates toguarantees of borrowings.
BOL08439_p046 pp60_Bus rev:20 F 5/3/10 17:32 Page 58 Bleed: 0�mm Scale: 100%

Business review
Bu
sin
ess r
evie
w
Bu
sin
ess re
vie
w
BOL08439_p046 pp60_Bus rev:20 F 5/3/10 17:32 Page 59 Bleed: 0�mm Scale: 100%
59
Contractual commitments
The following table summarizes the group’s principal contractual obligations at 31 December 2009. Further information on borrowings and financeleases is given in Financial statements – Note 32 on page 156 and more information on operating leases is given in Financial statements – Note 12 onpage 132.
$ million
Payments due by period
Expected payments by period under contractual 2015 andobligations and commercial commitments Total 2010 2011 2012 2013 2014 thereafter
Borrowingsa 36,717 9,681 6,740 5,282 5,463 3,085 6,466Finance lease future minimum lease payments 845 109 121 77 65 66 407Operating leasesb 14,716 3,251 2,513 1,977 1,604 1,240 4,131Decommissioning liabilities 13,261 364 261 356 428 389 11,463Environmental liabilities 1,860 385 256 193 152 117 757Pensions and other post-retirement benefitsc 26,855 1,647 1,890 1,887 1,884 1,491 18,056Unconditional purchase obligationsd 155,356 92,536 16,189 10,420 6,677 5,350 24,184Total 249,610 107,973 27,970 20,192 16,273 11,738 65,464
aExpected payments include interest payments on borrowings totalling $2,679 million ($662 million in 2010, $508 million in 2011, $379 million in 2012, $262 million in 2013, $168 million in 2014 and$700 million thereafter).
b The future minimum lease payments are before deducting related rental income from operating sub-leases. In the case of an operating lease entered into solely by BP as the operator of a jointlycontrolled asset, the amounts shown in the table represent the net future minimum lease payments, after deducting amounts reimbursed, or to be reimbursed, by joint venture partners. Where BP is notthe operator of a jointly controlled asset BP’s share of the future minimum lease payments are included in the amounts shown, whether BP has co-signed the lease or not. Where operating lease costsare incurred in relation to the hire of equipment used in connection with a capital project, some or all of the cost may be capitalized as part of the capital cost of the project.
cRepresents the expected future contributions to funded pension plans and payments by the group for unfunded pension plans and the expected future payments for other post-retirement benefits.dRepresents any agreement to purchase goods or services that is enforceable and legally binding and that specifies all significant terms. The amounts shown include arrangements to secure long-term
access to supplies of crude oil, natural gas, feedstocks and pipeline systems. In addition, the amounts shown for 2010 include purchase commitments existing at 31 December 2009 entered intoprincipally to meet the group’s short-term manufacturing and marketing requirements. The price risk associated with these crude oil, natural gas and power contracts is discussed in Financial statements– Note 24 on page 142.
The following table summarizes the nature of the group’s unconditional purchase obligations.
$ million
Payments due by period
2015 andUnconditional purchase obligations Total 2010 2011 2012 2013 2014 thereafter
Crude oil and oil products 80,991 62,794 6,352 3,894 1,787 1,001 5,163Natural gas 41,680 21,038 5,598 3,150 2,386 1,957 7,551Chemicals and other refinery feedstocks 10,939 2,909 1,521 1,183 849 824 3,653Power 3,846 2,969 591 236 36 14 –Utilities 718 112 111 93 69 59 274Transportation 8,923 1,005 858 806 766 723 4,765Use of facilities and services 8,259 1,709 1,158 1,058 784 772 2,778Total 155,356 92,536 16,189 10,420 6,677 5,350 24,184
The group expects its total capital expenditure, excluding acquisitions and asset exchanges, to be around $20 billion in 2010. The following tablesummarizes the group’s capital expenditure commitments for property, plant and equipment at 31 December 2009 and the proportion of thatexpenditure for which contracts have been placed. Capital expenditure is considered to be committed when the project has received the appropriatelevel of internal management approval. For jointly controlled assets, the net BP share is included in the amounts shown. Where operating lease costsare incurred in connection with a capital project, some or all of the cost may be capitalized as part of the capital cost of the project. Such costs areincluded in the amounts shown.
$ million
2015 andCapital expenditure commitments Total 2010 2011 2012 2013 2014 thereafter
Committed on major projects 29,451 13,406 7,071 3,091 1,624 1,618 2,641Amounts for which contracts have been placed 9,812 6,611 1,713 748 320 195 225
In addition, at 31 December 2009, the group had committed to capital expenditure relating to investments in equity-accounted entities amounting to$1,038 million. Contracts were in place for $792 million of this total.

60
BOL08439_p046 pp60_Bus rev:20 F 5/3/10 17:32 Page 60 Bleed: 0�mm Scale: 100%
Board performanceand biographies
62 Directors andsenior management
65 Board performance report
Bo
ard
perfo
rman
ce a
nd
bio
gra
ph
ies
BOL08439_p061 pp64_Directors:20 F 5/3/10 17:32 Page 61 Bleed: 0�mm Scale: 100%

62
Directors and senior management
Board performance and biographies
BOL08439_p061 pp64_Directors:20 F 5/3/10 17:32 Page 62 Bleed: 0�mm Scale: 100%
The following lists the company’s directors and senior management as at 18 February 2010.Name Initially elected or appointed
C-H Svanberg Chairman Chairman since January 2010Director since September 2009
Sir Ian Prosser Non-Executive Deputy Chairman Deputy chairman since February 1999Director since May 1997
P Anderson Non-Executive Director February 2010A Burgmans Non-Executive Director February 2004C B Carroll Non-Executive Director June 2007Sir William Castell Non-Executive Director July 2006G David Non-Executive Director February 2008E B Davis, Jr Non-Executive Director December 1998D J Flint Non-Executive Director January 2005Dr D S Julius Non-Executive Director November 2001Dr A B Hayward Executive Director (Group Chief Executive) Group Chief Executive since May 2007
Director since February 2003I C Conn Executive Director (Chief Executive, Refining and Marketing) July 2004R W Dudley Executive Director (Managing Director) April 2009Dr B E Grote Executive Director (Chief Financial Officer) August 2000A G Inglis Executive Director (Chief Executive, Exploration and Production) February 2007R Bondy Group General Counsel May 2008S Bott Executive Vice President, Human Resources March 2005H L McKay Executive Vice President (Chairman and President of BP America Inc.) June 2008S Westwell Executive Vice President (Group Chief of Staff) January 2008
Mr C-H Svanberg was appointed as a director and chairman designate on 1 September 2009 and appointed chairman on 1 January 2010 on theretirement of Mr P D Sutherland. Mr P Anderson was appointed as a director on 1 February 2010. Sir Tom McKillop resigned as a director on 16 April2009.
At the company’s 2009 annual general meeting (AGM), the following directors retired, offered themselves for election/re-election and were dulyelected/re-elected: Mr A Burgmans; Mrs C B Carroll; Sir William Castell; Mr I C Conn; Mr G David; Mr E B Davis, Jr; Mr R W Dudley; Mr D J Flint;Dr B E Grote; Dr A B Hayward; Mr A G Inglis; Dr D S Julius; Sir Ian Prosser and Mr P D Sutherland.
Mr I E L Davis has been appointed as a director with effect from 2 April 2010. All of the directors, including Mr Davis, will offer themselves forelection/re-election at the company’s 2010 AGM.
David Jackson (57) was appointed company secretary in 2003. A solicitor, he is a director of BP Pension Trustees Limited and a member of the ListingAuthorities Advisory Committee.

63
Bo
ard
perfo
rman
ce a
nd
bio
gra
ph
ies
Directors
C-H SvanbergChairman of the chairman’s and the nomination committees and attendsmeetings of the remuneration committeeCarl-Henric Svanberg (57) was appointed a non-executive director of BPon 1 September 2009 and, in succession to Mr Sutherland, becamechairman of BP on 1 January 2010. From 2003 until 31 December 2009,he was president and chief executive officer of Ericsson, also serving asthe chairman of Sony Ericsson Mobile Communications AB. He continuesto be a non-executive director of Ericsson.
Sir Ian ProsserMember of the chairman’s, the nomination and the remunerationcommittees and chairman of the audit committeeSir Ian (66) joined BP’s board in 1997 and was appointed non-executivedeputy chairman in 1999. He is the senior independent director. In 2003,he retired as chairman of InterContinental Hotels Group PLC, a spin-offfrom the former Bass PLC where he was chief executive. He is a non-executive director of the Sara Lee Corporation and non-executivechairman of The Navy, Army and Air Force Institutes (NAAFI). He waspreviously on the boards of GlaxoSmithKline plc, The Boots CompanyPLC and Lloyds TSB PLC.
P AndersonMember of the chairman’s and the safety, ethics and environmentassurance committeesPaul Anderson (64) was appointed a non-executive director of BP on1 February 2010. He is a non-executive director of BAE Systems PLC andof Spectra Energy Corp. He was formerly chief executive at BHP Billitonand Duke Energy where he also served as a non-executive director.Having previously been chief executive officer and managing director ofBHP Limited and then BHP Billiton Limited and BHP Billiton Plc, herejoined these latter boards in 2006 as a non-executive director, retiringon 31 January 2010.
A Burgmans, KBEMember of the chairman’s, the remuneration and the safety, ethics andenvironment assurance committeesAntony Burgmans (63) joined BP’s board in 2004. He was appointed tothe board of Unilever in 1991. In 1999, he became chairman of UnileverNV and vice chairman of Unilever PLC. In 2005, he became non-executivechairman of Unilever PLC and Unilever NV, retiring from theseappointments in 2007. He is also a member of the supervisory boards ofAkzo Nobel NV, Aegon NV and SHV Holdings NV.
C B CarrollMember of the chairman’s and the safety, ethics and environmentassurance committeesCynthia Carroll (53) joined BP’s board in 2007. She started her career atAmoco and in 1989 she joined Alcan, where in 2002 she was appointedpresident and chief executive officer of Alcan’s primary metals group andan officer of Alcan, Inc. She was appointed as chief executive of AngloAmerican plc, the global mining group, in 2007. She is also a director ofDe Beers s.a. and Anglo Platinum Ltd.
Sir William Castell, LVOMember of the chairman’s and the nomination committees and chairmanof the safety, ethics and environment assurance committeeSir William (62) joined BP’s board in 2006. From 1990 to 2004, he waschief executive of Amersham plc and subsequently president and chiefexecutive officer of GE Healthcare. He was appointed as a vice chairmanof the board of GE in 2004, stepping down from this post in 2006 whenhe became chairman of the Wellcome Trust. He remains a non-executivedirector of GE.
G DavidMember of the chairman’s, the audit and the remuneration committeesGeorge David (67) joined BP’s board in February 2008. He has spent his career with United Technologies Corporation (UTC), as its chiefexecutive officer between 1994 and 2008 and chairman from 1997 until his retirement on 31 December 2009. He is a former director ofCitigroup Inc.
E B Davis, JrMember of the chairman’s, the audit and the safety, ethics andenvironment assurance committeesErroll B Davis, Jr (65) joined BP’s board in 1998, having previously been adirector of Amoco. He was chairman and chief executive officer of AlliantEnergy, relinquishing this dual appointment in 2005. He continued aschairman of Alliant Energy until 2006, leaving to become chancellor of theUniversity System of Georgia. He is a member of the board of GeneralMotors Corporation and Union Pacific Corporation.
D J Flint, CBEMember of the chairman’s and the audit committeesDouglas Flint (54) joined BP’s board in 2005. He trained as a charteredaccountant and was made a partner at KPMG in 1988. In 1995, he wasappointed group finance director of HSBC Holdings plc and in 2009 hisrole was broadened to chief financial officer, executive director risk andregulation. He was chairman of the Financial Reporting Council’s reviewof the Turnbull Guidance on Internal Control. Between 2001 and 2004, heserved on the Accounting Standards Board and the Standards AdvisoryCouncil of the International Accounting Standards Board.
Dr D S Julius, CBEMember of the chairman’s and the nomination committees and chairmanof the remuneration committeeDeAnne Julius (60) joined BP’s board in 2001. She began her career as aproject economist with the World Bank in Washington. From 1986 until1997, she held a succession of posts, including chief economist at BritishAirways and Royal Dutch Shell Group. From 1997 to 2001, she was a fulltime member of the Monetary Policy Committee of the Bank of England.She is chairman of the Royal Institute of International Affairs and a non-executive director of Roche Holdings SA and Jones Lang LaSalle, Inc.
Dr A B HaywardTony Hayward (52) joined BP in 1982. He held a series of roles inexploration and production, becoming a director of exploration andproduction in 1997. In 2000, he was made group treasurer, and anexecutive vice president in 2002. He was chief executive officer ofexploration and production between 2002 and 2007. He became anexecutive director of BP in 2003 and was appointed as group chiefexecutive in 2007.
I C ConnIain Conn (47) joined BP in 1986. Following a variety of roles in oil trading,commercial refining, retail and commercial marketing operations, andexploration and production, in 2000 he became group vice president ofBP’s refining and marketing business. From 2002 to 2004, he was chiefexecutive of petrochemicals. He was appointed group executive officerwith a range of regional and functional responsibilities and an executivedirector in 2004. He was appointed chief executive of refining andmarketing in 2007. He is a non-executive director and senior independentdirector of Rolls-Royce Group plc.
Board performance and biographies
BOL08439_p061 pp64_Directors:20 F 5/3/10 17:32 Page 63 Bleed: 0�mm Scale: 100%

64
R W DudleyRobert Dudley (54) joined the Amoco Corporation in 1979 for whom heworked until its merger with BP in 1998. Following a variety of posts inthe US, the UK, the South China Sea and Moscow, in 2001 he becamegroup vice president responsible for BP’s upstream businesses in Russia,the Caspian Region, Angola, Algeria and Egypt. From 2003 to 2008,Mr Dudley was president and chief executive officer of TNK-BP inMoscow. He was appointed an executive director on 6 April 2009 and isan executive vice president with responsibility for broad oversight of thecompany’s activities in the Americas and Asia.
Dr B E GroteByron Grote (61) joined BP in 1987 following the acquisition of TheStandard Oil Company of Ohio, where he had worked since 1979. He became group treasurer in 1992 and in 1994 regional chief executivein Latin America. In 1999, he was appointed an executive vice presidentof exploration and production, and chief executive of chemicals in 2000.He was appointed an executive director of BP in 2000 and chief financialofficer in 2002. He is a non-executive director of Unilever NV andUnilever PLC.
A G InglisAndy Inglis (50) joined BP in 1980, working on various North Seaprojects. Following a series of commercial roles in exploration, in 1996,he became chief of staff, exploration and production. From 1997 until1999, he was responsible for leading BP’s activities in the deepwater Gulfof Mexico. In 1999, he was appointed vice president of BP’s US westerngas business unit. In 2004, he became executive vice president anddeputy chief executive of exploration and production. He was appointedchief executive of BP’s exploration and production business and anexecutive director in 2007. He is a non-executive director of BAESystems plc.
Senior management
R BondyRupert Bondy (48) joined BP as group general counsel in May 2008. In 1989, he joined US law firm Morrison & Foerster, working in SanFrancisco and London. From 1994 to 1995, he worked for UK law firmLovells in London. In 1995, he joined SmithKline Beecham as seniorcounsel for mergers and acquisitions and other corporate matters. Hesubsequently held positions of increasing responsibility and following themerger of SmithKline Beecham and GlaxoWellcome he was appointedsenior vice president and general counsel of GlaxoSmithKline in 2001.
S BottSally Bott (60) joined BP in 2005 as an executive vice presidentresponsible for global human resources. Sally joined Citibank in 1970 andwas in the economics department and the finance function before joininghuman resources. She was appointed human resources vice president in1979. In 1994, she joined Barclays De Zoete Wedd, an investment bank,as head of human resources and in 1997 became group humanresources director of Barclays plc. From 2000 to early 2005, she wasmanaging director of Marsh and McLennan and head of global humanresources at Marsh Inc. In 2008, Sally was elected as a non-executivedirector of UBS AG.
H L McKayLamar McKay (51) was appointed chairman and president of BP America,Inc. in February 2009. He joined Amoco Production Company as apetroleum engineer in 1980. He held a variety of roles before becominggroup vice president for Russia & Kazakhstan in 2003, also beingappointed to the board of TNK-BP in 2004. In 2007, he was namedexecutive vice-president of BP America and COO. In early 2008, hebecame executive vice president of BP plc special projects, focusing on Russia, subsequently joining the group executive management teamin June 2008.
S WestwellSteve Westwell (51) joined BP in the manufacturing and supply division ofBP Southern Africa in 1988. Following various retail positions in the UKand the US, he was appointed head of retail and a member of the boardof BP Southern Africa Pty. In 2003, he became president and chiefexecutive officer of BP solar, and in 2004, group vice president of naturalgas liquids, power, solar and renewables. In 2005, he was appointedgroup vice president of alternative energy. He was appointed group chiefof staff in January 2008.
Board performance and biographies
BOL08439_p061 pp64_Directors:20 F 5/3/10 17:32 Page 64 Bleed: 0�mm Scale: 100%

65
Board performance and biographies
Bo
ard
perfo
rman
ce a
nd
bio
gra
ph
ies
Board performance report I am pleased to have this opportunity to report to you on the work of theBP board over the last year.
I joined the board as a non-executive director in September 2009and took the chair on 1 January 2010 upon the retirement of PeterSutherland. Peter has reviewed this letter and I, of course, have had thebenefit of the views of my board colleagues on its content.
This is a particularly interesting time for me to take the chair at BP.In the past months we have seen the reports of Sir David Walker and theFinancial Reporting Council (FRC), to which we have contributed. The wayin which boards work has again been in the spotlight. There are a numberof lessons that all boards can learn from the events of 2008 and 2009.Both these reports have focused on the need for appropriate behavioursaround the board table and for governance not to be regarded as solelyrelating to compliance. This is a view which BP has taken for some timeand which I fully endorse.
I have been impressed by BP’s commitment to the higheststandards of corporate governance. Governance describes all that a boarddoes – a point which has been reinforced by the FRC’s draft revisedCombined Code. It is vital that a board balances the time that it spendsbetween strategy and oversight. From early indications, I believe that theBP board achieves this balance well.
The board is responsible for the direction and oversight ofBP p.l.c. on behalf of shareholders; it is accountable to them, as owners, for all aspects of BP’s business. It sets the tone from the top.In conducting its business, BP needs to be responsive to otherconstituencies with whom it comes into contact.
Governance framework
Clarity of roles and responsibilities, and the proper utilization of distinctskills and processes lie at the heart of the board’s role. The BP boardgovernance principles (‘principles’) are the framework within which theboard operates.
This framework sets out the role of the board, its processes, its relationship with executive management and the main tasks andrequirements of the board committees. The board’s core activitiesinclude:• The active consideration of long-term strategy.• The monitoring of executive action and the performance of BP.• Obtaining assurance that the material risks to BP are identified and
that systems of risk management and control are in place to mitigatesuch risks.
• Ongoing board and executive management succession.The principles can be seen on BP’s website at www.bp.com/governance.
The board delegates authority for executive management of the companyto the group chief executive. This delegation is subject to a clearly definedset of executive limitations which are monitored by the board. Theexecutive limitations require the group chief executive to take intoconsideration specific issues in the course of business – these includekey risk areas such as health, safety and environmental matters andgenerally ensuring that BP’s reputation is maintained. The group chiefexecutive is also responsible for ensuring there is a comprehensivesystem of controls to identify and manage the risks that are materialto BP.
The board keeps this framework under regular review and testsits effectiveness through the annual board evaluation.
BOL08439_p065 pp76_BP board:20 F 5/3/10 17:32 Page 65 Bleed: 0�mm Scale: 100%
Board activities in 2009
The board’s work reflects the tasks described above, namely strategy,risk and the oversight of the company’s performance and operation of thesystem of delegation.
The board endeavours to balance its work so that these tasks areachieved either through the work of the board or its committees. At thestart of each year, the board reviews and agrees a forward workplanbased upon:• The need for the board to be involved in strategy development and
the oversight of risk.• Annual reviews of the two business segments and of the corporate
business and functions which includes Alternative Energy.• Oversight of risk generally and specifically those risks identified
through the annual plan (the board will decide which risk issues willbe considered by the whole board and which will be delegated to thecommittees with appropriate reporting to the board).
• Consideration of quarterly and annual corporate reportingdocumentation.
In determining its programme the board has to allow sufficient time forurgent issues to be accommodated. The board will meet by telephoneshould circumstances dictate.
The board now holds one of its meetings at the company’s officesin Washington and will meet at other locations when appropriate. In2009, the board met in Long Beach, California and used this opportunityto visit the company’s businesses in the West Coast fuels value chain andto learn about the research taking place into biofuels.
An analysis of the time spent by the board during 2009 is shown below:
Board activitiesApproximate allocation of agenda time in 2009*
*Excludes time spent on site visits.
20%
20%
11%
41%
4%
4%
GCE and executive director updates,business reviews (including safety)Strategy and riskCountry specific reports (including safety)Functional reviewsFinancial and corporate reportingOther matters
Strategy and riskWhile strategic issues are normally discussed at the two dedicated awayday sessions, the development of the group’s business over the year hasmeant that strategic issues have been actively considered at a number ofmeetings. Strategic and geopolitical challenges, together with theassociated risks are at the core of the group’s business.
The business and competitive environment, the global economicoutlook, the impact of the price of oil, the issues raised by carbon policy,the technological challenges and strengths of the group were all matterswhich the board kept under review.

66
Board performance and biographies
Deleg
ation
Acco
un
tability
Ernst & Young
Internal audit
Finance function
General counsel
External market and reputation research
Independent expert
• BP goal • Governance process• Delegation model• Executive limitations
Delegation
AccountabilityGCE’s delegations
Group chief executive
Executive management
Delegation of authority through policy with monitoring
Assurance through monitoring and reporting
Safety & Operations function
Group compliance offi cer
Independent advice (if requested)
Monitoring, Information andAssurance
GORCGroup operations risk committee
GFRCGroupfinancial risk committee
GDCGroup disclosures committee
GPCGroup people committee
RCMResourcecommitments meeting
BP Board Governance PrinciplesOwners/shareholders
Board
Nomination committee
Remuneration committee
Chairman’s committee
Audit committee
Nomination committee
Remuneration committee
Chairman’s committee
Audit committee
SEEAC
BP governance framework
Annual plan / Group risks / Strategy
BOL08439_p065 pp76_BP board:20 F 5/3/10 17:32 Page 66 Bleed: 0�mm Scale: 100%
GCE update and business reviewsThe group chief executive provides a written report to each meeting ofthe board which gives an update on key issues relating to safety andintegrity, operations, financial performance and the market in which BP’s businesses operate. These are complemented by verbal updatesgiven by executive directors on material matters which have arisen intheir business.
Periodic reviews of the business are scheduled throughout theyear. During 2009, reviews were held with both segments (Explorationand Production and Refining and Marketing) and with Alternative Energy.
Country specific reportsSeparate to the business specific reports, the board discussed theperformance, political landscape and market outlook relating to BP’soperations, particularly in the US and Russia.
Functional reviewsThe work of the group technology function was reviewed and discussionswere held on issues relating to information technology and services.
Financial and corporate reportingThe board considered the group’s statutory reports and the broaderaspects of corporate reporting. It also received regular updates on thegroup’s financial outlook as well as discussing the financial results.
An annual review of the group’s process for sanctioning capitalinvestment is undertaken by the board. This includes examining casestudies of BP projects with different levels of complexity andunderstanding the effectiveness of project delivery against originalsanction.
Other mattersOther matters discussed by the board included the BP brand andcorporate advertising, the results of the group-wide employeesatisfaction survey and an annual report evaluating BP’s externalreputation in the UK and US.
The board also received a presentation from the independent expertappointed to provide an objective assessment of the BP US RefineriesIndependent Safety Review Panel (the panel). Further details on theactivities of the independent expert are outlined in the report of thesafety, ethics and environment assurance committee below.
Risk management and internal control
The board and its committees monitor the identification andmanagement of the group’s risks and the board reviews how group-levelrisks and their mitigations are embedded in the c ompany’s annual plan.Geopolitical and reputational risks are considered by all the board whichalso receives reports from the committees to whom specific riskoversight has been allocated. The audit committee monitors financial riskwhilst the safety, ethics and environment assurance committee (SEEAC)monitors non-financial risk; the audit committee and SEEAC hold anannual joint meeting to assess the effectiveness of the company’sinternal controls and risk management. Like BP’s other boardcommittees, the audit committee and SEEAC are composed entirely of independent non-executive directors.
The audit committee and SEEAC maintain a forward-lookingapproach to risk exposure. A high level work programme for the boardand its committees is set on the basis of an agenda that reflects theboard’s core tasks and the key group risks.
The group chief executive and his senior team are supported byexecutive-level sub-committees which monitor specific group risks: thesecommittees comprise the group operations risk committee (GORC), thegroup financial risk committee (GFRC), the group people committee(GPC), the resource commitments meeting (RCM) and the groupdisclosures committee (GDC). They provide input and data to the riskoversight process by the executive, as well as external and internal audit,the group’s compliance and ethics officer, safety and operations audit andgroup controls.
Further information about our internal control systems is set outon pages 16, 70 and 101.

67
Board performance and biographies
Bo
ard
perfo
rman
ce a
nd
bio
gra
ph
ies
33
8
BOL08439_p065 pp76_BP board:20 F 5/3/10 17:32 Page 67 Bleed: 0�mm Scale: 100%
BP’s general auditor (head of the internal audit function) reports on thedesign and operation of risk management activities across the group andattends meetings of both the audit committee and SEEAC. The generalauditor has direct access to the chairs of both committees and holdsregular meetings with them outside formal meetings.
Within the company, BP has an annual certification process inwhich team leaders are asked to discuss with their teams and thensubmit a certificate regarding their and their team’s understanding of andadherence to BP’s code of conduct and the reporting of any breaches orrisk of non-compliance. The certification system enables the risk of non-compliance to be assessed and reported alongside other business risks.
Board meetings and attendance
The board met 12 times during the year, of which two meetings weretwo-day strategy sessions and three meetings were by telephone.
Board meetings Board meetings eligible to attend attended
P D Sutherland 12 10Sir Ian Prosser 12 12A Burgmans 12 12C B Carroll 12 11Sir William Castell 12 11G David 12 12E B Davis, Jr 12 10D J Flint 12 10D S Julius 12 12Sir Tom McKillopa 5C-H Svanbergb 4I C Conn 12 12R W Dudleyc 8B E Grote 12 12A B Hayward 12 12A G Inglis 12 11
a Retired from the board on 16 April 2009.b Joined the board on 1 September 2009.c Joined the board on 6 April 2009.
International advisory board
In 2009, BP formed an international advisory board whose purpose is to advise the chairman, group chief executive and board of BP plc onstrategic and geopolitical issues relating to the long-term development of the company. The international advisory board met twice in 2009.
The chairman, senior independent director and
non-executive directors
Neither the chairman nor the senior independent director is employed asan executive of the group. The board is required to develop and maintaina plan for the succession of both the chairman and senior independentdirector. During 2009, these posts were held by Peter Sutherland andSir Ian Prosser respectively. Sir Ian Prosser also held the post of deputychairman during the year – a role which will cease on his retirement.
The chairmanUpon Peter’s retirement, I took the chair on 1 January 2010. The processfor my appointment and induction programme is outlined below. I stepped down as CEO of Ericsson on 31 December 2009, but willremain on the Ericsson board as a non-executive director. I had no othersignificant commitments at the time of my appointment as chairman.
The chairman’s role is to provide leadership of the board, act as facilitator for meetings, maintain the integrity of the governanceframework and have overall responsibility for ensuring the board’seffectiveness. Other responsibilities include leading the board’sperformance evaluation and overseeing the board learning and induction programme.
The chairman is tasked with setting the agenda for the board inconsultation with the group chief executive and with the support of thecompany secretary. The chairman ensures that systems are in place toprovide directors with accurate, timely and clear information concerningthe business of the board and the company.
Between board meetings, the chairman has authority to act and speak for the board on all matters relating to the role of the board.He also has responsibility for ensuring the relationship with executivemanagement is working well.
The chairman represents the views of the board to shareholderson key issues, in particular those relating to the work of the boardincluding succession planning. He keeps the board briefed on thoseviews. In November I was able to meet a number of our institutionalshareholders as part of my induction. I found these to be productivemeetings and comment on them, and on the board engagement whichhas taken place during the year, in further detail below.
The senior independent directorThe senior independent director acts for the chairman in his absence or at his request, and is available to shareholders if they request a meetingor have concerns which contact through the normal channels has failed to resolve or where such contact is inappropriate.
The senior independent director is available to act as acommunication channel between the chairman and other board members and, when necessary, to provide a sounding board for thechairman. He also has responsibility for leading the annual performancereview of the chairman.
Sir Ian Prosser will retire from the BP board at the AGM in April2010. Sir William Castell will become the senior independent directorfrom that date.
Sessions of the non-executive directorsThe chairman and all non-executive directors meet periodically withoutthe presence of executive management as the chairman’s committee.The work of the committee during the year is outlined in the reportbelow.
Board composition
During the year, the number on the board has fluctuated. As at26 February 2010, the board is composed of the chairman, nine non-executive directors and five executive directors; over half the board istherefore made up of independent non-executive directors. We state that the number of directors should not normally exceed 16.
This is a large board, however, given the scale and scope of BP’sbusiness we believe that it is appropriate. We need to have a broad andexperienced group of directors who are able to contribute to a discussionon strategy and risk whilst having the right skills to work on thecommittees. We believe it is important to have a strong group ofexecutive directors who recognize their board responsibilities as directorsand not solely to represent the activity in the company for which they areresponsible. This adds to open and constructive debate anddemonstrates one of the strengths of a unitary board.
Sir Tom McKillop retired from the board on 16 April 2009 and PeterSutherland retired on 31 December 2009. Bob Dudley joined the board asan executive director on 6 April 2009 and I became a BP non-executivedirector and chairman designate on 1 September 2009. Paul Andersonjoined the board on 1 February 2010 and Ian Davis will join the board on2 April 2010. Finally, two of our longest serving directors will be retiring atthe AGM in April 2010: Sir Ian Prosser and Erroll Davis, Jr.

68
Board performance and biographies
Appointments to the boardThe board is actively involved in succession planning for both executiveand non-executive directors. It is assisted in this task of the progressiverefreshing of the board by the nomination committee. The nominationcommittee keeps under review the composition, skills, independence,knowledge and diversity of directors to ensure that the board and itscommittees remains effective and appropriate to the work theyundertake. This review is undertaken at regular intervals and forms the basis of criteria to evaluate potential board candidates.
Due to the size of the BP board and the wish to achieve a steadyrefreshment of board appointments the nomination committee isdeveloping a longer-term pipeline of potential non-executive talent onwhich it hopes to draw as new appointments arise. The committeebelieves that given BP’s scale and breadth of operations, a broad mix ofskills, experience and knowledge is required for its board members. Thecommittee has identified deep operational and industry experience, aswell as insight into key technologies, health and safety, emergingmarkets and financial knowledge as particularly relevant to future board appointments. An understanding of geopolitical influence is also akey skill.
A report on the work of the nomination committee is set out below.
Terms of appointmentThe chairman and non-executive directors of BP serve on the basis ofletters of appointment. Non-executive directors ordinarily retire at theAGM following their 70th birthday. Executive directors have servicecontracts with the company, which are expressed to retire at a normalretirement age of 60 (subject to age discrimination).
Details of all payments to directors appear in the directors’remuneration report.
In accordance with BP’s Articles of Association, directors aregranted an indemnity from the company in respect of liabilities incurredas a result of their office, to the extent permitted by law. In respect ofthose liabilities for which directors may not be indemnified, the companymaintained a directors’ and officers’ liability insurance policy throughout2009. During the year, a review of the terms and scope of the policy was undertaken. The policy has been renewed for 2010. Although theirdefence costs may be met, neither the company’s indemnity norinsurance provides cover in the event that the director is proved to haveacted fraudulently or dishonestly. UK company law permits the companyto advance costs to directors for their defence in investigations or legalactions.
Tenure and director electionsBP does not place a term limit on a director’s service as the boardconsiders this unnecessary in light of the company’s long-establishedpractice of proposing all directors for annual re-election by shareholders.The chairman and the nomination committee keep the tenure of thedirectors under review as part of the wider consideration of board skillsand balance.
New board members are subject to election by shareholders at the first AGM following their appointment, with all existing directorsstanding for re-election each year. The notice of meeting contains abiography of each of the directors and a description of the skills andexperience which the company feels is relevant to shareholders in taking an informed decision on their election.
Board independence
Non-executive directors are required to be independent in character andjudgement and free from any business or other relationship which couldmaterially interfere with the exercise of their judgement. The board hasdetermined that non-executive directors who served during 2009 fulfilledthis requirement and were independent. Upon appointment as chairman,the board was satisfied that I met the criteria of independence outlinedabove in the principles and in the UK Combined Code.
The board is also satisfied that there is no compromise to theindependence or conflicts of interest of those directors who servetogether as directors on the boards of outside entities or who have other appointments in outside entities. These issues are considered on a regular basis at board meetings.
Serving as a director
Induction and board learningAll directors receive a full induction programme when they join the board,including a core element covering BP’s system of governance, the legalduties of directors of a listed company and the regulatory systems in theUK and US. The programme for non-executive directors has widercontent which covers the business of the group and is tailored accordingto a director’s own interests and needs and takes into account the tasksof the committees on which they will serve. Non-executive directors willreceive presentations from senior management, have in-depth briefingson the company’s strategy, plan and financial performance and be giventhe opportunity to visit BP’s operations and meet employees at BP sites.
Prior to assuming the role of chairman, I received an extensiveinduction programme which covered:• Board matters, including directors’ duties, board issues and board
committees.• The business environment for BP.• BP’s core businesses: Exploration and Production, and Refining and
Marketing.• Reviews of Alternative Energy and Group Technology.• Overviews of BP’s functions – including Finance, Safety and
Operations, HR, Internal Audit, Legal, and Information Technologyand Services.
• BP’s regional presence and key markets.• BP’s strategic approach and financial framework.• BP’s approach to risk management.• A review with the company’s external auditor.I had one-to-one meetings with each member of the board andundertook site visits to the Thunder Horse platform in the Gulf of Mexicoand BP’s fuels value chain in the western US. I attended meetings of theaudit, remuneration, nomination and chairman’s committees. I also metwith a number of BP’s largest shareholders. It was a lot of ground tocover and the process is still continuing.
As the chairman, I am responsible for ensuring that induction and training programmes are provided to all directors, and look at thisprovision on an individual basis. The company secretary assists in thisand ensures that the programme to familiarize board members with BP’sbusiness is developed and updated in response to the needs of directors.During 2009, the board received briefings on biosciences, carbon policyand the economic outlook for the US, in addition to training at separatecommittees. Written updates were given on legal and regulatory issues.
All non-executive directors are required to participate in at leastone site visit per year. During the year, site visits were made to theProjects and Operations Academies at the Massachusetts Institute ofTechnology, and to BP’s fuels value chain in California, involving visits to a marine terminal, Carson Refinery, an inland distribution facility and a retail service station.
The effectiveness and relevance of the board’s induction andtraining programmes are tested through their inclusion in the annualboard evaluation. Feedback from the evaluation indicated that directorswould welcome more deep-dive coverage of BP’s business and morelearning content on risk and the context for evaluating risk.
BOL08439_p065 pp76_BP board:20 F 5/3/10 17:32 Page 68 Bleed: 0�mm Scale: 100%

69
Board performance and biographies
Bo
ard
perfo
rman
ce a
nd
bio
gra
ph
ies
Board evaluationBP undertakes an annual evaluation of the performance andeffectiveness of the board, including the work of its committees.Evaluation of individual directors is undertaken by the chairman, with thechairman’s committee evaluating the performance of the chairman.
By building on the results of the previous year’s evaluation, theboard tries to achieve a continuous cycle of evaluation, targeted actionsarising from the review and performance improvement. Actions taken bythe board during the year in response to the outcome of the 2008 reviewincluded greater focus on key areas of board learning, the undertaking ofan investor audit to obtain feedback on BP’s performance and expandedpresentation of capital investment effectiveness.
For the 2009 evaluation, an external facilitator was engaged toprovide me with an understanding of the dynamics and performance ofthe board as part of my induction as chairman.
Following a review of different providers, Boardroom Review wasselected as external facilitator and it was determined that they had noother connection with the company. Boardroom Review undertook one-to-one interviews with each board member plus those who provideadvice and support to the board and its committees. This was followedby observation of the board and each committee meeting in session. Theevaluation report prepared by Boardroom Review was presented anddiscussed by the board in January 2010. The evaluation identified severalareas of significant strength, including:• Strategic involvement: including the detailed and dynamic
examination of information on the external environment and theimpact and penetration of the work of the committees.
• Board dynamics: examples cited include the breadth and depth ofexecutive and non-executive experience and the open andtransparent culture of the board.
• Executive leadership: in particular the operational and performancefocus of the executive team and their commitment to develop theboard’s understanding of future options, strategic partnerships andoperational excellence.
Issues identified in the evaluation for the board to consider furtherincluded:• Strategy and risk: while the way in which the board dealt with
strategy was seen to be a strength, the enhanced focus on riskmeant the board was seeking ways to further improve itsconversations on this.
• The balance of formal and informal time: the time pressure on theboard to balance workload coupled with the increasing expectationsand responsibilities placed on board members. As a result, the boardis considering how best to maximize its time together, includingoptions such as scheduling more informal sessions outside boardmeetings whilst still encouraging board members to observecommittee meetings of which they are not members in order tobetter understand the issues.
• Board and committee tenure: with the retirement of several boardmembers and the planned refreshment of the board, it was notedthat board committees would be faced with turnover. Going forward,the board will examine ways of ensuring that committees do not facemembers retiring within the same timeframe and that there isappropriate cross membership between related committees.
• Discussion of people and culture: with the ongoing process of changewithin the company, there is challenge for the board to maintainoversight on issues such as long-term retention, cultural values andpractices across the group. The board is looking at how itscommittees can maintain a holistic view of these issues and howemployee engagement, staff morale and retention strategy ismonitored and influenced.
BOL08439_p065 pp76_BP board:20 F 5/3/10 17:32 Page 69 Bleed: 0�mm Scale: 100%
Time commitment and outside appointmentsLetters of appointment to the BP board do not set out fixed timecommitments for board duties as the company believes that the timerequired may change depending upon the demands of business.Membership of the board represents a significant time commitment andit is expected that directors will allocate sufficient time to the company toperform their responsibilities effectively. The nomination committeekeeps this under review.
The company recognizes that executive directors may be invitedto become non-executive directors of other companies. Suchappointments can broaden their knowledge and experience, to thebenefit of both the individual and the group. BP permits executivedirectors to take up one external board appointment, subject to theagreement of the chairman which is then reported to the BP board. Fees received for these external appointments may be retained by theexecutive director and are reported in the directors’ remuneration report.Non-executive directors may serve on a number of outside boards,provided they continue to demonstrate the requisite commitment todischarge their duties to BP effectively. The nomination committee keeps under review the nature of directors’ other interests to ensure that the efficacy of the board is not compromised and may makerecommendations to the board if it concludes that a director’s othercommitments are inconsistent with those required by BP.
Board support and external adviceThe chairman, assisted by the company secretary, ensures that boardmembers receive timely and clear information on all matters relevant to the work and tasks of the board. Support to the board and itscommittees is provided through the company secretary’s office, whichreports to the chairman. The company secretary has no executivefunctions, with his appointment determined by the nominationcommittee and his remuneration determined by the remunerationcommittee.
Any BP director is entitled to obtain independent, professionaladvice relating to their own responsibilities and the affairs of BP; thisadvice will be at the expense of the company and facilitated through thecompany secretary’s office. No BP directors sought such advice in 2009.
Board communication
Engagement with shareholdersThe board represents the interests of all shareholders and seeks to actfairly between them. It is accountable to shareholders for theperformance and activities of BP and engages in regular dialogue tounderstand their views and preferences.
The chairman, the group chief executive, other executive and non-executive directors and senior management, the company secretary’soffice, investor relations and other teams within BP engage with a rangeof shareholders on issues relating to the group. Presentations given bythe group to the investment community are available to download fromthe Investors section of BP’s website, as are speeches on topics ofinterest to shareholders made by the group chief executive and othersenior management.
Peter Sutherland held a number of one-to-one meetings withinvestors over the course of the year to discuss issues relating togovernance, succession, strategy and performance. The chair of theremuneration committee had meetings with institutional investors todiscuss executive director remuneration.
A meeting was held in March 2009 for BP’s largest shareholderswith the chairman and the chairs of the board committees. Each chairgave a short presentation on his or her committee’s work and the keychallenges the committee faced in the year ahead, before opening thesession up to questions. The meeting was aimed at providing our largestinvestors with an overview of the board’s activities in advance of theAGM in April. Following positive feedback from both committee chairsand investors, a similar event will be held in 2010.

70
Board performance and biographies
I met a number of BP’s largest shareholders in November to hear theirviews on the company and the activities of the board and its committeesin advance of becoming chairman in January 2010.
Written and verbal feedback from shareholder meetings is sharedwith the wider board. During the year, the investor relations teamengaged an external consultant to undertake an investor audit to solicitthe views of major shareholders. The results of this audit were presentedto the board in July. The board also receives regular reports on thecompany’s share register, including explanations for movements in priceand holdings of the company’s ADRs and ordinary shares.
AGMThe AGM is an opportunity for BP’s shareholders to ask questions andhear the resulting discussion about the company’s performance and thedirectors’ stewardship of the company. Given the size and geographicaldistribution of the company’s shareholder base BP recognizes thatattendance may not be practical; therefore votes on all matters (exceptprocedural issues) are taken by a poll at the AGM, meaning that everyvote cast – whether by proxy or in person at the meeting – is counted.
The chairman and chairs of the board committees were presentduring the 2009 AGM and met shareholders on an informal basis aftermain business of the meeting. In 2009, voting levels at the AGMdecreased slightly to 61%, compared with 63% in 2008. As in previousyears the AGM was webcast, with the number of webcast downloadsincreasing over 2008 levels. The webcast, speeches and presentationsgiven at the AGM are available on the BP website after the event,together with the outcome of voting on the resolutions.
Combined Code compliance
BP complied throughout 2009 with the provisions of the Combined Codeon Corporate Governance, except in the following aspects:A.4.4 Letters of appointment do not set out fixed time commitments
since the schedule of board and committee meetings is subject tochange according to the exigencies of the business. All directorsare expected to demonstrate their commitment to the work ofthe board on an ongoing basis. This is reviewed by the nominationcommittee in recommending candidates for annual re-election.
B.2.2 The remuneration of the chairman is not set by the remunerationcommittee. Instead the chairman’s remuneration is reviewed bythe remuneration committee which makes a recommendation to the board as a whole for final approval, within the limits set by shareholders.
Internal control reviewIn discharging its responsibility for the company’s system of internalcontrol the board, through its governance principles, requires the groupchief executive to operate with a comprehensive system of controls andinternal audit to identify and manage the risks that are material to BP. The governance principles are reviewed periodically by the board and areconsistent with the requirements of the Combined Code includingprinciple C.2.
The board has an established process by which the effectivenessof this system of internal control is reviewed as required by provisionC.2.1 of the Combined Code. This process enables the board and itscommittees to consider the system of internal controls being operatedfor managing significant risks, including social, environmental, safety,ethical and compliance risks, throughout the year. The process does notextend to joint ventures or associates.
As part of this process, the board and the audit and safety, ethicsand environment assurance committees requested, received andreviewed reports from executive management, including management of the business segments and functions, at their regular meetings.
In considering the system, the board noted that such a system isdesigned to manage, rather than eliminate, the risk of failure to achievebusiness objectives and can only provide reasonable, and not absolute,assurance against material misstatement or loss.
BOL08439_p065 pp76_BP board:20 F 5/3/10 17:32 Page 70 Bleed: 0�mm Scale: 100%
During the year, the board through its committees regularly reviewedwith the general auditor and executive management processes wherebyrisks are identified, evaluated and managed. These processes were inplace for the year under review, remain current at the date of this reportand accord with the guidance on the Combined Code provided by theFinancial Reporting Council. In November, the board considered thegroup’s significant risks within the context of the annual plan presentedby the group chief executive.
A joint meeting of the audit and safety, ethics and environmentassurance committees in January 2010 reviewed reports from thegeneral auditor as part of the board’s annual review of the system ofinternal control. The chairman of the board and the chairman of theremuneration committee also attended the meeting. The reportsdescribed the significant risks identified across the group within thecategories of strategic, operational and compliance and control andconsidered the control environment which responds to such risks. Thereports also highlighted the results of audit work conducted during theyear and the remedial actions taken by management in response tosignificant failings and weaknesses identified.
During the year, these committees engaged with management,the general auditor and other monitoring and assurance providers (suchas the group compliance and ethics officer and the external auditor) on aregular basis to monitor the management of risks. Significant incidentsthat occurred and management’s response to them were considered bythe appropriate committee and reported to the board.
In the board’s view, the information it received was sufficient toenable it to review the effectiveness of the company’s system of internalcontrol in accordance with the Internal Control Revised Guidance forDirectors in the Combined Code (Turnbull).
The board is satisfied that, where significant failings orweaknesses in internal controls were identified during the year,appropriate remedial actions were taken or are being taken.
On behalf of the board,
Carl-Henric Svanberg
Chairman26 February 2010
Audit committee report
The report that follows outlines the principal responsibilities and methodof operation of the audit committee, and highlights some of the specificactivities it undertook during 2009.
The committee’s main tasks include:• Reviewing the effectiveness of BP’s internal financial controls and its
systems of internal control and risk management.• Monitoring and obtaining assurance that the management and
mitigation of significant risks of a financial nature facing BP areappropriately addressed.
• Monitoring the integrity of BP’s financial statements and makingrecommendations to the board about their adoption and publication.
• Monitoring and reviewing the effectiveness of BP’s internal auditfunction.
• Keeping under review the external auditor’s independence andobjectivity, and overseeing the effectiveness of the audit process.
• Making recommendations to the board on the appointment,re-appointment or removal of the external auditor and regarding the approval of their remuneration and terms of engagement.
• Monitoring the policy and its application on the engagement of theexternal auditor to supply non-audit services to BP.
• Reviewing the systems in place (including OpenTalk) to enable thosewho work for BP to raise, in confidence, any concerns about possibleimproprieties in matters of financial reporting or other financial issuesand for those matters to be appropriately investigated.

71
Board performance and biographies
Bo
ard
perfo
rman
ce a
nd
bio
gra
ph
ies
BOL08439_p065 pp76_BP board:20 F 5/3/10 17:32 Page 71 Bleed: 0�mm Scale: 100%
The full list of the tasks and requirements of the audit committee is set out in BP’s board governance principles and can be found atwww.bp.com/governance. The committee keeps these tasks underreview to determine whether they remain fit for purpose. In 2009, theevaluation of the committee’s work was conducted as an integral part ofthe external evaluation undertaken by the board. Following thisevaluation, the board concluded that the committee had fulfilled itsresponsibilities as defined under the principles and that its tasks andrequirements remained appropriate.
Committee structureThe audit committee comprises four independent non-executive directorsselected to provide a wide range of financial, international andcommercial expertise appropriate to fulfil the committee’s duties. During2009 the members, in addition to myself as chairman included GeorgeDavid, Erroll Davis, Jr and Douglas Flint. The secretary of the committeeis David Pearl, deputy company secretary of BP.
The committee met 12 times in 2009, with an additional jointmeeting between the audit committee and the safety, ethics andenvironment assurance committee (SEEAC) to review the generalauditor’s report on internal controls and risk management for the previousyear. Each meeting was attended by the group chief financial officer, thedeputy group chief financial officer, the group controller, the generalauditor (head of internal audit) and the chief accounting officer. The leadpartner of the external auditors (Ernst & Young) was also present. Othersenior management are invited to attend when the business of thecommittee requires. During the year the committee held privatesessions, usually at the end of each full meeting, without the presence ofexecutive management. It also held separate sessions with only theexternal auditors present and only the general auditor present.
Carl-Henric Svanberg attended two meetings of the auditcommittee during the year as part of his board induction programme.
The board determined that Douglas Flint is the audit committeemember with recent and relevant financial experience as defined by theCombined Code guidance.
The board also determined that Douglas Flint meets theindependence criteria provisions of Rule 10A-3 of the US SecuritiesExchange Act of 1934 and that Mr Flint may be regarded as an auditcommittee financial expert as defined in Item 16A of the Annual Reporton Form 20-F. Mr Flint is group finance director of HSBC Holdings plc anda former member of the Accounting Standards Board and the StandardsAdvisory Council of the International Accounting Standards Board.
After l retire from the BP board at the AGM in April 2010, it hasbeen agreed that Douglas Flint will become chairman of the auditcommittee.
AttendanceAudit Audit
committee committee meetings eligible meetings
to attend attended
Sir Ian Prosser (chair) 13 13E B Davis, Jr 13 11D J Flint 13 12G David 13 13
Information and external adviceThe committee receives information and reports directly fromaccountable functional and business managers and from relevant externalsources. BP’s board governance principles are explicit that the board andits committees can access independent advice and counsel whenneeded on an unrestricted basis. Further support is provided by thecompany secretary’s office and during 2009 external specialist legal andregulatory advice was provided to the audit committee in the normalcourse of carrying out its responsibilities by Sullivan & Cromwell LLP. Inaddition to the lead partner for Ernst & Young, other external audit staffalso attended meetings where appropriate to a particular review of abusiness or function.
As part of its annual evaluation process, the audit committeelooked at whether it has received sufficient and timely information toenable it to undertake its tasks effectively. It was concluded that theprocesses surrounding the reliability and timeliness of information was robust.
The board was kept updated and informed of the auditcommittee’s activities and any issues that had arisen both through thecommittee minutes and also more immediately through verbal updatesgiven by myself as committee chair as part of the board’s regular agenda.
Training and visitsThe composition of the committee was unchanged from the previousyear, so training was focused on deepening knowledge rather thaninduction.
During the year the committee received briefings on financialreporting developments, governance changes affecting auditcommittees, new SEC regulations for oil and gas reserves accountingand tax reform.
In addition to the site visits made by the board as a whole, theaudit committee visited BP’s UK trading operations for an in-depthbriefing on the fundamentals of oil and gas trading. This wassupplemented by visits by myself and the secretary of the committee toBP’s oil and gas trading operations in Houston and Chicago. These visitsalso provided an opportunity to meet staff of the independent monitorappointed for BP’s US trading business. Two members of the committeealso joined the SEEAC visit to BP’s Projects and Operations Academies at MIT in March. I found that visit, and the one I made to the company’saccounting, reporting and control course, provided valuable insight intotraining deep within the organization.
Committee activities in 2009
Audit committee activitiesApproximate allocation of agenda time in 2009*
31%5%
28%
36%
*Excludes time spent on site visits.
Financial reporting Monitoring business risksInternal controls and auditOther agenda items

Financial reportingDuring the year, the committee reviewed the group’s quarterly financialreports, the annual report and accounts, the annual review and the 20-Fbefore recommending their publication to the board. The committee alsodiscussed with management the critical accounting policies andjudgements applied in the preparation of those financial reports. Thisincluded key assumptions regarding significant provisions, includingthose for decommissioning and environmental remediation and thoseused for impairment testing. (See Financial statements – Note 3 on page122.)
Monitoring business riskThe committee reviewed reports on the inherent risks within selectedareas of BP’s businesses and supporting functions. This together with therelated controls and assurance processes is designed to manage andmitigate such risks. On top of reviewing the major business areas andfunctions within BP, this year specific focus was additionally given toTreasury activities, including debt and liquidity management, toinformation technology and to the group’s oil and gas trading activities.The committee also reviewed risk management and investment strategyrelated to pensions and other post-retirement benefits, the managementof taxation and litigation exposures and the management of BP’sapproach to insurance.
The work and scope of the executive-level Group Financial RiskCommittee (which provides assurance to the executive on themanagement of BP’s financial risk) was reported to the committee duringthe year by the chief financial officer.
Internal control and auditThe committee holds an annual joint meeting at the start of each yearwith the safety, ethics and environment assurance committee to reviewthe general auditor’s report on internal controls and risk management forthe previous year. This provides important input into the board’s review ofthe company’s system of internal control.
The committee’s agenda includes standing items addressinginternal control and these included in 2009 the quarterly internal auditfindings report and the annual assessment of BP’s enterprise levelcontrols.
Further detail on risk management and internal control in BP isoutlined in the governance section of this board performance reportabove.
External auditorsThe committee held two private meetings during the year with theexternal auditors. These provided additional opportunity for open dialogueand feedback from both the committee and the auditors without thepresence of BP management. At these meetings, topics coveredincluded the quality of interaction with executive management, thestrength of the financial team and the effectiveness of the internal auditfunction. I also meet on my own with the external auditors prior to eachaudit committee to discuss the forthcoming agenda.
The committee undertakes regular reviews of the performance,effectiveness and viability of the external auditors. As part of its 2009review, senior partners at Ernst & Young who were independent of theaudit team responsible for BP undertook an evaluation process, whichinvolved 22 face-to-face interviews with those BP board members andsenior management who have key interactions with the external auditors.In addition, there was a web-based survey of 185 people representing across section of BP’s global finance organization, covering both groupreporting and statutory locations. The results of the interviews andsurveys were presented to the committee by the independent seniorpartners in July and the auditors were asked to develop an action plan toaddress a small number of areas identified for improvement.
72
Board performance and biographies
The external auditor followed up these findings with a report to thecommittee in November which outlined its responses to these areas. The external auditors will perform an assessment of service quality in2010 to review the progress against the development areas outlined inthe feedback.
Fees paid to the external auditor for the year (see Financialstatements – Note 14 on page 134) were $54 million, of which 15% wasfor non-audit work. The fees and services provided by Ernst & Young forboth audit and non-audit work have decreased in comparison to previousyears reflecting a joint approach to raising efficiency in audit processes aswell as a reduction in tax services and services related to corporatefinance transactions. All non-audit work is subject to the committee’sadvance approval policy and is monitored on a quarterly basis.
The audit committee has considered the proposed fee structureand audit engagement terms for 2010 and has recommended to theboard that the reappointment of the external auditors be proposed toshareholders at the 2010 AGM.
Internal auditThe general auditor attends all committee meetings but also meetsregularly on a one-to-one basis with myself as committee chairman. In July the general auditor met privately with the committee without thepresence of executive management or the external auditors. In reviewingthe effectiveness and quality of the internal audit, the committee alsosought input from external auditors.
The committee receives a quarterly update on the progress ofinternal audit against its schedule of audits, is notified of their keyfindings and tracks any material actions that are overdue or have beenrescheduled. The proposed internal audit work programme for the yearwas agreed by the committee in January. The committee was satisfiedthat it appropriately responded to the key risks facing the company andthat the function had sufficient staff and resources to complete its work.
Other activitiesThe committee receives quarterly reports from the group compliance andethics function which examine areas of potential non-compliance withthe company’s Code of Conduct and remedial actions that are beingundertaken. The committee also receives an annual certification reportwhich is signed by the group chief executive. The committee reviewsquarterly reports on financial issues and concerns that have been raised through the group-wide employee concerns programme, OpenTalkand quarterly updates from internal audit on instances of actual orpotential fraud.
Committee evaluationThe committee conducts an annual review of its performance andeffectiveness. For 2009, this review was facilitated externally as part ofthe wider review of the board and its committees. The external facilitatorundertook one-to-one interviews with each committee member, plusthose who provide support to the committee and the external auditor.The review concluded that the audit committee was effective in carryingout its duties.
On behalf of the audit committee,
Sir Ian Prosser
Audit committee chairman
BOL08439_p065 pp76_BP board:20 F 5/3/10 17:32 Page 72 Bleed: 0�mm Scale: 100%

73
Board performance and biographies
Bo
ard
perfo
rman
ce a
nd
bio
gra
ph
ies
BOL08439_p065 pp76_BP board:20 F 5/3/10 17:32 Page 73 Bleed: 0�mm Scale: 100%
Safety, ethics and environment assurance committee report
This report describes the role of the safety, ethics and environmentassurance committee (SEEAC) and notes particular activities undertakenin 2009.
The role of the SEEAC requires us to look at the processesadopted by the executive management to identify and mitigate significantnon-financial risks and receive assurance that they are appropriate indesign and effective in implementation. Following the tragic incident atthe Texas City refinery in 2005 the committee has observed a number ofkey developments, including: the establishment of a safety & operations(S&O) function with the highest calibre of staff; development of a group-wide operating management system (OMS) which is being progressivelyadopted by all operating sites; the establishment of training programmesin conjunction with MIT that are teaching project management andoperational excellence; the dissemination of standard engineeringpractices throughout the group; and the formation of a highlyexperienced S&O audit team formed to assess the safety and efficiencyof operations and recommend improvements. Throughout this time the group chief executive has made safety the number one priority. The committee’s focus in S&O will now be to monitor how theseadvances are interpreted into the culture of day-to-day operations.
As in all years the committee has not focused solely on S&O. Our maintasks include:• Monitoring and obtaining assurance that the management or
mitigation of significant BP risks of a non-financial nature isappropriately addressed.
• Reviewing material to be placed before shareholders which addressBP’s environmental, safety and ethical performance and makingrecommendations to the board about their adoption and publication.
• Reviewing BP’s internal control systems as they relate to non-financialrisk.
• Reviewing reports on the group’s compliance with its code ofconduct and on the employee concerns programme (OpenTalk) as itrelates to non-financial issues.
The full list of the tasks and requirements of the SEEAC are set out inBP’s board governance principles, at www.bp.com/governance. Thecommittee reviews its tasks and processes on a regular basis and seeksto learn from the challenges and issues of the previous year when settingits future agenda. Following the committee evaluation in 2009, whichwas an integral part of the external evaluation undertaken by the board, it was concluded that the SEEAC’s tasks and requirements remainedappropriate.
Committee structureThe SEEAC comprises four non-executive directors. Sir Tom McKillop leftthe committee when he retired from the board in April. Erroll Davis, Jrjoined the SEEAC in May 2009 and will continue until his retirement inApril 2010. Paul Anderson joined in February 2010. Both bring broadexperience of the international energy industry. The committeemembership is completed by Antony Burgmans, Cynthia Carroll andmyself as chairman. Support is provided by the committee secretary,David Pearl, BP’s deputy company secretary.
In addition to its non-executive members, the committee invitesthe lead partner of the external auditors, the BP general auditor (head ofinternal audit) and the group head of safety and operations to attend eachmeeting. Meetings are also attended by relevant senior executivemanagers. Tony Hayward was the principal executive liaison with thecommittee in 2009 and led the management reporting at all sevenmeetings of the SEEAC. The chief executives of Refining and Marketing,and Exploration and Production, Iain Conn and Andy Inglis, attended toreport on topics specific to their businesses. As outlined in the report ofthe audit committee, one of SEEAC’s meetings each year is held jointlywith the audit committee to review BP’s system of internal control anddiscuss the forward programme of the internal audit function.
The committee holds private sessions without the presence ofexecutive management at the end of each meeting. This provides anopportunity to reflect on the effectiveness of each meeting and confirmactions to be pursued. Updating the wider board on the committee’sactivities and key issues is achieved through the circulation of minutesand through the verbal reports I provide as committee chairman to theboard meetings.
Attendance
SEEAC meetings SEEAC meetings eligible to attend attended
Sir William Castell (chair) 7 7A Burgmans 7 7C B Carroll 7 5E B Davis, Jr 4 3Sir Tom McKillop 3 3
Information and external adviceSEEAC receives information from external and internal sources, includingdirectly from the business segments and supporting functions such asgroup compliance and ethics, safety and operations and internal audit.During 2009 the committee’s principal external input has been providedby Duane Wilson, the independent expert (see the Independent expertsection on the following page). SEEAC can access any other independentadvice and counsel if it requires, on an unrestricted basis.
Training and visitsThe committee participated in the board’s visit to the US west coast fuelsvalue chain in September which enabled members to discuss safety,operational integrity and environmental matters first hand at a marineterminal, a refinery, an inland distribution terminal and a retail site.
The committee also visited the Projects and OperationsAcademies at MIT (described in the board report above), and participatedin working sessions with course participants. In October the committeesecretary and I visited the company’s international centre for businessand technology at Sunbury. We were briefed by the group head ofengineering and group head of operations and their teams on OMS and the standard operating and engineering practices applied within the businesses.

74
Board performance and biographies
Committee activities in 2009
SEEAC 2009 activitiesApproximate allocation of agenda time*
51%
12%
24%
13%
*Excludes time spent on site visits.
Safety, operations and environment, including reports from the independent expertRegional and functional reportsInternal audit and compliance and ethicsOther topics
Safety and operationsThe committee received regular reports from the group operations riskcommittee (GORC) including data on company-wide safety andoperational integrity performance, and was briefed on significantcompliance issues including those arising with OSHA and other USregulatory agencies. We continued to monitor progress made indeveloping robust leading and lagging indicators in process safety. Othertopics covered by the GORC and reviewed with the committee includedimproving corporate learning from safety incidents, strengthening thegroup-wide safety culture, and capability training programmes across thecompany. The committee also received a detailed briefing on the work ofthe safety and operations audit function.
North Sea helicopter incidentFollowing the tragic accident in April when a helicopter operated byBond Offshore Helicopters carrying BP sub-contractors came down inthe North Sea, Andy Inglis reviewed with the committee BP’s responseand the information emerging in interim reports from the UK Air AccidentInvestigation Branch (AAIB). Although the AAIB is yet to publish its finalreport, it is our understanding that the accident was caused by a gearboxfailure. The impact of such an incident was deeply felt by the committee.
Independent expertThe committee spent considerable time with Mr Duane Wilson who wasappointed in 2007 by the board as an independent expert to provide anobjective assessment of BP’s progress in implementing therecommendations of the BP US Refineries Independent Safety ReviewPanel (aimed at improving process safety performance at BP’s five USrefineries). Mr Wilson, who was previously a member of the panel and isindependently funded through the company secretary’s office, reportedto us at five of our meetings. The committee was advised of evidentprogress against defined programmes to improve process safetyperformance at our US refineries. However it was also recognized thatthe journey requires investment not only in engineering but in sustainingcultural change and this will take many years to complete.
Mr Wilson’s updates to the committee reflected the workplanwhich we agree with him annually and the outcomes of his visits to BP’s
US refining sites. In March 2009, he published his second annual reportwhich assessed BP’s progress against the 10 panel recommendations.Mr Wilson concluded that good progress was being made, in particularthat BP’s ‘tone at the top’ was reinforcing valuable positive messages onthe importance of process safety, that the panel’s recommendations hadbecome embedded in the planning and resource allocation processes atall US refineries and that BP’s Safety and Operations audit programmehad matured into a comprehensive, high-quality programme. Areaswhere Mr Wilson believed more attention was warranted included further reduction in overtime, for the small percentage of individualswhere this practice remained, in order to reduce the potential for fatigue,improvements to the investigation reports associated with incidentinvestigations and development of comprehensive plans for safetyinstrumented systems (SIS) for the refineries in the US.
Mr Wilson’s report was made available on BP’s website.
Regional and functional reportsIn the past year we have reviewed the company’s approach to corporatesocial responsibility by taking BP’s operations in Azerbaijan as a casestudy.
With BP operating one of the largest tanker fleets in the world wehave sought and received assurance from its chief executive regardingfleet integrity and operating standards.
During 2009 we also reviewed reports on the identification andmanagement of the group’s security risks and the progress made in HSEat TNK-BP.
Internal audit and compliance and ethicsThe committee received and discussed quarterly reports from the groupcompliance and ethics officer. Each year we review compliance with thecompany’s code of conduct and the attention devoted to enforcing astandard of acceptable behaviour on a global basis. The group chiefexecutive’s own certification is provided to the committee. Thecompliance and ethics officer also reports to the committee on theoperation of the employee concerns programme OpenTalk and the work of the US ombudsman. We are looking for further improvement in OpenTalk to be made in the coming year.
We also reviewed reports from internal audit addressing theprogramme of audits undertaken throughout the year, key audit findingsand management’s responses. These findings help focus our agendas toareas that require more attention. The committee was also briefed on theenhanced co-ordination between internal audit and other audit functionsin the group, including Safety and Operations.
Other topicsDuring the year the committee was regularly updated on the company’splans in response to a potential pandemic and in May received a reporton health risk management in the workplace. In October the committeereviewed risk evaluation and mitigation related to potential loss ofcontainment in Refining and Marketing’s logistics operations.
The committee believes, given the scale and diversity of thiscompany and recognizing that it operates primarily in hydrocarbonbusinesses, that it receives information in sufficient depth to provideoverall assurance of the management’s commitment to achieve worldclass levels of safe, reliable and compliant operations.
On behalf of the safety, ethics and environment assurance committee,
Sir William Castell
SEEAC chairman
BOL08439_p065 pp76_BP board:20 F 5/3/10 17:32 Page 74 Bleed: 0�mm Scale: 100%

75
Board performance and biographies
Bo
ard
perfo
rman
ce a
nd
bio
gra
ph
ies
BOL08439_p065 pp76_BP board:20 F 5/3/10 17:32 Page 75 Bleed: 0�mm Scale: 100%
Remuneration committee report
Structure of the committeeMembers of the remuneration committee during the year wereDr DeAnne Julius (chairman) and Sir Ian Prosser. Sir Tom McKillopstepped down from the committee when he retired from the board inApril 2009 and Erroll Davis, Jr left the committee at the end of April 2009.Antony Burgmans and George David joined the committee in May 2009.The chairman of the board attends meetings of the committee andCarl-Henric Svanberg attended meetings prior to becoming chairman on1 January 2010.
AttendanceThe committee met eight times during 2009:
Remuneration committee Remuneration committeemeetings eligible to attend meetings attended
Dr D S Julius (Chair) 8 8A Burgmans 6 5G David 6 6E B Davis, Jr 2 2Sir Tom McKillop 2 2Sir Ian Prosser 8 8
Role and authority of the committeeThe committee determines on behalf of the board the terms ofengagement and remuneration of the group chief executive and executive directors and reports on these to shareholders. It also makes recommendations to the board regarding the chairman’sremuneration. The committee is independently advised.
Further details on the committee’s role, authority and activitiesduring the year are set out in the directors’ remuneration report, which isthe subject of a vote by shareholders at the 2010 AGM.
On behalf of the remuneration committee,
Dr DeAnne Julius
Remuneration committee chairman
Nomination committee report
This has been a very active year for the committee which has met15 times.
The main tasks of the committee are:• Identifying, evaluating and recommending candidates for the
appointment or re-appointment as directors.• Identifying, evaluating and recommending candidates for
appointment as company secretary.• Keeping under review the mix of knowledge, skills and experience of
the board to ensure an orderly succession of directors.• Reviewing the outside directorships and broader commitments of the
non-executive directors.
Committee structureThe committee is comprised of the chairman and the chairs of the SEEAC,audit and remuneration committees. During the year, Peter Sutherland,Sir William Castell, Sir Ian Prosser and Dr DeAnne Julius were members.After his appointment on 1 September, Carl-Henric Svanberg has attendedmeetings of the committee. Dr Hayward has also attended certainmeetings of the committee during the year.
AttendanceNomination committee meetings Nomination committee
eligible to attend meetings attended
P D Sutherland 15 12Sir William Castell 15 14Sir Ian Prosser 15 15D S Julius 15 14
The work of the committee during the year has been focused on two areas:
1. The completion of the process for the selection of a successor toPeter Sutherland as chairman.Sir Ian Prosser chaired the committee in this activity. After anintensive process involving two external search consultants,Carl-Henric Svanberg was selected as the next chairman in June2009. He became a non-executive director on 1 September 2009 andtook the chair on 1 January 2010.
2. The continuing refreshment of the board.During the year the committee has reviewed the skills needed for the board against the competences and experience of the currentdirectors. Sir Tom McKillop retired from the board in April and Sir IanProsser and Erroll Davis, Jr will retire at the next AGM. In the secondhalf of the year, the focus has been on refreshing the board andidentifying a number of candidates available to join the board in theshort and medium term. Two non-executive director appointmentswere made in early 2010 following this process: Paul Anderson inFebruary and Ian Davis in March to take effect in April. This work willcontinue as Dr Julius retires in 2011.
On behalf of the nomination committee,
Carl-Henric Svanberg
Chairman

76
Board performance and biographies
–
BOL08439_p065 pp76_BP board:20 F 5/3/10 17:32 Page 76 Bleed: 0�mm Scale: 100%
Chairman’s committee report
The committee met five times in 2009.
Committee structureThe chairman’s committee consists of the chairman and all the non-executive directors.
AttendanceChairman’s committee meetings Chairman’s committee
eligible to attend meetings attended
P D Sutherland 5 3Sir Ian Prosser 5 5A Burgmans 5 5C B Carroll 5 5Sir William Castell 5 4G David 5 5E B Davis, Jr 5 5D J Flint 5 5D S Julius 5 5Sir Tom McKillop 1 1C-H Svanberg 2 2
The main tasks of the committee are:• Evaluating the performance and effectiveness of the group chief
executive.
• Reviewing the structure and effectiveness of the businessorganization of BP.
• Reviewing the systems for senior executive development anddetermining the succession plan for the group chief executive,executive directors and other senior members of executivemanagement.
• Determining any other matter which is appropriate to be consideredby all of the non-executive directors.
• Opining on any matter referred to it by the chairman of anycommittee comprised solely of non-executive directors.
Committee activitiesDuring the year, the committee reviewed:• The performance of the group chief executive and with him, the
performance of the other executive directors.• The performance of the chairman.• The succession plan for the executive team and any development issues.Dr Hayward attended a number of meetings of the committee andconsidered with the committee his response to the strategic andoperational challenges facing the group and their implication for theevaluation of the senior management team. Corporate culture and ‘tonefrom the top’ also remain an area of active discussion.
On behalf of the chairman’s committee,
Carl-Henric Svanberg
Chairman
Directors’ interests
Change from31 Dec 2009
Current directors At 31 Dec 2009 At 1 Jan 2009 to 18 Feb 2010
A Burgmans 10,156 10,000 –C B Carroll 10,500b –Sir William Castell 82,500 82,500 –I C Conn 293,216a 240,789a 56,604G David 39,000b 9,000b –E B Davis, Jr 76,497b 73,185b –D J Flint 15,000 15,000 –Dr B E Grote 1,291,643c 1,214,330c 59,886Dr A B Hayward 535,383 488,459 87,424A G Inglis 259,163d 226,175d 49,476Dr D S Julius 15,000 15,000 –Sir Ian Prosser 16,301 16,301 –Directors leaving the board At resignation/retirement At 1 Jan 2009
Sir Tom McKillop 20,000e 20,000P D Sutherland 30,906f 30,906
Change from31 Dec 2009
Directors joining the board At 31 Dec 2009 On appointment to 18 Feb 2010
P Anderson – 6,000b g –R W Dudley 276,846 269,746b h –C-H Svanberg – –i 750,000
a Includes 47,320 shares held as ADSs at 31 December 2009 and 44,158 shares held as ADSs at 1 January 2009.bHeld as ADSs.cHeld as ADSs, except for 94 shares held as ordinary shares.d Includes 34,962 shares held as ADSs.eOn retirement at 16 April 2009.fOn retirement at 31 December 2009.gOn appointment at 1 February 2010.hOn appointment at 6 April 2009.iOn appointment at 1 September 2009.
The above figures indicate and include all the beneficial and non-beneficial interests of each director of the company in shares of thecompany (or calculated equivalents) that have been disclosed to thecompany under the Disclosure and Transparency Rules as at theapplicable dates.
Executive directors are also deemed to have an interest in such shares ofthe company held from time to time by the BP Employee Share OwnershipPlan (No.2) to facilitate the operation of the company’s option schemes.
No director has any interest in the preference shares or debenturesof the company or in the shares or loan stock of any subsidiary company.

Dire
cto
rs’re
mu
nera
tion
rep
ort
Directors’remuneration report
78 Part 1 Summary
80 Part 2 Executive directors’remuneration
87 Part 3 Non-executive directors’remuneration
BOL08439_p077 pp88_rem_rep:20 F 5/3/10 17:32 Page 77 Bleed: 0�mm Scale: 100%

Directors’ remuneration report
Part 1 SummaryIn a volatile year for the world economy, the BP executive team producedexcellent results. While salaries were frozen for all directors in 2009, thevariable performance-related pay reflected the impressive achievementsof the year and the turnaround of performance over the past three years.The details of executive director remuneration are set out in the table onthe opposite page.
The remuneration committee sets the measures and targets forthe annual bonus element of variable pay at the beginning of the year,based on the strategy and annual plan accepted by the board. Thestrategy is built around safety, people and performance. The measuresincluded key safety measures (15% of bonus), staff numbers and surveyresults to reflect the people priorities (15%) and a set of financial andoperational targets to measure performance (70%). Nearly all targetswere exceeded, some substantially, with particularly strong performanceon cost reduction, exploration success, production start-ups and refiningperformance. This overall excellent performance was also reflected in themarket, where BP shareholders recorded the highest total shareholderreturn (TSR) of all the oil majors for the year.
The other element of variable pay is awarded in shares based onBP’s performance over three years, compared with the other oil majors.Following the process approved by shareholders in the ExecutiveDirectors’ Incentive Plan (EDIP), the committee first reviews the three-year TSR of BP compared with its peers and then considers a set ofunderlying business metrics, again in comparison with peers. When thereis a difference between the two comparisons, the committee decideswhich level of vesting best represents BP’s relative three-yearperformance. This year the TSR result was tightly clustered and sensitiveto calculation methodology. For example, based on a three-monthaveraging of endpoints, BP came fourth whereas on a one-monthaveraging it came second. On underlying metrics, BP ranked first on fourof the six reviewed (production growth, earnings per share growth,change in return on average capital employed and free cash flow) andsecond or third on the others (Refining and Marketing earnings per barrel
and net income growth). Following the process set out in the EDIP, thecommittee judged BP to be tied for third place and thus shared thevesting outcome for third and fourth place to result in a vesting of 17.5%of the maximum award.
During the year the committee conducted a full review of BP’sremuneration policy, and particularly the EDIP, which is being put beforeshareholders for renewal this year. We consulted with a number of ourshareholders, reviewed the actual experience with applying EDIP rulesover the past five years and considered recent developments in themarketplace. Overall we concluded that the basic structure of the EDIPremains appropriate, but that some rebalancing of elements is warranted.The key change we propose is to require a portion of the annual bonus tobe deferred, paid in shares and matched after three years subject to anassessment of safety and environmental sustainability over the three-year period. This change would place more focus on the long term,highlight the importance of safety and build a larger equity stake forexecutives that we believe aligns their interests well with shareholders.To balance this additional bonus element, we propose to reduce themaximum award of performance shares in the renewed EDIP so as tomaintain the current quantum of total remuneration. These changes aresummarized in the table below.
It has been an excellent year for BP and its shareholders. Indetermining annual and long-term awards, the committee has recognizedthe very real achievements of the executive team. For the future, webelieve our revised EDIP provides a sound framework with which tocompetitively reward our top executives for continued success in thislong-term business.
Dr DeAnne S Julius
Chairman, Remuneration Committee 26 February 2010
78
Summary of future remuneration components
Salary • Normally reviewed mid-year (no increases in 2009). Current salaries: Dr Hayward £1,045,000, Mr Conn £690,000, Mr Dudley $1,000,000, Dr Grote $1,380,000, Mr Inglis £690,000.
Bonus • On-target bonus of 150% of salary and maximum of 225% of salary based on performance relative to targets set at start of year relating to financial and operational metrics.
Deferred bonus and • One-third of actual bonus awarded as shares with three-year deferral, with ability to voluntarily defer an additionalmatch one-third.
• All deferred shares matched one-for-one, both subject to an assessment of safety and environmental performance overthe three-year period.
Performance shares • Following EDIP renewal, award of shares of up to 5.5 times salary for group chief executive, 4.75 times for the chiefexecutive of Exploration and Production, and 4 times for other executive directors.
• Vesting after three years based on performance relative to other oil majors.• Three-year retention period after vesting before release of shares.
Pension • Final salary scheme appropriate to home country of executive.
BOL08439_p077 pp88_rem_rep:20 F 5/3/10 17:32 Page 78 Bleed: 0�mm Scale: 100%

79
Directors’ remuneration report
Dire
cto
rs’ re
mu
nera
tion
rep
ort
BOL08439_p077 pp88_rem_rep:20 F 5/3/10 17:32 Page 79 Bleed: 0�mm Scale: 100%
Summary of remuneration of executive directors in 2009a
Annual remuneration Long-term remuneration
Share element of EDIP
2006-2008 plan 2007-2009 plan 2009-2011(vested in Feb 2009) (vested in Feb 2010) plan
Annual Non-cash benefits and PotentialSalaryb performance bonus other emoluments Total Actualc Actualc maximum
(thousand) (thousand) (thousand) (thousand) shares Valued shares Valuee performance2008 2009 2008 2009 2008 2009 2008 2009 vested (thousand) vested (thousand) sharesf
Dr A B Hayward £998 £1,045 £1,496 £2,090 £15 £23 £2,509 £3,158 66,136 £336 147,985 £852 1,182,540I C Conn £670 £690 £871 £1,104 £45 £46 £1,586 £1,840 66,136 £336 95,697 £551 780,816R W Dudleyg h n/a $750 n/a $1,125 n/a $304i n/a $2,179 n/a n/a n/a n/a 539,634Dr B E Groteg $1,340 $1,380 $1,742 $2,070 $8 $8 $3,090 $3,458 80,231 $603 101,502e $933 992,928A G Inglis £670 £690 £1,173 £1,311 £212 £216j i £2,055 £2,217 54,994 £279 83,859 £483 780,816
Amounts shown are in the currency received by executive directors. Annual bonuses are shown in the year they were earned.
aThis information has been subject to audit.bFigures show the total salary received during the calendar year. The last salary increase was in July 2008.c Includes shares representing reinvested dividends received on the shares that vested at the end of the performance period.dBased on market price on vesting date (£5.08 per share/$45.13 per ADS).eBased on market price on vesting date (£5.76 per share/$55.17 per ADS).fMaximum potential shares that could vest at the end of the three-year period depending on performance.gDr Grote and Mr Dudley hold shares in the form of ADSs. The above number reflects calculated equivalent in ordinary shares.hReflects remuneration received by Mr Dudley since appointment as executive director on 6 April 2009.i This amount includes costs of London accommodation and any tax liability thereon.j In addition to this amount, under a tax equalization arrangement, BP discharged a US tax liability arising from the participation by Mr Inglis in the UK pension scheme amounting to $90,314.
Historical TSR performance
04
Valu
e of
hyp
othe
tical
£10
0 ho
ldin
g
05 06 07 08 09
250
200
150
100
50
FTSE 100BP
This graph shows the growth in value of a hypothetical £100 holding in BP p.l.c. ordinary shares over five years, relative to the FTSE 100 Index (of which the company is a constituent). The values of the hypothetical £100 holdings at the end of the five-year period were £141.75 and£134.58 respectively.
Remuneration of non-executive directors in 2009a
£ thousand
2008 2009
P D Sutherland 600 600
A Burgmans 90 93
Sir William Castell 108 115
C B Carroll 93 90
G Davidb 100 118
E B Davis, Jr 105 105
D J Flint 90 85
Dr D S Julius 110 105
Sir Ian Prosser 170 165
C-H Svanbergc n/a 30
Directors leaving the board in 2009Sir Tom McKillop 95 33
a This information has been subject to audit.b Also received £4,166 for serving as a member of BP’s technology advisory committee.c Appointed on 1 September 2009.
While fees were held at 2008 levels, in 2009 actual fees paid tonon-executive directors were affected by changes in committeemembership and the number of transatlantic meetings for which anattendance allowance was paid.
In 2009 the chairman reviewed non-executive directorremuneration taking into account the review completed in 2008.The chairman made a recommendation to the board (which wasagreed) to maintain the 2008 structure until a further review in 2010.

Part 2 Executive directors’ remuneration
2009 remuneration
Salary
Executive directors have had no salary increases since July 2008, withthe exception of Mr Dudley who was appointed to the board in April2009. Dr Hayward’s salary remains £1,045,000, Mr Conn’s £690,000,Mr Dudley’s $1,000,000, Dr Grote’s $1,380,000, and Mr Inglis’s £690,000.
Annual bonus
The annual bonus awards for 2009 reflect the excellent performanceachieved across the business and are set out in the table on page 79.
Performance measures and targets were set at the beginning ofthe year based on the group’s annual plan. Group results formed thebasis for Dr Hayward’s, Mr Dudley’s and Dr Grote’s annual bonus andwere weighted 70% on financial and operating results (including profit,cash flow, cash costs, production, reserves replacement, Refining andMarketing profitability, refining availability, and installed wind capacity),15% on safety (both metrics and progress on plans), and 15% on people(including organizational changes and employee attitudes). Mr Conn’s andMr Inglis’s annual bonuses were based 50% on the group results asabove, and 50% on their respective business unit results (also a mix offinancial, operating, safety and people measures). The target level ofbonus for executive directors was 120% of salary with committeejudgement to award up to 150% for exceeding targets and above thatlevel to recognize exceptional performance.
Targets were exceeded on virtually all key measures during 2009,a number by a substantial margin and resulting in bonuses averaging170% of salary.
All key safety and operating metrics (including days away fromwork case frequency (DAFWCF), recordable injury frequency (RIF), oilspills, loss of primary containment, and process safety high potentialincidents) showed good results and significant improvements in all casesfrom 2008. Implementation of the operating management system (OMS)progressed ahead of plan and is now successfully installed at70 operating entities including all major downstream sites. Peoplemetrics were also exceeded. Major organizational restructuring wascompleted including reducing the number of group leaders and seniorlevel leaders in excess of plan. The employee survey results showedsignificant improvement in key aspects such as safety and complianceand performance culture, as well as overall employee satisfaction.
Exceptional results were achieved on financial and operatingmeasures. Replacement cost profit was some $5 billion above plan afteradjusting for the oil price and other environmental factors. Cash costswere reduced substantially. Production increased by more than 4% whileunit production costs reduced by 12%. The reserves replacement ratiowas 129%, continuing an industry-leading peformance. Refining andMarketing cash costs were reduced by 15%, and refining availabilityincreased to 94%. Refining and Marketing profitability exceeded planafter adjusting for a dramatically weaker industry environment.Exploration and Production achieved major project start-ups in the Gulf ofMexico, Indonesia and Trinidad & Tobago. Exploration successes includedthe Tiber discovery in the Gulf of Mexico and new access for futuregrowth was secured in Iraq, Indonesia and Jordan as well as newacreage in the Gulf of Mexico.
The excellent results achieved during 2009 reflect the strongleadership of the executive team and their continuing focus on safety,people and performance.
2007-2009 share element
This momentum of improvement is also apparent over the three-yearperformance period covered by the 2007-2009 share element under theEDIP. Performance for the share element is assessed relative to theother oil majors – ExxonMobil, Shell, Total and Chevron. The committeefollows the assessment process approved by shareholders indetermining the vesting of shares that had been awarded at the start of2007. It first compares the total shareholder return (TSR) of each of themajors and then reviews underlying performance metrics across thesame group. Given the small peer group, similarity of their businesses,and general imperfections in measurement, there will be occasions whenresults of some or all of the companies are tightly clustered. In suchcircumstances, a small difference in TSR performance or calculationmethodology could produce a large, and inappropriate, difference investing level. To counter this the committee has the obligation to reviewboth relative TSR and underlying performance to ensure a balancedjudgement is made. Such was the case with regard to the 2007-2009metrics.
The TSR result was tightly clustered for 2007-2009 with BPcoming fourth based on our established methodology but very close tothird place. As required by the plan, the committee reviewed a number offinancial and operating metrics to assess relative underlyingperformance. These included the average change over the three years ofEPS, ROACE, free cash flow, net income, production growth and Refiningand Marketing profitability. The review of underlying performance showedBP in a strong relative position. BP came first on change in EPS growth,ROACE, free cash flow and production, on adjusted net income BPranked second and on Refining and Marketing profitability it came third.Based on the full review and combining both the TSR and underlyinganalysis, the committee judged BP to be tied for third place and thusshared the vesting outcome for third and fourth place (35% and 0%respectively) as set out in the plan rules. The resulting 17.5% vesting foreligible participants is also shown in the table on page 79.
Remuneration policy review
During 2009 the committee carried out a comprehensive review of itsremuneration policy for executive directors. The review covered allcomponents of remuneration, both fixed and variable, short term andlong term. It focused especially on the EDIP which provides theframework for long-term, variable pay. The current EDIP was approved byshareholders in 2005 and will expire in April 2010, when a renewal will beput to shareholder vote. As part of its review the committee met withkey shareholders to assess the current pay structure and test areas forchange.
The basic principles that guide remuneration policy for executivedirectors in BP formed the starting point for the review. These include:• A substantial portion of executive remuneration should be linked to
success in implementing the company’s business strategy tomaximize long-term shareholder value.
• Executives should develop and be required to hold a significantshareholding as this represents the best way to align their interestswith those of shareholders.
• The structure of pay should reflect the long-term nature of BP’sbusiness and the significance of safety and environmental risks.
• Performance conditions for variable pay should be set independentlyby the committee at the outset of each year and assessed by thecommittee both quantitatively and qualitatively at the end of eachperformance period.
• Performance assessment should take into account material changesin the market environment (predominantly oil prices) and BP’scompetitive position (primarily vis-à-vis other oil majors).
80
Directors’ remuneration report
BOL08439_p077 pp88_rem_rep:20 F 5/3/10 17:32 Page 80 Bleed: 0�mm Scale: 100%

81
Directors’ remuneration report
Dire
cto
rs’ re
mu
nera
tion
rep
ort
• Salaries should be reviewed annually, in the context of the totalquantum of pay, and taking into account both external market andinternal company conditions.
• The remuneration committee will actively seek to understandshareholder preferences and be as transparent as possible inexplaining its remuneration policy and practices.
The committee’s review concluded that the basic structure of fixed andvariable pay remains appropriate. The EDIP gives the committee a rangeof tools, within an overall framework approved by shareholders, withwhich to construct remuneration packages that are tailored to thecompany’s business objectives each year and are calibrated to achievethe desired linkage between performance and pay.
While the basic structure of the EDIP remains appropriate, thecommittee concluded that three of its features should be revised. First,with respect to the annual bonus, a new element should be added torequire one-third of the bonus to be deferred for three years and paid inshares rather than cash. At the end of this three-year period, subject toan assessment of safety and environmental sustainability, the deferredbonus would be matched with additional shares on a one-for-one basis.Executives would also have the opportunity to defer an additional one-third of their annual bonus on this basis.
Second, with respect to the long-term performance shareelement, the maximum number of shares should be reduced to offsetthe more generous annual bonus and deferred element in the revisedEDIP and thereby keep the total quantum of remuneration roughlyconstant.
Third, the current EDIP includes a provision for discretionary cashpayments which has never been used. This provision will be omitted fromthe revised EDIP.
Detail of elements of remuneration
The majority of total remuneration is long term and varies withperformance, with the largest elements share based, further aligninginterests with shareholders.
Salary
The committee normally reviews salaries annually, taking into accountother large Europe-based global companies as well as relevant UScompanies. These groups are each defined and analysed by thecommittee’s independent remuneration advisers.
Annual bonus
The committee sets bonus targets and levels of eligibility each year for allexecutive directors. For the 2010 bonus, the committee has adjustedbonus levels and structure of payment, as part of the wider rebalancingof the remuneration mix.
The on-target bonus level for 2010 is 150% of salary with themaximum of 225% of salary. This was changed from the target for 2009referred to earlier.
Group results will be determined based on six metrics comprisingsafety, people and four performance-related measures including:
• Group replacement cost profits.• Cash costs.• Production and reserves replacement.• Refining and Marketing income per barrel.
Dr Hayward’s and Mr Dudley’s bonus will be based on group results.
Mr Conn, Dr Grote and Mr Inglis will have 70% of their bonus basedon the above group results and 30% on the results of their respectivebusiness segments as measured by key performance metrics andmilestones set out in the annual plan. For Exploration and Production,these include production costs and reserves replacement as well assafety and new opportunities. For Finance, they focus on specificbusiness and cost targets. For Refining and Marketing, they includerefining availability, earnings and cash costs, as well as safety andwork simplification.
The committee will also review carefully the underlyingperformance of the group in light of company business plans and willlook at competitors’ results, analysts’ reports and the views of thechairmen of other BP board committees when assessing results.
The committee can decide to reduce bonuses where this iswarranted and, in exceptional circumstances, bonuses can be reduced to zero.
Deferred bonus
One-third of the annual bonus will be deferred into shares for three yearsand matched by the company on a one-for-one basis. Both deferred andmatched shares will vest contingent on an assessment of safety andenvironmental sustainability over the three-year deferral period. If thecommittee assesses that there has been a material deterioration insafety and environmental metrics, or there have been major incidentsrevealing underlying weaknesses in safety and environmentalmanagement, then it may conclude that shares should vest in part, or notat all. In reaching its conclusion, the committee will obtain advice fromthe safety, ethics and environment assurance committee (SEEAC).
Executive directors may voluntarily defer a further one-third oftheir annual bonus into shares, which will be capable of vesting, andwill qualify for matching, on the same basis as set out above.
Where shares vest, the executive director will receive additionalshares representing the value of the reinvested dividends.
This structure of deferred bonuses, paid in shares, placesincreased focus on long-term alignment and reinforces the criticalimportance of maintaining high safety and environmental standards.
Performance shares
The share element of the EDIP has been a feature of the plan, with somemodifications, since its inception in 2000. To reflect the introduction ofthe deferred matching element, the maximum number of shares that canbe awarded will be reduced from 7.5 times salary to 5.5 times salary forthe group chief executive and from 5.5 times salary to 4.75 times salaryfor the chief executive of Exploration and Production, and to four timessalary for the other executive directors.
Performance shares will only vest to the extent that aperformance condition is met, as described below. In addition, thecommittee will have an overriding discretion, in exceptionalcircumstances (relating to either the company or a particular participant) to reduce the number of shares that vest (or to provide thatno shares vest).
The compulsory retention period will also be decided by thecommittee and will not normally be less than three years. Together withthe performance period, this gives executive directors a six-year incentivestructure, which is designed to ensure their interests are aligned withthose of shareholders.
Where shares vest, the executive director will receive additionalshares representing the value of the reinvested dividends.
The committee’s policy, reflected in the EDIP, continues to bethat each executive director builds a significant personal shareholding,with a target of shares equivalent in value to five times salary, within areasonable time from appointment as an executive director.
BOL08439_p077 pp88_rem_rep:20 F 5/3/10 17:32 Page 81 Bleed: 0�mm Scale: 100%

82
Directors’ remuneration report
Performance conditionsPerformance conditions for the 2010-12 share element will continue thestructure used in the 2009-2011 plan.
Vesting of shares will be based, as to one-third, on BP’s TSRcompared with other oil majors over a three-year period and as totwo-thirds, on a balanced scorecard of underlying performance. BP’sTSR performance will be compared with the other oil majors –ExxonMobil, Shell, Total, ConocoPhillips and Chevron. This comparisongroup can be altered if circumstances change, for example, if there issignificant consolidation or change in the industry. While this comparisongroup is narrow, it is used by both management and shareholders inassessing BP’s comparative TSR performance.
The inclusion of relative TSR is an appropriate way of measuringperformance for the purposes of a long-term incentive for executivedirectors as it reflects the creation of shareholder value while minimizingthe impact of sector specific events such as the oil price. TSR iscalculated as share price performance over the relevant period, assumingdividends are reinvested. All share prices are averaged over the three-month period before the beginning and end of the performance period.They are measured in US dollars.
The balanced scorecard will be assessed by the committee onthree measures reflecting key priorities in BP’s strategy, productiongrowth, Refining and Marketing profitability and group underlying netincome. Both production growth and Refining and Marketing profitabilityare key strategic objectives for the group and key drivers of value forshareholders. Group underlying net income acts as a holistic measure ofsuccess reflecting revenues, costs and complexity as well as safe andreliable operations. The three underlying measures will be averaged toform the balanced scorecard component.
All the above measures will be compared with the other oilmajors to determine the overall vesting result. The methodology usedwill rank each of the five other majors on each of the measures. BP’sperformance will then be compared on an interpolated basis relative tothe performance of the other five. Performance shares will vest at 100%,70% and 35% for performance equivalent to first, second and third rankrespectively and none for fourth or fifth place. For performance betweensecond and third or first and second, the result will be interpolated basedon BP’s performance relative to the company ranked directly above andbelow it.
The committee considers that this combination of measuresprovides a good balance of external as well as internal metrics reflectingboth shareholder value and operating priorities. As in previous years, thecommittee may exercise its discretion, in a reasonable and informedmanner, to adjust vesting levels upwards or downwards if it concludesthe quantitative approach does not reflect the true underlying health andperformance of BP’s business relative to its peers. It will explain anyadjustments in the next directors’ remuneration report following thevesting, in line with its commitment to transparency.
In exceptional recruitment circumstances, the committee mayaward performance shares that are subject to a requirement of continuedservice over a specified period, rather than a corporate performancecondition.
Pensions
Executive directors are eligible to participate in the appropriate pensionschemes applying in their home countries. Details are set out in the tableon page 83.
UK directorsUK directors are members of the regular BP Pension Scheme. The corebenefits under this scheme are non-contributory. They include a pensionaccrual of 1/60th of basic salary for each year of service, up to amaximum of two-thirds of final basic salary and a dependant’s benefit oftwo-thirds of the member’s pension. The scheme pension is notintegrated with state pension benefits.
The rules of the BP Pension Scheme were amended in 2006 suchthat the normal retirement age is 65. Prior to 1 December 2006, schememembers could retire on or after age 60 without reduction. Special earlyretirement terms apply to pre-1 December 2006 service for memberswith long service as at 1 December 2006.
Pension benefits in excess of the individual lifetime allowance setby legislation are paid via an unapproved, unfunded pension arrangementprovided directly by the company.
Although Mr Inglis is, like other UK directors, a member of the BPPension Scheme, he is currently based in Houston, US. His participationin the BP Pension Scheme gives rise to a US tax liability. During 2009, thecommittee approved the discharge of this US tax liability under a taxequalization arrangement amounting to $90,314.
US directorsDr Grote and Mr Dudley participate in the US BP RetirementAccumulation Plan (US plan) which features a cash balance formula.Pension benefits are provided through a combination of tax-qualified andnon-qualified benefit restoration plans, consistent with US tax regulationsas applicable.
The Supplemental Executive Retirement Benefit (supplementalplan) is a non-qualified top-up arrangement that became effective on1 January 2002 for US employees above a specified salary level. Thebenefit formula is 1.3% of final average earnings, which comprise basesalary and bonus in accordance with standard US practice (and asspecified under the qualified arrangement), multiplied by years of service.There is an offset for benefits payable under all other BP qualified andnon-qualified pension arrangements. This benefit is unfunded andtherefore paid from corporate assets.
Dr Grote and Mr Dudley are eligible to participate underthe supplemental plan. Their pension accrual for 2009, shown in thetable below, includes the total amount that could become payableunder all plans.
Other benefits
Executive directors are eligible to participate in regular employeebenefit plans and in all-employee share saving schemes applying intheir home countries. Benefits in kind are not pensionable. BP providesaccommodation in London for both Mr Inglis and Mr Dudley.
BOL08439_p077 pp88_rem_rep:20 F 5/3/10 17:32 Page 82 Bleed: 0�mm Scale: 100%

83
Directors’ remuneration report
Dire
cto
rs’ re
mu
nera
tion
rep
ort
BOL08439_p077 pp88_rem_rep:20 F 5/3/10 17:32 Page 83 Bleed: 0�mm Scale: 100%
Pensionsa
thousand
Additional pensionAccrued pension earned during the Transfer value of Transfer value of Amount of B-A less
Service at entitlement year ended accrued benefitc accrued benefitc contributions made by31 Dec 2009 at 31 Dec 2009 31 Dec 2009b at 31 Dec 2008 (A) at 31 Dec 2009 (B) the director in 2009
Dr A B Hayward (UK) 28 years £584 £23 £8,045 £10,840 £2,743I C Conn (UK) 24 years £276 £12 £3,161 £4,508 £1,347R W Dudley (US)d 30 years $406 $106 $2,994 $4,353 $1,358Dr B E Grote (US) 30 years $1,011 $143 $11,220 $12,047 $827A G Inglis (UK) 29 years £337 £12 £4,399 £6,000 £1,601
aThis information has been subject to audit.bAdditional pension earned during the year includes an inflation increase of 0.9% for UK directors and 0% for US directors.cTransfer values have been calculated in accordance with guidance issued by the actuarial profession.dFigures represent period after joining the board on 6 April 2009.

Directors’ remuneration report
BOL08439_p077 pp88_rem_rep:20 F 5/3/10 17:32 Page 84 Bleed: 0�mm Scale: 100%
84
Performance share element of EDIPa
Share element interests Interests vested in 2009 and 2010
Market price Potential maximum performance sharesb
of each shareDate of at date of award Number of Market price
award of of performance ordinary of each sharePerformance performance shares At 1 Jan Awarded At 31 Dec shares Vesting at vesting
period shares £ 2009 2009 2009 vestedc date £
Dr A B Hayward 2006-2008 16 Feb 2006 6.54 383,200 – – 66,136 6 Feb 2009 5.082007-2009 06 Mar 2007 5.12 706,311 – 706,311 147,985 3 Feb 2010 5.762008-2010 13 Feb 2008 5.61 845,319 – 845,319 – – –2009-2011 11 Feb 2009 5.10 – 1,182,540 1,182,540 – – –
I C Conn 2006-2008 16 Feb 2006 6.54 383,200 – – 66,136 6 Feb 2009 5.082007-2009 06 Mar 2007 5.12 456,748 – 456,748 95,697 3 Feb 2010 5.762008-2010 13 Feb 2008 5.61 578,376 – 578,376 – – –2008-2011d 13 Feb 2008 5.61 133,452 – 133,452 – – –2008-2013d 13 Feb 2008 5.61 133,452 – 133,452 – – –2009-2011 11 Feb 2009 5.10 – 780,816 780,816 – – –
R W Dudleye 2009-2011 6 May 2009 5.00 – 539,634 539,634 – – –Dr B E Grotee 2006-2008 16 Feb 2006 6.54 470,432 – – 80,231 6 Feb 2009 5.08
2007-2009 06 Mar 2007 5.12 491,640 – 491,640 101,502 3 Feb 2010 5.762008-2010 13 Feb 2008 5.61 581,748 – 581,748 – – –2009-2011 11 Feb 2009 5.10 – 992,928 992,928 – – –
A G Inglis 2006-2008 27 Mar 2006 6.59 325,750 – – 54,994 6 Feb 2009 5.082007-2009 06 Mar 2007 5.12 400,243 – 400,243 83,859 3 Feb 2010 5.762008-2010 13 Feb 2008 5.61 578,376 – 578,376 – – –2008-2011d 13 Feb 2008 5.61 133,452 – 133,452 – – –2008-2013d 13 Feb 2008 5.61 133,452 – 133,452 – – –2009-2011 11 Feb 2009 5.10 – 780,816 780,816 – – –
Former directorsDr D C Allen 2006-2008 16 Feb 2006 6.54 383,200 – – 34,518 6 Feb 2009 5.08
2007-2009 06 Mar 2007 5.12 456,748 – 456,748 47,848 3 Feb 2010 5.76
aThis information is subject to audit.bBP’s performance is measured against the oil sector. For awards under the 2006-2008 through 2008-2010 plans, the performance condition is TSR measured against ExxonMobil, Shell, Total and Chevron.
For awards under the 2009-2011 plan, performance conditions are measured 50% on TSR against ExxonMobil, Shell, Total, ConocoPhillips and Chevron and 50% on a balanced scorecard of underlyingperformance. Each performance period ends on 31 December of the third year.
cRepresents awards of shares made at the end of the relevant performance period based on performance achieved under rules of the plan and includes reinvested dividends on the shares awarded. dRestricted award under share element of EDIP. As reported in the 2007 directors’ remuneration report in February 2008, the committee awarded both Mr Inglis and Mr Conn restricted shares, as set outabove.These one-off awards will vest on the third and fifth anniversary of the award, dependent on the remuneration committee being satisfied as to their personal performance at the date of vesting.Any unvested tranche will lapse in the event of cessation of employment with the company.
eDr Grote and Mr Dudley receive awards in the form of ADSs. The above numbers reflect calculated equivalents in ordinary shares.

Directors’ remuneration report
Dire
cto
rs’ re
mu
nera
tion
rep
ort
BOL08439_p077 pp88_rem_rep:20 F 5/3/10 17:32 Page 85 Bleed: 0�mm Scale: 100%
85
Share optionsa
Market price Date fromOption At 31 Dec Option at date of which first
type At 1 Jan 2009 Granted Exercised 2009 price exercise exercisable Expiry date
Dr A B Hayward SAYE 3,220 – – 3,220 £5.00 01 Sep 2011 29 Feb 2012EXEC 34,000 – – 34,000 £5.99 15 May 2003 15 May 2010EXEC 77,400 – – 77,400 £5.67 23 Feb 2004 23 Feb 2011EXEC 160,000 – – 160,000 £5.72 18 Feb 2005 18 Feb 2012EDIP 220,000 – 220,000 – £3.88 £5.88 17 Feb 2004 17 Feb 2010EDIP 275,000 – – 275,000 £4.22 25 Feb 2005 25 Feb 2011
I C Conn SAYE 1,186 – 1,186 – £3.86 £5.74 01 Sep 2009 28 Feb 2010SAYE 1,498 – – 1,498 £4.41 01 Sep 2010 28 Feb 2011SAYE 617 – – 617 £4.87 01 Sep 2011 01 Feb 2012SAYE – 605 – 605 £4.20 01 Sep 2012 28 Feb 2013EXEC 72,250 – – 72,250 £5.67 23 Feb 2004 23 Feb 2011EXEC 130,000 – – 130,000 £5.72 18 Feb 2005 18 Feb 2012
R W Dudleyb c BP SOP 1,800 – – 1,800 $48.94 28 Mar 2003 27 Mar 2010BP SOP 6,460 – – 6,460 $49.65 23 Feb 2004 22 Feb 2011BP SOP 1,073 – – 1,073 $43.82 17 Dec 2004 16 Dec 2011BP SOP 17,835 – – 17,835 $48.99 18 Feb 2005 17 Feb 2012BP SOP 17,835 – – 17,835 $38.10 17 Feb 2006 16 Feb 2013
Dr B E Groteb BPA 10,404 – – –d $53.90 15 Mar 2000 14 Mar 2009BPA 12,600 – – 12,600 $48.94 28 Mar 2001 27 Mar 2010
EDIP 58,173 – – –d $48.82 18 Feb 2003 18 Feb 2009EDIP 58,173 – 45,000 13,173e $37.76 $57.28-$59.50 17 Feb 2004 17 Feb 2010EDIP 58,333 – – 58,333 $48.53 25 Feb 2005 25 Feb 2011
A G Inglis SAYE 4,550 – 4,550 – £3.50 £4.86 01 Sep 2008 28 Feb 2009EXEC 72,250 – – 72,250 £5.67 23 Feb 2004 22 Feb 2011EXEC 119,000 – – 119,000 £5.72 18 Feb 2005 17 Feb 2012EXEC 119,000 – – 119,000 £3.88 17 Feb 2006 16 Feb 2013EXEC 100,500 – – 100,500 £4.22 25 Feb 2007 24 Feb 2014
The closing market prices of an ordinary share and of an ADS on 31 December 2009 were £6.00 and $57.97 respectively.During 2009, the highest market prices were £6.09 and $59.93 respectively and the lowest market prices were £4.05 and $34.14 respectively.
BPA = BP Amoco share option plan, which applied to US executive directors prior to the adoption of the EDIP. EDIP = Executive Directors’ Incentive Plan adopted by shareholders in April 2005 as described on page 80.EXEC = Executive Share Option Scheme. These options were granted to the relevant individuals prior to their appointments as directors and are not subject to performance conditions. SAYE = Save As You Earn employee share scheme.BP SOP = BP Share Option Plan.These options were granted to Mr Dudley prior to his appointment as a director and are not subject to performance conditions.
aThis information has been subject to audit.bNumbers shown are ADSs under option. One ADS is equivalent to six ordinary shares.cOn appointment to the board.dOptions lapsed.eOptions exercised on 12 February 2010 at a market price of $54.36 per ADS.

86
Directors’ remuneration report
a
BOL08439_p077 pp88_rem_rep:20 F 5/3/10 17:32 Page 86 Bleed: 0�mm Scale: 100%
Service contractsDirector
Contract Salary as at date 31 Dec 2009
Dr A B Hayward 29 Jan 2003 £1,045,000I C Conn 22 Jul 2004 £690,000Mr R Dudley 6 Apr 2009 $1,000,000Dr B E Grote 7 Aug 2000 $1,380,000A G Inglis 1 Feb 2007 £690,000
Service contracts have a notice period of one year and may beterminated by the company at any time with immediate effect onpayment in lieu of notice equivalent to one year’s salary or the amount ofsalary that would have been paid if the contract had been terminated onthe expiry of the remainder of the notice period. The service contracts areexpressed to expire at a normal retirement age of 60 (subject to agediscrimination).
Dr Grote’s contract is with BP Exploration (Alaska) Inc. He isseconded to BP p.l.c. under a secondment agreement of 7 August 2000,which expires at the date of the 2011 Annual General Meeting.Mr Dudley’s contract is with BP Corporation North America Inc. He isseconded to BP p.l.c. under a secondment agreement of 15 April 2009which expires on 15 April 2012. Both secondments can be terminated byone month’s notice by either party and terminate automatically on thetermination of their service contracts.
There are no other provisions for compensation payable on earlytermination of the above contracts. In the event of the early terminationof any of the contracts by the company, other than for cause (or under aspecific termination payment provision), the relevant director’s thencurrent salary and benefits would be taken into account in calculating anyliability of the company.
All service contracts include a provision to allow for severancepayments to be phased, when appropriate. The committee will alsoconsider mitigation to reduce compensation to a departing director, whenappropriate to do so.
Executive directors – external appointmentsThe board encourages executive directors to broaden their knowledgeand experience by taking up appointments outside the company. Eachexecutive director is permitted to accept one non-executive appointment,from which they may retain any fee. External appointments are subjectto agreement by the chairman and reported to the board. Any externalappointment must not conflict with a director’s duties and commitmentsto BP.
During the year, the fees received by executive directors for externalappointments were as follows:
Executive director
Additional positionAppointee held at appointee Totalcompany company fees
Dr A B Hayward Tata Steela Senior £29,000Independent
DirectorI C Conn Rolls-Royce Senior £65,000
IndependentDirector
Dr B E Grote Unilever Audit committee Unilever PLC member £36,000
Unilever NVZ52,250
A G Inglis BAE Chair of £90,000Systems Corporate
ResponsibilityCommittee
Member of Tata Steel Europe board until 1 April 2009 and Tata Steel Ltd board until18 September 2009.
Remuneration committeeAll the members of the committee are independent non-executivedirectors. Throughout the year, Dr Julius (chairman), and Sir Ian Prosserwere members. Mr Davis and Sir Tom McKillop served on the committeeuntil April 2009 and were succeeded by Mr Burgmans and Mr David inMay 2009. The group chief executive was consulted on matters relatingto the other executive directors who report to him and on mattersrelating to the performance of the company; neither he nor the chairmanwere present when matters affecting their own remuneration werediscussed.
The remuneration committee’s tasks, as set out in the board governanceprinciples, are:• To determine, on behalf of the board, the terms of engagement and
remuneration of the group chief executive and the executive directorsand to report on these to the shareholders.
• To determine, on behalf of the board, matters of policy over which thecompany has authority regarding the establishment or operation ofthe company’s pension scheme of which the executive directors aremembers.
• To nominate, on behalf of the board, any trustees (or directors ofcorporate trustees) of the scheme.
• To review the policies being applied by the group chief executive inremunerating senior executives other than executive directors toensure alignment and proportionality.
• To recommend to the board the quantum and structure ofremuneration for the chairman.
87
Directors’ remuneration report
Dire
cto
rs’ re
mu
nera
tion
rep
ort
Constitution and operation
Each member of the remuneration committee is subject to annualre-election as a director of the company. The board considers allcommittee members to be independent (see page 68).
They have no personal financial interest, other than asshareholders, in the committee’s decisions.
The committee met eight times in the period under review.The chairman of the board attends meetings of the committee andMr Svanberg attended meetings prior to becoming chairman on1 January 2010.
The committee is accountable to shareholders through its annualreport on executive directors’ remuneration. It will consider the outcomeof the vote at the AGM on the directors’ remuneration report and takeinto account the views of shareholders in its future decisions. Thecommittee values its dialogue with major shareholders on remunerationmatters.
Advice
Mr Aronson, an independent consultant, is the committee’s secretaryand independent adviser. Advice was also received from Mr Jackson, thecompany secretary, and from the company secretary’s office, which isindependent of executive management and reports to the chairman ofthe board.
The committee also appoints external advisers to providespecialist advice and services on particular remuneration matters.The independence of the advice is subject to annual review.
In 2009, the committee continued to engage Towers Watsonas its principal external adviser. Towers Watson also provided otherremuneration and benefits advice to parts of the group.
Freshfields Bruckhaus Deringer LLP provided legal advice onspecific matters to the committee, as well as providing some legal adviceto the group.
Ernst & Young reviewed the calculations on the financial-basedtargets that form the basis of the performance-related pay for executivedirectors, that is, the annual bonus and share element awards describedon page 79, to ensure they met an independent, objective standard. Theyalso provided audit, audit-related and taxation services for the group.
Part 3 Non-executive directors’remunerationThe board sets the level of remuneration for all non-executive directorswithin a limit approved from time to time by shareholders. Key elementsof BP’s policy on non-executive director remuneration include:• Remuneration should be sufficient to attract and retain world-class
non-executive talent.• Remuneration of non-executive directors is proposed by the chairman
and agreed by the board.• Remuneration practice should be consistent with recognized best
practice standards for non-executive directors’ remuneration.• Remuneration should be in the form of cash fees, payable monthly.• Non-executive directors should not receive share options from the
company.• Non-executive directors are encouraged to establish a holding in BP
shares of the equivalent value of one year’s base fee.
Process
BP reviews the quantum and structure of chairman and non-executiveremuneration on an annual basis. The chairman’s remuneration isreviewed by the remuneration committee, which makes arecommendation to the board; the chairman does not vote on his ownremuneration. Non-executive director remuneration is reviewed by thechairman, who makes a recommendation to the board; non-executivedirectors do not vote on their own remuneration.
2009 review of chairman and non-executive director remuneration
In 2009, the chairman reviewed non-executive director remunerationtaking into account the review completed in 2008. The chairman made arecommendation to the board (which was agreed) to maintain the 2008structure until a further review in 2010.
Carl-Henric Svanberg was appointed to the board in September2009. At the time of his appointment, the remuneration committeelooked at a comparison of remuneration for FTSE and internationalchairmen in determining his fee. The committee determined that incommon with the previous chairman, he should receive the use of achauffeured car, a maintained office for company business and securityadvice. In addition, the committee recognized that the appointment wasto be Mr Svanberg’s main commitment and as he would be performing aproportion of his duties from Sweden, limited but appropriate secretarialsupport in Sweden would be provided. Mr Svanberg is also eligible for asingle relocation allowance of up to £100,000 to cover expenses incurredin relocating to London from Sweden.
Mr Svanberg received the basic non-executive director fee andtransatlantic attendance allowance for the period between hisappointment and his assumption of the role of chairman on 1 January2010. On his appointment as chairman in 2010, the chairman’s feeincreased to £750,000.
BOL08439_p077 pp88_rem_rep:20 F 5/3/10 17:32 Page 87 Bleed: 0�mm Scale: 100%

88
Directors’ remuneration report
BOL08439_p077 pp88_rem_rep:20 F 5/3/10 17:32 Page 88 Bleed: 0�mm Scale: 100%
Fee structure
The table below shows the fee structure for non-executive directors on 1 January 2010:
£ thousand
Fee level
Chairmana 750Senior independent directorb 120Board member 75Audit committee and SEEAC chairmanship feesc 30Remuneration committee chairmanship feec 20Committee membership feed 5Transatlantic attendance allowance 5
aThe chairman remains ineligible for committee chairmanship and membership fees or transatlanticattendance allowance.
bThe senior independent director is eligible for committee chairmanship fees and transatlanticattendance allowance plus any committee membership fees.
cCommittee chairmen do not receive an additional membership fee for the committee they chair.dFor members of the SEEAC, audit and remuneration committees.
Remuneration of non-executive directors in 2009a
£ thousand
2008 2009
P D Sutherland 600 600
A Burgmans 90 93
Sir William Castell 108 115
C B Carroll 93 90
G Davidb 100 118
E B Davis, Jr 105 105
D J Flint 90 85
Dr D S Julius 110 105
Sir Ian Prosser 170 165
C-H Svanbergc n/a 30
Directors leaving the board in 2009Sir Tom McKillop 95 33
a This information has been subject to audit.b Also received £4,166 for serving as a member of BP’s technology advisory committee.c Appointed on 1 September 2009.
While fees were held at 2008 levels, in 2009 actual fees paid to non-executive directors were affected by changes in committee membershipand the number of transatlantic meetings to which an attendanceallowance was paid.
No share or share option awards were made to any non-executivedirector in respect of service to the board during 2009.
Non-executive directors have letters of appointment whichrecognize that, subject to the Articles of Association, their service isat the discretion of shareholders. All directors stand for re-election ateach AGM.
Superannuation gratuities
Until 2002, BP maintained a long-standing practice whereby non-executive directors who retired from the board after at least six years’service were eligible for consideration for a superannuation gratuity. Theboard was, and continues to be, authorized to make such paymentsunder the company’s Articles of Association. In 2002, the board revisedits policy so that non-executive directors appointed to the board after1 July 2002 would not be eligible for a superannuation gratuity, and thatdirectors in service at that date would remain eligible but service past1 July 2002 would not be taken into account by the board in consideringthe amount of the superannuation gratuity.
The amount of the superannuation gratuity is calculated according to the following:• Service on the board is taken up to 1 July 2002.• Payment is calculated as 10% of the total remuneration received in
either the year to 1 July 2002 or calendar year 2001 (whichever is thegreater) multiplied by the number of years a non-executive directorserved on the board until 1 July 2002.
• There is a limit on the payment equivalent to a maximum of 10 years’service.
Peter Sutherland, who retired on 31 December 2009, is entitled to asuperannuation gratuity of £280,000 in line with the policy arrangementsagreed in 2002 and outlined above. Mr Sutherland has asked that the fullbalance of the gratuity be donated to an educational foundation.
Non-executive directors of Amoco Corporation
Non-executive directors who were formerly non-executive directors ofAmoco Corporation have residual entitlements under the Amoco Non-Employee Directors’ Restricted Stock Plan. Directors were allocatedrestricted stock in remuneration for their service on the board of AmocoCorporation prior to its merger with BP in 1998. On merger, interests inAmoco shares in the plan were converted into interests in BP ADSs. Therestricted stock will vest on the retirement of the non-executive directorat the age of 70 (or earlier at the discretion of the board). Since themerger, no further entitlements have accrued to any director under theplan. The residual interests, as interests in a long-term incentive scheme,are set out in the table below:
Interest in BP ADSs Date onat 1 Jan 2009 and which director
31 Dec 2009a reaches age 70b
E B Davis, Jr 4,490 5 Aug 2014
aNo awards were granted and no awards lapsed during the year. The awards were granted overAmoco stock prior to the merger but their notional weighted average market value at the date ofgrant (applying the subsequent merger ratio of 0.66167 of a BP ADS for every Amoco share) was$27.87 per BP ADS.
bFor the purposes of the regulations, the date on which the director retires from the board at or afterthe age of 70 is the end of the qualifying period. If the director retires prior to this date, the boardmay waive the restrictions.
Past directors
Mr Miles (who was a non-executive director of BP until April 2006)was appointed as a director and non-executive chairman of BP PensionTrustees Limited in October 2006. During 2009, he received £150,000for this role.
Dr Walter Massey (who retired as a non-executive director of BPin April 2008) was appointed to the BP America External Advisory Councilin April 2008 for a period of two years. During 2009, he receivedUS$93,750 for this role.
This directors’ remuneration report was approved by the board andsigned on its behalf by David J Jackson, company secretary, on26 February 2010.

Additional information for shareholders
90 Critical accounting policies
92 Property, plants and equipment
92 Share ownership
94 Major shareholders and relatedparty transactions
94 Dividends
95 Legal proceedings
96 Share prices and listings
97 Memorandum and Articlesof Association
99 Exchange controls
99 Taxation
101 Documents on display
101 Controls and procedures
102 Code of ethics
102 Principal accountants’ feesand services
102 Corporate governance practices
103 Purchases of equity securities bythe issuer and affiliated purchasers
103 Fees and charges payable bya holder of ADSs
104 Fees and payments made by theDepositary to the issuer
104 Called-up share capital
104 Administration
104 Annual general meeting
105 Exhibits
Ad
ditio
nal in
form
atio
n fo
r sh
are
ho
lders
BOL08439_p089_divider.qxp:20 F 5/3/10 17:32 Page 89 Bleed: 0�mm Scale: 100%

90
Critical accounting policiesThe significant accounting policies of the group are summarized inFinancial statements – Note 1 on page 114.
Inherent in the application of many of the accounting policiesused in preparing the financial statements is the need for BPmanagement to make estimates and assumptions that affect thereported amounts of assets and liabilities at the date of the financialstatements and the reported amounts of revenues and expenses duringthe reporting period. Actual outcomes could differ from the estimatesand assumptions used. The following summary provides moreinformation about the critical accounting policies that could have asignificant impact on the results of the group and should be read inconjunction with the Notes on financial statements.
The accounting policies and areas that require the most significantjudgements and estimates used in the preparation of the consolidatedfinancial statements are in relation to oil and natural gas accounting,including the estimation of reserves, the recoverability of asset carryingvalues, taxation, derivative financial instruments, provisions andcontingencies, and pensions and other post-retirement benefits.
Oil and natural gas accounting
The group follows the principles of the successful efforts method ofaccounting for its oil and natural gas exploration and production activities.
The acquisition of geological and geophysical seismic information,prior to the discovery of proved reserves, is expensed as incurred.
Exploration licence and leasehold property acquisition costs arecapitalized within intangible assets and are reviewed at each reportingdate to confirm that there is no indication that the carrying amountexceeds the recoverable amount. This review includes confirming thatexploration drilling is still under way or firmly planned or that it has beendetermined, or work is under way to determine, that the discovery iseconomically viable based on a range of technical and commercialconsiderations and sufficient progress is being made on establishingdevelopment plans and timing. If no future activity is planned, theremaining balance of the licence and property acquisition costs is writtenoff. Lower value licences are pooled and amortized on a straight-linebasis over the estimated period of exploration.
For exploration wells and exploratory-type stratigraphic test wells,costs directly associated with the drilling of wells are initially capitalizedwithin intangible assets, pending determination of whether potentiallyeconomic oil and gas reserves have been discovered by the drillingeffort. These costs include employee remuneration, materials and fuelused, rig costs, delay rentals and payments made to contractors. Thedetermination is usually made within one year after well completion, butcan take longer, depending on the complexity of the geological structure.If the well did not encounter potentially economic oil and gas quantities,the well costs are expensed as a dry hole and are reported in explorationexpense. Exploration wells that discover potentially economic quantitiesof oil and natural gas and are in areas where major capital expenditure(e.g. offshore platform or a pipeline) would be required before productioncould begin, and where the economic viability of that major capitalexpenditure depends on the successful completion of further explorationwork in the area, remain capitalized on the balance sheet as long asadditional exploration appraisal work is under way or firmly planned.
It is not unusual to have exploration wells and exploratory-typestratigraphic test wells remaining suspended on the balance sheet forseveral years while additional appraisal drilling and seismic work on thepotential oil and natural gas field is performed or while the optimumdevelopment plans and timing are established.
All such carried costs are subject to regular technical, commercial andmanagement review on at least an annual basis to confirm the continuedintent to develop, or otherwise extract value from, the discovery. Wherethis is no longer the case, the costs are immediately expensed.
Once a project is sanctioned for development, the carrying valuesof exploration licence and leasehold property acquisition costs and costsassociated with exploration wells and exploratory-type stratigraphic testwells, are transferred to production assets within property, plant andequipment.
The capitalized exploration and development costs for proved oiland natural gas properties (which include the costs of drillingunsuccessful wells) are amortized on the basis of oil-equivalent barrelsthat are produced in a period as a percentage of the estimated provedreserves. Field development costs subject to depreciation areexpenditures incurred to date, together with approved futuredevelopment expenditure required to develop reserves.
The estimated proved reserves used in these unit-of-productioncalculations vary with the nature of the capitalized expenditure. Thereserves used in the calculation of the unit-of-production amortization areas follows:• Producing wells – proved developed reserves.• Licence and property acquisition, field development and future
decommissioning costs – total proved reserves.The impact of changes in estimated proved reserves is dealt withprospectively by amortizing the remaining carrying value of the assetover the expected future production. If proved reserves estimates arerevised downwards, earnings could be affected by higher depreciationexpense or an immediate write-down of the property’s carrying value(see discussion of recoverability of asset carrying values on thefollowing page).
On 31 December 2008, the SEC published a revision of Rule 4-10 (a) of Regulation S-X for the estimation of reserves. These revisedrules form the basis of the 2009 year-end estimation of proved reservesand the application of the technical aspects resulted in an immaterialincrease of less than 1% to BP’s total proved reserves. The estimation ofoil and natural gas reserves and BP’s process to manage reservesbookings is described in Exploration and Production – Reserves andproduction on page 20, which is unaudited. As discussed on thefollowing page, oil and natural gas reserves have a direct impact on theassessment of the recoverability of asset carrying values reported in thefinancial statements.
The 2009 movements in proved reserves are reflected in thetables showing movements in oil and gas reserves by region in Financialstatements – Supplementary information on oil and natural gas(unaudited) on pages 183 to 197.
Recoverability of asset carrying values
BP assesses its fixed assets, including goodwill, for possible impairmentif there are events or changes in circumstances that indicate that carryingvalues of the assets may not be recoverable and, as a result, charges forimpairment are recognized in the group’s results from time to time. Suchindicators include changes in the group’s business plans, changes incommodity prices leading to unprofitable performance, low plantutilization, evidence of physical damage and, for oil and natural gasproperties, significant downward revisions of estimated volumes orincreases in estimated future development expenditure. If there are lowoil prices, natural gas prices, refining margins or marketing marginsduring an extended period, the group may need to recognize significantimpairment charges.
The assessment for impairment entails comparing the carryingvalue of the asset or cash-generating unit with its recoverable amount,that is, the higher of fair value less costs to sell and value in use. Value inuse is usually determined on the basis of discounted estimated futurenet cash flows.
Additional information for shareholders
BOL08439_p090 pp106_Add info:20 F 5/3/10 17:32 Page 90 Bleed: 0�mm Scale: 100%
91
Additional information for shareholders
Ad
ditio
nal in
form
atio
n fo
r sh
are
ho
lders
Determination as to whether and how much an asset is impairedinvolves management estimates on highly uncertain matters such asfuture commodity prices, the effects of inflation on operating expenses,discount rates, production profiles and the outlook for global or regionalmarket supply-and-demand conditions for crude oil, natural gas andrefined products.
For oil and natural gas properties, the expected future cash flowsare estimated based on the group’s plans to continue to develop andproduce proved reserves and associated risk-adjusted probable andpossible volumes. Expected future cash flows from the sale orproduction of these volumes are calculated based on the management’sbest estimate of future oil and natural gas prices. Prices for oil andnatural gas used for future cash flow calculations are based on marketprices for the first five years and the group’s long-term planningassumptions thereafter. As at 31 December 2009, the group’s long-termplanning assumptions were $75 per barrel for Brent and $7.50/mmBtufor Henry Hub (2008 $75 per barrel and $7.50/mmBtu). These long-termplanning assumptions are subject to periodic review and modification.The estimated future level of production is based on assumptions aboutfuture commodity prices, lifting and development costs, field declinerates, market demand and supply, economic regulatory climates andother factors.
The future cash flows are adjusted for risks specific to the cash-generating unit and are discounted using a pre-tax discount rate. Thediscount rate is derived from the group’s post-tax weighted average costof capital and is adjusted where applicable to take into account anyspecific risks relating to the country where the cash-generating unit islocated, although other rates may be used if appropriate to the specificcircumstances. In 2009 the rates ranged from 9% to 13% (2008 11%to 13%). The rate applied in each country is re-assessed each year byanalysing relevant information.
Irrespective of whether there is any indication of impairment,BP is required to test annually for impairment of goodwill acquired in abusiness combination. The group carries goodwill of approximately$8.6 billion on its balance sheet (2008 $9.9 billion), principally relatingto the Atlantic Richfield and Burmah Castrol acquisitions. In testinggoodwill for impairment, the group uses a similar approach to thatdescribed above. If there are low oil prices or natural gas prices orrefining margins or marketing margins for an extended period, the groupmay need to recognize significant goodwill impairment charges. In 2009,an impairment loss of $1.6 billion was recognized to write off all of thegoodwill allocated to the US West Coast fuels value chain. The prevailingweak refining environment, together with a review of future marginexpectations in the FVC, led to a reduction in the expected futurecash flows.
Taxation
The computation of the group’s income tax expense involves theinterpretation of applicable tax laws and regulations in many jurisdictionsthroughout the world. The resolution of tax positions taken by the group,through negotiations with relevant tax authorities or through litigation,can take several years to complete and in some cases it is difficult topredict the ultimate outcome.
In addition, the group has carry-forward tax losses in certaintaxing jurisdictions that are available to offset against future taxableprofit. However, deferred tax assets are recognized only to the extentthat it is probable that taxable profit will be available against which theunused tax losses can be utilized. Management judgement is exercisedin assessing whether this is the case.
To the extent that actual outcomes differ from management’sestimates, taxation charges or credits may arise in future periods. Formore information see Financial statements – Note 16 on page 135 andNote 41 on page 174.
Derivative financial instruments
The group uses derivative financial instruments to manage certainexposures to fluctuations in foreign currency exchange rates, interestrates and commodity prices as well as for trading purposes. In addition,derivatives embedded within other financial instruments or other hostcontracts are treated as separate derivatives when their risks andcharacteristics are not closely related to those of the host contract.All such derivatives are initially recognized at fair value on the date onwhich a derivative contract is entered into and are subsequentlyremeasured at fair value. Gains and losses arising from changes in thefair value of derivatives that are not designated as effective hedginginstruments are recognized in the income statement.
In some cases the fair values of derivatives are estimated usingmodels and other valuation methods due to the absence of quoted pricesor other observable, market-corroborated data. In particular, this applies tothe majority of the group’s natural gas embedded derivatives. These areprimarily long-term UK gas contracts that use pricing formulas not relatedto gas prices, for example, oil product and power prices. These contractsare valued using models with inputs that include price curves for each ofthe different products that are built up from active market pricing data andextrapolated to the expiry of the contracts using the maximum availableexternal pricing information. Additionally, where limited data exists forcertain products, prices are interpolated using historic and long-termpricing relationships. Price volatility is also an input for the models.Changes in the key assumptions could have a material impact on thegains and losses on embedded derivatives recognized in the incomestatement. For more information see Financial statements – Note 31 onpage 150. An analysis of the sensitivity of the fair value of the embeddedderivatives to changes in the key assumptions is provided in Financialstatements – Note 24 on page 142.
Provisions and contingencies
The group holds provisions for the future decommissioning of oil andnatural gas production facilities and pipelines at the end of theireconomic lives. The largest asset removal obligations facing BP relate tothe removal and disposal of oil and natural gas platforms and pipelinesaround the world. The estimated discounted costs of dismantling andremoving these facilities are accrued on the installation of thosefacilities, reflecting our legal obligations at that time. A correspondingasset of an amount equivalent to the provision is also created withinproperty, plant and equipment. This asset is depreciated over theexpected life of the production facility or pipeline. Most of these removalevents are many years in the future and the precise requirements thatwill have to be met when the removal event actually occurs areuncertain. Asset removal technologies and costs are constantlychanging, as well as political, environmental, safety and publicexpectations. Consequently, the timing and amounts of future cashflows are subject to significant uncertainty. Changes in the expectedfuture costs are reflected in both the provision and the asset.
Decommissioning provisions associated with downstream andpetrochemicals facilities are generally not provided for, as such potentialobligations cannot be measured, given their indeterminate settlementdates. The group performs periodic reviews of its downstream andpetrochemicals long-lived assets for any changes in facts andcircumstances that might require the recognition of a decommissioningprovision.
The timing and amount of future expenditures are reviewedannually, together with the interest rate used in discounting the cashflows. The interest rate used to determine the balance sheet obligationat the end of 2009 was 1.75% (2008 2%). The interest rate representsthe real rate (i.e. excluding the impacts of inflation) on long-datedgovernment bonds.
BOL08439_p090 pp106_Add info:20 F 5/3/10 17:32 Page 91 Bleed: 0�mm Scale: 100%

92
Other provisions and liabilities are recognized in the period when itbecomes probable that there will be a future outflow of funds resultingfrom past operations or events and the amount of cash outflow can bereliably estimated. The timing of recognition and quantification of theliability require the application of judgement to existing facts andcircumstances, which can be subject to change. Since the actual cashoutflows can take place many years in the future, the carrying amountsof provisions and liabilities are reviewed regularly and adjusted to takeaccount of changing facts and circumstances.
A change in estimate of a recognized provision or liability wouldresult in a charge or credit to net income in the period in which thechange occurs (with the exception of decommissioning costs asdescribed above).
Provisions for environmental remediation are made when a clean-up is probable and the amount of the obligation can be reliably estimated.Generally, this coincides with commitment to a formal plan of action or, ifearlier, on divestment or on closure of inactive sites. The provision forenvironmental liabilities is estimated based on current legal andconstructive requirements, technology, price levels and expected plansfor remediation. Actual costs and cash outflows can differ from estimatesbecause of changes in laws and regulations, public expectations, prices,discovery and analysis of site conditions and changes in clean-uptechnology.
The provision for environmental liabilities is reviewed at leastannually. The interest rate used to determine the balance sheet obligationat 31 December 2009 was 1.75% (2008 2%).
As further described in Financial statements – Note 41 onpage 174, the group is subject to claims and actions. The facts andcircumstances relating to particular cases are evaluated regularly indetermining whether it is probable that there will be a future outflow offunds and, once established, whether a provision relating to a specificlitigation should be adjusted. Accordingly, significant managementjudgement relating to contingent liabilities is required, since the outcomeof litigation is difficult to predict.
Pensions and other post-retirement benefits
Accounting for pensions and other post-retirement benefits involvesjudgement about uncertain events, including estimated retirement dates,salary levels at retirement, mortality rates, rates of return on plan assets,determination of discount rates for measuring plan obligations, healthcarecost trend rates and rates of utilization of healthcare services by retirees.
These assumptions are based on the environment in each country.Determination of the projected benefit obligations for the group’s definedbenefit pension and post-retirement plans is important to the recordedamounts for such obligations on the balance sheet and to the amount ofbenefit expense in the income statement. The assumptions used mayvary from year to year, which will affect future results of operations.Any differences between these assumptions and the actual outcomealso affect future results of operations.
Pension and other post-retirement benefit assumptions arereviewed by management at the end of each year. These assumptionsare used to determine the projected benefit obligation at the year-end and hence the surpluses and deficits recorded on the group’s balancesheet, and pension and other post-retirement benefit expense for thefollowing year.
The pension and other post-retirement benefit assumptions atDecember 2009, 2008 and 2007 are provided in Financial statements –Note 35 on page 159.
The assumed rate of investment return, discount rate and theUS healthcare cost trend rate have a significant effect on the amountsreported. A sensitivity analysis of the impact of changes in theseassumptions on the benefit expense and obligation is provided inFinancial statements – Note 35 on page 159.
In addition to the financial assumptions, we regularly review thedemographic and mortality assumptions. Mortality assumptions reflectbest practice in the countries in which we provide pensions and havebeen chosen with regard to the latest available published tables adjustedwhere appropriate to reflect the experience of the group and anextrapolation of past longevity improvements into the future. A sensitivityanalysis of the impact of changes in the mortality assumptions on thebenefit expense and obligation is provided in Financial statements –Note 35 on page 159.
Property, plants and equipmentBP has freehold and leasehold interests in real estate in numerouscountries, but no individual property is significant to the group as awhole. See Exploration and Production on page 18 for a description ofthe group’s significant reserves and sources of crude oil and natural gas.Significant plans to construct, expand or improve specific facilities aredescribed under each of the business headings within this section.
Share ownershipDirectors and senior management
As at 18 February 2010, the following directors of BP p.l.c. held interests in BP ordinary shares of 25 cents each or their calculated equivalent as setout below:
I C Conn 349,820 2,016,005a 266,904b
R W Dudley 276,846 1,120,716a –Dr B E Grote 1,351,529 2,376,570a –Dr A B Hayward 622,807 3,022,598a –A G Inglis 308,639 2,016,005a 266,904b
P Anderson 6,000 – –A Burgmans 10,156 – –C B Carroll 10,500 – –Sir William Castell 82,500 – –G David 39,000 – –E B Davis, Jr 76,497 – –D J Flint 15,000 – –Dr D S Julius 15,000 – –Sir Ian Prosser 16,301 – –C-H Svanberg 750,000 – –
aPerformance shares awarded under the BP Executive Directors’ Incentive Plan. These figures represent the maximum possible vesting levels. The actual number of shares/ADSs that vest will depend onthe extent to which performance conditions have been satisfied over a three-year period.
bRestricted share award under the BP Executive Directors’ Incentive Plan. These shares will vest in two equal tranches after three and five years, subject to the directors’ continued service and satisfactoryperformance.
Additional information for shareholders
BOL08439_p090 pp106_Add info:20 F 5/3/10 17:32 Page 92 Bleed: 0�mm Scale: 100%

93
Additional information for shareholders
Ad
ditio
nal in
form
atio
n fo
r sh
are
ho
lders
As at 18 February 2010, the following directors of BP p.l.c. held options under the BP group share option schemes for ordinary shares or theircalculated equivalent as set out below:
I C Conn 204,970R W Dudley 270,018Dr B E Grote 425,598Dr A B Hayward 549,620A G Inglis 410,750
There are no directors or members of senior management who own more than 1% of the ordinary shares outstanding. At 18 February 2010, alldirectors and senior management as a group held interests in 5,649,017 ordinary shares or their calculated equivalent, 12,173,702 performanceshares or their calculated equivalent and 2,113,316 options for ordinary shares or their calculated equivalent under the BP group share optionsschemes.
Additional details regarding the options granted and performance shares awarded can be found in the directors’ remuneration report onpages 84 and 85.
Employee share plans
The following table shows employee share options granted.
options thousands
2009 2008 2007
Employee share options granted during the yeara 9,680 8,063 6,004
aFor the options outstanding at 31 December 2009, the exercise price ranges and weighted average remaining contractual lives are shown in Financial statements – Note 38 on page 170.
BP offers most of its employees the opportunity to acquire ashareholding in the company through savings-related and/or matchingshare plan arrangements. BP also uses performance plans (see Financialstatements – Note 38 on page 170) as elements of remuneration forexecutive directors and senior employees.
Shares acquired through the company’s employee share plansrank pari passu with shares in issue and have no special rights, save asdescribed below. For legal and practical reasons, the rules of these plansset out the consequences of a change of control of the company, andgenerally provide for options and conditional awards to vest on anaccelerated basis.
Savings and matching plans
BP ShareSave PlanThis is a savings-related share option plan under which employees saveon a monthly basis, over a three- or five-year period, towards thepurchase of shares at a fixed price determined when the option isgranted. This price is usually set at a 20% discount to the market price atthe time of grant. The option must be exercised within six months ofmaturity of the savings contract; otherwise it lapses. The plan is run inthe UK and options are granted annually, usually in June. Participantsleaving for a qualifying reason will have six months in which to use theirsavings to exercise their options on a pro-rated basis.
BP ShareMatch plansThese are matching share plans under which BP matches employees’own contributions of shares up to a predetermined limit. The plans arerun in the UK and in more than 70 other countries. The UK plan is run ona monthly basis with shares being held in trust for five years before theycan be released free of any income tax and national insurance liability.In other countries the plan is run on an annual basis with shares beingheld in trust for three years. The plan is operated on a cash basis in thosecountries where there are regulatory restrictions preventing the holdingof BP shares. When the employee leaves BP all shares must beremoved from trust and units under the plan operated on a cash basismust be encashed.
Once shares have been awarded to an employee under the plan,the employee may instruct the trustee how to vote their shares.
BOL08439_p090 pp106_Add info:20 F 5/3/10 17:32 Page 93 Bleed: 0�mm Scale: 100%
Local plansIn some countries, BP provides local scheme benefits, the rules andqualifications for which vary according to local circumstances.
Cash-settled share-based paymentsGrants are settled in cash where participants are located in a countrywhose regulatory environment prohibits the holding of BP shares.
Employee share ownership plans (ESOPs)ESOPs have been established to hold BP shares to satisfy any releasesmade to participants under the Executive Directors’ Incentive Plan, theLong-Term Performance Plan and the Share Option plans. The ESOPshave waived their rights to dividends on shares held for future awardsand are funded by the group. Pending vesting, the ESOPs haveindependent trustees that have the discretion in relation to the voting ofsuch shares. Until such time as the company’s own shares held by theESOP trusts vest unconditionally in employees, the amount paid forthose shares is deducted in arriving at shareholders’ equity (see Financialstatements – Note 37 on page 166). Assets and liabilities of the ESOPsare recognized as assets and liabilities of the group.
At 31 December 2009, the ESOPs held 18,062,246 shares (200829,051,082 shares and 2007 6,448,838 shares) for potential futureawards, which had a market value of $174 million (2008 $220 million and2007 $79 million).
Pursuant to the various BP group share option schemes, thefollowing options for ordinary shares of the company were outstanding at18 February 2010:
Expiry dates Exercise priceOptions outstanding (shares) of options per share
285,364,691 2010-2016 $6.18-$11.92
More details on share options appear in Financial statements – Note 38on page 170.

94
Additional information for shareholders
Major shareholders and related party transactionsRegister of members holding BP ordinary shares as at
31 December 2009
Number of Percentage of Percentage ofordinary total ordinary total ordinary
Range of holdings shareholders shareholders share capital
1-200 57,927 18.43 0.02201-1,000 116,624 37.11 0.301,001-10,000 126,034 40.10 1.8310,001-100,000 11,867 3.77 1.17100,001-1,000,000 1,065 0.34 1.85Over 1,000,000a 777 0.25 94.83Totals 314,294 100.00 100.00
aIncludes JPMorgan Chase Bank holding 27.74% of the total ordinary issued share capital (excludingshares held in treasury) as the approved depositary for ADSs, a breakdown of which is shown inthe table below.
Register of holders of American depositary shares (ADSs) as at
31 December 2009a
Percentage of Number of total ADS Percentage of
Range of holdings ADS holders holders total ADSs
1-200 72,272 54.22 0.48201-1,000 37,695 28.28 2.081,001-10,000 21,893 16.42 6.8010,001-100,000 1,417 1.06 2.81100,001-1,000,000 22 0.02 0.43Over 1,000,000b 1 0.00 87.4Totals 133,300 100.00 100.00
aOne ADS represents six 25 cent ordinary shares.bOne of the holders of ADSs represents some 698,373 underlying shareholders.
As at 31 December 2009, there were also 1,660 preference shareholders.Preference shareholders represented 0.4% and ordinary shareholdersrepresented 99.6% of the total issued nominal share capital of thecompany as at that date.
Substantial shareholdings
The disclosure of certain major interests in the share capital of thecompany is governed by the Disclosure and Transparency Rules (DTR)made by the UK Financial Services Authority and the US SecuritiesExchange Act of 1934. Under DTR 5, we have received notification thatBlackRock, Inc. holds 5.93% of the voting rights of the issued sharecapital of the company; and Legal and General Group Plc holds 4.18% ofthe voting rights of the issued share capital of the company.
As at the date of this report, the company had been notified thatJPMorgan Chase Bank, as depositary for American depositary shares(ADSs) holds interests through its nominee, Guaranty Nominees Limited,in 5,318,457,873 ordinary shares (28.34% of the company’s ordinaryshare capital excluding shares held in Treasury and shares bought backfor cancellation). During 2009, BlackRock, Inc. acquired Barclays GlobalInvestors, resulting in an increase in the share interest of BlackRock, Inc.BlackRock, Inc. holds interests in 1,112,967,596 ordinary shares (5.93%of the ordinary share capital excluding shares held in treasury and sharesbought back for cancellation). Legal & General Group plc hold interests in783,820,456 ordinary shares (4.18% of the company’s ordinary sharecapital excluding shares held in treasury and shares bought back forcancellation). The company’s major shareholders do not have differentvoting rights.
At the date of this report the company has also been notified of thefollowing interests in preference shares: The National Farmers UnionMutual Insurance Society Limited holds interests in 945,000 8%cumulative first preference shares (13.07% of that class) and 987,0009% cumulative second preference shares (18.03% of that class).M & G Investment Management Ltd. holds interests in 528,1508% cumulative first preference shares (7.30% of that class) and 644,4509% cumulative second preference shares (11.77% of that class).Gartmore Investment Management Limited holds interests in 394,5388% cumulative first preference shares (5.45% of that class) and 500,0009% cumulative second preference shares (9.14% of that class). DuncanLawrie Ltd. holds interests in 461,876 8% cumulative first preferenceshares (6.39% of that class). Ruffer LLP holds interests in 587,000 9%cumulative second preference shares (10.72% of that class). LazardAsset Management Ltd. (U.K.) holds interests in 328,500 9% cumulativesecond preference shares (6.0% of that class).
The total preference shares in issue comprise only 0.4%of the company’s total issued nominal share capital, the rest beingordinary shares.
Related-party transactions
Transactions between the group and its significant jointly controlledentities and associates are summarized in Financial statements – Note 22on page 140 and Financial statements – Note 23 on page 141. In theordinary course of its business, the group enters into transactions withvarious organizations with which certain of its directors or executiveofficers are associated. Except as described in this report, the group didnot have material transactions or transactions of an unusual nature with,and did not make loans to, related parties in the period commencing1 January 2009 to 18 February 2010.
DividendsBP has paid dividends on its ordinary shares in each year since 1917. In2000 and thereafter, dividends were, and are expected to continue to be,paid quarterly in March, June, September and December. Former AmocoCorporation and Atlantic Richfield Company shareholders will not be ableto receive dividends, or proxy material, until they send in their AmocoCorporation or Atlantic Richfield Company common shares for exchange.
BP currently announces dividends for ordinary shares inUS dollars and states an equivalent pounds sterling dividend. Dividendson BP ordinary shares will be paid in pounds sterling and on BP ADSs inUS dollars. The rate of exchange used to determine the sterling amountequivalent is the average of the forward exchange rate in London over thefive business days prior to the announcement date. The directors maychoose to declare dividends in any currency provided that a sterlingequivalent is announced, but it is not the company’s intention to changeits current policy of announcing dividends on ordinary shares inUS dollars.
BOL08439_p090 pp106_Add info:20 F 5/3/10 17:32 Page 94 Bleed: 0�mm Scale: 100%

95
Additional information for shareholders
Ad
ditio
nal in
form
atio
n fo
r sh
are
ho
lders
The following table shows dividends announced and paid by the company per ADS for each of the past five years.
March June September December Total
Dividends per American depositary share2005 UK pence 27.1 26.7 30.7 30.4 114.9
US cents 51.0 51.0 53.55 53.55 209.1Canadian cents 64.0 63.2 65.3 63.7 256.2
2006 UK pence 31.7 31.5 31.9 31.4 126.5US cents 56.25 56.25 58.95 58.95 230.4
Canadian cents 64.5 64.1 67.4 66.5 262.52007 UK pence 31.5 30.9 31.7 31.8 125.9
US cents 61.95 61.95 64.95 64.95 253.8Canadian cents 73.3 69.5 67.8 63.6 274.2
2008 UK pence 40.9 41.0 42.2 52.2 176.3US cents 81.15 81.15 84.0 84.0 330.3
Canadian cents 80.8 82.5 85.8 108.6 357.72009 UK pence 58.91 57.50 51.02 51.07 218.5
US cents 84 84 84 84 336
Canadian centsa n/a n/a n/a n/a n/a
a BP shares were de-listed from the Toronto Stock Exchange on 15 August 2008 and the last dividend payment in Canadian dollars was made on 8 December 2008.
A dividend reinvestment plan is in place whereby holders of BP ordinaryshares can elect to reinvest the net cash dividend in shares purchasedon the London Stock Exchange. This plan is not available to any personresident in the US or Canada or in any jurisdiction outside the UKwhere such an offer requires compliance by the company with anygovernmental or regulatory procedures or any similar formalities. A dividend reinvestment plan is, however, available for holders of ADSsthrough JPMorgan Chase Bank. Subject to shareholder approval atthe Annual General Meeting, the company is seeking to replace theseplans with an optional Scrip Dividend Programme. If approved, therequirements of the programme mean that there will be certainchanges to our current dividend timetable.
Future dividends will be dependent on future earnings, thefinancial condition of the group, the Risk factors set out on pages 14-16and other matters that may affect the business of the group set out inFinancial performance on page 49 and in Liquidity and capital resourceson page 57.
Legal proceedingsBP America Inc. (BP America) continues to be subject to oversight by anindependent monitor, who has authority to investigate and report allegedviolations of the US Commodity Exchange Act or US Commodity FuturesTrading Commission (CFTC) regulations and to recommend correctiveaction. The appointment of the independent monitor was a condition ofthe deferred prosecution agreement (DPA) entered into with the USDepartment of Justice (DOJ) on 25 October 2007 relating to allegationsthat BP America manipulated the price of February 2004 TET physicalpropane and attempted to manipulate the price of TET propane in April2003 and the companion consent order with the CFTC, entered the sameday, resolving all criminal and civil enforcement matters pending at thattime concerning propane trading by BP Products North America Inc. (BPProducts). The DPA requires BP America’s and certain of its affiliates’continued co-operation with the US government investigations of thetrades in question, as well as other trading matters that may arise. TheDPA has a term of three years but can be extended by two additionalone-year periods, and contemplates dismissal of all charges at the endof the term following the DOJ’s determination that BP America hascomplied with the terms of the DPA. Investigations into BP’s tradingactivities continue to be conducted from time to time.
Private complaints, including class actions, have also been filed againstBP Products alleging propane price manipulation. The complaints containallegations similar to those in the CFTC action as well as of violations offederal and state antitrust and unfair competition laws and stateconsumer protection statutes and unjust enrichment. The complaintsseek actual and punitive damages and injunctive relief. Settlement in bothgroups of the class actions (the direct and indirect purchasers) havereceived final court approval. Two independent lawsuits from classmembers who opted out of the direct purchaser settlement are alsopending. In addition, state actions alleging manipulation of propane andother energy commodity prices and seeking a variety of remedies havebeen filed against BP Products and other BP subsidiaries.
On 23 March 2005, an explosion and fire occurred in theisomerization unit of BP Products’ Texas City refinery as the unit wascoming out of planned maintenance. Fifteen workers died in the incidentand many others were injured. BP Products has resolved all civil injuryclaims arising from the March 2005 incident.
In March 2007, the US Chemical Safety and Hazard InvestigationBoard (CSB) issued its final report on the incident. The report containedrecommendations to the Texas City refinery and to the board of thecompany. In May 2007, BP responded to the CSB’s recommendations.BP and the CSB will continue to discuss BP’s responses with theobjective of the CSB agreeing to close-out its recommendations.
On 25 October 2007, the DOJ announced that it had entered intoa criminal plea agreement with BP Products related to the March 2005explosion and fire. On 4 February 2008, BP Products pleaded guilty,pursuant to the plea agreement, to one felony violation of the riskmanagement planning regulations promulgated under the US federalClean Air Act and on 12 March 2009, the court accepted the pleaagreement. In connection with the plea agreement, BP Products paida $50 million criminal fine and was sentenced to three years’ probation.Compliance with a 2005 US Occupational Safety and HealthAdministration (OSHA) settlement agreement and an agreed orderentered into by BP Products with the Texas Commission onEnvironmental Quality (TCEQ) are conditions of probation. The DOJcontinues to investigate certain other matters arising from the March2005 explosion and fire.
BOL08439_p090 pp106_Add info:20 F 5/3/10 17:32 Page 95 Bleed: 0�mm Scale: 100%

96
Additional information for shareholders
The Texas Office of Attorney General, on behalf of the TCEQ, has filed apetition against BP Products asserting certain air emission and reportingviolations at the Texas City refinery from 2005 to 2009, including inrelation to the March 2005 explosion and fire. BP is contesting thepetition in a pending civil proceeding.
In September 2009, BP Products filed a petition to clarify specificrequired actions and deadlines under the 2005 Settlement Agreementwith OSHA. That agreement resolved citations issued in connection withthe March 2005 Texas City refinery explosion. OSHA has denied BPProducts’ petition. This matter is scheduled for review by theOccupational Safety and Health (OSH) Review Commission. In October2009 OSHA issued the Texas City Refinery citations seeking a total of$87.4 million civil penalty for alleged violations of the 2005 Agreementand alleged process safety management violations. BP Products hascontested the citations so this will also be reviewed by the OSH ReviewCommission and possibly the federal courts. Settlement negotiationscontinue between BP Products and OSHA in an attempt to settle thecitations for alleged violations of the 2005 settlement agreement.
BP has received a shareholder derivative action against various ofits current and former officers and directors based on alleged violationsof the US Clean Air Act and OSHA regulations at the Texas City refinerysubsequent to the March 2005 explosion and fire.
BP is also defending civil personal injury claims by Texas Cityrefinery workers or their families from incidents or releases since theMarch 2005 explosion and fire.
On 29 November 2007, BP Exploration (Alaska) Inc. (BPXA)entered into a criminal plea agreement with the DOJ relating to leaksof crude oil in March and August 2006. BPXA’s guilty plea, to amisdemeanour violation of the US Federal Water Pollution Control Act,included a term of three years’ probation. BPXA is eligible to petition thecourt for termination of the probation term if it meets certain benchmarksrelating to replacement of the transit lines, upgrades to its leak detectionsystem and improvements to its integrity management programme.On 31 March 2009, the DOJ filed a complaint against BPXA seekingcivil penalties and injunctive relief relating to the 2006 oil releases.The complaint alleges that BPXA violated various federal environmentaland pipeline safety statutes and associated regulations in connectionwith the two releases and its maintenance and operation of North Slopepipelines. The State of Alaska also filed a complaint on 31 March 2009against BPXA seeking civil penalties and damages relating to theseevents. The complaint alleges that the two releases and BPXA’s corrosionmanagement practices violated various statutory, contractual andcommon law duties to the State, resulting in penalty liability, damages for lost royalties and taxes, and liability for punitive damages.
Approximately 200 lawsuits were filed in state and federal courtsin Alaska seeking compensatory and punitive damages arising out of theExxon Valdez oil spill in Prince William Sound in March 1989. Most ofthose suits named Exxon (now ExxonMobil), Alyeska Pipeline ServiceCompany (Alyeska), which operates the oil terminal at Valdez, and theother oil companies that own Alyeska. Alyeska initially responded to thespill until the response was taken over by Exxon. BP owns a 46.9%interest (reduced during 2001 from 50% by a sale of 3.1% to Phillips)in Alyeska through a subsidiary of BP America Inc. and briefly indirectlyowned a further 20% interest in Alyeska following BP’s combination withAtlantic Richfield. Alyeska and its owners have settled all the claimsagainst them under these lawsuits. Exxon has indicated that it may filea claim for contribution against Alyeska for a portion of the costs anddamages that it has incurred. If any claims are asserted by Exxon thataffect Alyeska and its owners, BP will defend the claims vigorously.
Since 1987, Atlantic Richfield, a subsidiary of BP, has been named as aco-defendant in numerous lawsuits brought in the US alleging injury topersons and property caused by lead pigment in paint. The majority of thelawsuits have been abandoned or dismissed against Atlantic Richfield.Atlantic Richfield is named in these lawsuits as alleged successor toInternational Smelting and Refining and another company thatmanufactured lead pigment during the period 1920-1946. Plaintiffsinclude individuals and governmental entities. Several of the lawsuitspurport to be class actions. The lawsuits seek various remedies includingcompensation to lead-poisoned children, cost to find and remove leadpaint from buildings, medical monitoring and screening programmes,public warning and education of lead hazards, reimbursement ofgovernment healthcare costs and special education for lead-poisonedcitizens and punitive damages. No lawsuit against Atlantic Richfield hasbeen settled nor has Atlantic Richfield been subject to a final adversejudgement in any proceeding. The amounts claimed and, if such suitswere successful, the costs of implementing the remedies sought in thevarious cases could be substantial. While it is not possible to predict theoutcome of these legal actions, Atlantic Richfield believes that it has validdefences and it intends to defend such actions vigorously and that theincurrence of liability is remote. Consequently, BP believes that theimpact of these lawsuits on the group’s results of operations, financialposition or liquidity will not be material.
For certain information regarding environmental proceedings, seeEnvironment – United States on page 44.
Share prices and listingsMarkets and market prices
The primary market for BP’s ordinary shares is the London StockExchange (LSE). BP’s ordinary shares are a constituent element of theFinancial Times Stock Exchange 100 Index. BP’s ordinary shares are alsotraded on the Frankfurt stock exchange in Germany.
Trading of BP’s shares on the LSE is primarily through the use ofthe Stock Exchange Electronic Trading Service (SETS), introduced in 1997for the largest companies in terms of market capitalization whoseprimary listing is the LSE. Under SETS, buy and sell orders at specificprices may be sent to the exchange electronically by any firm that is amember of the LSE, on behalf of a client or on behalf of itself acting as aprincipal. The orders are then anonymously displayed in the order book.When there is a match on a buy and a sell order, the trade is executedand automatically reported to the LSE. Trading is continuous from8.00 a.m. to 4.30 p.m. UK time but, in the event of a 20% movement inthe share price either way, the LSE may impose a temporary halt in thetrading of that company’s shares in the order book to allow the market tore-establish equilibrium. Dealings in ordinary shares may also take placebetween an investor and a market-maker, via a member firm, outside theelectronic order book.
In the US, the company’s securities are traded in the form ofADSs, for which JPMorgan Chase Bank is the depositary (the Depositary)and transfer agent. The Depositary’s principal office is 4 New York Plaza,Floor 13, New York, NY 10004, US. Each ADS represents six ordinaryshares. ADSs are listed on the New York Stock Exchange. ADSs areevidenced by American depositary receipts (ADRs), which may be issuedin either certificated or book entry form.
The following table sets forth for the periods indicated the highestand lowest middle market quotations for BP’s ordinary shares for theperiods shown. These are derived from the Daily Official List of the LSEand the highest and lowest sales prices of ADSs as reported on the NewYork Stock Exchange (NYSE) composite tape.
BOL08439_p090 pp106_Add info:20 F 5/3/10 17:32 Page 96 Bleed: 0�mm Scale: 100%

97
Additional information for shareholders
Ad
ditio
nal in
form
atio
n fo
r sh
are
ho
lders
Pence Dollars
Americandepositary
Ordinary shares sharesa
High Low High Low
Year ended 31 December2005 686.00 499.00 72.75 56.602006 723.00 558.50 76.85 63.522007 640.00 504.50 79.77 58.622008 657.25 370.00 77.69 37.572009 613.40 400.00 60.00 33.71Year ended 31 December2008: First quarter 648.00 495.00 75.87 57.87
Second quarter 657.25 501.34 77.69 60.25Third quarter 583.00 446.00 69.10 48.35Fourth quarter 541.25 370.00 51.49 37.57
2009: First quarter 566.50 400.00 49.83 33.71
Second quarter 543.75 426.50 53.24 38.50
Third quarter 568.50 459.25 55.61 44.63
Fourth quarter 613.40 528.00 60.00 50.60
2010: First quarter (to 18 February) 639.00 552.30 62.38 52.11
Month ofSeptember 2009 568.50 514.80 55.61 50.30
October 2009 598.00 528.00 58.69 50.60
November 2009 599.30 562.50 60.00 56.22
December 2009 613.40 572.00 58.99 55.77
January 2010 639.00 585.10 62.38 55.87
February 2010 (to 18 February) 595.00 552.30 57.26 52.11
aAn ADS is equivalent to six 25 cent ordinary shares.
Market prices for the ordinary shares on the LSE and in after-hourstrading off the LSE, in each case while the NYSE is open, and the marketprices for ADSs on the NYSE are closely related due to arbitrage amongthe various markets, although differences may exist from time to timedue to various factors, including UK stamp duty reserve tax.
On 18 February 2010, 886,409,646 ADSs (equivalent to5,318,457,873 ordinary shares or some 28.34% of the total issuedshare capital, excluding treasury shares and shares bought back forcancellation) were outstanding and were held by approximately 132,684ADS holders. Of these, about 131,204 had registered addresses in theUS at that date. One of the registered holders of ADSs represents some698,373 underlying holders.
On 18 February 2010, there were approximately 314,028 holdersof record of ordinary shares. Of these holders, around 1,540 hadregistered addresses in the US and held a total of some 4,343,899ordinary shares.
Since certain of the ordinary shares and ADSs were held bybrokers and other nominees, the number of holders of record in the USmay not be representative of the number of beneficial holders or of theircountry of residence.
At the AGM held on 17 April 2008, shareholders voted to adopt newArticles of Association, largely to take account of changes in UK companylaw brought about by the Companies Act 2006. Further amendments tothe Articles of Association are being proposed at our AGM in 2010, toreflect the full implementation of the Companies Act 2006, among othermatters.
Under the Companies Act 2006 the Memorandum serves amore limited role as historical evidence of the formation of the company.Since October 2009 the provisions of the company’s Memorandum aredeemed to form part of BP’s Articles of Association.
Objects and purposes
BP is incorporated under the name BP p.l.c. and is registered in Englandand Wales with registered number 102498. Clause 4 of BP’sMemorandum of Association provides that its objects include theacquisition of petroleum-bearing lands; the carrying on of refining anddealing businesses in the petroleum, manufacturing, metallurgical orchemicals businesses; the purchase and operation of ships and all othervehicles and other conveyances; and the carrying on of any otherbusinesses calculated to benefit BP. The memorandum grants BP arange of corporate capabilities to effect these objects.
Memorandum and Articles of AssociationThe following summarizes certain provisions of the company’sMemorandum and Articles of Association and applicable English law. Thissummary is qualified in its entirety by reference to the UK Companies Actand the company’s Memorandum and Articles of Association. Informationon where investors can obtain copies of the Memorandum and Articlesof Association is described under the heading ‘Documents on display’ onpage 101.
BOL08439_p090 pp106_Add info:20 F 5/3/10 17:32 Page 97 Bleed: 0�mm Scale: 100%

98
Additional information for shareholders
Directors
The business and affairs of BP shall be managed by the directors.The Articles of Association place a general prohibition on a
director voting in respect of any contract or arrangement in which he hasa material interest other than by virtue of his interest in shares in thecompany. However, in the absence of some other material interest notindicated below, a director is entitled to vote and to be counted in aquorum for the purpose of any vote relating to a resolution concerningthe following matters:• The giving of security or indemnity with respect to any money lent or
obligation taken by the director at the request or benefit of thecompany.
• Any proposal in which he is interested concerning the underwriting ofcompany securities or debentures.
• Any proposal concerning any other company in which he isinterested, directly or indirectly (whether as an officer or shareholderor otherwise) provided that he and persons connected with him arenot the holder or holders of 1% or more of the voting interest in theshares of such company.
• Proposals concerning the modification of certain retirement benefitsschemes under which he may benefit and that have been approvedby either the UK Board of Inland Revenue or by the shareholders.
• Any proposal concerning the purchase or maintenance of anyinsurance policy under which he may benefit.
The UK Companies Act requires a director of a company who is in anyway interested in a contract or proposed contract with the company todeclare the nature of his interest at a meeting of the directors of thecompany. The definition of ‘interest’ includes the interests of spouses,children, companies and trusts. The UK Companies Act also requires thata director must avoid a situation where a director has, or could have, adirect or indirect interest that conflicts, or possibly may conflict, with thecompany’s interests. The Act allows directors of public companies toauthorize such conflicts where appropriate, if a company’s Articles ofAssociation so permit. BP’s Articles of Association permit theauthorization of such conflicts. The directors may exercise all the powersof the company to borrow money, except that the amount remainingundischarged of all moneys borrowed by the company shall not, withoutapproval of the shareholders, exceed the amount paid up on the sharecapital plus the aggregate of the amount of the capital and revenuereserves of the company. Variation of the borrowing power of the boardmay only be effected by amending the Articles of Association.
Remuneration of non-executive directors shall be determinedin the aggregate by resolution of the shareholders. Remuneration ofexecutive directors is determined by the remuneration committee.This committee is made up of non-executive directors only. There isno requirement of share ownership for a director’s qualification.
Dividend rights; other rights to share in company profits;
capital calls
If recommended by the directors of BP, BP shareholders may, byresolution, declare dividends but no such dividend may be declared inexcess of the amount recommended by the directors. The directorsmay also pay interim dividends without obtaining shareholder approval.No dividend may be paid other than out of profits available for distribution,as determined under IFRS and the UK Companies Act. Dividends onordinary shares are payable only after payment of dividends on BPpreference shares. Any dividend unclaimed after a period of 12 yearsfrom the date of declaration of such dividend shall be forfeited andreverts to BP.
The directors have the power to declare and pay dividends in anycurrency provided that a sterling equivalent is announced. It is not thecompany’s intention to change its current policy of paying dividendsin US dollars.
Apart from shareholders’ rights to share in BP’s profits by dividend(if any is declared), the Articles of Association provide that the directorsmay set aside:• A special reserve fund out of the balance of profits each year to make
up any deficit of cumulative dividend on the BP preference shares.• A general reserve out of the balance of profits each year, which shall
be applicable for any purpose to which the profits of the companymay properly be applied. This may include capitalization of such sum,pursuant to an ordinary shareholders’ resolution, and distribution toshareholders as if it were distributed by way of a dividend on theordinary shares or in paying up in full unissued ordinary shares forallotment and distribution as bonus shares.
Any such sums so deposited may be distributed in accordance with themanner of distribution of dividends as described above.
Holders of shares are not subject to calls on capital by thecompany, provided that the amounts required to be paid on issue havebeen paid off. All shares are fully paid.
Voting rights
The Articles of Association of the company provide that voting onresolutions at a shareholders’ meeting will be decided on a poll otherthan resolutions of a procedural nature, which may be decided on a showof hands. If voting is on a poll, every shareholder who is present inperson or by proxy has one vote for every ordinary share held and twovotes for every £5 in nominal amount of BP preference shares held.If voting is on a show of hands, each shareholder who is present at themeeting in person or whose duly appointed proxy is present in personwill have one vote, regardless of the number of shares held, unless a pollis requested. Shareholders do not have cumulative voting rights.
Holders of record of ordinary shares may appoint a proxy,including a beneficial owner of those shares, to attend, speak and voteon their behalf at any shareholders’ meeting.
Record holders of BP ADSs are also entitled to attend, speak andvote at any shareholders’ meeting of BP by the appointment by theapproved depositary, JPMorgan Chase Bank, of them as proxies inrespect of the ordinary shares represented by their ADSs. Each suchproxy may also appoint a proxy. Alternatively, holders of BP ADSs areentitled to vote by supplying their voting instructions to the depositary,who will vote the ordinary shares represented by their ADSs inaccordance with their instructions.
Proxies may be delivered electronically.Matters are transacted at shareholders’ meetings by the
proposing and passing of resolutions, of which there are three types:ordinary, special or extraordinary. An annual general meeting must beheld once in every year and all other general meetings will be calledextraordinary general meetings.
An ordinary resolution requires the affirmative vote of a majorityof the votes of those persons voting at a meeting at which there is aquorum. Special and extraordinary resolutions require the affirmative voteof not less than three-fourths of the persons voting at a meeting at whichthere is a quorum. Any AGM requires 21 days’ notice. The notice periodfor an extraordinary general meeting is 14 days. With the implementationof the EU Shareholder Rights Directive into UK law, reliance on thisnotice period of 14 days requires annual shareholder approval, failingwhich, a 21-day notice period will apply.
BOL08439_p090 pp106_Add info:20 F 5/3/10 17:32 Page 98 Bleed: 0�mm Scale: 100%

99
Additional information for shareholders
Ad
ditio
nal in
form
atio
n fo
r sh
are
ho
lders
Liquidation rights; redemption provisions
In the event of a liquidation of BP, after payment of all liabilities andapplicable deductions under UK laws and subject to the payment ofsecured creditors, the holders of BP preference shares would be entitledto the sum of (i) the capital paid up on such shares plus, (ii) accrued andunpaid dividends and (iii) a premium equal to the higher of (a) 10% of thecapital paid up on the BP preference shares and (b) the excess of theaverage market price over par value of such shares on the LSE duringthe previous six months. The remaining assets (if any) would be dividedpro rata among the holders of ordinary shares.
Without prejudice to any special rights previously conferred onthe holders of any class of shares, BP may issue any share with suchpreferred, deferred or other special rights, or subject to such restrictionsas the shareholders by resolution determine (or, in the absence of anysuch resolutions, by determination of the directors), and may issueshares that are to be or may be redeemed.
Variation of rights
The rights attached to any class of shares may be varied with theconsent in writing of holders of 75% of the shares of that class or on theadoption of an extraordinary resolution passed at a separate meeting ofthe holders of the shares of that class. At every such separate meeting,all of the provisions of the Articles of Association relating to proceedingsat a general meeting apply, except that the quorum with respect toa meeting to change the rights attached to the preference shares is10% or more of the shares of that class, and the quorum to changethe rights attached to the ordinary shares is one-third or more of theshares of that class.
Shareholders’ meetings and notices
Shareholders must provide BP with a postal or electronic address in theUK in order to be entitled to receive notice of shareholders’ meetings.In certain circumstances, BP may give notices to shareholders byadvertisement in UK newspapers. Holders of BP ADSs are entitled toreceive notices under the terms of the deposit agreement relating to BPADSs. The substance and timing of notices is described above under theheading Voting Rights.
Under the Articles of Association, the AGM of shareholders willbe held within the six-month period from the first day of BP’s accountingperiod. All general meetings shall be held at a time and placedetermined by the directors within the UK. If any shareholders’ meetingis adjourned for lack of quorum, notice of the time and place of themeeting may be given in any lawful manner, including electronically.Powers exist for action to be taken either before or at the meeting byauthorized officers to ensure its orderly conduct and safety of thoseattending.
Limitations on voting and shareholding
There are no limitations imposed by English law or the company’sMemorandum or Articles of Association on the right of non-residentsor foreign persons to hold or vote the company’s ordinary sharesor ADSs, other than limitations that would generally apply to all of theshareholders.
Disclosure of interests in shares
The UK Companies Act permits a public company, on written notice, torequire any person whom the company believes to be or, at any timeduring the previous three years prior to the issue of the notice, to havebeen interested in its voting shares, to disclose certain information withrespect to those interests. Failure to supply the information requiredmay lead to disenfranchisement of the relevant shares and a prohibitionon their transfer and receipt of dividends and other payments in respectof those shares. In this context the term ‘interest’ is widely defined andwill generally include an interest of any kind whatsoever in votingshares, including any interest of a holder of BP ADSs.
Exchange controlsThere are currently no UK foreign exchange controls or restrictions onremittances of dividends on the ordinary shares or on the conduct of thecompany’s operations.
There are no limitations, either under the laws of the UK or underthe company’s Articles of Association, restricting the right of non-resident or foreign owners to hold or vote BP ordinary or preferenceshares in the company.
TaxationThis section describes the material US federal income tax and UKtaxation consequences of owning ordinary shares or ADSs to a USholder who holds the ordinary shares or ADSs as capital assets for taxpurposes. It does not apply, however, to members of special classes ofholders subject to special rules and holders that, directly or indirectly,hold 10% or more of the company’s voting stock. In addition, if apartnership holds the shares or ADSs, the United States federal incometax treatment of a partner will generally depend on the status of thepartner and the tax treatment of the partnership, and may not bedescribed fully below.
A US holder is any beneficial owner of ordinary shares or ADSsthat is for US federal income tax purposes (i) a citizen or resident of theUS, (ii) a US domestic corporation, (iii) an estate whose income issubject to US federal income taxation regardless of its source, or (iv)a trust if a US court can exercise primary supervision over the trust’sadministration and one or more US persons are authorized to controlall substantial decisions of the trust.
This section is based on the Internal Revenue Code of 1986, asamended, its legislative history, existing and proposed regulationsthereunder, published rulings and court decisions, and the taxation lawsof the UK, all as currently in effect, as well as the income tax conventionbetween the US and the UK that entered into force on 31 March 2003(the Treaty). These laws are subject to change, possibly on a retroactivebasis. This section is further based in part on the representations of theDepositary and assumes that each obligation in the Deposit Agreementand any related agreement will be performed in accordance withits terms.
For purposes of the Treaty and the estate and gift tax Convention(the ‘Estate Tax Convention’), and for US federal income tax and UKtaxation purposes, a holder of ADRs evidencing ADSs will be treated asthe owner of the company’s ordinary shares represented by thoseADRs. Exchanges of ordinary shares for ADRs and ADRs for ordinaryshares generally will not be subject to US federal income tax or to UKtaxation other than stamp duty or stamp duty reserve tax, as describedbelow.
Investors should consult their own tax adviser regarding theUS federal, state and local, the UK and other tax consequences ofowning and disposing of ordinary shares and ADSs in their particularcircumstances, and in particular whether they are eligible for thebenefits of the Treaty.
Taxation of dividends
UK taxationUnder current UK taxation law, no withholding tax will be deducted fromdividends paid by the company, including dividends paid to US holders.A shareholder that is a company resident for tax purposes in the UK ortrading in the UK through a permanent establishment generally willnot be taxable in the UK on a dividend it receives from the company.A shareholder who is an individual resident for tax purposes in theUK is subject to UK tax but entitled to a tax credit on cash dividendspaid on ordinary shares or ADSs of the company equal to one-ninth ofthe cash dividend.
BOL08439_p090 pp106_Add info:20 F 5/3/10 17:32 Page 99 Bleed: 0�mm Scale: 100%

100
Additional information for shareholders
US federal income taxationA US holder is subject to US federal income taxation on the grossamount of any dividend paid by the company out of its current oraccumulated earnings and profits (as determined for US federal incometax purposes). Dividends paid to a non-corporate US holder in taxableyears beginning before 1 January 2011 that constitute qualified dividendincome will be taxable to the holder at a maximum tax rate of 15%,provided that the holder has a holding period in the ordinary sharesor ADSs of more than 60 days during the 121-day period beginning60 days before the ex-dividend date and meets other holding periodrequirements. Dividends paid by the company with respect to the sharesor ADSs will generally be qualified dividend income.
As noted above in UK taxation, a US holder will not be subject toUK withholding tax. A US holder will include in gross income for USfederal income tax purposes the amount of the dividend actually receivedfrom the company and the receipt of a dividend will not entitle the USholder to a foreign tax credit.
For US federal income tax purposes, a dividend must be includedin income when the US holder, in the case of ordinary shares, or theDepositary, in the case of ADSs, actually or constructively receives thedividend, and will not be eligible for the dividends-received deductiongenerally allowed to US corporations in respect of dividends receivedfrom other US corporations. Dividends will be income from sourcesoutside the US, and generally will be ‘passive category income’ or, in thecase of certain US holders, ‘general category income,’ each of which istreated separately for purposes of computing a US holder’s foreign taxcredit limitation.
The amount of the dividend distribution on the ordinary shares orADSs that is paid in pounds sterling will be the US dollar value of thepounds sterling payments made, determined at the spot poundssterling/US dollar rate on the date the dividend distribution is includible inincome, regardless of whether the payment is in fact converted into USdollars. Generally, any gain or loss resulting from currency exchangefluctuations during the period from the date the pounds sterling dividendpayment is includible in income to the date the payment is converted intoUS dollars will be treated as ordinary income or loss and will not beeligible for the 15% tax rate on qualified dividend income. The gain orloss generally will be income or loss from sources within the US forforeign tax credit limitation purposes.
Distributions in excess of the company’s earnings and profits, asdetermined for US federal income tax purposes, will be treated as areturn of capital to the extent of the US holder’s basis in the ordinaryshares or ADSs and thereafter as capital gain, subject to taxation asdescribed in Taxation of capital gains – US federal income taxation.
In addition, the taxation of dividends may be subject to the rulesfor passive foreign investment companies, described below under‘Capital Gains – US federal income taxation’. Distributions made by aPFIC do not constitute qualified dividend income and are not eligible forthe 15% tax rate.
Taxation of capital gains
UK taxationA US holder may be liable for both UK and US tax in respect of a gain onthe disposal of ordinary shares or ADSs if the US holder is (i) a citizen ofthe US resident or ordinarily resident in the UK, (ii) a US domesticcorporation resident in the UK by reason of its business being managedor controlled in the UK or (iii) a citizen of the US or a corporation thatcarries on a trade or profession or vocation in the UK through a branch oragency or, in respect of corporations for accounting periods beginning onor after 1 January 2003, through a permanent establishment, and thathave used, held, or acquired the ordinary shares or ADSs for thepurposes of such trade, profession or vocation of such branch, agency orpermanent establishment. However, such persons may be entitled to atax credit against their US federal income tax liability for the amount ofUK capital gains tax or UK corporation tax on chargeable gains (as thecase may be) that is paid in respect of such gain.
Under the Treaty, capital gains on dispositions of ordinary shares or ADSsgenerally will be subject to tax only in the jurisdiction of residence of therelevant holder as determined under both the laws of the UK and the USand as required by the terms of the Treaty.
Under the Treaty, individuals who are residents of either the UK orthe US and who have been residents of the other jurisdiction (the US orthe UK, as the case may be) at any time during the six years immediatelypreceding the relevant disposal of ordinary shares or ADSs may besubject to tax with respect to capital gains arising from a disposition ofordinary shares or ADSs of the company not only in the jurisdiction ofwhich the holder is resident at the time of the disposition but also in theother jurisdiction.
US federal income taxationA US holder that sells or otherwise disposes of ordinary shares or ADSswill recognize a capital gain or loss for US federal income tax purposesequal to the difference between the US dollar value of the amountrealized and the holder’s tax basis, determined in US dollars, in theordinary shares or ADSs. Capital gain of a non-corporate US holder that isrecognized in taxable years beginning before 1 January 2011 is generallytaxed at a maximum rate of 15% if the holder’s holding period for suchordinary shares or ADSs exceeds one year. The gain or loss willgenerally be income or loss from sources within the US for foreign taxcredit limitation purposes. The deductibility of capital losses is subjectto limitations.
We do not believe that ordinary shares or ADSs will be treated asstock of a passive foreign investment company, or PFIC, for US federalincome tax purposes, but this conclusion is a factual determination that ismade annually and thus is subject to change. If we are treated as a PFIC,unless a US holder elects to be taxed annually on a mark-to-market basiswith respect to ordinary shares or ADSs, gain realized on the sale orother disposition of ordinary shares or ADSs would in general not betreated as capital gain. Instead a US holder would be treated as if he orshe had realized such gain rateably over the holding period for ordinaryshares or ADSs and would be taxed at the highest tax rate in effect foreach such year to which the gain was allocated, in addition to which aninterest charge in respect of the tax attributable to each such year wouldapply. Certain ‘excess distributions’ would be similarly treated if we weretreated as a PFIC.
Additional tax considerations
Proposed scrip dividend programmeSubject to shareholder approval at the Annual General Meeting on15 April, the company is planning to introduce an optional scrip dividendprogramme, wherein holders of ordinary shares or ADSs may elect toreceive their dividends in the form of new fully paid ordinary shares orADSs of the company, instead of cash. Please consult your tax adviserfor the consequences to you.
UK inheritance taxThe Estate Tax Convention applies to inheritance tax. ADSs held by anindividual who is domiciled for the purposes of the Estate Tax Conventionin the US and is not for the purposes of the Estate Tax Convention anational of the UK will not be subject to UK inheritance tax on theindividual’s death or on transfer during the individual’s lifetime unless,among other things, the ADSs are part of the business property of apermanent establishment situated in the UK used for the performance ofindependent personal services. In the exceptional case where ADSs aresubject both to inheritance tax and to US federal gift or estate tax, theEstate Tax Convention generally provides for tax payable in the US to becredited against tax payable in the UK or for tax paid in the UK to becredited against tax payable in the US, based on priority rules set forth inthe Estate Tax Convention.
BOL08439_p090 pp106_Add info:20 F 5/3/10 17:32 Page 100 Bleed: 0�mm Scale: 100%

101
Additional information for shareholders
UK stamp duty and stamp duty reserve taxThe statements below relate to what is understood to be the currentpractice of HM Revenue & Customs in the UK under existing law.
Provided that any instrument of transfer is not executed in the UKand remains at all times outside the UK and the transfer does not relateto any matter or thing done or to be done in the UK, no UK stamp duty ispayable on the acquisition or transfer of ADSs. Neither will an agreementto transfer ADSs in the form of ADRs give rise to a liability to stamp dutyreserve tax.
Purchases of ordinary shares, as opposed to ADSs, through theCREST system of paperless share transfers will be subject to stamp dutyreserve tax at 0.5%. The charge will arise as soon as there is anagreement for the transfer of the shares (or, in the case of a conditionalagreement, when the condition is fulfilled). The stamp duty reserve taxwill apply to agreements to transfer ordinary shares even if theagreement is made outside the UK between two non-residents.Purchases of ordinary shares outside the CREST system are subjecteither to stamp duty at a rate of £5 per £1,000 (or part, unless the stampduty is less than £5, when no stamp duty is charged), or stamp dutyreserve tax at 0.5%. Stamp duty and stamp duty reserve tax aregenerally the liability of the purchaser.
A subsequent transfer of ordinary shares to the Depositary’snominee will give rise to further stamp duty at the rate of £1.50 per £100(or part) or stamp duty reserve tax at the rate of 1.5% of the value of theordinary shares at the time of the transfer. An ADR holder electing toreceive ADSs instead of a cash dividend will be responsible for the stampduty reserve tax due on issue of shares to the Depositary’s nominee andcalculated at the rate of 1.5% on the issue price of the shares. It isunderstood that HM Revenue & Customs, practice is to calculate theissue price by reference to the total cash receipt to which a US holderwould have been entitled had the election to receive ADSs instead of acash dividend not been made. ADR holders electing to receive ADSsinstead of the cash dividend authorize the Depositary to sell sufficientshares to cover this liability.
Documents on displayBP’s Annual Report and Accounts is also available online atwww.bp.com/annualreport. Shareholders may obtain a hard copy of BP’scomplete audited financial statements, free of charge, by contacting BPDistribution Services at +44 (0)870 241 3269 or through an email requestaddressed to [email protected] (UK and Rest of World) orfrom Precision IR at + 1 888 301 2505 or through an email requestaddressed to [email protected] (US and Canada).
The company is subject to the information requirements of theUS Securities Exchange Act of 1934 applicable to foreign private issuers.In accordance with these requirements, the company files its AnnualReport on Form 20-F and other related documents with the SEC. It ispossible to read and copy documents that have been filed with the SECat the SEC’s public reference room located at 100 F Street NE,Washington, DC 20549, US. You may also call the SEC at +1 800-SEC-0330 or log on to www.sec.gov. In addition, BP’s SEC filings are availableto the public at the SEC’s website www.sec.gov. BP discloses on itswebsite at www.bp.com/NYSEcorporategovernancerules, and in itsAnnual Report on Form 20-F (Item 16G) significant ways (if any) in whichits corporate governance practices differ from those mandated for UScompanies under NYSE listing standards.
Controls and proceduresEvaluation of disclosure controls and procedures
The company maintains ‘disclosure controls and procedures’ as suchterm is defined in Exchange Act Rule 13a-15(e), that are designed toensure that information required to be disclosed in reports the company
Ad
ditio
nal in
form
atio
n fo
r sh
are
ho
lders
files or submits under the Exchange Act is recorded, processed,summarized and reported within the time periods specified in theSecurities and Exchange Commission rules and forms, and that suchinformation is accumulated and communicated to management, includingthe company’s group chief executive and chief financial officer, asappropriate, to allow timely decisions regarding required disclosure.
In designing and evaluating our disclosure controls andprocedures, our management, including the group chief executive andchief financial officer, recognize that any controls and procedures, nomatter how well designed and operated, can provide only reasonable, notabsolute, assurance that the objectives of the disclosure controls andprocedures are met. Because of the inherent limitations in all controlsystems, no evaluation of controls can provide absolute assurance thatall control issues and instances of fraud, if any, within the company havebeen detected. Further, in the design and evaluation of our disclosurecontrols and procedures our management necessarily was required toapply its judgement in evaluating the cost-benefit relationship of possiblecontrols and procedures. Also, we have investments in certainunconsolidated entities. As we do not control these entities, ourdisclosure controls and procedures with respect to such entities arenecessarily substantially more limited than those we maintain withrespect to our consolidated subsidiaries. Because of the inherentlimitations in a cost-effective control system, misstatements due to erroror fraud may occur and not be detected. The company’s disclosurecontrols and procedures have been designed to meet, and managementbelieve that they meet, reasonable assurance standards.
The company’s management, with the participation of thecompany’s group chief executive and chief financial officer, has evaluatedthe effectiveness of the company’s disclosure controls and procedurespursuant to Exchange Act Rule 13a-15(b) as of the end of the periodcovered by this annual report. Based on that evaluation, the group chiefexecutive and chief financial officer have concluded that the company’sdisclosure controls and procedures were effective at a reasonableassurance level.
Changes in internal controls over financial reporting
There were no changes in the group’s internal controls over financialreporting that occurred during the period covered by the Form 20-F thathave materially affected or are reasonably likely to materially affect, ourinternal controls over financial reporting.
Management’s report on internal control over financial reporting
Management of BP is responsible for establishing and maintainingadequate internal control over financial reporting. BP’s internal controlover financial reporting is a process designed under the supervisionof the principal executive and principal financial officers to providereasonable assurance regarding the reliability of financial reporting andthe preparation of BP’s financial statements for external reportingpurposes in accordance with IFRS.
As of the end of the 2009 fiscal year, management conducted anassessment of the effectiveness of internal control over financialreporting in accordance with the Internal Control Revised Guidance forDirectors on the Combined Code (Turnbull). Based on this assessment,management has determined that BP’s internal control over financialreporting as of 31 December 2009 was effective.
The company’s internal control over financial reporting includespolicies and procedures that pertain to the maintenance of recordsthat, in reasonable detail, accurately and fairly reflect transactions anddispositions of assets; provide reasonable assurances that transactionsare recorded as necessary to permit preparation of financial statementsin accordance with IFRS and that receipts and expenditures are beingmade only in accordance with authorizations of management and thedirectors of BP; and provide reasonable assurance regarding preventionor timely detection of unauthorized acquisition, use or disposition of BP’sassets that could have a material effect on our financial statements.
BOL08439_p090 pp106_Add info:20 F 5/3/10 17:32 Page 101 Bleed: 0�mm Scale: 100%

102
Additional information for shareholders
BP’s internal control over financial reporting as of 31 December 2009 hasbeen audited by Ernst & Young LLP, an independent registered publicaccounting firm, as stated in their report appearing on page 108 of thisAnnual Report on Form 20-F 2009.
Code of ethicsThe company has adopted a code of ethics for its group chief executive,chief financial officer, deputy chief financial officer, group controller,general auditors and chief accounting officer as required by the provisionsof Section 406 of the Sarbanes-Oxley Act of 2002 and the rules issued bythe SEC. There have been no waivers from the code of ethics relating toany officers. The code has been amended to reflect changes to the titlesand posts of certain senior officers. The amended code of ethics hasbeen filed as an exhibit to our Annual Report on Form 20-F.
In June 2005, BP published a code of conduct, which is applicableto all employees.
Principal accountants’ fees and servicesThe audit committee has established policies and procedures for theengagement of the independent registered public accounting firm, Ernst& Young LLP, to render audit and certain assurance and tax services. Thepolicies provide for pre-approval by the audit committee of specificallydefined audit, audit-related, tax and other services that are not prohibitedby regulatory or other professional requirements. Ernst & Young isengaged for these services when its expertise and experience of BP areimportant. Most of this work is of an audit nature. Tax services wereawarded either through a full competitive tender process or following anassessment of the expertise of Ernst & Young relative to that of otherpotential service providers. These services are for a fixed term.
Under the policy, pre-approval is given for specific services withinthe following categories: advice on accounting, auditing and financialreporting matters; internal accounting and risk management controlreviews (excluding any services relating to information systems designand implementation); non-statutory audit; project assurance and adviceon business and accounting process improvement (excluding anyservices relating to information systems design and implementationrelating to BP’s financial statements or accounting records); due diligencein connection with acquisitions, disposals and joint ventures (excludingvaluation or involvement in prospective financial information); income taxand indirect tax compliance and advisory services; and employee taxservices (excluding tax services that could impair independence);provision of, or access to, Ernst & Young publications, workshops,seminars and other training materials; provision of reports from datagathered on non-financial policies and information; and assistance withunderstanding non-financial regulatory requirements. Additionally, anyproposed service not included in the pre-approved services, must beapproved in advance prior to commencement of the engagement. Theaudit committee has delegated to the chairman of the audit committeeauthority to approve permitted services provided that the chairmanreports any decisions to the committee at its next scheduled meeting.
The audit committee evaluates the performance of the auditorseach year. The audit fees payable to Ernst & Young are reviewed bythe committee in the context of other global companies for costeffectiveness. The committee keeps under review the scope and resultsof audit work and the independence and objectivity of the auditors.External regulation and BP policy requires the auditors to rotate their leadaudit partner every five years.
(See Financial statements – Note 14 on page 134 and Auditcommittee report on page 70 for details of audit fees.)
Corporate governance practicesIn the US, BP ADSs are listed on the New York Stock Exchange (NYSE).The significant differences between BP’s corporate governance practicesas a UK company and those required by NYSE listing standards for UScompanies are listed as follows:
Independence
BP has adopted a robust set of board governance principles, whichreflect the UK’s Combined Code and its principles-based approach tocorporate governance. As such, the way in which BP makesdeterminations of directors’ independence differs from the NYSE rules.
BP’s board governance principles require that all non-executivedirectors be determined by the board to be ‘independent in character andjudgement and free from any business or other relationship which couldmaterially interfere with the exercise of their judgement’. The BP boardhas determined that, in its judgement, all of the non-executive directorsare independent. In doing so, however, the board did not explicitly takeinto consideration the independence requirements outlined in the NYSE’slisting standards.
Committees
BP has a number of board committees which are broadly comparable inpurpose and composition to those required by NYSE rules for domesticUS companies. For instance, BP has a chairman’s (rather than executive)committee, nomination (rather than nominating/corporate governance)committee and remuneration (rather than compensation) committee.BP also has an audit committee, which NYSE rules require for both UScompanies and foreign private issuers. These committees are composedsolely of non-executive directors whom the board has determined to beindependent, in the manner described above.
The BP board governance principles prescribe the composition,main tasks and requirements of each of the committees (see the boardcommittees on pages 70-76). BP has not, therefore, adopted separatecharters for each committee.
Under US securities law and the listing standards of the NYSE, BPis required to have an audit committee which satisfies the requirementsof Rule 10A-3 under the Exchange Act and Section 303A.06 of the NYSEListed Company Manual. BP’s audit committee complies with theserequirements.
One of the NYSE’s additional requirements for the auditcommittee states that at least one member of the audit committee is tohave ‘accounting or related financial management expertise’. As reportedin BP Annual Report on Form 20-F 2008, the board determined thatDouglas Flint possessed such expertise and also possesses the financialand audit committee experiences set forth in both the Combined Codeand SEC rules (see Audit committee report on page 70).
Shareholder approval of equity compensation plans
The NYSE rules for US companies require that shareholders must begiven the opportunity to vote on all equity-compensation plans andmaterial revisions to those plans. BP complies with UK requirementswhich are similar to the NYSE rules. The board, however, does notexplicitly take into consideration the NYSE’s detailed definition of whatare considered ‘material revisions’.
Code of ethics
The NYSE rules require that US companies adopt and disclose a code ofbusiness conduct and ethics for directors, officers and employees. BP hasadopted a code of conduct, which applies to all employees, and has boardgovernance principles which address the conduct of directors. In additionBP has adopted a code of ethics for senior financial officers as required bythe SEC. The code has been amended to reflect changes to the titles andposts of certain senior officers. BP considers that these codes and policiesaddress the matters specified in the NYSE rules for US companies.
BOL08439_p090 pp106_Add info:20 F 5/3/10 17:32 Page 102 Bleed: 0�mm Scale: 100%

103
Additional information for shareholders
Ad
ditio
nal in
form
atio
n fo
r sh
are
ho
lders
BOL08439_p090 pp106_Add info:20 F 5/3/10 17:32 Page 103 Bleed: 0�mm Scale: 100%
Purchases of equity securities by the issuer and affiliated purchasersAt the AGM on 16 April 2009, authorization was given to repurchase up to 1.8 billion ordinary shares in the period to the next AGM in 2010 or 15 July2010, the latest date by which an AGM must be held. This authorization is renewed annually at the AGM. No repurchases of shares were made in theperiod 1 January 2009 to 18 February 2010.
The following table provides details of share purchases made by ESOP trusts.
Total number of shares Maximum number of$ purchased as part of shares that may yet
Total number of Average price publicly announced be purchased undershares purchased paid per share programmes the programmea
2009January – –
February 126 7.48
March 118 6.35
April – –
May – –
June 553 7.46
July 1,090,018 8.35
August 54 8.16
September 134 8.36
October 713 8.42
November 1,265,242 11.41
December 58 8.82
2010January 51 10.36
February (to 18 February) 144,523 11.41
aNo shares were repurchased pursuant to a publicly announced plan. Transactions represent the purchase of ordinary shares by ESOP trusts to satisfy future requirements of employee share schemes.
Fees and charges payable by a holder of ADSsThe Depositary collects fees for delivery and surrender of ADSs directly from investors depositing shares or surrendering ADSs for the purpose ofwithdrawal or from intermediaries acting for them. The Depositary collects fees for making distributions to investors by deducting those fees from theamounts distributed or by selling a portion of the distributable property to pay the fees.
The charges of the Depositary payable by investors are as follows:
Type of service Depositary actions Fee
Depositing or substituting the Issuance of ADSs against the deposit of shares, $5.00 per 100 ADSs (or portion thereof)underlying shares including deposits and issuances in respect of: evidenced by the new ADSs delivered
• Share distributions, stock splits, rights, merger• Exchange of securities or other transactions or
event or other distribution affecting the ADSs or deposited securities
Selling or exercising rights Distribution or sale of securities, the fee being in an $5.00 per 100 ADSs (or portion thereof)amount equal to the fee for the execution and delivery of ADSs which would have been charged as a result of the deposit of such securities
Withdrawing an underlying Acceptance of ADSs surrendered for withdrawal of $5.00 for each 100 ADSs (or portionshare deposited securities thereof) evidenced by the ADSs
surrendered
Expenses of the Depositary Expenses incurred on behalf of holders in connection with: Expenses payable at the sole discretion• Stock transfer or other taxes and governmental of the Depositary by billing holders or
charges by deducting charges from one or by• Cable, telex, electronic and facsimile deducting charges from one or more
transmission/delivery cash dividends or other cash• Transfer or registration fees, if applicable, for the distributions
registration of transfers of underlying shares• Expenses of the Depositary in connection with the
conversion of foreign currency into US dollars (which are paid out of such foreign currency)

104
Additional information for shareholders
Fees and payments made by theDepositary to the issuer
BOL08439_p090 pp106_Add info:20 F 5/3/10 17:32 Page 104 Bleed: 0�mm Scale: 100%
The Depositary has agreed to reimburse certain company expensesrelated to the company’s ADS programme and incurred by the companyin connection with the programme. The Depositary reimbursed to thecompany, or paid amounts on the company’s behalf to third parties, orwaived its fees and expenses, of $4,565,411 for the year ended31 December 2009.
The table below sets forth the types of expenses that theDepositary has agreed to reimburse, and the invoices relating to the yearended 31 December 2009 that were reimbursed:
Category of expense reimbursed Amount reimbursed for the yearto the company ended 31 December 2009
NYSE listing feesa $500,000Printing costs in connection with USshareholder communications and AGMrelated expenses in connection withthe ADR programme $140,226Total $640,226
aDuring 2009 the company received a payment of $500,000 from the Depositary in respect of NYSElisting fee for 2008.
The Depositary has also agreed to waive fees for standard costsassociated with the administration of the ADS programme and has paidcertain expenses directly to third parties on behalf of the company. Thetable below sets forth those expenses that the Depositary waived or paiddirectly to third parties relating to the year ended 31 December 2009:
Category of expense waived or paid Amount reimbursed for the yeardirectly to third partiesa ended 31 December 2009
Service fees and out of pocket expenses waivedb $2,706,973Broker reimbursementsc $1,070,408Other third-party mailing costsd $132,435Transfer agency fees in Canadae $10,441Other third-party expenses paid directly $4,928Total $3,925,185
aIn addition to the reimbursed and waived fees for the year ended 31 December 2009, theDepositary also reimbursed, waived or paid directly to third parties $2,656,148 that related to theyear ended 31 December 2008.
b Includes fees in relation to transfer agent costs and operation of BP Direct Access Plan byJPMorgan Chase.
cBroker reimbursements are fees payable to Broadridge and other service providers for thedistribution of hard copy material to ADR beneficial holders in the Depositary Trust Company.Corporate materials include information related to shareholders’ meetings and related votinginstructions. These fees are SEC approved.
dReimbursement of fees to UPS Mail innovations, Precision IR and Bank of New York Mellon fordistribution of hard copy materials to ADR beneficial holders and proxy solicitation.
eFees payable to CIBC as co-transfer agent for Canadian ADR holders.
Under certain circumstances, including removal of the Depositary ortermination of the ADR programme by the company, the company isrequired to repay the Depositary amounts reimbursed and/or expensespaid to or on behalf of the company during the 12-month period prior tonotice of removal or termination.
Called-up share capitalDetails of the allotted, called up and fully paid share capital at31 December 2009 are set out in Financial statements – Note 36 onpage 165.
At the AGM on 16 April 2009, authorization was given to thedirectors to allot shares up to an aggregate nominal amount equal to$1,561 million. Authority was also given to the directors to allot shares forcash and to dispose of treasury shares, other than by way of rights issue,up to a maximum of $234 million, without having to offer such shares toexisting shareholders. These authorities are given for the period until thenext AGM in 2010 or 15 July 2010, whichever is the earlier. Theseauthorities are renewed annually at the AGM.
AdministrationIf you have any queries about the administration of shareholdings, suchas change of address, change of ownership, dividend payments, thedividend reinvestment plan or the ADS direct access plan, or to changethe way you receive your company documents (such as the AnnualReport and Accounts, Annual Review and Notice of Meeting) pleasecontact the BP Registrar or ADS Depositary.
UK – Registrar’s OfficeThe BP Registrar, EquinitiAspect House, Spencer Road, Lancing, West Sussex BN99 6DAFreephone in UK 0800 701107; Tel +44 (0)121 415 7005Textphone 0871 384 2255; Fax +44 (0)871 384 2100
Please note that any numbers quoted with the prefix 0871 will becharged at 8p per minute from a BT landline. Other network providers’costs may vary.
US – ADS DepositaryJPMorgan Chase Bank, N.A.PO Box 64504, St. Paul, MN 55164-0504Toll-free in US and Canada +1 877 638 5672; Tel +1 651 306 4383For the hearing impaired +1 651 453 2133
Annual general meetingThe 2010 AGM will be held on Thursday, 15 April 2010 at 11.30 a.m.at ExCeL London, One Western Gateway, Royal Victoria Dock, LondonE16 1XL. A separate notice convening the meeting is distributed toshareholders, which includes an explanation of the items of business tobe considered at the meeting.
All resolutions of which notice has been given will be decidedon a poll.
Ernst & Young LLP have expressed their willingness to continue inoffice as auditors and a resolution for their reappointment is included inNotice of BP Annual General Meeting 2010.
By order of the boardDavid J JacksonSecretary26 February 2010
BP p.l.c.Registered in England and Wales No. 102498

105
Additional information for shareholders
Ad
ditio
nal in
form
atio
n fo
r sh
are
ho
lders
ExhibitsThe following documents are filed as part of this annual report:Exhibit 1. Memorandum and Articles of Association of BP p.l.c.*†Exhibit 4.1 The BP Executive Directors’ Incentive Plan** †Exhibit 4.2 Medium Term Performance Plan*** †Exhibit 4.3 Deferred Annual Bonus Plan*** †Exhibit 4.4 Performance Share Plan*** †Exhibit 4.5 Director’s Service Contract and Secondment Agreement for
RW Dudley†Exhibit 4.6 Amended Director’s Service Contract and Secondment
Agreement for Dr BE Grote****†Exhibit 7. Computation of Ratio of Earnings to Fixed Charges (Unaudited)†Exhibit 8. Subsidiaries (included as Note 43 to the Financial
Statements)Exhibit 11. Code of Ethics†Exhibit 12. Rule 13a – 14(a) Certifications†Exhibit 13. Rule 13a – 14(b) Certifications# †
*Incorporated by reference to the company's Report on Form 6-K filed on 22 May 2008 (FileNo. 001 06262)
**Incorporated by reference to the company’s Annual Report on Form 20-F for the year ended31 December 2004.
***Incorporated by reference to the company’s Annual Report on Form 20-F for the year ended31 December 2008.
****The original Director’s Service Contract and Secondment Agreement for Dr BE Grote isincorporated by reference to the company’s Annual Report on Form 20-F for the year ended 31 December 2002.
#Furnished only.†Included only in the annual report filed in the Securities and Exchange Commission EDGAR system.
The total amount of long-term securities of the Registrant and itssubsidiaries authorized under any one instrument does not exceed 10%of the total assets of BP p.l.c. and its subsidiaries on a consolidatedbasis. The company agrees to furnish copies of any or all suchinstruments to the Securities and Exchange Commission upon request.
BOL08439_p090 pp106_Add info:20 F 5/3/10 17:32 Page 105 Bleed: 0�mm Scale: 100%

106
BOL08439_p090 pp106_Add info:20 F 5/3/10 17:32 Page 106 Bleed: 0�mm Scale: 100%

Financial statements
108 Consolidated financial statementsof the BP groupReport of independent registered public accounting firm 108Consent of independent registered public accounting firm 109Group income statement 110Group statement of comprehensive income 111Group statement of changes in equity 111Group balance sheet 112Group cash flow statement 113
114 Notes on financial statements1 Significant accounting policies 1142 Acquisitions 1223 Disposals and impairment 1224 Segmental analysis 1245 Interest and other income 1296 Production and similar taxes 1297 Depreciation, depletion and amortization 1298 Impairment review of goodwill 1309 Distribution and administration expenses 13210 Currency exchange gains and losses 13211 Research and development 13212 Operating leases 13213 Exploration for and evaluation of oil and natural gas resources 13314 Auditor's remuneration 13415 Finance costs 13416 Taxation 13517 Dividends 13718 Earnings per ordinary share 13719 Property, plant and equipment 13820 Goodwill 13921 Intangible assets 13922 Investments in jointly controlled entities 14023 Investments in associates 14124 Financial instruments and financial risk factors 14225 Other investments 14826 Inventories 14827 Trade and other receivables 14828 Cash and cash equivalents 14929 Valuation and qualifying accounts 14930 Trade and other payables 14931 Derivative financial instruments 15032 Finance debt 15633 Capital disclosures and analysis of changes in net debt 157
34 Provisions 15835 Pensions and other post-retirement benefits 15936 Called up share capital 16537 Capital and reserves 16638 Share-based payments 17039 Employee costs and numbers 17240 Remuneration of directors and senior management 17341 Contingent liabilities 17442 Capital commitments 17443 Subsidiaries, jointly controlled entities and associates 17544 Condensed consolidating information on certain US
subsidiaries 177
183 Supplementary information onoil and natural gas (unaudited)
Fin
an
cia
l sta
tem
en
ts
BOL08439_p107.qxp:20 F 5/3/10 17:32 Page 107 Bleed: 0�mm Scale: 100%

108
Consolidated financial statements of the BP group
Report of Independent Registered Public Accounting FirmThe Board of Directors and Shareholders of BP p.l.c.
We have audited the accompanying group balance sheets of BP p.l.c. as of 31 December 2009 and 2008, and the related group income statement,group cash flow statement, group statement of comprehensive income and group statement of changes in equity, for each of the three years in theperiod ended 31 December 2009. These financial statements are the responsibility of the company’s management. Our responsibility is to express anopinion on these financial statements based on our audits.
We conducted our audits in accordance with the standards of the Public Company Accounting Oversight Board (United States). Thosestandards require that we plan and perform the audit to obtain reasonable assurance about whether the financial statements are free of materialmisstatement. An audit includes examining, on a test basis, evidence supporting the amounts and disclosures in the financial statements. An auditalso includes assessing the accounting principles used and significant estimates made by management, as well as evaluating the overall financialstatement presentation. We believe that our audits provide a reasonable basis for our opinion.
In our opinion, the financial statements referred to above present fairly, in all material respects, the group financial position of BP p.l.c. at31 December 2009 and 2008, and the group results of operations and cash flows for each of the three years in the period ended 31 December 2009,in accordance with International Financial Reporting Standards as adopted by the European Union and International Financial Reporting Standards asissued by the International Accounting Standards Board.
As discussed in Note 1 to the consolidated financial statements, the company has changed its reserve estimates and related disclosures as aresult of adopting new oil and gas reserve estimation and disclosure requirements.
We also have audited, in accordance with the standards of the Public Company Accounting Oversight Board (United States), the effectivenessof BP p.l.c.’s internal control over financial reporting as of 31 December 2009, based on criteria established in the Internal Control Revised Guidance forDirectors on the Combined Code (Turnbull) as issued by the Institute of Chartered Accountants in England and Wales (the Turnbull criteria) and ourreport dated 26 February 2010 expressed an unqualified opinion thereon.
/s/ERNST & YOUNG LLP
Ernst & Young LLPLondon, England 26 February 2010
Report of Independent Registered Public Accounting FirmThe Board of Directors and Shareholders of BP p.l.c.
We have audited BP p.l.c.’s internal control over financial reporting as of 31 December 2009, based on criteria established in Internal Control-RevisedGuidance for Directors on the Combined Code (Turnbull) as issued by the Institute of Chartered Accountants in England and Wales (the Turnbullcriteria). BP p.l.c.’s management is responsible for maintaining effective internal control over financial reporting, and for its assessment of theeffectiveness of internal control over financial reporting included in the accompanying Management’s report on internal control over financial reportingon page 101. Our responsibility is to express an opinion on the company’s internal control over financial reporting based on our audit.
We conducted our audit in accordance with the standards of the Public Company Accounting Oversight Board (United States). Those standardsrequire that we plan and perform the audit to obtain reasonable assurance about whether effective internal control over financial reporting wasmaintained in all material respects. Our audit included obtaining an understanding of internal control over financial reporting, assessing the risk that amaterial weakness exists, testing and evaluating the design and operating effectiveness of internal control based on the assessed risk, and performingsuch other procedures as we considered necessary in the circumstances. We believe that our audit provides a reasonable basis for our opinion.
A company’s internal control over financial reporting is a process designed to provide reasonable assurance regarding the reliability of financialreporting and the preparation of financial statements for external purposes in accordance with generally accepted accounting principles. A company’sinternal control over financial reporting includes those policies and procedures that (1) pertain to the maintenance of records that, in reasonable detail,accurately and fairly reflect the transactions and dispositions of the assets of the company; (2) provide reasonable assurance that transactions arerecorded as necessary to permit preparation of financial statements in accordance with generally accepted accounting principles, and that receipts andexpenditures of the company are being made only in accordance with authorizations of management and directors of the company; and (3) providereasonable assurance regarding prevention or timely detection of unauthorized acquisition, use, or disposition of the company’s assets that could havea material effect on the financial statements.
Because of its inherent limitations, internal control over financial reporting may not prevent or detect misstatements. Also, projections of anyevaluation of effectiveness to future periods are subject to the risk that controls may become inadequate because of changes in conditions, or that thedegree of compliance with the policies or procedures may deteriorate.
In our opinion, BP p.l.c. maintained, in all material respects, effective internal control over financial reporting as of 31 December 2009, based onthe Turnbull criteria.
We also have audited, in accordance with the standards of the Public Company Accounting Oversight Board (United States), the group balancesheets of BP p.l.c. as of 31 December 2009 and 2008, and the related group income statement, group cash flow statement, group statement ofcomprehensive income and group statement of changes in equity, for each of the three years in the period ended 31 December 2009, and our reportdated 26 February 2010 expressed an unqualified opinion thereon.
/s/ERNST & YOUNG LLP
Ernst & Young LLPLondon, England 26 February 2010
The maintenance and integrity of the BP p.l.c. website are the responsibility of the directors; the work carried out by the auditors does not involveconsideration of these matters and, accordingly, the auditors accept no responsibility for any changes that may have occurred to the financialstatements since they were initially presented on the website.
Legislation in the United Kingdom governing the preparation and dissemination of financial statements may differ from legislation in otherjurisdictions.
BOL08439_p108 121.qxp:20 F 5/3/10 17:32 Page 108 Bleed: 0�mm Scale: 100%

109
Consolidated financial statements of the BP group
Consent of independent registered public accounting firmWe consent to the incorporation by reference of our reports dated 26 February 2010 with respect to the group financial statements of BP p.l.c., andthe effectiveness of internal control over financial reporting of BP p.l.c., included in this Annual Report (Form 20-F) for the year ended 31 December2009 in the following registration statements:
Registration Statement on Form F-3 (File No. 333-155798) of BP p.l.c.; Registration Statement on Form F-3 (File No. 333-157906) of BP Capital Markets p.l.c. and BP p.l.c.; and Registration Statements on Form S-8 (File Nos. 333-149778, 333-79399, 333-67206, 333-102583, 333-103924, 333-123482, 333-123483,
333-131583, 333-146868, 333-146870, 333-146873, 333-131584 and 333-132619) of BP p.l.c.
/s/ERNST & YOUNG LLP
Ernst & Young LLPLondon, England 5 March 2010
Fin
an
cia
l sta
tem
en
tsFin
an
cia
l sta
tem
en
ts
BOL08439_p108 121.qxp:20 F 5/3/10 17:32 Page 109 Bleed: 0�mm Scale: 100%

110
Consolidated financial statements of the BP group
BOL08439_p108 121.qxp:20 F 5/3/10 17:32 Page 110 Bleed: 0�mm Scale: 100%
Group income statementFor the year ended 31 December $ million
Note 2009 2008 2007
Sales and other operating revenues 4 239,272 361,143 284,365Earnings from jointly controlled entities – after interest and tax 1,286 3,023 3,135Earnings from associates – after interest and tax 2,615 798 697Interest and other income 5 792 736 754Gains on sale of businesses and fixed assets 3 2,173 1,353 2,487Total revenues and other income 246,138 367,053 291,438Purchases 163,772 266,982 200,766Production and manufacturing expenses 6 23,202 26,756 24,225Production and similar taxes 6 3,752 8,953 5,703Depreciation, depletion and amortization 7 12,106 10,985 10,579Impairment and losses on sale of businesses and fixed assets 3 2,333 1,733 1,679Exploration expense 13 1,116 882 756Distribution and administration expenses 9 14,038 15,412 15,371Fair value (gain) loss on embedded derivatives 31 (607) 111 7Profit before interest and taxation 26,426 35,239 32,352Finance costs 15 1,110 1,547 1,393Net finance expense (income) relating to pensions and other post-retirement benefits 35 192 (591) (652)Profit before taxation 25,124 34,283 31,611Taxation 16 8,365 12,617 10,442Profit for the year 16,759 21,666 21,169Attributable to
BP shareholders 16,578 21,157 20,845Minority interest 181 509 324
16,759 21,666 21,169Earnings per share – cents Profit for the year attributable to BP shareholders
Basic 18 88.49 112.59 108.76Diluted 18 87.54 111.56 107.84

111
Consolidated financial statements of the BP group
–
Fin
an
cia
l sta
tem
en
ts
BOL08439_p108 121.qxp:20 F 5/3/10 17:32 Page 111 Bleed: 0�mm Scale: 100%
Group statement of comprehensive incomeFor the year ended 31 December $ million
Note 2009 2008 2007
Profit for the year 16,759 21,666 21,169Currency translation differences 1,826 (4,362) 1,887Exchange gains on translation of foreign operations transferred to gain or loss on
sale of businesses and fixed assets 3 (27) – (147)Actuarial (loss) gain relating to pensions and other post-retirement benefits 35 (682) (8,430) 1,717Available-for-sale investments marked to market 705 (994) 200Available-for-sale investments – recycled to the income statement 2 526 (91)Cash flow hedges marked to market 652 (1,173) 155Cash flow hedges – recycled to the income statement 366 45 (74)Cash flow hedges – recycled to the balance sheet 136 (38) (40)Taxation 37 525 2,946 (276)Other comprehensive income 3,503 (11,480) 3,331Total comprehensive income 20,262 10,186 24,500Attributable to
BP shareholders 20,137 9,752 24,152Minority interest 125 434 348
20,262 10,186 24,500
Group statement of changes in equity$ million
2009 2008 2007
BP BP BPshareholders’ Minority Total shareholders’ Minority Total shareholders’ Minority Total
equity interest equity equity interest equity equity interest equity
At 1 January 91,303 806 92,109 93,690 962 94,652 84,624 841 85,465Total comprehensive income 20,137 125 20,262 9,752 434 10,186 24,152 348 24,500Dividends (10,483) (416) (10,899) (10,342) (425) (10,767) (8,106) (227) (8,333)Repurchase of ordinary
share capital – – – – (2,414) – (2,414) (7,997) – (7,997)Share-based payments
(net of tax) 721 – 721 617 – 617 1,017 – 1,017Changes in associates’ equity (43) – (43) – – – – –Minority interest buyout (22) (15) (37) – (165) (165) – – –At 31 December 101,613 500 102,113 91,303 806 92,109 93,690 962 94,652
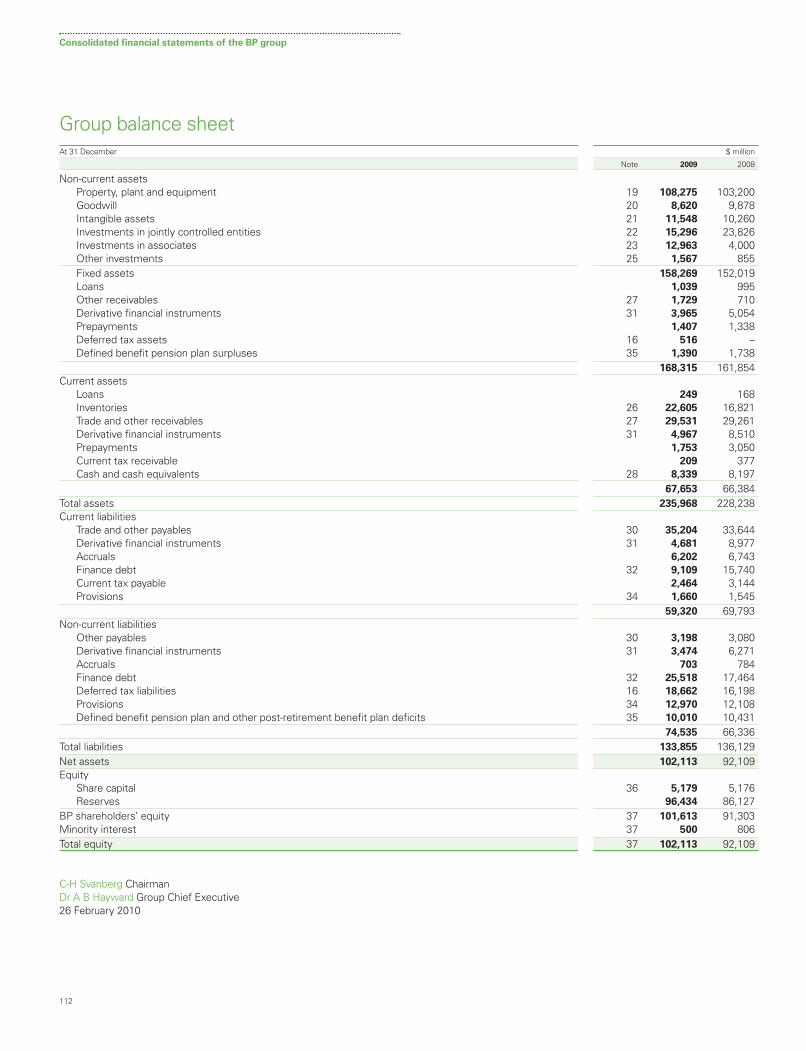
112
Consolidated financial statements of the BP group
BOL08439_p108 121.qxp:20 F 5/3/10 17:33 Page 112 Bleed: 0�mm Scale: 100%
Group balance sheetAt 31 December $ million
Note 2009 2008
Non-current assetsProperty, plant and equipment 19 108,275 103,200Goodwill 20 8,620 9,878Intangible assets 21 11,548 10,260Investments in jointly controlled entities 22 15,296 23,826Investments in associates 23 12,963 4,000Other investments 25 1,567 855Fixed assets 158,269 152,019Loans 1,039 995Other receivables 27 1,729 710Derivative financial instruments 31 3,965 5,054Prepayments 1,407 1,338Deferred tax assets 16 516 –Defined benefit pension plan surpluses 35 1,390 1,738
168,315 161,854Current assets
Loans 249 168Inventories 26 22,605 16,821Trade and other receivables 27 29,531 29,261Derivative financial instruments 31 4,967 8,510Prepayments 1,753 3,050Current tax receivable 209 377Cash and cash equivalents 28 8,339 8,197
67,653 66,384Total assets 235,968 228,238Current liabilities
Trade and other payables 30 35,204 33,644Derivative financial instruments 31 4,681 8,977Accruals 6,202 6,743Finance debt 32 9,109 15,740Current tax payable 2,464 3,144Provisions 34 1,660 1,545
59,320 69,793Non-current liabilities
Other payables 30 3,198 3,080Derivative financial instruments 31 3,474 6,271Accruals 703 784Finance debt 32 25,518 17,464Deferred tax liabilities 16 18,662 16,198Provisions 34 12,970 12,108Defined benefit pension plan and other post-retirement benefit plan deficits 35 10,010 10,431
74,535 66,336Total liabilities 133,855 136,129Net assets 102,113 92,109Equity
Share capital 36 5,179 5,176Reserves 96,434 86,127
BP shareholders’ equity 37 101,613 91,303Minority interest 37 500 806Total equity 37 102,113 92,109
C-H Svanberg ChairmanDr A B Hayward Group Chief Executive 26 February 2010
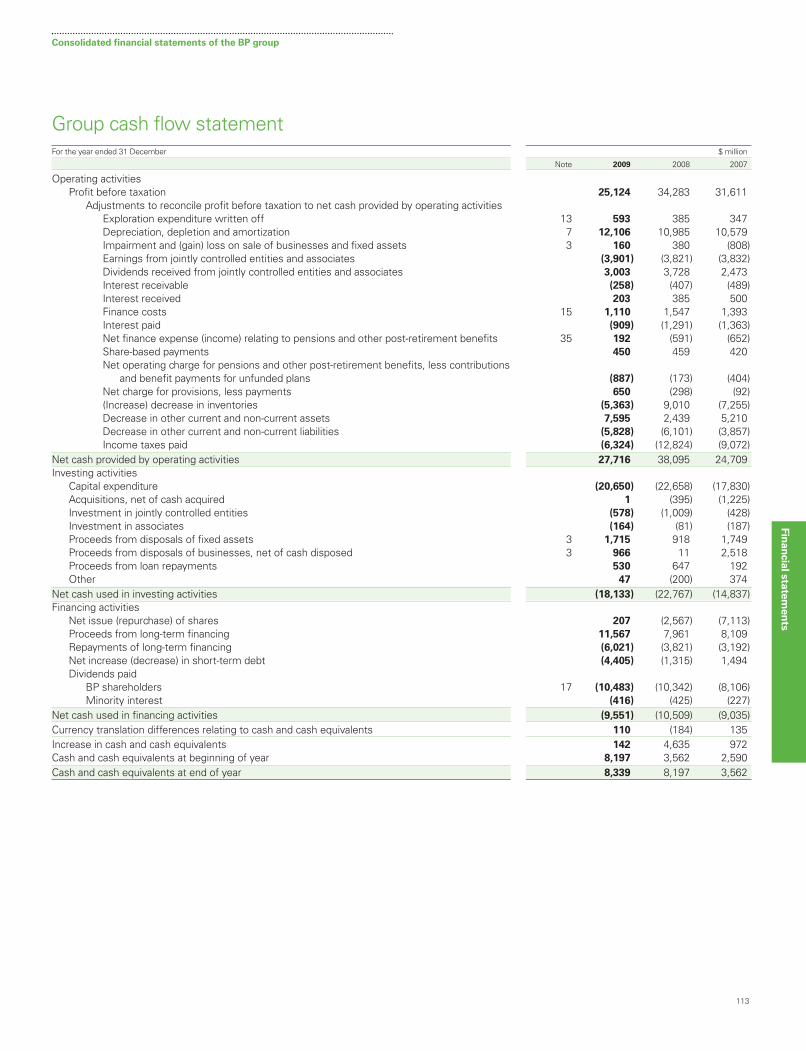
113
Consolidated financial statements of the BP group
Fin
an
cia
l sta
tem
en
ts
BOL08439_p108 121.qxp:20 F 5/3/10 17:33 Page 113 Bleed: 0�mm Scale: 100%
Group cash flow statementFor the year ended 31 December $ million
Note 2009 2008 2007
Operating activitiesProfit before taxation 25,124 34,283 31,611
Adjustments to reconcile profit before taxation to net cash provided by operating activitiesExploration expenditure written off 13 593 385 347Depreciation, depletion and amortization 7 12,106 10,985 10,579Impairment and (gain) loss on sale of businesses and fixed assets 3 160 380 (808)Earnings from jointly controlled entities and associates (3,901) (3,821) (3,832)Dividends received from jointly controlled entities and associates 3,003 3,728 2,473Interest receivable (258) (407) (489)Interest received 203 385 500Finance costs 15 1,110 1,547 1,393Interest paid (909) (1,291) (1,363)Net finance expense (income) relating to pensions and other post-retirement benefits 35 192 (591) (652)Share-based payments 450 459 420Net operating charge for pensions and other post-retirement benefits, less contributions
and benefit payments for unfunded plans (887) (173) (404)Net charge for provisions, less payments 650 (298) (92)(Increase) decrease in inventories (5,363) 9,010 (7,255)Decrease in other current and non-current assets 7,595 2,439 5,210Decrease in other current and non-current liabilities (5,828) (6,101) (3,857)Income taxes paid (6,324) (12,824) (9,072)
Net cash provided by operating activities 27,716 38,095 24,709Investing activities
Capital expenditure (20,650) (22,658) (17,830)Acquisitions, net of cash acquired 1 (395) (1,225)Investment in jointly controlled entities (578) (1,009) (428)Investment in associates (164) (81) (187)Proceeds from disposals of fixed assets 3 1,715 918 1,749Proceeds from disposals of businesses, net of cash disposed 3 966 11 2,518Proceeds from loan repayments 530 647 192Other 47 (200) 374
Net cash used in investing activities (18,133) (22,767) (14,837)Financing activities
Net issue (repurchase) of shares 207 (2,567) (7,113)Proceeds from long-term financing 11,567 7,961 8,109Repayments of long-term financing (6,021) (3,821) (3,192)Net increase (decrease) in short-term debt (4,405) (1,315) 1,494Dividends paid
BP shareholders 17 (10,483) (10,342) (8,106)Minority interest (416) (425) (227)
Net cash used in financing activities (9,551) (10,509) (9,035)Currency translation differences relating to cash and cash equivalents 110 (184) 135Increase in cash and cash equivalents 142 4,635 972Cash and cash equivalents at beginning of year 8,197 3,562 2,590Cash and cash equivalents at end of year 8,339 8,197 3,562

114
Notes on financial statements
1. Significant accounting policies
Authorization of financial statements and statement of compliance
with International Financial Reporting Standards
The consolidated financial statements of the BP group for the year ended 31 December 2009 were approved and signed by the chairmanand group chief executive on 26 February 2010 having been dulyauthorized to do so by the board of directors. BP p.l.c. is a public limitedcompany incorporated and domiciled in England and Wales. Theconsolidated financial statements have been prepared in accordancewith International Financial Reporting Standards (IFRS) as issued by theInternational Accounting Standards Board (IASB) and IFRS as adopted by the European Union (EU). IFRS as adopted by the EU differs in certainrespects from IFRS as issued by the IASB, however, the differences have no impact on the group’s consolidated financial statements for theyears presented. The significant accounting policies of the group are set out below.
Basis of preparation
The consolidated financial statements have been prepared in accordancewith IFRS and International Financial Reporting Interpretations Committee(IFRIC) interpretations issued and effective for the year ended 31 December2009, or issued and early adopted. The standards and interpretationsadopted in the year are described further on page 121.
The accounting policies that follow have been consistently appliedto all years presented. The group balance sheet as at 1 January 2008 isnot presented as it is not affected by the retrospective adoption of anynew accounting policies during the year, nor any other retrospectiverestatements or reclassifications.
The consolidated financial statements are presented in US dollarsand all values are rounded to the nearest million dollars ($ million), exceptwhere otherwise indicated.
For further information regarding the key judgements andestimates made by management in applying the group’s accountingpolicies, refer to Critical accounting policies on pages 90 to 92, whichforms part of these financial statements.
Basis of consolidation
The group financial statements consolidate the financial statementsof BP p.l.c. and the entities it controls (its subsidiaries) drawn up to31 December each year. Control comprises the power to govern thefinancial and operating policies of the investee so as to obtain benefitfrom its activities and is achieved through direct and indirect ownershipof voting rights; currently exercisable or convertible potential votingrights; or by way of contractual agreement. Subsidiaries are consolidatedfrom the date of their acquisition, being the date on which the groupobtains control, and continue to be consolidated until the date that suchcontrol ceases. The financial statements of subsidiaries are prepared forthe same reporting year as the parent company, using consistentaccounting policies. All intercompany balances and transactions, includingunrealized profits arising from intragroup transactions, have beeneliminated in full. Unrealized losses are eliminated unless the transactionprovides evidence of an impairment of the asset transferred. Minorityinterests represent the portion of profit or loss and net assets insubsidiaries that is not held by the group.
Segmental reporting
The group’s operating segments are established on the basis of thosecomponents of the group that are evaluated regularly by the chiefoperating decision maker in deciding how to allocate resources and inassessing performance. The accounting policies of the operatingsegments are the same as the group’s accounting policies described inthis note, except that IFRS requires that the measure of profit or lossdisclosed for each operating segment is the measure that is providedregularly to the chief operating decision maker. For BP, this measure ofprofit or loss is replacement cost profit before interest and tax whichreflects the replacement cost of supplies by excluding from profitinventory holding gains and losses. Replacement cost profit for thegroup is not a recognized measure under generally accepted accountingpractice (GAAP). For further information see Note 4.
Interests in joint ventures
A joint venture is a contractual arrangement whereby two or more parties(venturers) undertake an economic activity that is subject to joint control.Joint control exists only when the strategic financial and operatingdecisions relating to the activity require the unanimous consent of theventurers. A jointly controlled entity is a joint venture that involves theestablishment of a company, partnership or other entity to engage ineconomic activity that the group jointly controls with its fellow venturers.
The results, assets and liabilities of a jointly controlled entity are incorporated in these financial statements using the equity method of accounting. Under the equity method, the investment in a jointlycontrolled entity is carried in the balance sheet at cost, plus post-acquisition changes in the group’s share of net assets of the jointlycontrolled entity, less distributions received and less any impairment invalue of the investment. Loans advanced to jointly controlled entities are also included in the investment on the group balance sheet. Thegroup income statement reflects the group’s share of the results aftertax of the jointly controlled entity.
Financial statements of jointly controlled entities are prepared forthe same reporting year as the group. Where necessary, adjustments aremade to those financial statements to bring the accounting policies usedinto line with those of the group.
Unrealized gains on transactions between the group and its jointlycontrolled entities are eliminated to the extent of the group’s interest in thejointly controlled entities. Unrealized losses are also eliminated unless thetransaction provides evidence of an impairment of the asset transferred.
The group assesses investments in jointly controlled entitiesfor impairment whenever events or changes in circumstances indicatethat the carrying value may not be recoverable. If any such indication of impairment exists, the carrying amount of the investment is compared with its recoverable amount, being the higher of its fair valueless costs to sell and value in use. Where the carrying amount exceedsthe recoverable amount, the investment is written down to itsrecoverable amount.
The group ceases to use the equity method of accounting on thedate from which it no longer has joint control or significant influence overthe joint venture, or when the interest becomes held for sale.
Certain of the group’s activities, particularly in the Exploration and Production segment, are conducted through joint ventures where the venturers have a direct ownership interest in, and jointly control, theassets of the venture. BP recognizes, on a line-by-line basis in theconsolidated financial statements, its share of the assets, liabilities andexpenses of these jointly controlled assets, along with the group’sincome from the sale of its share of the output and any liabilities andexpenses incurred in relation to the venture.
BOL08439_p108 121.qxp:20 F 5/3/10 17:33 Page 114 Bleed: 0�mm Scale: 100%

115
Notes on financial statements
Fin
an
cia
l sta
tem
en
ts
1. Significant accounting policies continued
Interests in associates
An associate is an entity over which the group is in a position to exercisesignificant influence through participation in the financial and operatingpolicy decisions of the investee, but which is not a subsidiary or a jointlycontrolled entity. The results, assets and liabilities of an associate areincorporated in these financial statements using the equity method ofaccounting as described above for jointly controlled entities.
Foreign currency translation
Functional currency is the currency of the primary economic environmentin which an entity operates and is normally the currency in which theentity primarily generates and expends cash.
In individual companies, transactions in foreign currencies are initially recorded in the functional currency by applying the rate of exchange ruling at the date of the transaction. Monetary assets and liabilities denominated in foreign currencies are retranslated into the functional currency at the rate of exchange ruling at the balance sheet date. Any resulting exchange differences are included in theincome statement. Non-monetary assets and liabilities, other than those measured at fair value, are not retranslated subsequent to initial recognition.
In the consolidated financial statements, the assets and liabilities of non-US dollar functional currency subsidiaries, jointlycontrolled entities and associates, including related goodwill, aretranslated into US dollars at the rate of exchange ruling at the balancesheet date. The results and cash flows of non-US dollar functionalcurrency subsidiaries, jointly controlled entities and associates aretranslated into US dollars using average rates of exchange. Exchangeadjustments arising when the opening net assets and the profits for the year retained by non-US dollar functional currency subsidiaries, jointlycontrolled entities and associates are translated into US dollars are takento a separate component of equity and reported in the statement ofcomprehensive income. Exchange gains and losses arising on long-termintragroup foreign currency borrowings used to finance the group’s non-US dollar investments are also taken to equity. On disposal of a non-US dollar functional currency subsidiary, jointly controlled entity orassociate, the deferred cumulative amount of exchange gains and lossesrecognized in equity relating to that particular non-US dollar operation isreclassified to the income statement.
Business combinations and goodwill
Business combinations are accounted for using the purchase method ofaccounting. The cost of an acquisition is measured as the cash paid andthe fair value of other assets given, equity instruments issued andliabilities incurred or assumed at the date of exchange, plus costs directly attributable to the acquisition. The acquired identifiable assets,liabilities and contingent liabilities are measured at their fair values at thedate of acquisition. Any excess of the cost of acquisition over the net fairvalue of the identifiable assets, liabilities and contingent liabilitiesacquired is recognized as goodwill. Where the group does not acquire100% ownership of the acquired company, the interest of minorityshareholders is stated at the minority’s proportion of the fair values of the assets and liabilities recognized.
At the acquisition date, any goodwill acquired is allocated to eachof the cash-generating units expected to benefit from the combination’ssynergies. For this purpose, cash-generating units are set at one levelbelow a business segment.
Following initial recognition, goodwill is measured at cost less anyaccumulated impairment losses. Goodwill is reviewed for impairmentannually or more frequently if events or changes in circumstancesindicate that the carrying value may be impaired. Impairment isdetermined by assessing the recoverable amount of the cash-generatingunit to which the goodwill relates. Where the recoverable amount of thecash-generating unit is less than the carrying amount, an impairment lossis recognized.
The cost of goodwill arising on business combinations prior to1 January 2003 is stated at the previous carrying amount under UKgenerally accepted accounting practice.
Goodwill may also arise upon investments in jointly controlledentities and associates, being the surplus of the cost of investment overthe group’s share of the net fair value of the identifiable assets. Suchgoodwill is recorded within investments in jointly controlled entities andassociates, and any impairment of the investment is included within theearnings from jointly controlled entities and associates.
Non-current assets held for sale
Non-current assets and disposal groups classified as held for sale are measured at the lower of carrying amount and fair value less costs to sell.
Non-current assets and disposal groups are classified as held for sale if their carrying amounts will be recovered through a saletransaction rather than through continuing use. This condition is regarded as met only when the sale is highly probable and the asset or disposal group is available for immediate sale in its present condition.Management must be committed to the sale, which should be expectedto qualify for recognition as a completed sale within one year from thedate of classification.
Property, plant and equipment and intangible assets onceclassified as held for sale are not depreciated. The group ceases to usethe equity method of accounting on the date from which an interest in a joint venture or an interest in an associate becomes held for sale.
Intangible assets
Intangible assets, other than goodwill, include expenditure on theexploration for and evaluation of oil and natural gas resources, computersoftware, patents, licences and trademarks and are stated at the amountinitially recognized, less accumulated amortization and accumulatedimpairment losses.
Intangible assets acquired separately from a business are carriedinitially at cost. The initial cost is the aggregate amount paid and the fairvalue of any other consideration given to acquire the asset. An intangibleasset acquired as part of a business combination is measured at fairvalue at the date of acquisition and is recognized separately fromgoodwill if the asset is separable or arises from contractual or other legalrights and its fair value can be measured reliably.
Intangible assets with a finite life are amortized on a straight-linebasis over their expected useful lives. For patents, licences andtrademarks, expected useful life is the shorter of the duration of the legalagreement and economic useful life, and can range from three to 15 years. Computer software costs have a useful life of three to five years.
The expected useful lives of assets are reviewed on an annualbasis and, if necessary, changes in useful lives are accounted forprospectively.
The carrying value of intangible assets is reviewed for impairmentwhenever events or changes in circumstances indicate the carrying valuemay not be recoverable.
BOL08439_p108 121.qxp:20 F 5/3/10 17:33 Page 115 Bleed: 0�mm Scale: 100%

1. Significant accounting policies continued
Oil and natural gas exploration, appraisal and development
expenditure
Oil and natural gas exploration, appraisal and development expenditure is accounted for using the principles of the successful efforts method of accounting.
Licence and property acquisition costsExploration licence and leasehold property acquisition costs arecapitalized within intangible assets and are reviewed at each reportingdate to confirm that there is no indication that the carrying amountexceeds the recoverable amount. This review includes confirming thatexploration drilling is still under way or firmly planned or that it has beendetermined, or work is under way to determine, that the discovery iseconomically viable based on a range of technical and commercialconsiderations and sufficient progress is being made on establishingdevelopment plans and timing. If no future activity is planned, theremaining balance of the licence and property acquisition costs is writtenoff. Lower value licences are pooled and amortized on a straight-linebasis over the estimated period of exploration. Upon recognition ofproved reserves and internal approval for development, the relevantexpenditure is transferred to property, plant and equipment.
Exploration and appraisal expenditureGeological and geophysical exploration costs are charged against incomeas incurred. Costs directly associated with an exploration well are initiallycapitalized as an intangible asset until the drilling of the well is completeand the results have been evaluated. These costs include employeeremuneration, materials and fuel used, rig costs, delay rentals andpayments made to contractors. If potentially commercial quantities ofhydrocarbons are not found, the exploration expenditure is written off asa dry hole. If hydrocarbons are found and, subject to further appraisalactivity, are likely to be capable of commercial development, the costscontinue to be carried as an asset.
Costs directly associated with appraisal activity, undertaken to determine the size, characteristics and commercial potential of areservoir following the initial discovery of hydrocarbons, including thecosts of appraisal wells where hydrocarbons were not found, are initiallycapitalized as an intangible asset.
All such carried costs are subject to technical, commercial andmanagement review at least once a year to confirm the continued intentto develop or otherwise extract value from the discovery. When this is no longer the case, the costs are written off. When proved reserves of oil and natural gas are determined and development is approved bymanagement, the relevant expenditure is transferred to property, plantand equipment.
Development expenditureExpenditure on the construction, installation or completion ofinfrastructure facilities such as platforms, pipelines and the drilling ofdevelopment wells, including service and unsuccessful development or delineation wells, is capitalized within property, plant and equipmentand is depreciated from the commencement of production as describedbelow in the accounting policy for property, plant and equipment.
Property, plant and equipment
Property, plant and equipment is stated at cost, less accumulateddepreciation and accumulated impairment losses.
The initial cost of an asset comprises its purchase price orconstruction cost, any costs directly attributable to bringing the asset into operation, the initial estimate of any decommissioning obligation, if any, and, for qualifying assets, borrowing costs. The purchase price orconstruction cost is the aggregate amount paid and the fair value of anyother consideration given to acquire the asset. The capitalized value of a finance lease is also included within property, plant and equipment.Exchanges of assets are measured at fair value unless the exchangetransaction lacks commercial substance or the fair value of neither theasset received nor the asset given up is reliably measurable. The cost of the acquired asset is measured at the fair value of the asset given up,unless the fair value of the asset received is more clearly evident. Wherefair value is not used, the cost of the acquired asset is measured at thecarrying amount of the asset given up. The gain or loss on derecognitionof the asset given up is recognized in profit or loss.
Expenditure on major maintenance refits or repairs comprises the cost of replacement assets or parts of assets, inspection costs andoverhaul costs. Where an asset or part of an asset that was separatelydepreciated is replaced and it is probable that future economic benefitsassociated with the item will flow to the group, the expenditure iscapitalized and the carrying amount of the replaced asset is derecognized.Inspection costs associated with major maintenance programmes arecapitalized and amortized over the period to the next inspection. Overhaulcosts for major maintenance programmes are expensed as incurred. Allother maintenance costs are expensed as incurred.
Oil and natural gas properties, including related pipelines, aredepreciated using a unit-of-production method. The cost of producingwells is amortized over proved developed reserves. Licence acquisition,field development and future decommissioning costs are amortized overtotal proved reserves. The unit-of-production rate for the amortization offield development costs takes into account expenditures incurred to date,together with approved future development expenditure required todevelop reserves.
Other property, plant and equipment is depreciated on a straightline basis over its expected useful life. The useful lives of the group’sother property, plant and equipment are as follows:
Land improvements 15 to 25 yearsBuildings 20 to 50 yearsRefineries 20 to 30 yearsPetrochemicals plants 20 to 30 yearsPipelines 10 to 50 yearsService stations 15 yearsOffice equipment 3 to 7 yearsFixtures and fittings 5 to 15 years
The expected useful lives of property, plant and equipment are reviewedon an annual basis and, if necessary, changes in useful lives areaccounted for prospectively.
The carrying value of property, plant and equipment is reviewedfor impairment whenever events or changes in circumstances indicatethe carrying value may not be recoverable.
An item of property, plant and equipment is derecognized upondisposal or when no future economic benefits are expected to arise fromthe continued use of the asset. Any gain or loss arising on derecognitionof the asset (calculated as the difference between the net disposalproceeds and the carrying amount of the item) is included in the incomestatement in the period in which the item is derecognized.
116
Notes on financial statements
BOL08439_p108 121.qxp:20 F 5/3/10 17:33 Page 116 Bleed: 0�mm Scale: 100%

1. Significant accounting policies continued
Impairment of intangible assets and property, plant and equipment
The group assesses assets or groups of assets for impairment wheneverevents or changes in circumstances indicate that the carrying value of anasset may not be recoverable, for example, low prices or margins for anextended period or, for oil and gas assets, significant downward revisionsof estimated volumes or increases in estimated future developmentexpenditure. If any such indication of impairment exists, the group makesan estimate of the asset’s recoverable amount. Individual assets aregrouped for impairment assessment purposes at the lowest level atwhich there are identifiable cash flows that are largely independent of thecash flows of other groups of assets. An asset group’s recoverableamount is the higher of its fair value less costs to sell and its value in use.Where the carrying amount of an asset group exceeds its recoverableamount, the asset group is considered impaired and is written down toits recoverable amount. In assessing value in use, the estimated futurecash flows are adjusted for the risks specific to the asset group and arediscounted to their present value using a pre-tax discount rate thatreflects current market assessments of the time value of money.
An assessment is made at each reporting date as to whetherthere is any indication that previously recognized impairment losses mayno longer exist or may have decreased. If such indication exists, therecoverable amount is estimated. A previously recognized impairmentloss is reversed only if there has been a change in the estimates used todetermine the asset’s recoverable amount since the last impairment losswas recognized. If that is the case, the carrying amount of the asset isincreased to its recoverable amount. That increased amount cannotexceed the carrying amount that would have been determined, net ofdepreciation, had no impairment loss been recognized for the asset inprior years. Such reversal is recognized in profit or loss. After such areversal, the depreciation charge is adjusted in future periods to allocatethe asset’s revised carrying amount, less any residual value, on asystematic basis over its remaining useful life.
Financial assets
Financial assets are classified as loans and receivables; available-for-salefinancial assets; financial assets at fair value through profit or loss; or asderivatives designated as hedging instruments in an effective hedge, asappropriate. Financial assets include cash and cash equivalents, tradereceivables, other receivables, loans, other investments, and derivativefinancial instruments. The group determines the classification of itsfinancial assets at initial recognition. Financial assets are recognizedinitially at fair value, normally being the transaction price plus, in the caseof financial assets not at fair value through profit or loss, directlyattributable transaction costs.
The subsequent measurement of financial assets depends ontheir classification, as follows:
Loans and receivablesLoans and receivables are non-derivative financial assets with fixed ordeterminable payments that are not quoted in an active market. Suchassets are carried at amortized cost using the effective interest method ifthe time value of money is significant. Gains and losses are recognized inincome when the loans and receivables are derecognized or impaired, aswell as through the amortization process. This category of financialassets includes trade and other receivables.
Available-for-sale financial assetsAvailable-for-sale financial assets are those non-derivative financial assetsthat are not classified as loans and receivables. After initial recognition,available-for-sale financial assets are measured at fair value, with gains orlosses recognized within other comprehensive income. Accumulatedchanges in fair value are recorded as a separate component of equityuntil the investment is derecognized or impaired.
The fair value of quoted investments is determined by referenceto bid prices at the close of business on the balance sheet date. Wherethere is no active market, fair value is determined using valuationtechniques. Where fair value cannot be reliably measured, assets arecarried at cost.
Financial assets at fair value through profit or lossDerivatives, other than those designated as effective hedginginstruments, are classified as held for trading and are included in thiscategory. These assets are carried on the balance sheet at fair value withgains or losses recognized in the income statement.
Derivatives designated as hedging instruments in an effective hedgeSuch derivatives are carried on the balance sheet at fair value. Thetreatment of gains and losses arising from revaluation is described below in the accounting policy for derivative financial instruments andhedging activities.
Impairment of financial assets
The group assesses at each balance sheet date whether a financial assetor group of financial assets is impaired.
Loans and receivablesIf there is objective evidence that an impairment loss on loans andreceivables carried at amortized cost has been incurred, the amount ofthe loss is measured as the difference between the asset’s carryingamount and the present value of estimated future cash flows discountedat the financial asset’s original effective interest rate. The carrying amountof the asset is reduced, with the amount of the loss recognized in theincome statement.
Available-for-sale financial assetsIf an available-for-sale financial asset is impaired, the cumulative losspreviously recognized in equity is transferred to the income statement.Any subsequent recovery in the fair value of the asset is recognizedwithin other comprehensive income.
If there is objective evidence that an impairment loss on anunquoted equity instrument that is carried at cost has been incurred, the amount of the loss is measured as the difference between theasset’s carrying amount and the present value of estimated future cash flows discounted at the current market rate of return for a similarfinancial asset.
Inventories
Inventories, other than inventory held for trading purposes, are stated at the lower of cost and net realizable value. Cost is determined by thefirst-in first-out method and comprises direct purchase costs, cost ofproduction, transportation and manufacturing expenses. Net realizablevalue is determined by reference to prices existing at the balance sheet date.
Inventories held for trading purposes are stated at fair value lesscosts to sell and any changes in net realizable value are recognized in theincome statement.
Supplies are valued at cost to the group mainly using the averagemethod or net realizable value, whichever is the lower.
117
Fin
an
cia
l sta
tem
en
ts
Notes on financial statements
BOL08439_p108 121.qxp:20 F 5/3/10 17:33 Page 117 Bleed: 0�mm Scale: 100%

1. Significant accounting policies continued
Financial liabilities
Financial liabilities are classified as financial liabilities at fair value through profit or loss; derivatives designated as hedging instruments in an effective hedge; or as financial liabilities measured at amortizedcost, as appropriate. Financial liabilities include trade and other payables,accruals, finance debt and derivative financial instruments. The groupdetermines the classification of its financial liabilities at initial recognition.The measurement of financial liabilities depends on their classification, as follows:
Financial liabilities at fair value through profit or lossDerivatives, other than those designated as effective hedginginstruments, are classified as held for trading and are included in thiscategory. These liabilities are carried on the balance sheet at fair valuewith gains or losses recognized in the income statement.
Derivatives designated as hedging instruments in an effective hedgeSuch derivatives are carried on the balance sheet at fair value, thetreatment of gains and losses arising from revaluation are describedbelow in the accounting policy for derivative financial instruments andhedging activities.
Financial liabilities measured at amortized costAll other financial liabilities are initially recognized at fair value. Forinterest-bearing loans and borrowings this is the fair value of theproceeds received net of issue costs associated with the borrowing.
After initial recognition, other financial liabilities are subsequentlymeasured at amortized cost using the effective interest method.Amortized cost is calculated by taking into account any issue costs, andany discount or premium on settlement. Gains and losses arising on therepurchase, settlement or cancellation of liabilities are recognizedrespectively in interest and other revenues and finance costs.
This category of financial liabilities includes trade and otherpayables and finance debt.
Leases
Finance leases, which transfer to the group substantially all the risks andbenefits incidental to ownership of the leased item, are capitalized at thecommencement of the lease term at the fair value of the leased propertyor, if lower, at the present value of the minimum lease payments. Financecharges are allocated to each period so as to achieve a constant rate ofinterest on the remaining balance of the liability and are charged directlyagainst income.
Capitalized leased assets are depreciated over the shorter of theestimated useful life of the asset or the lease term.
Operating lease payments are recognized as an expense in theincome statement on a straight-line basis over the lease term.
For both finance and operating leases, contingent rents arerecognized in the income statement in the period in which they are incurred.
Derivative financial instruments and hedging activities
The group uses derivative financial instruments to manage certainexposures to fluctuations in foreign currency exchange rates, interestrates and commodity prices as well as for trading purposes. Suchderivative financial instruments are initially recognized at fair value on thedate on which a derivative contract is entered into and are subsequentlyremeasured at fair value. Derivatives are carried as assets when the fairvalue is positive and as liabilities when the fair value is negative.
Contracts to buy or sell a non-financial item that can be settled net incash or another financial instrument, or by exchanging financialinstruments as if the contracts were financial instruments, with theexception of contracts that were entered into and continue to be held for the purpose of the receipt or delivery of a non-financial item inaccordance with the group’s expected purchase, sale or usagerequirements, are accounted for as financial instruments.
Gains or losses arising from changes in the fair value ofderivatives that are not designated as effective hedging instruments arerecognized in the income statement.
For the purpose of hedge accounting, hedges are classified as:• Fair value hedges when hedging exposure to changes in the fair value
of a recognized asset or liability.• Cash flow hedges when hedging exposure to variability in cash flows
that is either attributable to a particular risk associated with arecognized asset or liability or a highly probable forecast transaction.
• Hedges of a net investment in a foreign operation.At the inception of a hedge relationship the group formally designatesand documents the hedge relationship for which the group wishes toclaim hedge accounting, together with the risk management objectiveand strategy for undertaking the hedge. The documentation includesidentification of the hedging instrument, the hedged item or transaction,the nature of the risk being hedged, and how the entity will assess thehedging instrument effectiveness in offsetting the exposure to changesin the hedged item’s fair value or cash flows attributable to the hedgeditem. Such hedges are expected at inception to be highly effective inachieving offsetting changes in fair value or cash flows. Hedges meetingthe criteria for hedge accounting are accounted for as follows:
Fair value hedgesThe change in fair value of a hedging derivative is recognized in profit orloss. The change in the fair value of the hedged item attributable to therisk being hedged is recorded as part of the carrying value of the hedgeditem and is also recognized in profit or loss.
The group applies fair value hedge accounting for hedging fixedinterest rate risk on borrowings. The gain or loss relating to the effectiveportion of the interest rate swap is recognized in the income statementwithin finance costs, offsetting the amortization of the interest on theunderlying borrowings.
If the criteria for hedge accounting are no longer met, or if thegroup revokes the designation, the adjustment to the carrying amount ofa hedged item for which the effective interest rate method is used isamortized to profit or loss over the period to maturity.
Cash flow hedgesFor cash flow hedges, the effective portion of the gain or loss on thehedging instrument is recognized within other comprehensive income,while the ineffective portion is recognized in profit or loss. Amountstaken to equity are transferred to the income statement when thehedged transaction affects profit or loss. The gain or loss relating to theeffective portion of interest rate swaps hedging variable rate borrowingsis recognized in the income statement within finance costs.
Where the hedged item is the cost of a non-financial asset orliability, such as a forecast transaction for the purchase of property, plantand equipment, the amounts recognized within other comprehensiveincome are transferred to the initial carrying amount of the non-financialasset or liability.
If the hedging instrument expires or is sold, terminated orexercised without replacement or rollover, or if its designation as a hedgeis revoked, amounts previously recognized within other comprehensiveincome remain in equity until the forecast transaction occurs and aretransferred to the income statement or to the initial carrying amount of anon-financial asset or liability as above. If a forecast transaction is nolonger expected to occur, amounts previously recognized in equity arereclassified to the income statement.
118
Notes on financial statements
BOL08439_p108 121.qxp:20 F 5/3/10 17:33 Page 118 Bleed: 0�mm Scale: 100%

1. Significant accounting policies continued
Hedges of a net investment in a foreign operationFor hedges of a net investment in a foreign operation, the effectiveportion of the gain or loss on the hedging instrument is recognized withinother comprehensive income, while the ineffective portion is recognizedin profit or loss. Amounts taken to equity are transferred to the incomestatement when the foreign operation is sold or partially disposed of.
Embedded derivativesDerivatives embedded in other financial instruments or other hostcontracts are treated as separate derivatives when their risks andcharacteristics are not closely related to those of the host contract.Contracts are assessed for embedded derivatives when the groupbecomes a party to them, including at the date of a businesscombination. Embedded derivatives are measured at fair value at each balance sheet date. Any gains or losses arising from changes in fair value are taken directly to the income statement.
Provisions and contingencies
Provisions are recognized when the group has a present obligation (legal or constructive) as a result of a past event, it is probable that anoutflow of resources embodying economic benefits will be required tosettle the obligation and a reliable estimate can be made of the amountof the obligation. Where appropriate, the future cash flow estimates areadjusted to reflect risks specific to the liability.
If the effect of the time value of money is material, provisions aredetermined by discounting the expected future cash flows at a pre-taxrate that reflects current market assessments of the time value ofmoney. Where discounting is used, the increase in the provision due tothe passage of time is recognized within finance costs.
Contingent liabilities are possible obligations whose existence willonly be confirmed by future events not wholly within the control of thegroup. Contingent liabilities are not recognized in the financial statementsbut are disclosed unless the possibility of an outflow of economicresources is considered remote.
DecommissioningLiabilities for decommissioning costs are recognized when the group has an obligation to dismantle and remove a facility or an item of plantand to restore the site on which it is located, and when a reliableestimate of that liability can be made. Where an obligation exists for a new facility, such as oil and natural gas production or transportationfacilities, this will be on construction or installation. An obligation fordecommissioning may also crystallize during the period of operation of a facility through a change in legislation or through a decision to terminateoperations. The amount recognized is the present value of the estimatedfuture expenditure determined in accordance with local conditions andrequirements.
A corresponding item of property, plant and equipment of an amount equivalent to the provision is also recognized. This issubsequently depreciated as part of the asset.
Other than the unwinding discount on the provision, any change in the present value of the estimated expenditure is reflected as anadjustment to the provision and the corresponding item of property, plant and equipment. Such changes include foreign exchange gains and losses arising on the retranslation of the liability into the functionalcurrency of the reporting entity, when it is known that the liability will be settled in a foreign currency.
Environmental expenditures and liabilitiesEnvironmental expenditures that relate to current or future revenues areexpensed or capitalized as appropriate. Expenditures that relate to anexisting condition caused by past operations and do not contribute tocurrent or future earnings are expensed.
Liabilities for environmental costs are recognized when a clean-up is probable and the associated costs can be reliably estimated.Generally, the timing of recognition of these provisions coincides with the commitment to a formal plan of action or, if earlier, on divestment oron closure of inactive sites.
The amount recognized is the best estimate of the expenditurerequired. Where the liability will not be settled for a number of years, the amount recognized is the present value of the estimated future expenditure.
Employee benefits
Wages, salaries, bonuses, social security contributions, paid annual leaveand sick leave are accrued in the period in which the associated servicesare rendered by employees of the group. Deferred bonus arrangementsthat have a vesting date more than 12 months after the period end arevalued on an actuarial basis using the projected unit credit method andamortized on a straight-line basis over the service period until the awardvests. The accounting policy for pensions and other post-retirementbenefits is described below.
Share-based payments
Equity-settled transactionsThe cost of equity-settled transactions with employees is measured byreference to the fair value at the date at which equity instruments aregranted and is recognized as an expense over the vesting period, whichends on the date on which the relevant employees become fully entitledto the award. Fair value is determined by using an appropriate valuationmodel. In valuing equity-settled transactions, no account is taken of anyvesting conditions, other than conditions linked to the price of the sharesof the company (market conditions). Non-vesting conditions, such as thecondition that employees contribute to a savings-related plan, are takeninto account in the grant-date fair value, and failure to meet a non-vestingcondition is treated as a cancellation, where this is within the control ofthe employee.
No expense is recognized for awards that do not ultimately vest, except for awards where vesting is conditional upon a marketcondition, which are treated as vesting irrespective of whether or not the market condition is satisfied, provided that all other performanceconditions are satisfied.
At each balance sheet date before vesting, the cumulativeexpense is calculated, representing the extent to which the vestingperiod has expired and management’s best estimate of the achievementor otherwise of non-market conditions and the number of equityinstruments that will ultimately vest or, in the case of an instrumentsubject to a market condition, be treated as vesting as described above.The movement in cumulative expense since the previous balance sheetdate is recognized in the income statement, with a corresponding entryin equity.
When the terms of an equity-settled award are modified or a newaward is designated as replacing a cancelled or settled award, the costbased on the original award terms continues to be recognized over theoriginal vesting period. In addition, an expense is recognized over the remainder of the new vesting period for the incremental fair value of any modification, based on the difference between the fair value of the original award and the fair value of the modified award, both asmeasured on the date of the modification. No reduction is recognized if this difference is negative.
When an equity-settled award is cancelled, it is treated as if it hadvested on the date of cancellation and any cost not yet recognized in the income statement for the award is expensed immediately.
119
Fin
an
cia
l sta
tem
en
ts
Notes on financial statements
BOL08439_p108 121.qxp:20 F 5/3/10 17:33 Page 119 Bleed: 0�mm Scale: 100%

1. Significant accounting policies continued
Cash-settled transactionsThe cost of cash-settled transactions is measured at fair value andrecognized as an expense over the vesting period, with a correspondingliability recognized on the balance sheet.
Pensions and other post-retirement benefits
The cost of providing benefits under the defined benefit plans isdetermined separately for each plan using the projected unit creditmethod, which attributes entitlement to benefits to the current period (todetermine current service cost) and to the current and prior periods (todetermine the present value of the defined benefit obligation). Past servicecosts are recognized immediately when the company becomescommitted to a change in pension plan design. When a settlement(eliminating all obligations for benefits already accrued) or a curtailment(reducing future obligations as a result of a material reduction in thescheme membership or a reduction in future entitlement) occurs, theobligation and related plan assets are remeasured using current actuarialassumptions and the resultant gain or loss is recognized in the incomestatement during the period in which the settlement or curtailment occurs.
The interest element of the defined benefit cost represents the change in present value of scheme obligations resulting from thepassage of time, and is determined by applying the discount rate to theopening present value of the benefit obligation, taking into accountmaterial changes in the obligation during the year. The expected return on plan assets is based on an assessment made at the beginning of theyear of long-term market returns on plan assets, adjusted for the effecton the fair value of plan assets of contributions received and benefits paidduring the year. The difference between the expected return on plan assets and the interest cost is recognized in the incomestatement as other finance income or expense.
Actuarial gains and losses are recognized in full within othercomprehensive income in the period in which they occur.
The defined benefit pension plan surplus or deficit in the balancesheet comprises the total for each plan of the present value of the definedbenefit obligation (using a discount rate based on high quality corporatebonds), less the fair value of plan assets out of which the obligations areto be settled directly. Fair value is based on market price information and,in the case of quoted securities, is the published bid price.
Contributions to defined contribution schemes are recognized inthe income statement in the period in which they become payable.
Corporate taxes
Income tax expense represents the sum of the tax currently payable anddeferred tax. Interest and penalties relating to tax are also included inincome tax expense.
The tax currently payable is based on the taxable profits for theperiod. Taxable profit differs from net profit as reported in the incomestatement because it excludes items of income or expense that aretaxable or deductible in other periods and it further excludes items thatare never taxable or deductible. The group’s liability for current tax iscalculated using tax rates that have been enacted or substantivelyenacted by the balance sheet date.
Deferred tax is provided, using the liability method, on alltemporary differences at the balance sheet date between the tax bases of assets and liabilities and their carrying amounts for financialreporting purposes.
Deferred tax liabilities are recognized for all taxable temporarydifferences:• Except where the deferred tax liability arises on goodwill that is
not tax deductible or the initial recognition of an asset or liability in a transaction that is not a business combination and, at the time ofthe transaction, affects neither the accounting profit nor taxable profitor loss.
• In respect of taxable temporary differences associated withinvestments in subsidiaries, jointly controlled entities and associates,except where the group is able to control the timing of the reversal ofthe temporary differences and it is probable that the temporarydifferences will not reverse in the foreseeable future.
Deferred tax assets are recognized for all deductible temporarydifferences, carry-forward of unused tax credits and unused tax losses,to the extent that it is probable that taxable profit will be available againstwhich the deductible temporary differences and the carry-forward ofunused tax credits and unused tax losses can be utilized:• Except where the deferred income tax asset relating to the
deductible temporary difference arises from the initial recognition ofan asset or liability in a transaction that is not a business combinationand, at the time of the transaction, affects neither the accountingprofit nor taxable profit or loss.
• In respect of deductible temporary differences associated withinvestments in subsidiaries, jointly controlled entities and associates,deferred tax assets are recognized only to the extent that it isprobable that the temporary differences will reverse in theforeseeable future and taxable profit will be available against whichthe temporary differences can be utilized.
The carrying amount of deferred tax assets is reviewed at each balancesheet date and reduced to the extent that it is no longer probable thatsufficient taxable profit will be available to allow all or part of the deferredincome tax asset to be utilized.
Deferred tax assets and liabilities are measured at the tax ratesthat are expected to apply to the year when the asset is realized or theliability is settled, based on tax rates (and tax laws) that have beenenacted or substantively enacted at the balance sheet date.
Tax relating to items recognized directly in equity is recognized inequity and not in the income statement.
Customs duties and sales taxes
Revenues, expenses and assets are recognized net of the amount ofcustoms duties or sales tax except:• Where the customs duty or sales tax incurred on a purchase of
goods and services is not recoverable from the taxation authority, in which case the customs duty or sales tax is recognized as part of the cost of acquisition of the asset or as part of the expense item as applicable.
• Receivables and payables are stated with the amount of customsduty or sales tax included.
The net amount of sales tax recoverable from, or payable to, the taxation authority is included as part of receivables or payables in thebalance sheet.
Own equity instruments
The group’s holdings in its own equity instruments, including ordinaryshares held by Employee Share Ownership Plans (ESOPs), are classified as ‘treasury shares’, or ‘own shares’ for the ESOPs, and areshown as deductions from shareholders’ equity at cost. Considerationreceived for the sale of such shares is also recognized in equity, with anydifference between the proceeds from sale and the original cost beingtaken to the profit and loss account reserve. No gain or loss is recognizedin the income statement on the purchase, sale, issue or cancellation ofequity shares.
120
Notes on financial statements
BOL08439_p108 121.qxp:20 F 5/3/10 17:33 Page 120 Bleed: 0�mm Scale: 100%

1. Significant accounting policies continued
Revenue
Revenue arising from the sale of goods is recognized when thesignificant risks and rewards of ownership have passed to the buyer and it can be reliably measured.
Revenue is measured at the fair value of the considerationreceived or receivable and represents amounts receivable for goodsprovided in the normal course of business, net of discounts, customsduties and sales taxes.
Revenues associated with the sale of oil, natural gas, natural gasliquids, liquefied natural gas, petroleum and chemicals products and allother items are recognized when the title passes to the customer.Physical exchanges are reported net, as are sales and purchases madewith a common counterparty, as part of an arrangement similar to aphysical exchange. Similarly, where the group acts as agent on behalf of a third party to procure or market energy commodities, any associatedfee income is recognized but no purchase or sale is recorded.Additionally, where forward sale and purchase contracts for oil, naturalgas or power have been determined to be for trading purposes, theassociated sales and purchases are reported net within sales and otheroperating revenues whether or not physical delivery has occurred.
Generally, revenues from the production of oil and natural gasproperties in which the group has an interest with joint venture partnersare recognized on the basis of the group’s working interest in thoseproperties (the entitlement method). Differences between the productionsold and the group’s share of production are not significant.
Interest income is recognized as the interest accrues (using theeffective interest rate that is the rate that exactly discounts estimatedfuture cash receipts through the expected life of the financial instrumentto the net carrying amount of the financial asset).
Dividend income from investments is recognized when theshareholders’ right to receive the payment is established.
Research
Research costs are expensed as incurred.
Finance costs
Finance costs directly attributable to the acquisition, construction orproduction of qualifying assets, which are assets that necessarily take asubstantial period of time to get ready for their intended use, are addedto the cost of those assets, until such time as the assets are substantiallyready for their intended use. All other finance costs are recognized in theincome statement in the period in which they are incurred.
Use of estimates
The preparation of financial statements requires management to makeestimates and assumptions that affect the reported amounts of assetsand liabilities as well as the disclosure of contingent assets and liabilitiesat the balance sheet date and the reported amounts of revenues andexpenses during the reporting period. Actual outcomes could differ fromthose estimates.
Impact of new International Financial Reporting Standards
Adopted for 2009The following new IFRS, and revised or amended IFRSs were adopted by the group with effect from 1 January 2009, IFRS 8 ‘OperatingSegments’ was issued in November 2006 and defines operatingsegments as components of an entity about which separate financialinformation is available and is evaluated regularly by the chief operatingdecision maker in deciding how to allocate resources and in assessingperformance. BP’s operating segments did not change as a result ofadopting the new standard and there was no effect on the group’sreported income or net assets. The disclosures required by the standardare included in this report, including the measures as used by the chiefoperating decision maker.
In September 2007, the IASB issued a revised version of IAS 1‘Presentation of Financial Statements’, which requires separatepresentation of owner and non-owner changes in equity by introducingthe statement of comprehensive income. The statement of recognizedincome and expense is no longer presented. Whenever there is arestatement or reclassification, an additional balance sheet, as at thebeginning of the earliest period presented, will be required to bepublished. There was no effect on the group’s reported income or netassets as a result of the adoption of this revised standard.
In March 2009, the IASB issued Amendments to IFRS 7 ‘Financial Instruments: Disclosures – Improving Disclosures aboutFinancial Instruments’, which requires enhanced disclosures about fairvalue measurements and liquidity risk. There was no effect on thegroup’s reported income or net assets. The disclosures required by thestandard are included in this report.
In addition, several other standards and interpretations were adopted in the year which had no significant impact on the financial statements.
Not yet adoptedThe following pronouncements from the IASB will become effective for future financial reporting periods and have not yet been adopted bythe group.
In January 2008, the IASB issued a revised version of IFRS 3‘Business Combinations’. The revised standard still requires the purchasemethod of accounting to be applied to business combinations but willintroduce some changes to the existing accounting treatment. Forexample, contingent consideration is measured at fair value at the date of acquisition and subsequently remeasured to fair value with changesrecognized in profit or loss. Goodwill may be calculated based on theparent’s share of net assets or it may include goodwill related to theminority interest. All transaction costs are expensed. The standard isapplicable to business combinations occurring in accounting periodsbeginning on or after 1 July 2009 and BP will adopt it with effect from1 January 2010. Assets and liabilities arising from business combinationsthat occurred before the date of adoption by the group will not berestated and thus there will be no effect on the group’s reported incomeor net assets on adoption. The revised standard has been adopted by the EU.
Also in January 2008, the IASB issued an amended version of IAS 27 ‘Consolidated and Separate Financial Statements’. This requiresthe effects of all transactions with non-controlling interests to berecorded in equity if there is no change in control. When control is lost,any remaining interest in the entity is remeasured to fair value and a gain or loss recognized in profit or loss. The amendment is effective forannual periods beginning on or after 1 July 2009 and is to be appliedretrospectively, with certain exceptions. BP will adopt the amendmentwith effect from 1 January 2010 and there will be no effect on thegroup’s reported income or net assets on adoption. The revised standardhas been adopted by the EU.
In November 2009, the IASB issued IFRS 9 ‘Financial Instruments’which deals with the classification and measurement of financial assets.This new standard represents the first phase of the IASB’s project toreplace IAS 39 ‘Financial Instruments: Recognition and Measurement’.The new standard is effective for annual periods beginning on or after1 January 2013 with transitional arrangements depending upon the dateof initial application. BP has not yet decided the date of initial applicationfor the group and has not yet completed its evaluation of the effect ofadoption. The new standard has not yet been adopted by the EU.
There are no other standards and interpretations in issue but notyet adopted that the directors anticipate will have a material effect on thereported income or net assets of the group.
121
Fin
an
cia
l sta
tem
en
ts
Notes on financial statements
BOL08439_p108 121.qxp:20 F 5/3/10 17:33 Page 121 Bleed: 0�mm Scale: 100%

2. AcquisitionsAcquisitions in 2009
BP made no significant acquisitions in 2009.
Acquisitions in 2008
BP made a number of acquisitions in 2008 for a total consideration of $403 million. These business combinations were in the Exploration andProduction segment and Other businesses and corporate and the most significant was the acquisition of Whiting Clean Energy, a cogenerationpower plant. Fair value adjustments were made to the acquired assets and liabilities.
Acquisitions in 2007
BP made a number of acquisitions in 2007 for a total consideration of $1,200 million. These business combinations were predominantly in the Refiningand Marketing segment, the most significant of which was the acquisition of Chevron’s Netherlands manufacturing company, Texaco Raffiniderij PernisB.V. The acquisition included Chevron’s 31% minority shareholding in Nerefco, its 31% shareholding in the 22.5MW wind farm co-located at therefinery as well as a 22.8% shareholding in the TEAM joint venture terminal and shareholdings in two local pipelines linking the TEAM terminal to therefinery. Fair value adjustments were made to the acquired assets and liabilities. Goodwill of $270 million arose on these acquisitions.
3. Disposals and impairment
–
Notes on financial statements
122
BOL08439_p122 128.qxp:20 F 5/3/10 17:33 Page 122 Bleed: 0�mm Scale: 100%
$ million
2009 2008 2007
Proceeds from disposal of businesses, net of cash disposed of 966 11 2,518Proceeds from disposal of fixed assets 1,715 918 1,749
2,681 929 4,267By business
Exploration and Production 940 19 1,280Refining and Marketing 1,294 813 2,953Other businesses and corporate 447 97 34
2,681 929 4,267
Deferred consideration relating to disposals of businesses and fixed assets at 31 December 2009 amounted to $807 million receivable within one year(2008 $15 million and 2007 $22 million) and $691 million receivable after one year (2008 $64 million and 2007 $84 million).
$ million
2009 2008 2007
Gains on sale of businesses and fixed assetsExploration and Production 1,717 34 954Refining and Marketing 384 1,258 1,464Other businesses and corporate 72 61 69
2,173 1,353 2,487
$ million
2009 2008 2007
Losses on sale of businesses and fixed assetsExploration and Production 28 18 42Refining and Marketing 154 297 313Other businesses and corporate 21 1 –
203 316 355Impairment losses
Exploration and Production 118 1,186 292Refining and Marketing 1,834 159 1,186Other businesses and corporate 189 227 83
2,141 1,572 1,561Impairment reversals
Exploration and Production (3) (155) (237)Other businesses and corporate (8) –
(11) (155) (237)Impairment and losses on sale of businesses and fixed assets 2,333 1,733 1,679

Notes on financial statements
123
Fin
an
cia
l sta
tem
en
ts
BOL08439_p122 128.qxp:20 F 5/3/10 17:33 Page 123 Bleed: 0�mm Scale: 100%
3. Disposals and impairment continuedDisposals
As part of the strategy to upgrade the quality of its asset portfolio, the group has an active programme to dispose of non-strategic assets. In thenormal course of business in any particular year, the group may sell interests in exploration and production properties, service stations and pipelineinterests as well as non-core businesses. The group may also dispose of other assets, such as refineries, when this meets strategic objectives.
Exploration and ProductionThe group divested interests in a number of oil and natural gas properties in all three years. In 2009, the major transactions were the sale of BP WestJava Limited in Indonesia, the sale of our 49.9% interest in Kazakhstan Pipeline Ventures LLC and the sale of our 46% stake in LukArco, all of whichresulted in gains. We also exchanged interests in a number of fields in the North Sea with BG Group plc.
There were no significant disposals in 2008.During 2007, the major transactions were the disposal of an exploration and production and gas infrastructure business in the Netherlands and
the divestments of our interests in non-core Permian assets in the US and in the Entrada field in the Gulf of Mexico, all of which resulted in gains. Wealso sold our interests in a number of fields in Egypt, Canada and the US.
Refining and MarketingIn 2009, gains on disposal mainly resulted from the disposal of our ground fuels marketing business in Greece and retail churn in the US, Europe andAustralasia. Losses resulted from the continued disposal of company-owned and company-operated retail sites in the US, retail churn and disposals ofassets elsewhere in the segment portfolio. Retail churn is the overall process of acquiring and disposing of retail sites by which the group aims toimprove the quality and mix of its portfolio of service stations.
In 2008, the major transactions resulting in gains were the contribution of our Toledo refinery to a US jointly controlled entity in an exchangetransaction with Husky Energy and the disposals of our interest in the Dixie Pipeline and certain retail assets in the US. The losses on sale relatedmainly to the disposal of retail assets in the US and Europe. In addition, certain assets at our Acetyls plant in Hull, UK, and other interests in the UKand Europe were sold.
During 2007, we disposed of the Coryton refinery in the UK, our interest in the West Texas Pipeline in the US, and our interest in the SamsungPetrochemical Company in South Korea, all of which resulted in gains. Losses were incurred related to the decision to withdraw from the company-owned and company-operated channel of trade in the US and retail churn.
Other businesses and corporateDuring 2009, we disposed of our wind energy business in India and contributed our Fowler II wind energy development asset in exchange for a 50%equity interest in a jointly controlled entity, Fowler II Holdings LLC. In addition, there was a return of capital in the jointly controlled entity Fowler RidgeWind Farm LLC which did not change our percentage interest in the entity.
Summarized financial information for the sale of businesses is shown below.
$ million
2009 2008 2007
Non-current assets 536 759 753Current assets 444 485 587Non-current liabilities (146) – (64)Current liabilities (152) (134) (27)Total carrying amount of net assets disposed 682 1,110 1,249Recycling of foreign exchange on disposal (27) – (147)Costs on disposal 3 7 22
658 1,117 1,124Profit (loss) on sale of businessesa 314 1,721 1,384Total consideration 972 2,838 2,508Fair value of interest received in a jointly controlled entity – (2,838) –Consideration received (receivable)b (6) 11 10Proceeds from the sale of businessesc 966 11 2,518
aOf which $929 million gain was not recognized in the income statement in 2008 as it represented an unrealized gain on the transfer of the Toledo refinery into a jointly controlled entity.bConsideration received from prior year business disposals or not yet received from current year disposals. cNet of cash and cash equivalents disposed of $91 million (2008 nil and 2007 $115 million).

124
Notes on financial statements
3. Disposals and impairment continuedImpairment
In assessing whether a write-down is required in the carrying value of a potentially impaired intangible asset, item of property, plant and equipment oran equity-accounted investment, the asset’s carrying value is compared with its recoverable amount. The recoverable amount is the higher of theasset’s fair value less costs to sell and value in use. Unless indicated otherwise, the recoverable amount used in assessing the impairment chargesdescribed below is value in use. The group estimates value in use using a discounted cash flow model. The future cash flows are adjusted for risksspecific to the asset and are discounted using a pre-tax discount rate. This discount rate is derived from the group’s post-tax weighted average cost ofcapital and is adjusted where applicable to take into account any specific risks relating to the country where the cash generating unit is located,although other rates may be used if appropriate to the specific circumstances. In 2009 the rates ranged from 9% to 13% (2008 11% to 13%). The rateapplied in each country is re-assessed each year. In certain circumstances the fair value less costs to sell may be available for an asset. On occasion,an impairment assessment may be carried out using fair value less costs to sell as the recoverable amount when, for example, a recent markettransaction for a similar asset has taken place. For impairments of available-for-sale financial assets that are quoted investments, the fair value isdetermined by reference to bid prices at the close of business at the balance sheet date. Any cumulative loss previously recognized in othercomprehensive income is transferred to the income statement.
Exploration and ProductionDuring 2009, the Exploration and Production segment recognized impairment losses of $118 million. The main elements were the write-down of our$42 million investment in the East Shmidt interest in Russia, triggered by a decision to not proceed to development; a $62 million charge associatedwith our nErgize gas scheduling system; and several other individually insignificant impairment charges amounting to $14 million.
During 2008, the Exploration and Production segment recognized impairment losses of $1,186 million. The main elements were the write-downof our investment in Rosneft by $517 million, to its fair value determined by reference to an active market, due to a significant decline in the marketvalue of the investment (see Note 25), impairment of oil and gas properties in the Gulf of Mexico of $270 million triggered by downward revisions ofreserves, an impairment of exploration assets in Vietnam of $210 million following BP’s decision to withdraw from activities in the area concerned,impaiment of oil and gas properties in Egypt of $85 million triggered by cost increases, and several other individually insignificant impairment chargesamounting to $104 million.
These charges were partly offset by reversals of previously recognized impairment losses amounting to $155 million. Of this total, $122 millionresulted from a reassessment of the economics of Rhourde El Baguel in Algeria.
During 2007, the Exploration and Production segment recognized impairment losses of $292 million. The main elements were a charge of$112 million relating to the cancellation of the DF1 project in Scotland, a $103 million partner loan write-off as a result of unsuccessful drilling in the WestShmidt licence block in Sakhalin and a $52 million write-off of the Whitney Canyon gas plant in US Lower 48 driven by management’s decision toabandon this facility. In addition, there were several individually insignificant impairment charges, triggered by downward reserves revisions, amountingto $25 million in total.
These charges were largely offset by reversals of previously recognized impairment charges amounting to $237 million. Of this total, $208 millionresulted from a reassessment of the decommissioning liability for damaged platforms in the Gulf of Mexico Shelf. The remaining $29 millionrelated to other individually insignificant impairment reversals, resulting from favourable revisions to the estimates used in determining the assets’recoverable amounts.
Refining and MarketingDuring 2009, an impairment loss of $1,579 million was recognized against the goodwill allocated to the US West Coast fuels value chain (FVC). Thegoodwill was originally recognized at the time of the ARCO acquisition in 2000. The prevailing weak refining environment, together with a review offuture margin expectations in the FVC, has led to a reduction in the expected future cash flows. Further information, including details of the group’sapproach to impairment reviews of goodwill, is given in Note 8. Other impairment losses were also recognized by the segment on a number of assetswhich amounted to $255 million.
During 2008, the Refining and Marketing segment recognized impairment losses on a number of assets which amounted to $159 million. The main component of the 2007 impairment charge of $1,186 million arose because of a decision to sell our company-owned and company-
operated sites in the US resulting in a $610 million write-down of the carrying amount of the sites to fair value less costs to sell. Following a decisionto sell certain assets at our Acetyls plant in Hull, UK, we wrote down the carrying amount of these assets to fair value less costs to sell leading to animpairment charge of $186 million. Changing marketing conditions led to impairments in Samsung Petrochemical Company, to fair value less costs tosell, and in China American Petrochemical Company amounting to $165 million. The balance relates principally to the write-downs of assets elsewherein the segment portfolio.
Other businesses and corporateDuring 2009 and 2008, Other businesses and corporate recognized impairment losses totalling $189 million and $227 million respectively related tovarious assets in the Alternative Energy business. The impairment loss of $83 million in 2007 related to various individually insignificant write-downs.
4. Segmental analysis The group’s organizational structure reflects the different activities in which BP is engaged. In 2009, BP had two reportable segments: Exploration andProduction and Refining and Marketing. BP’s activities in low-carbon energy are managed through our Alternative Energy business, which is reported inOther businesses and corporate. The group is managed on an integrated basis.
Exploration and Production’s activities cover three key areas. Upstream activities include oil and natural gas exploration, field development andproduction. Midstream activities include pipeline, transportation and processing activities related to our upstream activities. Marketing and tradingactivities include the marketing and trading of natural gas, including liquefied natural gas (LNG), together with power and natural gas liquids (NGLs).
Refining and Marketing’s activities include the supply and trading, refining, manufacturing, marketing and transportation of crude oil, petroleumand petrochemicals products and related services.
BOL08439_p122 128.qxp:20 F 5/3/10 17:33 Page 124 Bleed: 0�mm Scale: 100%

125
Notes on financial statements
Fin
an
cia
l sta
tem
en
ts
BOL08439_p122 128.qxp:20 F 5/3/10 17:33 Page 125 Bleed: 0�mm Scale: 100%
4. Segmental analysis continuedOther businesses and corporate comprises the Alternative Energy business, Shipping, the group’s aluminium asset, Treasury (which in the segmentalanalysis includes all of the group’s cash, cash equivalents and associated interest income), and corporate activities worldwide. The Alternative Energybusiness is an operating segment that has been aggregated with the other activities within Other businesses and corporate as it does not meet themateriality thresholds for separate segment reporting.
The accounting policies of the operating segments are the same as the group’s accounting policies described in Note 1. However, IFRSrequires that the measure of profit or loss disclosed for each operating segment is the measure that is provided regularly to the chief operatingdecision maker for the purposes of performance assessment and resource allocation. For BP, this measure of profit or loss is replacement cost profitbefore interest and tax which reflects the replacement cost of supplies by excluding from profit inventory holding gains and lossesa. Replacement costprofit for the group is not a recognized GAAP measure.
Sales between segments are made at prices that approximate market prices, taking into account the volumes involved. Segment revenues andsegment results include transactions between business segments. These transactions and any unrealized profits and losses are eliminated onconsolidation, unless unrealized losses provide evidence of an impairment of the asset transferred. Sales to external customers are based on thelocation of the seller. The UK region includes the UK-based international activities of Refining and Marketing.
All surpluses and deficits recognized on the group balance sheet in respect of pension and other post-retirement benefit plans are allocated toOther businesses and corporate. However, the periodic expense relating to these plans is allocated to the other operating segments based upon thebusiness in which the employees work.
Certain financial information is provided separately for the US as this is an individually material country for BP, and for the UK as this is BP’scountry of domicile.
$ million
2009
Other Consolidation
Exploration Refining businesses adjustment
and and and and Total
By business Production Marketing corporate eliminations group
Segment revenuesSales and other operating revenues 57,626 213,050 2,843 (34,247) 239,272
Less: sales between businesses (32,540) (821) (886) 34,247 –
Third party sales and other operating revenues 25,086 212,229 1,957 – 239,272
Equity-accounted earnings 3,309 558 34 – 3,901
Interest revenues 98 32 95 – 225
Segment resultsReplacement cost profit (loss) before interest and taxation 24,800 743 (2,322) (717) 22,504
Inventory holding gainsa 142 3,774 6 – 3,922
Profit (loss) before interest and taxation 24,942 4,517 (2,316) (717) 26,426
Finance costs (1,110)
Net finance expense relating to pensions and other post-retirement benefits (192)
Profit before taxation 25,124
Other income statement itemsDepreciation, depletion and amortization 9,557 2,236 313 – 12,106
Impairment losses 118 1,834 189 – 2,141
Impairment reversals 3 – 8 – 11
Fair value (gain) loss on embedded derivatives (664) 57 – – (607)
Charges for provisions, net of write-back of unused provisions,including change in discount rate 307 756 488 – 1,551
Segment assetsSegment assets 140,149 82,224 17,954 (5,084) 235,243
Current tax receivable 209
Deferred tax assets 516
Total assets 235,968
IncludesEquity-accounted investments 20,289 6,882 1,088 – 28,259
Additions to non-current assets 15,855 4,083 1,297 – 21,235
Additions to other investments 19
Element of acquisitions not related to non-current assets (7)
Additions to decommissioning asset (938)
Capital expenditure and acquisitions 14,896 4,114 1,299 – 20,309
a Inventory holding gains and losses represent the difference between the cost of sales calculated using the average cost to BP of supplies incurred during the period and the cost of sales calculatedon the first-in first-out (FIFO) method including any changes in provisions where the net realizable value of the inventory is lower than its cost. Under the FIFO method, which we use for IFRS reporting,the cost of inventory charged to the income statement is based on the historic cost of acquisition or manufacture rather than the current replacement cost. In volatile energy markets, this can have asignificant distorting effect on reported income. The amounts disclosed represent the difference between the charge to the income statement on a FIFO basis (and any related movements in netrealizable value provisions) and the charge that would arise using average cost of supplies incurred during the period. For this purpose, average cost of supplies incurred during the period is calculated bydividing the total cost of inventory purchased in the period by the number of barrels acquired. The amounts disclosed are not separately reflected in the financial statements as a gain or loss. Noadjustment is made in respect of the cost of inventories held as part of a trading position and certain other temporary inventory positions.

126
Notes on financial statements
BOL08439_p122 128.qxp:20 F 5/3/10 17:33 Page 126 Bleed: 0�mm Scale: 100%
4. Segmental analysis continued$ million
2008
Other ConsolidationExploration Refining businesses adjustment
and and and and TotalBy business Production Marketing corporate eliminations group
Segment revenuesSales and other operating revenues 86,170 320,039 4,634 (49,700) 361,143 Less: sales between businesses (45,931) (1,918) (1,851) 49,700 – Third party sales and other operating revenues 40,239 318,121 2,783 – 361,143 Equity-accounted earnings 3,565 131 125 – 3,821 Interest revenues 114 35 220 – 369Segment resultsReplacement cost profit (loss) before interest and taxation 38,308 4,176 (1,223) 466 41,727 Inventory holding lossesa (393) (6,060) (35) – (6,488)Profit (loss) before interest and taxation 37,915 (1,884) (1,258) 466 35,239 Finance costs (1,547)Net finance income relating to pensions and other post-retirement benefits 591 Profit before taxation 34,283 Other income statement itemsDepreciation, depletion and amortization 8,440 2,208 337 – 10,985 Impairment losses 1,186 159 227 – 1,572Impairment reversals 155 – – – 155Fair value (gain) loss on embedded derivatives 163 (57) 5 – 111 Charges for provisions, net of write-back of unused provisions 573 479 657 – 1,709 Segment assetsSegment assets 136,665 75,329 19,079 (3,212) 227,861 Current tax receivable 377 Total assets 228,238 Includes
Equity-accounted investments 20,131 6,622 1,073 – 27,826 Additions to non-current assets 21,584 6,636 1,802 – 30,022
Additions to other investments 52 Element of acquisitions not related to non-current assets 11 Additions to decommissioning asset 615
Capital expenditure and acquisitions 22,227 6,634 1,839 – 30,700
a Inventory holding gains and losses represent the difference between the cost of sales calculated using the average cost to BP of supplies incurred during the period and the cost of sales calculated onthe first-in first-out (FIFO) method including any changes in provisions where the net realizable value of the inventory is lower than its cost. Under the FIFO method, which we use for IFRS reporting, thecost of inventory charged to the income statement is based on the historic cost of acquisition or manufacture rather than the current replacement cost. In volatile energy markets, this can have asignificant distorting effect on reported income. The amounts disclosed represent the difference between the charge to the income statement on a FIFO basis (and any related movements in netrealizable value provisions) and the charge that would arise using average cost of supplies incurred during the period. For this purpose, average cost of supplies incurred during the period is calculated bydividing the total cost of inventory purchased in the period by the number of barrels acquired. The amounts disclosed are not separately reflected in the financial statements as a gain or loss. Noadjustment is made in respect of the cost of inventories held as part of a trading position and certain other temporary inventory positions.
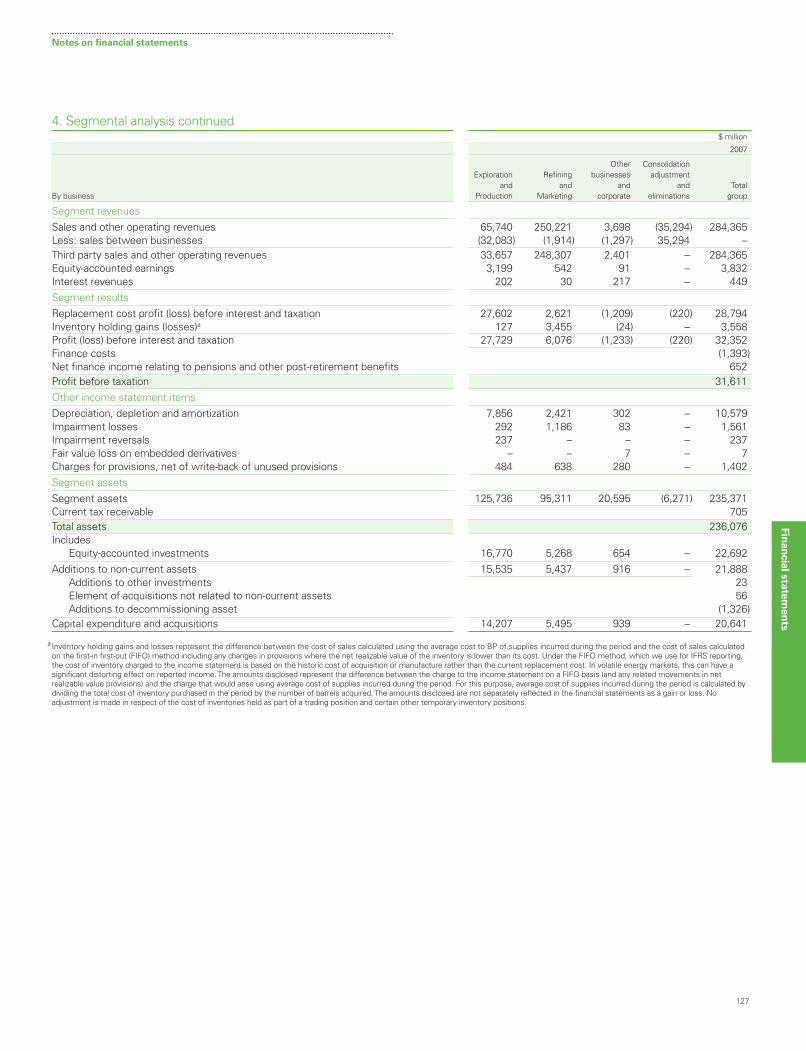
127
Notes on financial statements
Fin
an
cia
l sta
tem
en
ts
BOL08439_p122 128.qxp:20 F 5/3/10 17:33 Page 127 Bleed: 0�mm Scale: 100%
4. Segmental analysis continued$ million
2007
Other ConsolidationExploration Refining businesses adjustment
and and and and TotalBy business Production Marketing corporate eliminations group
Segment revenuesSales and other operating revenues 65,740 250,221 3,698 (35,294) 284,365 Less: sales between businesses (32,083) (1,914) (1,297) 35,294 – Third party sales and other operating revenues 33,657 248,307 2,401 – 284,365 Equity-accounted earnings 3,199 542 91 – 3,832 Interest revenues 202 30 217 – 449Segment resultsReplacement cost profit (loss) before interest and taxation 27,602 2,621 (1,209) (220) 28,794 Inventory holding gains (losses)a 127 3,455 (24) – 3,558Profit (loss) before interest and taxation 27,729 6,076 (1,233) (220) 32,352 Finance costs (1,393)Net finance income relating to pensions and other post-retirement benefits 652 Profit before taxation 31,611 Other income statement itemsDepreciation, depletion and amortization 7,856 2,421 302 – 10,579 Impairment losses 292 1,186 83 – 1,561Impairment reversals 237 – – – 237Fair value loss on embedded derivatives – – 7 – 7 Charges for provisions, net of write-back of unused provisions 484 638 280 – 1,402 Segment assetsSegment assets 125,736 95,311 20,595 (6,271) 235,371Current tax receivable 705 Total assets 236,076 Includes
Equity-accounted investments 16,770 5,268 654 – 22,692 Additions to non-current assets 15,535 5,437 916 – 21,888
Additions to other investments 23 Element of acquisitions not related to non-current assets 56 Additions to decommissioning asset (1,326)
Capital expenditure and acquisitions 14,207 5,495 939 – 20,641
a Inventory holding gains and losses represent the difference between the cost of sales calculated using the average cost to BP of supplies incurred during the period and the cost of sales calculatedon the first-in first-out (FIFO) method including any changes in provisions where the net realizable value of the inventory is lower than its cost. Under the FIFO method, which we use for IFRS reporting,the cost of inventory charged to the income statement is based on the historic cost of acquisition or manufacture rather than the current replacement cost. In volatile energy markets, this can have asignificant distorting effect on reported income. The amounts disclosed represent the difference between the charge to the income statement on a FIFO basis (and any related movements in netrealizable value provisions) and the charge that would arise using average cost of supplies incurred during the period. For this purpose, average cost of supplies incurred during the period is calculated bydividing the total cost of inventory purchased in the period by the number of barrels acquired. The amounts disclosed are not separately reflected in the financial statements as a gain or loss. Noadjustment is made in respect of the cost of inventories held as part of a trading position and certain other temporary inventory positions.

$ million
abc
abc
Notes on financial statements
128
BOL08439_p122 128.qxp:20 F 5/3/10 17:33 Page 128 Bleed: 0�mm Scale: 100%
4. Segmental analysis continued
2009
By geographical area US Non-US Total
RevenuesThird party sales and other operating revenuesa 83,982 155,290 239,272
ResultsReplacement cost profit before interest and taxation 2,806 19,698 22,504
Non-current assetsOther non-current assetsb c 64,529 93,580 158,109
Other investments 1,567
Loans 1,039
Other receivables 1,729
Derivative financial instruments 3,965
Deferred tax assets 516
Defined benefit pension plan surpluses 1,390
Total non-current assets 168,315
Capital expenditure and acquisitions 9,865 10,444 20,309
Non-US region includes UK $51,172 million.Non-US region includes UK $16,713 million.Excluding financial instruments, deferred tax assets and post-employment benefit plan surpluses.
$ million
2008
By geographical area US Non-US Total
RevenuesThird party sales and other operating revenuesa 123,364 237,779 361,143 ResultsReplacement cost profit before interest and taxation 10,678 31,049 41,727 Non-current assetsOther non-current assetsb c 62,679 89,823 152,502Other investments 855 Loans 995 Other receivables 710 Derivative financial instruments 5,054 Defined benefit pension plan surpluses 1,738 Total non-current assets 161,854 Capital expenditure and acquisitions 16,046 14,654 30,700
Non-US region includes UK $81,773 million.Non-US region includes UK $15,990 million.Excluding financial instruments, and post-employment benefit plan surpluses.
$ million
2007
By geographical area US Non-US Total
RevenuesThird party sales and other operating revenuesa 102,319 182,046 284,365 ResultsReplacement cost profit before interest and taxation 5,581 23,213 28,794 Non-current assetsOther non-current assetsb c 51,840 87,582 139,422Other investments 1,830 Loans 999 Other receivables 968 Derivative financial instruments 3,741 Defined benefit pension plan surplus 8,914 Total non-current assets 155,874 Capital expenditure and acquisitions 7,487 13,154 20,641
aNon-US region includes UK $61,149 million.bNon-US region includes UK $19,302 million.cExcluding financial instruments and post-employment benefit plan surpluses.
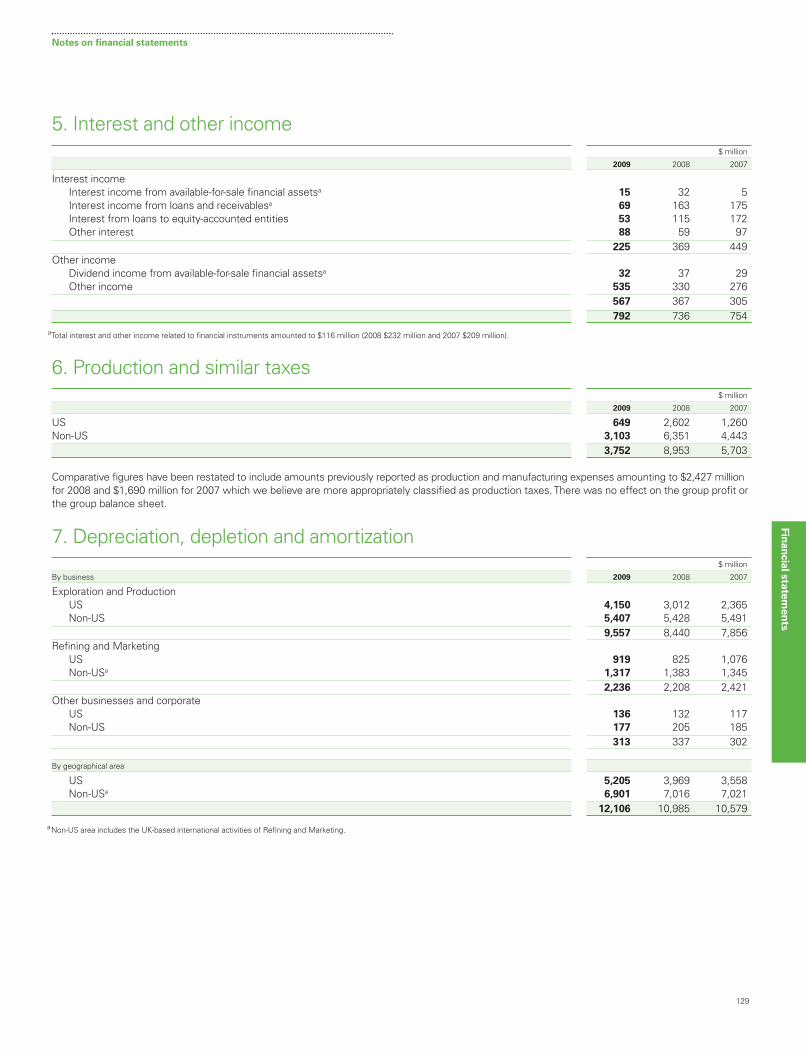
129
Notes on financial statements
5. Interest and other income
$ million
2009 2008 2007
Interest incomeInterest income from available-for-sale financial assetsa 15 32 5Interest income from loans and receivablesa 69 163 175Interest from loans to equity-accounted entities 53 115 172Other interest 88 59 97
225 369 449Other income
Dividend income from available-for-sale financial assetsa 32 37 29Other income 535 330 276
567 367 305792 736 754
aTotal interest and other income related to financial instruments amounted to $116 million (2008 $232 million and 2007 $209 million).
6. Production and similar taxes
$ million
2009 2008 2007
US 649 2,602 1,260Non-US 3,103 6,351 4,443
3,752 8,953 5,703
Comparative figures have been restated to include amounts previously reported as production and manufacturing expenses amounting to $2,427 millionfor 2008 and $1,690 million for 2007 which we believe are more appropriately classified as production taxes. There was no effect on the group profit orthe group balance sheet.
7. Depreciation, depletion and amortization
Fin
an
cia
l sta
tem
en
ts
BOL08439_p129 134.qxp:20 F 5/3/10 17:33 Page 129 Bleed: 0�mm Scale: 100%
$ million
By business 2009 2008 2007
Exploration and ProductionUS 4,150 3,012 2,365Non-US 5,407 5,428 5,491
9,557 8,440 7,856Refining and Marketing
US 919 825 1,076Non-USa 1,317 1,383 1,345
2,236 2,208 2,421Other businesses and corporate
US 136 132 117Non-US 177 205 185
313 337 302
By geographical area
US 5,205 3,969 3,558Non-USa 6,901 7,016 7,021
12,106 10,985 10,579
Non-US area includes the UK-based international activities of Refining and Marketing.a

130
Notes on financial statements
8. Impairment review of goodwill$ million
Goodwill at 31 December 2009 2008
Exploration and Production 4,297 4,297Refining and Marketing 4,245 5,462Other businesses and corporate 78 119
8,620 9,878
Goodwill acquired through business combinations has been allocated to groups of cash-generating units that are expected to benefit from the synergiesof the acquisition. For Exploration and Production, goodwill has been allocated to each geographic region, that is UK, Rest of Europe, US and Rest ofWorld, and for Refining and Marketing, goodwill has been allocated to the Rhine fuels value chain (FVC), US West Coast FVC, Lubricants and Other.
In assessing whether goodwill has been impaired, the carrying amount of the cash-generating unit (including goodwill) is compared with therecoverable amount of the cash-generating unit. The recoverable amount is the higher of fair value less costs to sell and value in use. In the absence ofany information about the fair value of a cash-generating unit, the recoverable amount is deemed to be the value in use.
The group calculates the recoverable amount as the value in use using a discounted cash flow model. The future cash flows are adjusted forrisks specific to the cash-generating unit and are discounted using a pre-tax discount rate. The discount rate is derived from the group’s post-taxweighted average cost of capital and is adjusted where applicable to take into account any specific risks relating to the country where the cash-generatingunit is located. The rate to be applied to each country is reassessed each year. A discount rate of 11% has been used for all goodwill impairmentcalculations performed in 2009 (2008 11%).
The business segment plans, which are approved on an annual basis by senior management, are the primary source of information for thedetermination of value in use. They contain forecasts for oil and natural gas production, refinery throughputs, sales volumes for various types of refinedproducts (e.g. gasoline and lubricants), revenues, costs and capital expenditure. As an initial step in the preparation of these plans, variousenvironmental assumptions, such as oil prices, natural gas prices, refining margins, refined product margins and cost inflation rates, are set by seniormanagement. These environmental assumptions take account of existing prices, global supply-demand equilibrium for oil and natural gas, othermacroeconomic factors and historical trends and variability.
Exploration and Production
BOL08439_p129 134.qxp:20 F 5/3/10 17:33 Page 130 Bleed: 0�mm Scale: 100%
$ million
2009 2008
Rest of Rest of UK US World Total UK US World Total
Goodwill 341 3,441 515 4,297 341 3,441 515 4,297Excess of recoverable amount over carrying amount 7,721 15,528 n/a n/a 7,972 16,692 n/a n/a
The value in use is based on the cash flows expected to be generated by the projected oil or natural gas production profiles up to the expected datesof cessation of production of each producing field. As the production profile and related cash flows can be estimated from the company’s pastexperience, management believes that the cash flows generated over the estimated life of field is the appropriate basis upon which to assess goodwilland individual assets for impairment. The date of cessation of production depends on the interaction of a number of variables, such as the recoverablequantities of hydrocarbons, the production profile of the hydrocarbons, the cost of the development of the infrastructure necessary to recover thehydrocarbons, the production costs, the contractual duration of the production concession and the selling price of the hydrocarbons produced. As eachproducing field has specific reservoir characteristics and economic circumstances, the cash flows of the fields are computed using appropriateindividual economic models and key assumptions agreed by BP’s management for the purpose. Capital expenditure and operating costs for the firstfour years and expected hydrocarbon production profiles up to 2020 are derived from the business segment plan. Estimated production quantities andcash flows up to the date of cessation of production on a field-by-field basis are developed to be consistent with this. The production profiles used areconsistent with the resource volumes approved as part of BP’s centrally-controlled process for the estimation of proved reserves and total resources.
Consistent with prior years, the 2009 review for impairment was carried out during the fourth quarter. As permitted by IAS 36, the detailedcalculations of recoverable amount performed in 2008 for the US and the UK, and calculations performed in 2005 for the Rest of World, were used forthe 2009 impairment test as the criteria of IAS 36 were considered to be satisfied: the excess of the recoverable amount over the carrying amount (theheadroom) was substantial in 2008 (for the US and the UK) and 2005 (for the Rest of World); there had been no significant change in the assets andliabilities; and the likelihood that the recoverable amount would be less than the carrying amount at the time of the test was remote.
The table above shows the carrying amount of the goodwill allocated to each of the regions of the Exploration and Production segment and,where required, the headroom in the cash-generating units to which the goodwill has been allocated. The estimates of headroom at 31 December2009 for the UK and the US are based on recoverable amounts determined in 2008 and carrying amounts at 31 December 2009. No impairmentcharge is required.
For 2008, the Brent oil price assumption was an average $49 per barrel in 2009, $59 per barrel in 2010, $65 per barrel in 2011, $68 per barrel in2012, $70 per barrel in 2013 and $75 per barrel in 2014 and beyond. The Henry Hub natural gas price assumption was an average of $6.16/mmBtu in2009, $7.15/mmBtu in 2010, $7.34/mmBtu in 2011, $7.62/mmBtu in 2012, $7.60/mmBtu in 2013 and $7.50/mmBtu in 2014 and beyond. The prices forthe first five years were derived from forward price curves at the year-end. Prices in 2014 and beyond were determined using long-term views ofglobal supply and demand, building upon past experience of the industry and consistent with a number of external economic forecasts. These priceswere adjusted to arrive at appropriate consistent price assumptions for different qualities of oil and gas.
The key assumptions required for the value-in-use estimation are the oil and natural gas prices, production volumes and the discount rate. Totest the sensitivity of the headroom to changes in production volumes and oil and natural gas prices, management has developed ‘rules of thumb’ forkey assumptions. Applying these gives an indication of the impact on the headroom of possible changes in the key assumptions.

131
Notes on financial statements
8. Impairment review of goodwill continuedIn the prior year it was estimated that the long-term price of oil that would cause the recoverable amount to be equal to the carrying amount for eachcash-generating unit would be of the order of $38 per barrel for the UK and $50 per barrel for the US. It was estimated that the long-term price of gasthat would cause the total recoverable amount to be equal to the total carrying amount of goodwill and related non-current assets for the US cash-generating unit would be of the order of $4/mmBtu (Henry Hub). As a significant amount of gas from the North Sea is sold under fixed-price contracts, orcontracts priced using non-gas indices, it was estimated that no reasonably possible change in gas prices would cause the UK headroom to be reduced tozero. It was estimated that no reasonably possible change in oil and gas prices would cause the headroom in Rest of World to be reduced to zero.
Estimated production volumes are based on detailed data for the fields and take into account development plans for the fields agreed bymanagement as part of the long-term planning process. In 2008, it was estimated that, if all our production were to be reduced by 10% for the wholeof the next 15 years, this would not be sufficient to reduce the excess of recoverable amount over the carrying amounts of each cash-generating unitto zero. Consequently, management believes no reasonably possible change in the production assumption would cause the carrying amounts toexceed the recoverable amounts.
Management also believes that currently there is no reasonably possible change in discount rate that would cause the carrying amounts in theUK, US or Rest of World to exceed the recoverable amounts.
Refining and Marketing
$ million
2009 2008
US WestRhine FVC Lubricants Other Total Rhine FVC Coast FVC Lubricants Other Total
Goodwill 655 3,416 174 4,245 637 1,579 3,043 203 5,462Excess of recoverable amount
over carrying amount 2,034 n/a n/a n/a 3,603 1,629 5,445 n/a n/a
For all cash-generating units, the cash flows for the first two or five years are derived from the business segment plan. For determining the value inuse for each of the cash-generating units, cash flows for a period of 10 years have been discounted and aggregated with a terminal value.
Rhine FVCAs a result of the continuing integration of our businesses into fuels value chains, convenience retail operations in the Rhine region were incorporatedinto the Rhine FVC from the beginning of 2009. The key assumptions to which the calculation of value in use for the Rhine FVC is most sensitive arerefinery gross margins, production volumes, and discount rate. Refinery gross margins used in the plan are derived from assumptions that areconsistent with those used to develop the regional Global Indicator Margin (GIM). The regional GIM is based on a single representative crude withproduct yields characteristic of the typical level of upgrading complexity available in the region. The average values assigned to the regional GIM andrefinery production volume over the plan period are $4.05 per barrel and 254mmbbl a year (2008 $5.50 per barrel and 250mmbbl a year). The valuesreflect past experience and are consistent with external sources. Cash flows beyond the five-year plan period are extrapolated using a 2.4% growth rate(2008 cash flows beyond the three-year plan period were extrapolated using a 1.2% growth rate).
2009
Sensitivity analysisSensitivity of value in use to a change in refinery margins of $1 per barrel ($ billion) 2.2
Adverse change in refinery margins to reduce recoverable amount to carrying amount ($ per barrel) 0.9
Sensitivity of value in use to a 5% change in production volume ($ billion) 0.8
Adverse change in production volume to reduce recoverable amount to carrying amount (mmbbl per year) 31
Sensitivity of value in use to a change in the discount rate of 1% ($ billion) 0.8
Discount rate to reduce recoverable amount to carrying amount 14%
LubricantsThe key assumptions to which the calculation of value in use for the Lubricants unit is most sensitive are operating unit margins, sales volumes, anddiscount rate. The values assigned to these key assumptions reflect past experience. No reasonably possible change in any of these key assumptionswould cause the unit’s carrying amount to exceed its recoverable amount. For 2008 the average values assigned to the operating margin and salesvolumes over the plan period were 70 cents per litre and 3.4 billion litres per year, respectively. Cash flows beyond the two-year plan period areextrapolated using a 3% growth rate (2008 cash flows beyond the three-year plan period were extrapolated using a 3% growth rate).
US West Coast FVCAs disclosed in Note 3, the impairment review of goodwill allocated to the US West Coast FVC resulted in the recognition of an impairment loss in2009 to write off the entire balance of $1,579 million. The key assumptions to which the calculation of value in use for the US West Coast FVC wasmost sensitive in 2008 were refinery gross margins, production volumes and discount rates. The average value assigned to the refinery grossmargin during the plan period was based on a $7.60 per barrel regional GIM. The average value assigned to the production volume was 170mmbbl ayear over the plan period. Cash flows beyond the three-year plan period were extrapolated using a 2% growth rate. These assumptions reflectedpast experience and were consistent with external sources.
Fin
an
cia
l sta
tem
en
ts
BOL08439_p129 134.qxp:20 F 5/3/10 17:33 Page 131 Bleed: 0�mm Scale: 100%

132
Notes on financial statements
9. Distribution and administration expenses
$ million
2009 2008 2007
Distribution 12,798 14,075 14,028Administration 1,240 1,337 1,343
14,038 15,412 15,371
10. Currency exchange gains and losses$ million
2009 2008 2007
Currency exchange (gains) losses (credited) charged to incomea 193 156 (201)
aExcludes exchange gains and losses arising on financial instruments measured at fair value through profit or loss.
11. Research and development
$ million
2009 2008 2007
Expenditure on research and development 587 595 566
12. Operating leases
BOL08439_p129 134.qxp:20 F 5/3/10 17:33 Page 132 Bleed: 0�mm Scale: 100%
The presentation of operating lease expense and future minimum lease payments has been revised in 2009 in order to provide more meaningfulinformation about the costs incurred by BP under these arrangements, and the associated future commitments. The comparative information has beenamended to conform to the revised presentation.
In the case of an operating lease entered into by BP as the operator of a jointly controlled asset, the amounts shown in the tables belowrepresent the net operating lease expense and net future minimum lease payments. These net amounts are after deducting amounts reimbursed, orto be reimbursed, by joint venture partners, whether the joint venture partners have co-signed the lease or not. Where BP is not the operator of ajointly controlled asset, BP’s share of the lease expense and future minimum lease payments is included in the amounts shown, whether BP hasco-signed the lease or not.
The table below shows the expense for the year in respect of operating leases.
$ million
2009 2008 2007
Minimum lease payments 4,109 4,114 3,522 Contingent rentals (9) 97 80Sub-lease rentals (133) (194) (183)
3,967 4,017 3,419
The future minimum lease payments at 31 December, before deducting related rental income from operating sub-leases of $379 million (2008 $547 million),are shown in the table below. This does not include future contingent rentals. Where the lease rentals are dependent on a variable factor, the futureminimum lease payments are based on the factor as at inception of the lease.
$ million
Future minimum lease payments 2009 2008
Payable within1 year 3,251 3,659 2 to 5 years 7,334 7,628 Thereafter 4,131 4,864
14,716 16,151

133
Notes on financial statements
Fin
an
cia
l sta
tem
en
ts
12. Operating leases continuedThe group enters into operating leases of ships, plant and machinery, commercial vehicles and land and buildings. Typical durations of the leases are as follows:
Years
Ships up to 15Plant and machinery up to 10Commercial vehicles up to 15Land and buildings up to 40
The group has entered into a number of structured operating leases for ships and in most cases the lease rental payments vary with market interestrates. The variable portion of the lease payments above or below the amount based on the market interest rate prevailing at inception of the lease istreated as contingent rental expense. The group also routinely enters into bareboat charters, time-charters and spot-charters for ships on standardindustry terms.
The most significant items of plant and machinery hired under operating leases are drilling rigs used in the Exploration and Production segment.At 31 December 2009 the future minimum lease payments relating to drilling rigs amounted to $4,919 million (2008 $5,531 million). In some cases,drilling rig lease rental rates are adjusted periodically to market rates that are influenced by oil prices and may be significantly different from the rates atthe inception of the lease. Differences between the rate paid and rate at inception of the lease are treated as contingent rental expense.
Commercial vehicles hired under operating leases are primarily railcars. Retail service station sites and office accommodation are the mainitems in the land and buildings category.
The terms and conditions of these operating leases do not impose any significant financial restrictions on the group. Some of the leases ofships and buildings allow for renewals at BP’s option.
13. Exploration for and evaluation of oil and natural gas resources
BOL08439_p129 134.qxp:20 F 5/3/10 17:33 Page 133 Bleed: 0�mm Scale: 100%
The following financial information represents the amounts included within the group totals relating to activity associated with the exploration for andevaluation of oil and natural gas resources. All such activity is recorded within the Exploration and Production segment.
$ million
2009 2008 2007
Exploration and evaluation costsExploration expenditure written off 593 385 347Other exploration costs 523 497 409
Exploration expense for the yeara 1,116 882 756Intangible assets – exploration expenditure 10,388 9,031 5,252Net assets 10,388 9,031 5,252Capital expenditure 2,715 4,780 2,000Net cash used in operating activities 523 497 409Net cash used in investing activities 3,306 4,163 2,000
aIn addition to these amounts, an impairment charge of $210 million was recognized in 2008 relating to exploration assets in Vietnam following BP’s decision to withdraw from activities in the areaconcerned.

14. Auditor’s remuneration
Notes on financial statements
134
BOL08439_p129 134.qxp:20 F 5/3/10 17:33 Page 134 Bleed: 0�mm Scale: 100%
$ million
Fees – Ernst & Young 2009 2008 2007
Fees payable to the company’s auditors for the audit of the company’s accountsa 13 16 18 Fees payable to the company’s auditors and its associates for other services
Audit of the company’s subsidiaries pursuant to legislation 22 28 31 Other services pursuant to legislation 11 13 14
46 57 63 Tax services 1 2 2Services relating to corporate finance transactions – 2 1All other services 6 5 8
Audit fees in respect of the BP pension plans 1 1 154 67 75
a Fees in respect of the audit of the accounts of BP p.l.c. including the group’s consolidated financial statements.
2008 includes $3 million of additional fees for 2007 and 2007 includes $7 million of additional fees for 2006. Auditors’ remuneration is included in theincome statement within distribution and administration expenses.
The tax services relate to income tax and indirect tax compliance, employee tax services and tax advisory services.The audit committee has established pre-approval policies and procedures for the engagement of Ernst & Young to render audit and certain
assurance and tax services. The audit fees payable to Ernst & Young are reviewed by the audit committee in the context of other global companies forcost-effectiveness. Ernst & Young performed further assurance and tax services that were not prohibited by regulatory or other professionalrequirements and were pre-approved by the committee. Ernst & Young is engaged for these services when its expertise and experience of BP areimportant. Most of this work is of an audit nature. Tax services were awarded either through a full competitive tender process or following anassessment of the expertise of Ernst & Young compared with that of other potential service providers. These services are for a fixed term.
Under SEC regulations, the remuneration of the auditor of $54 million (2008 $67 million and 2007 $75 million) is required to be presented asfollows: audit services $46 million (2008 $57 million and 2007 $63 million); other audit related services $2 million (2008 $1 million and 2007 $3 million);tax services $1 million (2008 $2 million and 2007 $2 million); and fees for all other services $5 million (2008 $7 million and 2007 $7 million).
15. Finance costs$ million
2009 2008 2007
Interest payable 906 1,319 1,433Capitalized at 2.75% (2008 4.00% and 2007 5.70%)a (188) (162) (323)Unwinding of discount on provisions 247 287 283Unwinding of discount on other payables 145 103 –
1,110 1,547 1,393
a Tax relief on capitalized interest is $63 million (2008 $42 million and 2007 $81 million).

135
Notes on financial statements
Fin
an
cia
l sta
tem
en
ts
–
BOL08439_p135 141.qxp:20 F 5/3/10 17:33 Page 135 Bleed: 0�mm Scale: 100%
16. TaxationTax on profit
$ million
2009 2008 2007
Current taxCharge for the year 6,045 13,468 10,006Adjustment in respect of prior years (300) (85) (171)
5,745 13,383 9,835Deferred tax
Origination and reversal of temporary differences in the current year 2,131 (324) 671 Adjustment in respect of prior years 489 (442) (64)
2,620 (766) 607 Tax on profit 8,365 12,617 10,442Tax included in other comprehensive income
$ million
2009 2008 2007
Current tax – (264) (178)Deferred tax (525) (2,682) 454
(525) (2,946) 276 Tax included directly in equity
$ million
2009 2008 2007
Deferred tax (65) 190 (213)
Reconciliation of the effective tax rate
The following table provides a reconciliation of the UK statutory corporation tax rate to the effective tax rate of the group on profit before taxation.
$ million
2009 2008 2007
Profit before taxation 25,124 34,283 31,611Tax on profit 8,365 12,617 10,442Effective tax rate 33% 37% 33%
% of profit before taxation
UK statutory corporation tax rate 28 28 30Increase (decrease) resulting from
UK supplementary and overseas taxes at higher rates 8 14 8Tax reported in equity-accounted entities (3) (2) (2)Adjustments in respect of prior years 1 (2) (1)Current year losses unrelieved (prior year losses utilized) – (1) (1)Goodwill impairment 2 –Tax incentives for investment (2) (1) –Other (1) 1 (1)
Effective tax rate 33 37 33

136
Notes on financial statements
BOL08439_p135 141.qxp:20 F 5/3/10 17:33 Page 136 Bleed: 0�mm Scale: 100%
16. Taxation continuedDeferred tax
$ million
Income statement Balance sheet
2009 2008 2007 2009 2008
Deferred tax liabilityDepreciation 1,983 1,248 125 25,398 23,342 Pension plan surpluses (6) 108 127 271 412 Other taxable temporary differences 978 (2,471) 1,371 4,307 3,626
2,955 (1,115) 1,623 29,976 27,380 Deferred tax asset
Petroleum revenue tax 44 121 139 (142) (192)Pension plan and other post-retirement benefit plan deficits 180 104 (72) (2,269) (2,414)Decommissioning, environmental and other provisions 86 (333) (1,069) (4,930) (4,860)Derivative financial instruments 80 228 450 (243) (331)Tax credits (516) 330 (384) (1,034) (519)Loss carry forward 402 (212) (82) (1,014) (1,302)Other deductible temporary differences (611) 111 2 (2,198) (1,564)
(335) 349 (1,016) (11,830) (11,182)Net deferred tax (credit) charge and net deferred tax liability 2,620 (766) 607 18,146 16,198 Of which – deferred tax liabilities 18,662 16,198
– deferred tax assets 516 –
$ million
Analysis of movements during the year 2009 2008
At 1 January 16,198 19,215 Exchange adjustments (7) (67)Charge (credit) for the year on profit 2,620 (766)Charge (credit) for the year in other comprehensive income (525) (2,682)Charge (credit) for the year in equity (65) 190 Deletions (75) –Other movements – 308 At 31 December 18,146 16,198
In 2009 and 2008, there have been no changes in the statutory tax rates that have materially impacted the group’s tax charge. In 2007 the enactmentof a 2% reduction in the rate of UK corporation tax on profits arising from activities outside the North Sea reduced the deferred tax charge by$189 million in that year.
Deferred tax assets are recognized to the extent that it is probable that taxable profit will be available against which the deductible temporarydifferences and the carry-forward of unused tax credits and unused tax losses can be utilized.
At 31 December 2009, the group had approximately $4.2 billion (2008 $6.3 billion) of carry-forward tax losses, predominantly in Europe, thatwould be available to offset against future taxable profit. A deferred tax asset has been recognized in respect of $3.2 billion of losses (2008$4.2 billion). No deferred tax asset has been recognized in respect of $1.0 billion of losses (2008 $2.1 billion). In 2009 the group has been able to utilize$1.1 billion of the losses, previously unrecognized, through other comprehensive income. Of the $1.0 billion losses with no deferred tax asset,$0.2 billion expire in three years and $0.8 billion have no fixed expiry date.
At 31 December 2009, the group had approximately $3.0 billion of unused tax credits predominantly in the US (2008 $3.4 billion in the UK andUS). Due to legislative changes in the UK that repealed double taxation relief in relation to foreign dividends, onshore pooling and utilization of eligibleunrelieved foreign tax, there are now no UK tax credits carried forward at 31 December 2009. A deferred tax asset of $1.0 billion has been recognizedin 2009 in respect of unused tax credits (2008 $0.5 billion). No deferred tax asset has been recognized in respect of $2.0 billion of tax credits (2008$2.9 billion). The US tax credits with no deferred tax asset, amounting to $2.0 billion (2008 $1.8 billion) expire 10 years after generation, andsubstantially all expire in the period 2014-2019.
The major components of temporary differences at the end of 2009 are tax depreciation, US inventory holding gains (classified as other taxabletemporary differences), provisions and pension plan and other post-retirement benefit plan deficits.
In 2009 there are no material temporary differences associated with investments in subsidiaries and equity-accounted entities for whichdeferred tax liabilities have not been recognized.

137
Notes on financial statements
17. Dividends
Fin
an
cia
l sta
tem
en
ts
BOL08439_p135 141.qxp:20 F 5/3/10 17:33 Page 137 Bleed: 0�mm Scale: 100%
pence per share cents per share $ million
2009 2008 2007 2009 2008 2007 2009 2008 2007
Dividends announced and paidPreference shares 2 2 2Ordinary shares
March 9.818 6.813 5.258 14.000 13.525 10.325 2,619 2,553 2,000 June 9.584 6.830 5.151 14.000 13.525 10.325 2,619 2,545 1,983 September 8.503 7.039 5.278 14.000 14.000 10.825 2,620 2,623 2,065 December 8.512 8.705 5.308 14.000 14.000 10.825 2,623 2,619 2,056
36.417 29.387 20.995 56.000 55.050 42.300 10,483 10,342 8,106 Dividend announced per ordinary
share, payable in March 2010 8.679 – – 14.000 – – 2,626 – –
The group does not account for dividends until they are paid. The accounts for the year ended 31 December 2009 do not reflect the dividendannounced on 2 February 2010 and payable in March 2010; this will be treated as an appropriation of profit in the year ended 31 December 2010.
18. Earnings per ordinary sharecents per share
2009 2008 2007
Basic earnings per share 88.49 112.59 108.76Diluted earnings per share 87.54 111.56 107.84
Basic earnings per ordinary share amounts are calculated by dividing the profit for the year attributable to ordinary shareholders by the weightedaverage number of ordinary shares outstanding during the year. The average number of shares outstanding excludes treasury shares and the sharesheld by the Employee Share Ownership Plans (ESOPs) and includes certain shares that will be issuable in the future under employee share plans.
For the diluted earnings per share calculation, the weighted average number of shares outstanding during the year is adjusted for the numberof shares that are potentially issuable in connection with employee share-based payment plans using the treasury stock method.
$ million
2009 2008 2007
Profit attributable to BP shareholders 16,578 21,157 20,845Less dividend requirements on preference shares 2 2 2Diluted profit for the year attributable to BP ordinary shareholders 16,576 21,155 20,843
shares thousand
2009 2008 2007
Basic weighted average number of ordinary shares 18,732,459 18,789,827 19,163,389 Potential dilutive effect of ordinary shares issuable under employee share schemes 203,232 172,690 163,486
18,935,691 18,962,517 19,326,875
The number of ordinary shares outstanding at 31 December 2009, excluding treasury shares and the shares held by the ESOPs, and including certainshares that will be issuable in the future under employee share plans was 18,755,378,211. Between 31 December 2009 and 18 February 2010, thelatest practicable date before the completion of these financial statements, there has been a net increase of 12,018,689 in the number of ordinaryshares outstanding as a result of share issues in relation to employee share schemes. The number of potential ordinary shares issuable through theexercise of employee share schemes was 215,123,696 at 31 December 2009. There has been an increase of 264,627 in the number of potentialordinary shares between 31 December 2009 and 18 February 2010.
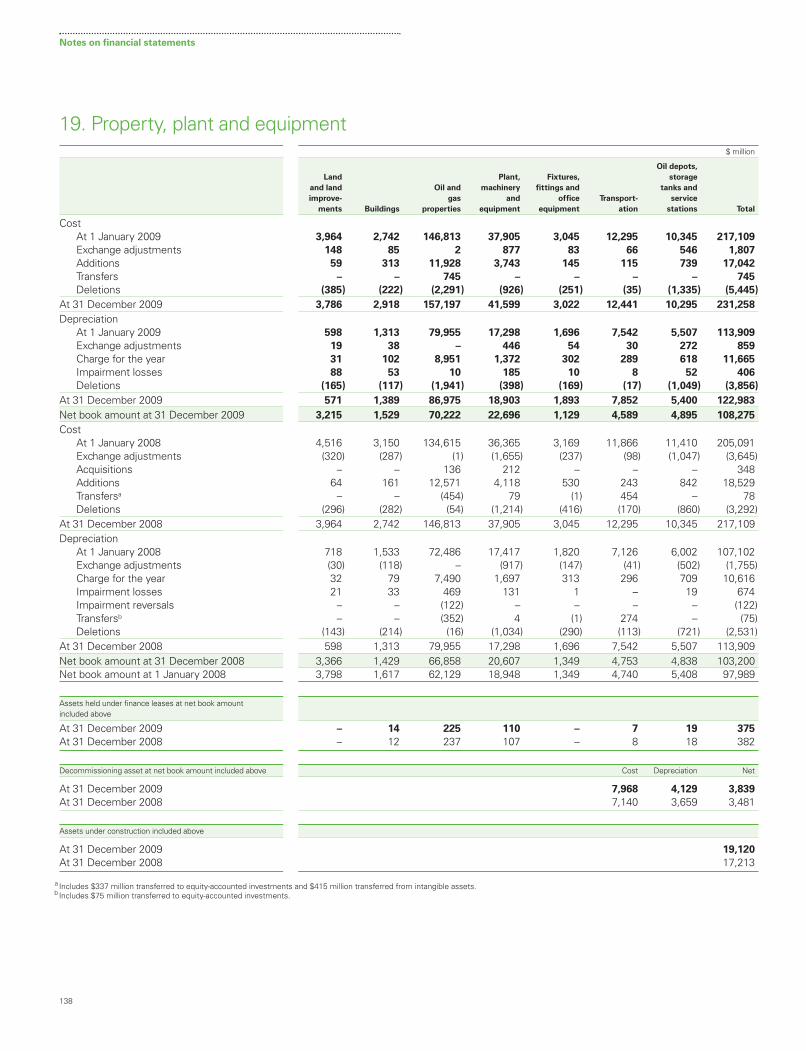
138
Notes on financial statements
BOL08439_p135 141.qxp:20 F 5/3/10 17:33 Page 138 Bleed: 0�mm Scale: 100%
19. Property, plant and equipment$ million
Oil depots,
Land Plant, Fixtures, storage
and land Oil and machinery fittings and tanks and
improve- gas and office Transport- service
ments Buildings properties equipment equipment ation stations Total
CostAt 1 January 2009 3,964 2,742 146,813 37,905 3,045 12,295 10,345 217,109
Exchange adjustments 148 85 2 877 83 66 546 1,807
Additions 59 313 11,928 3,743 145 115 739 17,042
Transfers – – 745 – – – – 745
Deletions (385) (222) (2,291) (926) (251) (35) (1,335) (5,445)
At 31 December 2009 3,786 2,918 157,197 41,599 3,022 12,441 10,295 231,258
DepreciationAt 1 January 2009 598 1,313 79,955 17,298 1,696 7,542 5,507 113,909
Exchange adjustments 19 38 – 446 54 30 272 859
Charge for the year 31 102 8,951 1,372 302 289 618 11,665
Impairment losses 88 53 10 185 10 8 52 406
Deletions (165) (117) (1,941) (398) (169) (17) (1,049) (3,856)
At 31 December 2009 571 1,389 86,975 18,903 1,893 7,852 5,400 122,983
Net book amount at 31 December 2009 3,215 1,529 70,222 22,696 1,129 4,589 4,895 108,275
CostAt 1 January 2008 4,516 3,150 134,615 36,365 3,169 11,866 11,410 205,091 Exchange adjustments (320) (287) (1) (1,655) (237) (98) (1,047) (3,645)Acquisitions – – 136 212 – – – 348 Additions 64 161 12,571 4,118 530 243 842 18,529Transfersa – – (454) 79 (1) 454 – 78 Deletions (296) (282) (54) (1,214) (416) (170) (860) (3,292)
At 31 December 2008 3,964 2,742 146,813 37,905 3,045 12,295 10,345 217,109 Depreciation
At 1 January 2008 718 1,533 72,486 17,417 1,820 7,126 6,002 107,102 Exchange adjustments (30) (118) – (917) (147) (41) (502) (1,755)Charge for the year 32 79 7,490 1,697 313 296 709 10,616 Impairment losses 21 33 469 131 1 – 19 674 Impairment reversals – – (122) – – – – (122)Transfersb – – (352) 4 (1) 274 – (75)Deletions (143) (214) (16) (1,034) (290) (113) (721) (2,531)
At 31 December 2008 598 1,313 79,955 17,298 1,696 7,542 5,507 113,909 Net book amount at 31 December 2008 3,366 1,429 66,858 20,607 1,349 4,753 4,838 103,200 Net book amount at 1 January 2008 3,798 1,617 62,129 18,948 1,349 4,740 5,408 97,989
Assets held under finance leases at net book amount included above
At 31 December 2009 – 14 225 110 – 7 19 375
At 31 December 2008 – 12 237 107 – 8 18 382
Decommissioning asset at net book amount included above Cost Depreciation Net
At 31 December 2009 7,968 4,129 3,839
At 31 December 2008 7,140 3,659 3,481
Assets under construction included above
At 31 December 2009 19,120
At 31 December 2008 17,213
a Includes $337 million transferred to equity-accounted investments and $415 million transferred from intangible assets.b Includes $75 million transferred to equity-accounted investments.

139
Notes on financial statements
20. Goodwill$ million
2009 2008
CostAt 1 January 9,878 11,006 Exchange adjustments 350 (1,112)Acquisitions – 1 Additions – 39 Deletions (29) (56)
At 31 December 10,199 9,878 Impairment losses
At 1 January – –Impairment losses for the year (1,579) –
At 31 December (1,579) –Net book amount at 31 December 8,620 9,878
21. Intangible assets
Fin
an
cia
l sta
tem
en
ts
BOL08439_p135 141.qxp:20 F 5/3/10 17:33 Page 139 Bleed: 0�mm Scale: 100%
$ million
2009 2008
Exploration Explorationand appraisal Other and appraisal Other
expenditure intangibles Total expenditure intangibles Total
CostAt 1 January 9,425 2,927 12,352 5,637 2,898 8,535Exchange adjustments 8 75 83 (1) (175) (176)Acquisitions – – – 42 – 42Additionsa 2,715 441 3,156 4,738 354 5,092Transfers (745) – (745) (415) – (415)Deletions (690) (159) (849) (576) (150) (726)
At 31 December 10,713 3,284 13,997 9,425 2,927 12,352Amortization
At 1 January 394 1,698 2,092 385 1,498 1,883Exchange adjustments – 32 32 – (60) (60)Charge for the year 593 441 1,034 385 369 754Impairment losses – 90 90 200 – 200Deletions (662) (137) (799) (576) (109) (685)
At 31 December 325 2,124 2,449 394 1,698 2,092Net book amount at 31 December 10,388 1,160 11,548 9,031 1,229 10,260Net book amount at 1 January 9,031 1,229 10,260 5,252 1,400 6,652
a Included in additions to exploration and appraisal expenditure in 2008 is $2,331 million in relation to BP's purchase of interests in shale gas assets in the US.

140
Notes on financial statements
BOL08439_p135 141.qxp:20 F 5/3/10 17:33 Page 140 Bleed: 0�mm Scale: 100%
22. Investments in jointly controlled entitiesThe significant jointly controlled entities of the BP group at 31 December 2009 are shown in Note 43. Summarized financial information for the group’sshare of jointly controlled entities is shown below.
$ million
2009 2008 2007
TNK-BP Other Total TNK-BP Other Total
Sales and other operating revenues 9,396 25,936 10,796 36,732 19,463 7,245 26,708 Profit before interest and taxation 1,815 3,588 1,343 4,931 3,743 1,299 5,042 Finance costs 155 275 185 460 264 176 440Profit before taxation 1,660 3,313 1,158 4,471 3,479 1,123 4,602 Taxation 374 882 397 1,279 993 259 1,252Minority interest – 169 – 169 215 – 215Profit for the year 1,286 2,262 761 3,023 2,271 864 3,135Non-current assets 15,857 13,874 15,584 29,458 Current assets 4,124 3,760 3,687 7,447 Total assets 19,981 17,634 19,271 36,905 Current liabilities 2,276 3,287 1,998 5,285 Non-current liabilities 3,768 4,820 3,973 8,793 Total liabilities 6,044 8,107 5,971 14,078 Minority interest – 588 – 588
13,937 8,939 13,300 22,239 Group investment in jointly controlled entities
Group share of net assets (as above) 13,937 8,939 13,300 22,239 Loans made by group companies to jointlycontrolled entities 1,359 – 1,587 1,587
15,296 8,939 14,887 23,826
Our investment in TNK-BP was reclassified from a jointly controlled entity to an associate with effect from 9 January 2009, the date that BP finalized arevised shareholder agreement with its Russian partners in TNK-BP, Alfa Access-Renova (AAR). The formerly evenly-balanced main board structure hasbeen replaced by one with four representatives each from BP and AAR, plus three independent directors. The change in accounting classification froma jointly controlled entity to an associate reflected the ability of the independent directors of TNK-BP to decide on certain matters in the event ofdisagreement between the shareholder representatives on the board. The group's investment continues to be accounted for using the equity method.
In December 2007, BP signed a memorandum of understanding with Husky Energy Inc. (Husky) to form an integrated North American oilsands business. The transaction was completed on 31 March 2008, with BP contributing its Toledo refinery to a US jointly controlled entity to whichHusky contributed $250 million cash and a payable of $2,588 million. In Canada, Husky contributed its Sunrise field to a second jointly controlled entity,with BP contributing $250 million in cash and a payable of $2,264 million. Both jointly controlled entities are owned 50:50 by BP and Husky and areaccounted for using the equity method.
Transactions between the group and its jointly controlled entities are summarized below.
$ million
Sales to jointly controlled entities 2009 2008 2007
Amount Amount Amountreceivable at receivable at receivable at
Product Sales 31 December Sales 31 December Sales 31 December
LNG, crude oil and oil products, natural gas, employee services 2,182 1,328 2,971 1,036 2,336 888
$ million
Purchases from jointly controlled entities 2009 2008 2007
Amount Amount Amountpayable at payable at payable at
Product Purchases 31 Decembera Purchases 31 Decembera Purchases 31 December
LNG, crude oil and oil products, natural gas, refinery operating costs,plant processing fees 5,377 214 9,115 182 2,067 66
a Amounts payable to jointly controlled entities shown above exclude payables relating to BP’s contribution on the establishment of the Sunrise Oil Sands joint venture.
The terms of the outstanding balances receivable from jointly controlled entities are typically 30 to 45 days, except for a receivable from Ruhr Oel of$419 million, which will be paid over several years as it relates partly to pension payments. The balances are unsecured and will be settled in cash.There are no significant provisions for doubtful debts relating to these balances and no significant expense recognized in the income statement inrespect of bad or doubtful debts. Dividends receivable are not included in the above balances.

141
Notes on financial statements
Fin
an
cia
l sta
tem
en
ts
–
BOL08439_p135 141.qxp:20 F 5/3/10 17:33 Page 141 Bleed: 0�mm Scale: 100%
23. Investments in associatesThe significant associates of the group are shown in Note 43. The principal associate in 2009 is TNK-BP. Summarized financial information for thegroup’s share of associates is set out below.
$ million
2009 2008 2007
TNK-BP Other Total
Sales and other operating revenues 17,377 8,301 25,678 11,709 9,855Profit before interest and taxation 3,178 811 3,989 1,065 947Finance costs 220 19 239 33 57Profit before taxation 2,958 792 3,750 1,032 890Taxation 871 125 996 234 193Minority interest 139 – 139 –Profit for the year 1,948 667 2,615 798 697Non-current assets 13,437 4,573 18,010 4,292 Current assets 4,205 1,887 6,092 1,912 Total assets 17,642 6,460 24,102 6,204 Current liabilities 3,122 1,640 4,762 1,669 Non-current liabilities 4,797 2,277 7,074 1,852 Total liabilities 7,919 3,917 11,836 3,521 Minority interest 582 – 582 –
9,141 2,543 11,684 2,683 Group investment in associates
Group share of net assets (as above) 9,141 2,543 11,684 2,683 Loans made by group companies to associates – 1,279 1,279 1,317
9,141 3,822 12,963 4,000
Our investment in TNK-BP was reclassified from a jointly controlled entity to an associate with effect from 9 January 2009. See Note 22 forfurther information.
Transactions between the group and its associates are summarized below.
$ million
Sales to associates 2009 2008 2007
Amount Amount Amountreceivable at receivable at receivable at
Product Sales 31 December Sales 31 December Sales 31 December
LNG, crude oil and oil products, natural gas, employee services 2,801 320 3,248 219 697 60
Purchases from associates 2009 2008 2007
Amount Amount Amountpayable at payable at payable at
Product Purchases 31 December Purchases 31 December Purchases 31 December
Crude oil and oil products, natural gas, transportation tariff 5,110 614 4,635 295 2,905 574
The terms of the outstanding balances receivable from associates are typically 30 to 45 days. The balances are unsecured and will be settled in cash.There are no significant provisions for doubtful debts relating to these balances and no significant expense recognized in the income statement inrespect of bad or doubtful debts.
The amounts receivable and payable at 31 December 2009, as shown in the table above, exclude $376 million due from and due to anintermediate associate which provides funding for our associate The Baku-Tbilisi-Ceyhan Pipeline Company. These balances are expected to be settledin cash throughout the period to 2015.
Dividends receivable at 31 December 2009 of $19 million are also excluded from the table above.

142
Notes on financial statements
BOL08439_p142 169.qxp:20 F 5/3/10 17:33 Page 142 Bleed: 0�mm Scale: 100%
24. Financial instruments and financial risk factorsThe accounting classification of each category of financial instruments, and their carrying amounts, are set out below.
$ million
At 31 December 2009
Financial
Available-for- At fair value Derivative liabilities Total
Loans and sale financial through profit hedging measured at carrying
Note receivables assets and loss instruments amortized cost amount
Financial assetsOther investments 25 – 1,567 – – – 1,567
Loans 1,288 – – – – 1,288
Trade and other receivables 27 31,016 – – – – 31,016
Derivative financial instruments 31 – – 7,960 972 – 8,932
Cash and cash equivalents 28 6,570 1,769 – – – 8,339
Financial liabilitiesTrade and other payables 30 – – – – (34,325) (34,325)
Derivative financial instruments 31 – – (7,389) (766) – (8,155)
Accruals – – – – (6,905) (6,905)
Finance debt 32 – – – – (34,627) (34,627)
38,874 3,336 571 206 (75,857) (32,870)
$ million
At 31 December 2008
FinancialAvailable-for- At fair value Derivative liabilities Total
Loans and sale financial through profit hedging measured at carryingNote receivables assets and loss instruments amortized cost amount
Financial assetsOther investments 25 – 855 – – – 855 Loans 1,163 – – – – 1,163Trade and other receivables 27 29,489 – – – – 29,489 Derivative financial instruments 31 – – 12,501 1,063 – 13,564 Cash and cash equivalents 28 5,609 2,588 – – – 8,197
Financial liabilitiesTrade and other payables 30 – – – – (33,140) (33,140)Derivative financial instruments 31 – – (13,173) (2,075) – (15,248)Accruals – – – – (7,527) (7,527)Finance debt 32 – – – – (33,204) (33,204)
36,261 3,443 (672) (1,012) (73,871) (35,851)
The fair value of finance debt is shown in Note 32. For all other financial instruments, the carrying amount is either the fair value, or approximates the fair value.
Financial risk factors
The group is exposed to a number of different financial risks arising from natural business exposures as well as its use of financial instrumentsincluding: market risks relating to commodity prices, foreign currency exchange rates, interest rates and equity prices; credit risk; and liquidity risk.
The group financial risk committee (GFRC) advises the group chief financial officer (CFO) who oversees the management of these risks. TheGFRC is chaired by the CFO and consists of a group of senior managers including the group treasurer and the heads of the finance, tax and theintegrated supply and trading functions. The purpose of the committee is to advise on financial risks and the appropriate financial risk governanceframework for the group. The committee provides assurance to the CFO and the group chief executive (GCE), and via the GCE to the board, that thegroup’s financial risk-taking activity is governed by appropriate policies and procedures and that financial risks are identified, measured and managed inaccordance with group policies and group risk appetite.
The group’s trading activities in the oil, natural gas and power markets are managed within the integrated supply and trading function, whileactivities in the financial markets are managed by the treasury function. All derivative activity is carried out by specialist teams that have theappropriate skills, experience and supervision. These teams are subject to close financial and management control.
The integrated supply and trading function maintains formal governance processes that provide oversight of market risk associated with tradingactivity. These processes meet generally accepted industry practice and reflect the principles of the Group of Thirty Global Derivatives Studyrecommendations. A policy and risk committee monitors and validates limits and risk exposures, reviews incidents and validates risk-related policies,methodologies and procedures. A commitments committee approves value-at-risk delegations, the trading of new products, instruments andstrategies and material commitments.

143
–12
Notes on financial statements
Fin
an
cia
l sta
tem
en
ts
BOL08439_p142 169.qxp:20 F 5/3/10 17:33 Page 143 Bleed: 0�mm Scale: 100%
24. Financial instruments and financial risk factors continuedIn addition, the integrated supply and trading function undertakes derivative activity for risk management purposes under a separate control frameworkas described more fully below.
(a) Market riskMarket risk is the risk or uncertainty arising from possible market price movements and their impact on the future performance of a business. Themarket price movements that the group is exposed to include oil, natural gas and power prices (commodity price risk), foreign currency exchangerates, interest rates, equity prices and other indices that could adversely affect the value of the group’s financial assets, liabilities or expected futurecash flows. The group enters into derivatives in a well established entrepreneurial trading operation. In addition, the group has developed a controlframework aimed at managing the volatility inherent in certain of its natural business exposures. In accordance with this control framework the groupenters into various transactions using derivatives for risk management purposes.
The group measures market risk exposure arising from its trading positions using value-at-risk techniques. These techniques are based on avariance/covariance model or a Monte Carlo simulation and make a statistical assessment of the market risk arising from possible future changes inmarket prices over a 24-hour period. The calculation of the range of potential changes in fair value takes into account a snapshot of the end-of-dayexposures and the history of one-day price movements, together with the correlation of these price movements. The value-at-risk measure issupplemented by stress testing and tail risk analysis.
The trading value-at-risk model is used for derivative financial instrument types such as: interest rate forward and futures contracts, swapagreements, options and swaptions; foreign exchange forward and futures contracts, swap agreements and options; and oil, natural gas and powerprice forwards, futures, swap agreements and options. Additionally, where physical commodities or non-derivative forward contracts are held as part ofa trading position, they are also reflected in the value-at-risk model. For options, a linear approximation is included in the value-at-risk models when fullrevaluation is not possible.
The value-at-risk table does not incorporate any of the group’s natural business exposures or any derivatives entered into to risk manage thoseexposures. Market risk exposure in respect of embedded derivatives is also not included in the value-at-risk table. Instead separate sensitivity analysesare disclosed below.
Value-at-risk limits are in place for each trading activity and for the group’s trading activity in total. The board has delegated an overall limit of$100 million value at risk in support of this trading activity. The high and low values at risk indicated in the table below for each type of activity areindependent of each other. Through the portfolio effect the high value at risk for the group as a whole is lower than the sum of the highs for theconstituent parts. The potential movement in fair values is expressed to a 95% confidence interval. This means that, in statistical terms, one wouldexpect to see a decrease in fair values greater than the trading value at risk on one occasion per month if the portfolio were left unchanged.
$ million
Value at risk for 1 day at 95% confidence interval 2009 2008
High Low Average Year end High Low Average Year end
Group trading 79 24 45 30 76 20 37 69Oil price trading 75 9 29 12 69 12 25 63Natural gas price trading 70 15 33 31 50 12 24 23Power price trading 14 3 5 5 14 3 7 4Currency trading 4 – 2 2 4 – 2Interest rate trading 7 – 3 3 7 – 2Other trading 4 1 2 3 5 1 2
The major components of market risk are commodity price risk, foreign currency exchange risk, interest rate risk and equity price risk, each of which isdiscussed below.
(i) Commodity price riskThe group’s integrated supply and trading function uses conventional financial and commodity instruments and physical cargoes available in the relatedcommodity markets. Oil and natural gas swaps, options and futures are used to mitigate price risk. Power trading is undertaken using a combination ofover-the-counter forward contracts and other derivative contracts, including options and futures. This activity is on both a standalone basis and inconjunction with gas derivatives in relation to gas-generated power margin. In addition, NGLs are traded around certain US inventory locations usingover-the-counter forward contracts in conjunction with over-the-counter swaps, options and physical inventories. Trading value-at-risk information inrelation to these activities is shown in the table above.
As described above, the group also carries out risk management of certain natural business exposures using over-the-counter swaps andexchange futures contracts. Together with certain physical supply contracts that are classified as derivatives, these contracts fall outside of the value-at-risk framework. For these derivative contracts the sensitivity of the net fair value to an immediate 10% increase or decrease in all reference priceswould have been $73 million at 31 December 2009 (2008 $90 million). This figure does not include any corresponding economic benefit or disbenefitthat would arise from the natural business exposure which would be expected to offset the gain or loss on the over-the-counter swaps and exchangefutures contracts mentioned above.
In addition, the group has embedded derivatives relating to certain natural gas contracts. The net fair value of these contracts was a liability of$1,331 million at 31 December 2009 (2008 liability of $1,867 million). Key information on the natural gas contracts is given below.
At 31 December 2009 2008
Remaining contract terms 9 months to 8 years 9 months 1 year 9 months to 9 years 9 monthsContractual/notional amount 2,460 million therms 3,585 million thermsDiscount rate – nominal risk free 4.0% 2.5%

144
Notes on financial statements
BOL08439_p142 169.qxp:20 F 5/3/10 17:33 Page 144 Bleed: 0�mm Scale: 100%
24. Financial instruments and financial risk factors continuedFor these embedded derivatives the sensitivity of the net fair value to an immediate 10% favourable or adverse change in the key assumptions is as follows.
$ million
At 31 December 2009 2008
Discount DiscountGas price Oil price Power price rate Gas price Oil price Power price rate
Favourable 10% change 175 26 23 20 291 81 27 16Unfavourable 10% change (215) (43) (19) (20) (289) (81) (27) (16)
The sensitivities for risk management activity and embedded derivatives are hypothetical and should not be considered to be predictive of futureperformance. In addition, for the purposes of this analysis, in the above table, the effect of a variation in a particular assumption on the fair value of theembedded derivatives is calculated independently of any change in another assumption. In reality, changes in one factor may contribute to changes inanother, which may magnify or counteract the sensitivities. Furthermore, the estimated fair values as disclosed should not be considered indicative offuture earnings on these contracts.
(ii) Foreign currency exchange riskWhere the group enters into foreign currency exchange contracts for entrepreneurial trading purposes the activity is controlled using trading value-at-risktechniques as explained above. This activity is described as currency trading in the value at risk table above.
Since BP has global operations, fluctuations in foreign currency exchange rates can have significant effects on the group’s reported results.The effects of most exchange rate fluctuations are absorbed in business operating results through changing cost competitiveness, lags in marketadjustment to movements in rates and conversion differences accounted for on specific transactions. For this reason, the total effect of exchangerate fluctuations is not identifiable separately in the group’s reported results. The main underlying economic currency of the group’s cash flows isthe US dollar. This is because BP’s major product, oil, is priced internationally in US dollars. BP’s foreign currency exchange management policy isto minimize economic and material transactional exposures arising from currency movements against the US dollar. The group co-ordinates thehandling of foreign currency exchange risks centrally, by netting off naturally-occurring opposite exposures wherever possible, and then dealingwith any material residual foreign currency exchange risks.
The group manages these exposures by constantly reviewing the foreign currency economic value at risk and managing such risk to keep the12-month foreign currency value at risk below $200 million. At 31 December 2009, the foreign currency value at risk was $140 million (2008 $70 million). At no point over the past three years did the value at risk exceed the maximum risk limit. The most significant exposures relate to capitalexpenditure commitments and other UK and European operational requirements, for which a hedging programme is in place and hedge accounting isclaimed as outlined in Note 31.
For highly probable forecast capital expenditures the group locks in the US dollar cost of non-US dollar supplies by using currencyforwards and futures. The main exposures are sterling, Canadian dollar, euro, Norwegian krone, Australian dollar, Korean won, and at 31December 2009 open contracts were in place for $800 million sterling, $491 million Canadian dollar, $299 million euro, $240 million Norwegiankrone, $215 million Australian dollar, $51 million Korean won and $41 million Singapore dollar capital expenditures maturing within six years, with over 65% of the deals maturing within two years (2008 $949 million sterling, $712 million Canadian dollar, $553 million euro, $392million Norwegian krone, $303 million Australian dollar and $187 million Korean won capital expenditures maturing within seven years with over65% of the deals maturing within two years).
For other UK, European, Canadian and Australian operational requirements the group uses cylinders and currency forwards to hedgethe estimated exposures on a 12-month rolling basis. At 31 December 2009, the open positions relating to cylinders consisted of receivesterling, pay US dollar, purchased call and sold put options (cylinders) for $1,887 million (2008 $1,660 million); receive euro, pay US dollarcylinders for $1,716 million (2008 $1,612 million); receive Canadian dollar, pay US dollar cylinders for $300 million (2008 $250 million); andreceive Australian dollar, pay US dollar cylinders for $297 million (2008 $455 million). At 31 December 2009 there were no open positionsrelating to currency forwards (2008 buy sterling, sell US dollar currency forwards for $816 million; buy euro, sell US dollar currency forwardsfor $141 million; buy Canadian dollar, sell US dollar, currency forwards for $50 million; and buy Australian dollar, sell US dollar currencyforwards for $90 million).
In addition, most of the group’s borrowings are in US dollars or are hedged with respect to the US dollar. At 31 December 2009, the totalforeign currency net borrowings not swapped into US dollars amounted to $465 million (2008 $1,037 million). Of this total, $113 million wasdenominated in currencies other than the functional currency of the individual operating unit being entirely Canadian dollars (2008 $92 million, beingentirely Canadian dollars). It is estimated that a 10% change in the corresponding exchange rates would result in an exchange gain or loss in theincome statement of $11 million (2008 $9 million).
(iii) Interest rate riskWhere the group enters into money market contracts for entrepreneurial trading purposes the activity is controlled using value-at-risk techniques asdescribed above. This activity is described as interest rate trading in the value-at-risk table above.
BP is also exposed to interest rate risk from the possibility that changes in interest rates will affect future cash flows or the fair values of itsfinancial instruments, principally finance debt.
While the group issues debt in a variety of currencies based on market opportunities, it uses derivatives to swap the debt to a US dollarfloating rate exposure but in certain defined circumstances maintains a fixed rate exposure for a proportion of debt. The proportion of floatingrate debt net of interest rate swaps at 31 December 2009 was 63% of total finance debt outstanding (2008 72%). The weighted averageinterest rate on finance debt at 31 December 2009 is 2% (2008 3%) and the weighted average maturity of fixed rate debt is four years (2008 three years).

145
Notes on financial statements
Fin
an
cia
l sta
tem
en
ts
BOL08439_p142 169.qxp:20 F 5/3/10 17:33 Page 145 Bleed: 0�mm Scale: 100%
24. Financial instruments and financial risk factors continuedThe group’s earnings are sensitive to changes in interest rates on the floating rate element of the group’s finance debt. If the interest ratesapplicable to floating rate instruments were to have increased by 1% on 1 January 2010, it is estimated that the group’s profit before taxation for2010 would decrease by approximately $219 million (2008 $239 million decrease in 2009). This assumes that the amount and mix of fixed andfloating rate debt, including finance leases, remains unchanged from that in place at 31 December 2009 and that the change in interest rates iseffective from the beginning of the year. Where the interest rate applicable to an instrument is reset during a quarter it is assumed that this occursat the beginning of the quarter and remains unchanged for the rest of the year. In reality, the fixed/floating rate mix will fluctuate over the year andinterest rates will change continually. Furthermore, the effect on earnings shown by this analysis does not consider the effect of any other changesin general economic activity that may accompany such an increase in interest rates.
(iv) Equity price riskThe group holds equity investments, typically made for strategic purposes, that are classified as non-current available-for-sale financial assets andare measured initially at fair value with changes in fair value recognized in other comprehensive income. Accumulated fair value changes are recycledto the income statement on disposal, or when the investment is impaired. No impairment losses have been recognized in 2009 (2008 $546 millionand 2007 nil) relating to listed non-current available-for-sale investments. For further information see Note 25.
At 31 December 2009, it is estimated that an increase of 10% in quoted equity prices would result in an immediate credit to othercomprehensive income of $130 million (2008 $59 million credit to other comprehensive income), whilst a decrease of 10% in quoted equity priceswould result in an immediate charge to other comprehensive income of $130 million (2008 $48 million charge to profit or loss and $11 million chargeto other comprehensive income).
At 31 December 2009, 73% (2008 56%) of the carrying amount of non-current available-for-sale financial assets represented the group’s stakein Rosneft, thus the group’s exposure is concentrated on changes in the share price of this equity in particular.
(b) Credit riskCredit risk is the risk that a customer or counterparty to a financial instrument will fail to perform or fail to pay amounts due causing financial loss to thegroup and arises from cash and cash equivalents, derivative financial instruments and deposits with financial institutions and principally from creditexposures to customers relating to outstanding receivables.
The group has a credit policy, approved by the CFO, that is designed to ensure that consistent processes are in place throughout thegroup to measure and control credit risk. Credit risk is considered as part of the risk-reward balance of doing business. On entering into anybusiness contract the extent to which the arrangement exposes the group to credit risk is considered. Key requirements of the policy areformal delegated authorities to the sales and marketing teams to incur credit risk and to a specialized credit function to set counterpartylimits; the establishment of credit systems and processes to ensure that counterparties are rated and limits set; and systems to monitorexposure against limits and report regularly on those exposures, and immediately on any excesses, and to track and report credit losses. The treasury function provides a similar credit risk management activity with respect to group-wide exposures to banks and other financial institutions.
In the current economic environment the group has placed increased emphasis on the management of credit risk. Policies and procedureswere reviewed in 2008 and credit exposures arising from physical commodity and derivative transactions with banks and other counterparties havebeen reduced in 2008 and 2009, mainly through netting and collateral arrangements.
Before trading with a new counterparty can start, its creditworthiness is assessed and a credit rating is allocated that indicates theprobability of default, along with a credit exposure limit. The assessment process takes into account all available qualitative and quantitativeinformation about the counterparty and the group, if any, to which the counterparty belongs. The counterparty’s business activities, financialresources and business risk management processes are taken into account in the assessment, to the extent that this information is publiclyavailable or otherwise disclosed to BP by the counterparty, together with external credit ratings, if any, including ratings prepared by Moody’sInvestor Service and Standard & Poor’s. Creditworthiness continues to be evaluated after transactions have been initiated and a watchlist ofhigher-risk counterparties is maintained.
The group does not aim to remove credit risk but expects to experience a certain level of credit losses. The group attempts to mitigatecredit risk by entering into contracts that permit netting and allow for termination of the contract on the occurrence of certain events ofdefault. Depending on the creditworthiness of the counterparty, the group may require collateral or other credit enhancements such as cashdeposits or letters of credit and parent company guarantees. Trade receivables and payables, and derivative assets and liabilities, arepresented on a net basis where unconditional netting arrangements are in place with counterparties and where there is an intent to settleamounts due on a net basis. The maximum credit exposure associated with financial assets is equal to the carrying amount. At 31 December2009, the maximum credit exposure was $49,575 million (2008 $52,413 million). Collateral received and recognized in the balance sheet atthe year-end was $549 million (2008 $1,121 million) and collateral held off balance sheet was $48 million (2008 $203 million). Credit exposureexists in relation to guarantees issued by group companies under which amounts outstanding at 31 December 2009 were $319 million (2008$223 million) in respect of liabilities of jointly controlled entities and associates and $667 million (2008 $613 million) in respect of liabilities ofother third parties.
Notwithstanding the processes described above, significant unexpected credit losses can occasionally occur. Exposure to unexpected lossesincreases with concentrations of credit risk that exist when a number of counterparties are involved in similar activities or operate in the sameindustry sector or geographical area, which may result in their ability to meet contractual obligations being impacted by changes in economic,political or other conditions. The group’s principal customers, suppliers and financial institutions with which it conducts business are locatedthroughout the world. In addition, these risks are managed by maintaining a group watchlist and aggregating multi-segment exposures to ensurethat a material credit risk is not missed.
Reports are regularly prepared and presented to the GFRC that cover the group’s overall credit exposure and expected loss trends, exposure bysegment, and overall quality of the portfolio. The reports also include details of the largest counterparties by exposure level and expected loss, anddetails of counterparties on the group watchlist.

146
Notes on financial statements
BOL08439_p142 169.qxp:20 F 5/3/10 17:33 Page 146 Bleed: 0�mm Scale: 100%
24. Financial instruments and financial risk factors continuedSome mitigation of credit exposure is achieved by: netting arrangements; credit support agreements which require the counterparty to providecollateral or other credit risk mitigation; and credit insurance and other risk transfer instruments.
For the contracts comprising derivative financial instruments in an asset position at 31 December 2009, it is estimated that over 80% (2008over 80%) of the unmitigated credit exposure is to counterparties of investment grade credit quality.
Trade and other receivables of the group are analysed in the table below. By comparing the BP credit ratings to the equivalent external creditratings, it is estimated that approximately 55-60% (2008 approximately 60-65%) of the unmitigated trade receivables portfolio exposure is ofinvestment grade credit quality. With respect to the trade and other receivables that are neither impaired nor past due, there are no indications as ofthe reporting date that the debtors will not meet their payment obligations.
The group does not typically renegotiate the terms of trade receivables; however, if a renegotiation does take place, the outstanding balance isincluded in the analysis based on the original payment terms. There were no significant renegotiated balances outstanding at 31 December 2009 or31 December 2008.
$ million
Trade and other receivables at 31 December 2009 2008
Neither impaired nor past due 29,426 25,838 Impaired (net of valuation allowance) 91 73 Not impaired and past due in the following periods
within 30 days 808 1,323 31 to 60 days 151 489 61 to 90 days 76 596 over 90 days 464 1,170
31,016 29,489
The movement in the valuation allowance for trade receivables is set out below.
$ million
Trade and other receivables at 31 December 2009 2008
At 1 January 391 406 Exchange adjustments 12 (32)Charge for the year 157 191 Utilization (130) (174)At 31 December 430 391
(c) Liquidity riskLiquidity risk is the risk that suitable sources of funding for the group’s business activities may not be available. The group’s liquidity is managedcentrally with operating units forecasting their cash and currency requirements to the central treasury function. Unless restricted by local regulations,subsidiaries pool their cash surpluses to treasury, which will then arrange to fund other subsidiaries’ requirements, or invest any net surplus in themarket or arrange for necessary external borrowings, while managing the group’s overall net currency positions.
In managing its liquidity risk, the group has access to a wide range of funding at competitive rates through capital markets and banks. Thegroup’s treasury function centrally co-ordinates relationships with banks, borrowing requirements, foreign exchange requirements and cashmanagement. The group believes it has access to sufficient funding through the commercial paper markets and by using undrawn committedborrowing facilities to meet foreseeable borrowing requirements. At 31 December 2009, the group had substantial amounts of undrawn borrowingfacilities available, including committed facilities of $4,950 million, of which $4,550 million are in place through to the fourth quarter of 2011,unchanged from the position as at 31 December 2008. These facilities are with a number of international banks and borrowings under them wouldbe at pre-agreed rates.
The group has in place a European Debt Issuance Programme (DIP) under which the group may raise $20 billion of debt for maturities of onemonth or longer. At 31 December 2009, the amount drawn down against the DIP was $11,403 million (2008 $10,334 million). In addition, the grouphas in place an unlimited US Shelf Registration under which it may raise debt with maturities of one month or longer.
The group has long-term debt ratings of Aa1 (stable outlook) and AA (stable outlook), assigned respectively by Moody’s and Standard andPoor’s, unchanged from 2008.
Despite recent increased uncertainty in the financial markets, including a lack of liquidity for some borrowers, we have been able to issue$11 billion of long-term debt during 2009 and issue short-term commercial paper at competitive rates, as and when required. As an additionalprecautionary measure, we have increased and maintained the cash and cash equivalents held by the group to $8.3 billion at the end of 2009 and$8.2 billion at the end of 2008, compared with $3.6 billion at the end of 2007.
The amounts shown for finance debt in the table below include expected interest payments on borrowings and the future minimum leasepayments with respect to finance leases.

147
Notes on financial statements
Fin
an
cia
l sta
tem
en
ts
BOL08439_p142 169.qxp:20 F 5/3/10 17:33 Page 147 Bleed: 0�mm Scale: 100%
24. Financial instruments and financial risk factors continuedThere are amounts included within finance debt that we show in the table below as due within one year to reflect the earliest contractualrepayment dates but that are expected to be repaid over the maximum long-term maturity profiles of the contracts as described in Note 32. USIndustrial Revenue/Municipal Bonds of $2,895 million (2008 $3,166 million) with earliest contractual repayment dates within one year haveexpected repayment dates ranging from 1 to 33 years (2008 1 to 40 years). The bondholders typically have the option to tender thesebonds for repayment on interest reset dates; however, any bonds that are tendered are usually remarketed and BP has not experienced anysignificant repurchases. BP considers these bonds to represent long-term funding when internally assessing the maturity profile of its financedebt. Similar treatment is applied for loans associated with long-term gas supply contracts totalling $1,622 million (2008 $1,806 million) thatmature within eight years.
The table also shows the timing of cash outflows relating to trade and other payables and accruals.
$ million
2009 2008
Trade and Trade andother Finance other Finance
payables Accruals debt payables Accruals debt
Within one year 31,413 6,202 9,790 30,598 6,743 16,6701 to 2 years 1,059 231 6,861 402 359 5,9342 to 3 years 1,089 106 5,359 898 77 3,4193 to 4 years 566 78 5,528 902 72 2,6474 to 5 years 67 49 3,151 223 67 5,0725 to 10 years 85 163 5,723 53 164 1,316Over 10 years 46 76 1,150 64 45 1,050
34,325 6,905 37,562 33,140 7,527 36,108
The group manages liquidity risk associated with derivative contracts, other than derivative hedging instruments, based on the expected maturities ofboth derivative assets and liabilities as indicated in Note 31. Management does not currently anticipate any cash flows that could be of a significantlydifferent amount, or could occur earlier than the expected maturity analysis provided.
The table below shows cash outflows for derivative hedging instruments based upon contractual payment dates. The amounts reflect thematurity profile of the fair value liability where the instruments will be settled net, and the gross settlement amount where the pay leg of aderivative will be settled separately from the receive leg, as in the case of cross-currency interest rate swaps hedging non-US dollar finance debt.The swaps are with high investment-grade counterparties and therefore the settlement day risk exposure is considered to be negligible. Not shownin the table are the gross settlement amounts for the receive leg of derivatives that are settled separately from the pay leg, which amount to $7,999million at 31 December 2009 (2008 $8,545 million) to be received on the same day as the related cash outflows.
$ million
2009 2008
Within one year 2,826 3,4261 to 2 years 1,395 3,0242 to 3 years 1,669 1,0373 to 4 years 1,349 1,7314 to 5 years 1,104 1,3895 to 10 years 322 129
8,665 10,736
The group has issued third-party guarantees, as described above under credit risk. These amounts represent the maximum exposure of the group,substantially all of which could be called within one year.

148
Notes on financial statements
25. Other investments$ million
2009 2008
Listed 1,296 592Unlisted 271 263
1,567 855
Other investments comprise equity investments that have no fixed maturity date or coupon rate. These investments are classified as available-for-sale financial assets and as such are recorded at fair value with the gain or loss arising as a result of changes in fair value recorded directly in equity.Accumulated fair value changes are recycled to the income statement on disposal, or when the investment is impaired.
The fair value of listed investments has been determined by reference to quoted market bid prices and as such are in level 1 of the fair valuehierarchy. Unlisted investments are stated at cost less accumulated impairment losses and are in level 3 of the fair value hierarchy.
The most significant investment is the group’s stake in Rosneft which had a fair value of $1,138 million at 31 December 2009 (2008$483 million). The fair value gain arising on revaluation of this investment during 2009 has been recorded within other comprehensive income.In 2008, an impairment loss of $517 million was recognized in the income statement relating to the Rosneft investment (see Note 3). In 2009,impairment losses were incurred of $13 million (2008 $17 million) relating to unlisted investments and nil (2008 $29 million) relating to otherlisted investments.
26. Inventories$ million
2009 2008
Crude oil 6,237 4,396Natural gas 105 107Refined petroleum and petrochemical products 12,337 9,318
18,679 13,821Supplies 1,661 1,588
20,340 15,409Trading inventories 2,265 1,412
22,605 16,821Cost of inventories expensed in the income statement 163,772 266,982
The inventory valuation at 31 December 2009 is stated net of a provision of $46 million (2008 $1,412 million) to write inventories down to their netrealizable value. The net movement in the year in respect of inventory net realizable value provisions was $1,366 million credit (2008 $1,295 million charge).
27. Trade and other receivables
BOL08439_p142 169.qxp:20 F 5/3/10 17:33 Page 148 Bleed: 0�mm Scale: 100%
$ million
2009 2008
Current Non-current Current Non-current
Financial assetsTrade receivables 22,604 – 22,869 –Amounts receivable from jointly controlled entities 1,317 11 1,035 –Amounts receivable from associates 417 298 219 –Other receivables 4,949 1,420 4,656 710
29,287 1,729 28,779 710Non-financial assets
Other receivables 244 – 482 –29,531 1,729 29,261 710
Trade and other receivables are predominantly non-interest bearing. See Note 24 for further information.

149
28. Cash and cash equivalents$ million
2009 2008
Cash at bank and in hand 3,359 3,442Term bank deposits 3,211 2,167Other cash equivalents 1,769 2,588
8,339 8,197
Cash and cash equivalents comprise cash in hand; current balances with banks and similar institutions; term deposits of three months or less withbanks and similar institutions; and short-term highly liquid investments that are readily convertible to known amounts of cash, are subject toinsignificant risk of changes in value and have a maturity of three months or less from the date of acquisition. The carrying amounts of cash at bank andin hand and term bank deposits approximate their fair values. Substantially all of the other cash equivalents are categorized within level 1 of the fairvalue hierarchy.
Cash and cash equivalents at 31 December 2009 includes $1,095 million (2008 $2,133 million) that is restricted. This relates principally toamounts required to cover initial margins on trading exchanges.
See Note 24 for further information.
29. Valuation and qualifying accounts$ million
2009 2008 2007Doubtful Fixed assets – Doubtful Fixed assets – Doubtful Fixed assets –
debts investments debts investments debts investments
At 1 January 391 935 406 146 421 151 Charged to costs and expenses 157 66 191 647 175 158Charged to other accountsa 12 6 (32) 143 34 2 Deductions (130) (658) (174) (1) (224) (165) At 31 December 430 349 391 935 406 146
aPrincipally exchange adjustments.
Valuation and qualifying accounts are deducted in the balance sheet from the assets to which they apply.
30. Trade and other payables
Notes on financial statements
Fin
an
cia
l sta
tem
en
ts
BOL08439_p142 169.qxp:20 F 5/3/10 17:33 Page 149 Bleed: 0�mm Scale: 100%
$ million
2009 2008
Current Non-current Current Non-current
Financial liabilitiesTrade payables 22,886 – 20,129 –Amounts payable to jointly controlled entities 304 2,419 292 2,255Amounts payable to associates 692 298 295 –Other payables 7,531 195 9,882 287
31,413 2,912 30,598 2,542Non-financial liabilities
Production and similar taxes 757 286 445 538Other payables 3,034 – 2,601 –
3,791 286 3,046 53835,204 3,198 33,644 3,080
Trade and other payables are predominantly interest free. See Note 24 for further information.

150
Notes on financial statements
47
BOL08439_p142 169.qxp:20 F 5/3/10 17:33 Page 150 Bleed: 0�mm Scale: 100%
31. Derivative financial instrumentsAn outline of the group’s financial risks and the objectives and policies pursued in relation to those risks is set out in Note 24.
In the normal course of business the group enters into derivative financial instruments (derivatives) to manage its normal business exposures inrelation to commodity prices, foreign currency exchange rates and interest rates, including management of the balance between floating rate and fixedrate debt, consistent with risk management policies and objectives. Additionally, the group has a well-established entrepreneurial trading operation thatis undertaken in conjunction with these activities using a similar range of contracts.
IAS 39 prescribes strict criteria for hedge accounting, whether as a cash flow or fair value hedge or a hedge of a net investment in a foreignoperation, and requires that any derivative that does not meet these criteria should be classified as held for trading and fair valued, with gains andlosses recognized in the income statement.
The fair values of derivative financial instruments at 31 December are set out below.
$ million
2009 2008
Fair Fair Fair Fairvalue value value valueasset liability asset liability
Derivatives held for tradingCurrency derivatives 318 (226) 278 (273)Oil price derivatives 1,140 (1,191) 3,813 (3,523)Natural gas price derivatives 5,636 (3,960) 6,945 (6,113)Power price derivatives 682 (497) 978 (904)Other derivatives 47 (47) 90 (96)
7,823 (5,921) 12,104 (10,909)
Embedded derivative commodity contracts 137 (1,468) 397 (2,264)
Cash flow hedgesCurrency forwards, futures and cylinders 182 (114) 120 (1,175)Cross-currency interest rate swaps 44 (298) 109 (558)
226 (412) 229 (1,733)
Fair value hedgesCurrency forwards, futures and swaps 490 (232) 465 (342)Interest rate swaps 256 (122) 367 –
746 (354) 832 (342)Hedges of net investments in foreign operations – – 2 –
8,932 (8,155) 13,564 (15,248)Of which – current 4,967 (4,681) 8,510 (8,977)
– non-current 3,965 (3,474) 5,054 (6,271)
Derivatives held for trading
The group maintains active trading positions in a variety of derivatives. The contracts may be entered into for risk management purposes, to satisfysupply requirements or for entrepreneurial trading. Certain contracts are classified as held for trading, regardless of their original business objective,and are recognized at fair value with changes in fair value recognized in the income statement. Trading activities are undertaken by using a range ofcontract types in combination to create incremental gains by arbitraging prices between markets, locations and time periods. The net of theseexposures is monitored using market value-at-risk techniques as described in Note 24.
The following tables show further information on the fair value of derivatives and other financial instruments held for trading purposes. Derivative assets held for trading have the following fair values and maturities.
$ million
2009
Less than Over
1 year 1-2 years 2-3 years 3-4 years 4-5 years 5 years Total
Currency derivatives 162 83 33 22 16 2 318
Oil price derivatives 814 136 69 59 44 18 1,140
Natural gas price derivatives 2,958 1,059 582 354 186 497 5,636
Power price derivatives 496 139 32 12 3 – 682
Other derivatives 47 – – – – –
4,477 1,417 716 447 249 517 7,823

151
Notes on financial statements
Fin
an
cia
l sta
tem
en
ts
BOL08439_p142 169.qxp:20 F 5/3/10 17:33 Page 151 Bleed: 0�mm Scale: 100%
31. Derivative financial instruments continued
$ million
2008
Less than Over1 year 1-2 years 2-3 years 3-4 years 4-5 years 5 years Total
Currency derivatives 53 90 67 37 20 11 278Oil price derivatives 3,368 353 61 11 11 9 3,813 Natural gas price derivatives 3,940 1,090 545 436 271 663 6,945 Power price derivatives 688 256 31 1 2 – 978 Other derivatives 90 – – – – – 90
8,139 1,789 704 485 304 683 12,104
Derivative liabilities held for trading have the following fair values and maturities.
$ million
2009
Less than Over
1 year 1-2 years 2-3 years 3-4 years 4-5 years 5 years Total
Currency derivatives (110) (58) (20) (32) (4) (2) (226)
Oil price derivatives (1,083) (67) (29) (11) (1) – (1,191)
Natural gas price derivatives (2,381) (607) (248) (222) (78) (424) (3,960)
Power price derivatives (335) (109) (39) (11) (3) – (497)
Other derivatives (47) – – – – – (47)
(3,956) (841) (336) (276) (86) (426) (5,921)
$ million
2008
Less than Over1 year 1-2 years 2-3 years 3-4 years 4-5 years 5 years Total
Currency derivatives (257) – (2) (1) (13) – (273)Oil price derivatives (3,001) (458) (36) (18) (9) (1) (3,523)Natural gas price derivatives (3,484) (987) (438) (310) (283) (611) (6,113)Power price derivatives (722) (159) (18) (4) (1) – (904)Other derivatives (95) (1) – – – – (96)
(7,559) (1,605) (494) (333) (306) (612) (10,909)
If at inception of a contract the valuation cannot be supported by observable market data, any gain or loss determined by the valuation methodology is notrecognized in the income statement but is deferred on the balance sheet and is commonly known as ‘day-one profit or loss’. This deferred gain or loss isrecognized in the income statement over the life of the contract until substantially all of the remaining contract term can be valued using observable marketdata at which point any remaining deferred gain or loss is recognized in the income statement. Changes in valuation from this initial valuation arerecognized immediately through the income statement.
The following table shows the changes in the day-one profits and losses deferred on the balance sheet.
$ million
2009 2008
Natural NaturalOil price gas price Oil price gas price
Fair value of contracts not recognized through the income statement at 1 January 32 83 – 36 Fair value of new contracts at inception not recognized in the income statement – (14) 66 49Fair value recognized in the income statement (11) (36) (34) (2)Fair value of contracts not recognized through the income statement at 31 December 21 33 32 83

152
Notes on financial statements
BOL08439_p142 169.qxp:20 F 5/3/10 17:33 Page 152 Bleed: 0�mm Scale: 100%
31. Derivative financial instruments continuedThe following table shows the fair value of derivative assets and derivative liabilities held for trading, analysed by maturity period and bymethodology of fair value estimation.
IFRS 7 ‘Financial Instruments: Disclosures’ sets out a fair value hierarchy which consists of three levels that describe the methodology ofestimation as follows:– Level 1 – using quoted prices in active markets for identical assets or liabilities.– Level 2 – using inputs for the asset or liability, other than quoted prices, that are observable either directly (i.e. as prices) or indirectly (i.e. derived
from prices).– Level 3 – using inputs for the asset or liability that are not based on observable market data such as prices based on internal models or other
valuation methods.This information is presented on a gross basis, that is, before netting by counterparty.
$ million
2009
Less than Over
1 year 1-2 years 2-3 years 3-4 years 4-5 years 5 years Total
Fair value of derivative assetsLevel 1 163 76 23 17 10 1 290
Level 2 9,544 2,182 915 357 146 – 13,144
Level 3 264 188 162 148 128 527 1,417
9,971 2,446 1,100 522 284 528 14,851
Less: netting by counterparty (5,494) (1,029) (384) (75) (35) (11) (7,028)
4,477 1,417 716 447 249 517 7,823
Fair value of derivative liabilitiesLevel 1 (95) (39) (14) (24) – (1) (173)
Level 2 (9,086) (1,681) (597) (234) (47) – (11,645)
Level 3 (269) (150) (109) (93) (74) (436) (1,131)
(9,450) (1,870) (720) (351) (121) (437) (12,949)
Less: netting by counterparty 5,494 1,029 384 75 35 11 7,028
(3,956) (841) (336) (276) (86) (426) (5,921)
Net fair value 521 576 380 171 163 91 1,902
$ million
2008
Less than Over1 year 1-2 years 2-3 years 3-4 years 4-5 years 5 years Total
Fair value of derivative assetsLevel 1 40 43 30 7 6 2 128Level 2 19,737 3,477 871 508 225 56 24,874Level 3 687 196 148 140 137 672 1,980
20,464 3,716 1,049 655 368 730 26,982Less: netting by counterparty (12,325) (1,927) (345) (170) (64) (47) (14,878)
8,139 1,789 704 485 304 683 12,104Fair value of derivative liabilities
Level 1 (227) – (2) – (13) – (242)Level 2 (19,106) (3,345) (683) (356) (217) (27) (23,734)Level 3 (551) (187) (154) (147) (140) (632) (1,811)
(19,884) (3,532) (839) (503) (370) (659) (25,787)Less: netting by counterparty 12,325 1,927 345 170 64 47 14,878
(7,559) (1,605) (494) (333) (306) (612) (10,909)Net fair value 580 184 210 152 (2) 71 1,195

153
1
Notes on financial statements
Fin
an
cia
l sta
tem
en
ts
BOL08439_p142 169.qxp:20 F 5/3/10 17:33 Page 153 Bleed: 0�mm Scale: 100%
31. Derivative financial instruments continuedThe following table shows the changes during the year in the net fair value of derivatives held for trading purposes within level 3 of the fair valuehierarchy.
$ million
Oil Natural gas Power
Currency price price price Other Total
Net fair value of contracts at 1 January 2009 3 149 17 – – 169
Gains (losses) recognized in the income statement (1) 205 91 – (1) 294
Settlements – (91) (5) – – (96)
Purchases – – – 1 –
Sales – – – (2) 1 (1)
Transfers out of level 3 (2) (50) (4) – – (56)
Transfers in to level 3 – 2 (25) – – (23)
Exchange adjustments – – (2) – – (2)
Net fair value of contracts at 31 December 2009 – 215 72 (1) – 286
$ million
Oil Natural gas PowerCurrency price price price Other Total
Net fair value of contracts at 1 January 2008 (17) 1 (67) (1) – (84)Gains recognized in the income statement 8 148 160 – – 316 Settlements – 18 3 1 – 22Transfers out of level 3 12 (25) (79) – – (92)Transfers in to level 3 – 7 3 – – 10 Exchange adjustments – – (3) – – (3)Net fair value of contracts at 31 December 2008 3 149 17 – – 169
The amount recognized in the income statement for the year relating to level 3 derivatives still held at 31 December 2009 was a $278 million gain(2008 $199 million gain relating to derivatives still held at 31 December 2008).
Gains and losses relating to derivative contracts are included either within sales and other operating revenues or within purchases in the incomestatement depending upon the nature of the activity and type of contract involved. The contract types treated in this way include futures, options, swapsand certain forward sales and forward purchases contracts. Gains or losses arise on contracts entered into for risk management purposes, optimizationactivity and entrepreneurial trading. They also arise on certain contracts that are for normal procurement or sales activity for the group but that arerequired to be fair valued under accounting standards. Also included within sales and other operating revenues are gains and losses on inventory held fortrading purposes. The total amount relating to all of these items was a net gain of $3,735 million (2008 $6,721 million net gain and 2007 $376 million netgain).
Embedded derivatives
Prior to the development of an active gas trading market, UK gas contracts were priced using a basket of available price indices, primarily relating to oilproducts, power and inflation. After the development of an active UK gas market, certain contracts were entered into or renegotiated using pricingformulae not directly related to gas prices, for example, oil product and power prices. In these circumstances, pricing formulae have been determinedto be derivatives, embedded within the overall contractual arrangements that are not clearly and closely related to the underlying commodity. Theresulting fair value relating to these contracts is recognized on the balance sheet with gains or losses recognized in the income statement.
All the embedded derivatives are valued using inputs that include price curves for each of the different products that are built up from activemarket pricing data. Where necessary, these are extrapolated to the expiry of the contracts (the last of which is in 2018) using all available externalpricing information. Additionally, where limited data exists for certain products, prices are interpolated using historic and long-term pricing relationships.
Embedded derivative assets have the following fair values and maturities.
$ million
2009
Less than Over
1 year 1-2 years 2-3 years 3-4 years 4-5 years 5 years Total
Commodity price embedded derivatives 134 – – – – 3 137
$ million
2008
Less than Over1 year 1-2 years 2-3 years 3-4 years 4-5 years 5 years Total
Commodity price embedded derivatives 50 116 75 45 36 75 397

154
Notes on financial statements
–
–
–
–
–
–
BOL08439_p142 169.qxp:20 F 5/3/10 17:33 Page 154 Bleed: 0�mm Scale: 100%
31. Derivative financial instruments continuedEmbedded derivative liabilities have the following fair values and maturities.
$ million
2009
Less than Over
1 year 1-2 years 2-3 years 3-4 years 4-5 years 5 years Total
Commodity price embedded derivatives (154) (236) (231) (227) (232) (388) (1,468)
$ million
2008
Less than Over1 year 1-2 years 2-3 years 3-4 years 4-5 years 5 years Total
Commodity price embedded derivatives (404) (322) (365) (303) (271) (599) (2,264)
The following table shows the fair value of embedded derivative assets and liabilities analysed by maturity period and by methodology of fair valueestimation.
$ million
2009
Less than Over
1 year 1-2 years 2-3 years 3-4 years 4-5 years 5 years Total
Fair value of embedded derivative assetsLevel 1 – – – – – –
Level 2 – – – – – –
Level 3 134 – – – – 3 137
134 – – – – 3 137
Fair value of embedded derivative liabilitiesLevel 1 – – – – – –
Level 2 – – – – – –
Level 3 (154) (236) (231) (227) (232) (388) (1,468)
(154) (236) (231) (227) (232) (388) (1,468)
Net fair value (20) (236) (231) (227) (232) (385) (1,331)
$ million
2008
Less than Over1 year 1-2 years 2-3 years 3-4 years 4-5 years 5 years Total
Fair value of embedded derivative assetsLevel 1 – – – – – –Level 2 35 – – – – – 35 Level 3 15 116 75 45 36 75 362
50 116 75 45 36 75 397Fair value of embedded derivative liabilities
Level 1 – – – – – –Level 2 (10) – – – – – (10)Level 3 (394) (322) (365) (303) (271) (599) (2,254)
(404) (322) (365) (303) (271) (599) (2,264)Net fair value (354) (206) (290) (258) (235) (524) (1,867)

155
Notes on financial statements
Fin
an
cia
l sta
tem
en
ts
BOL08439_p142 169.qxp:20 F 5/3/10 17:33 Page 155 Bleed: 0�mm Scale: 100%
31. Derivative financial instruments continuedThe following table shows the changes during the year in the net fair value of embedded derivatives within level 3 of the fair value hierarchy.
$ million
2009 2008
Commodity Commodity Interestprice price rate Total
Net fair value of contracts at 1 January (1,892) (2,146) (33) (2,179)Settlements 221 414 38 452Gains (losses) recognized in the income statementa 535 (1,011) (5) (1,016)Exchange adjustments (195) 851 – 851Net fair value of contracts at 31 December (1,331) (1,892) – (1,892)
aThe amount for gains (losses) recognized in the income statement for 2009 includes a loss of $224 million arising as a result of refinements in the modelling and valuation methods used for thesecontracts.
The amount recognized in the income statement for the year relating to level 3 embedded derivatives still held at 31 December 2009 was a$347 million gain (2008 $985 million loss relating to embedded derivatives still held at 31 December 2008).
The fair value gain (loss) on embedded derivatives is shown below.
$ million
2009 2008 2007
Commodity price embedded derivatives 607 (106) –Interest rate embedded derivatives – (5) (7)Fair value gain (loss) 607 (111) (7)
Cash flow hedges
At 31 December 2009, the group held currency forwards and futures contracts and cylinders that were being used to hedge the foreign currency riskof highly probable forecast transactions, as well as cross-currency interest rate swaps to fix the US dollar interest rate and US dollar redemption value,with matching critical terms on the currency leg of the swap with the underlying non-US dollar debt issuance. Note 24 outlines the management of riskaspects for currency and interest rate risk. For cash flow hedges the group only claims hedge accounting for the intrinsic value on the currency withany fair value attributable to time value taken immediately to the income statement. There were no highly probable transactions for which hedgeaccounting has been claimed that have not occurred and no significant element of hedge ineffectiveness requiring recognition in the incomestatement. For cash flow hedges the pre-tax amount removed from equity during the period and included in the income statement is a loss of$366 million (2008 loss of $45 million and 2007 gain of $74 million). Of this, a loss of $332 million is included in production and manufacturingexpenses (2008 $1 million loss and 2007 $143 million gain) and a loss of $34 million is included in finance costs (2008 $44 million loss and 2007$69 million loss). The amount removed from equity during the period and included in the carrying amount of non-financial assets was a loss of$136 million (2008 $38 million gain and 2007 $40 million gain).
The amounts retained in equity at 31 December 2009 are expected to mature and affect the income statement by a $146 million gain in 2010,a loss of $26 million in 2011 and a loss of $65 million in 2012 and beyond.
Fair value hedges
At 31 December 2009, the group held interest rate and cross-currency interest rate swap contracts as fair value hedges of the interest rate risk onfixed rate debt issued by the group. The effectiveness of each hedge relationship is quantitatively assessed and demonstrated to continue to be highlyeffective. The loss on the hedging derivative instruments taken to the income statement in 2009 was $98 million (2008 $2 million gain and 2007$334 million gain) offset by a gain on the fair value of the finance debt of $117 million (2008 $20 million loss and 2007 $327 million loss).
The interest rate and cross-currency interest rate swaps have an average maturity of four to five years, (2008 three to four years) and are usedto convert sterling, euro, Swiss franc, Australian dollar, Japanese yen and Hong Kong dollar denominated borrowings into US dollar floating rate debt.Note 24 outlines the group’s approach to interest rate risk management.
Hedges of net investments in foreign operations
The group held currency swap contracts as a hedge of a long-term investment in a UK subsidiary that expired in 2009. At 31 December 2008, thehedge had a fair value of $2 million and the loss on the hedge recognized in equity in 2008 was $38 million (2007 $67 million loss). US dollars had beensold forward for sterling purchased and matched the underlying liability with no significant ineffectiveness reflected in the income statement.

156
Notes on financial statements
BOL08439_p142 169.qxp:20 F 5/3/10 17:33 Page 156 Bleed: 0�mm Scale: 100%
32. Finance debt$ million
2009 2008
Within After Within After1 year a 1 year Total 1 year a 1 year Total
Borrowings 9,018 25,020 34,038 15,647 16,937 32,584 Net obligations under finance leases 91 498 589 93 527 620
9,109 25,518 34,627 15,740 17,464 33,204
a Amounts due within one year include current maturities of long-term debt and borrowings that are expected to be repaid later than the earliest contractual repayment dates of within one year. USIndustrial Revenue/Municipal Bonds of $2,895 million (2008 $3,166 million) with earliest contractual repayment dates within one year have expected repayment dates ranging from 1 to 33 years (2008 1 to 40 years). The bondholders typically have the option to tender these bonds for repayment on interest reset dates; however, any bonds that are tendered are usually remarketed and BP has notexperienced any significant repurchases. BP considers these bonds to represent long-term funding when internally assessing the maturity profile of its finance debt. Similar treatment is applied for loansassociated with long-term gas supply contracts totalling $1,622 million (2008 $1,806 million) that mature within eight years.
The following table shows, by major currency, the group’s finance debt at 31 December and the weighted average interest rates achieved at thosedates through a combination of borrowings and derivative financial instruments entered into to manage interest rate and currency exposures.
Fixed rate debt Floating rate debt Total
Weighted
Weighted average Weighted
average time for average
interest which rate interest
rate is fixed Amount rate Amount Amount
% Years $ million % $ million $ million
2009
US dollar 4 4 12,525 1 20,566 33,091
Euro 4 2 63 2 1,199 1,262
Other currencies 6 14 171 3 103 274
12,759 21,868 34,627
2008
US dollar 5 3 9,005 2 22,116 31,121Sterling – – – 6 21 21Euro 4 3 74 4 1,330 1,404Other currencies 7 10 216 7 442 658
9,295 23,909 33,204
Finance leases
The group uses finance leases to acquire property, plant and equipment. These leases have terms of renewal but no purchase options and escalationclauses. Renewals are at the option of the lessee. Future minimum lease payments under finance leases are set out below.
$ million
2009 2008
Future minimum lease payments payable within1 year 109 116 2 to 5 years 329 361 Thereafter 407 439
845 916 Less finance charges 256 296 Net obligations 589 620Of which – payable within 1 year 91 93
– payable within 2 to 5 years 202 234– payable thereafter 296 293

157
32. Finance debt continued
Notes on financial statements
Fin
an
cia
l sta
tem
en
ts
BOL08439_p142 169.qxp:20 F 5/3/10 17:33 Page 157 Bleed: 0�mm Scale: 100%
Fair values
The estimated fair value of finance debt is shown in the table below together with the carrying amount as reflected in the balance sheet.Long-term borrowings in the table below include the portion of debt that matures in the year from 31 December 2009, whereas in the balance
sheet the amount would be reported within current liabilities.The carrying amount of the group’s short-term borrowings, comprising mainly commercial paper, bank loans, overdrafts and US Industrial
Revenue/Municipal Bonds, approximates their fair value. The fair value of the group’s long-term borrowings and finance lease obligations is estimatedusing quoted prices or, where these are not available, discounted cash flow analyses based on the group’s current incremental borrowing rates forsimilar types and maturities of borrowing.
$ million
2009 2008
Carrying CarryingFair value amount Fair value amount
Short-term borrowings 5,144 5,144 9,913 9,913 Long-term borrowings 29,918 28,894 23,239 22,671 Net obligations under finance leases 599 589 638 620Total finance debt 35,661 34,627 33,790 33,204
See Note 24 for further information.
33. Capital disclosures and analysis of changes in net debtThe group defines capital as the total equity of the group. The group’s objective for managing capital is to deliver competitive, secure and sustainablereturns to maximize long-term shareholder value. BP is not subject to any externally-imposed capital requirements.
The group’s approach to managing capital is set out in its financial framework. The group aims to strike the right balance for shareholders,between current returns via the dividend, sustained investment for long-term growth and maintaining a prudent gearing level. At the beginning of2008, the group rebalanced distributions away from share buybacks in favour of dividends. During 2009, the company did not repurchase any of itsown shares.
The group monitors capital on the basis of the net debt ratio, that is, the ratio of net debt to net debt plus equity. Net debt is calculated as grossfinance debt, as shown in the balance sheet, plus the fair value of associated derivative financial instruments that are used to hedge foreign exchangeand interest rate risks relating to finance debt, for which hedge accounting is claimed, less cash and cash equivalents. Net debt and net debt ratio arenon-GAAP measures. BP uses these measures to provide useful information to investors. Net debt enables investors to see the economic effect ofgross debt, related hedges and cash and cash equivalents in total. The net debt ratio enables investors to see how significant net debt is relative toequity from shareholders. The derivatives are reported on the balance sheet within the headings ‘Derivative financial instruments’. All components ofequity are included in the denominator of the calculation. We believe that a net debt ratio in the range 20-30% provides an efficient capital structureand an appropriate level of financial flexibility.
At 31 December 2009 the net debt ratio was 20% (2008 21%).
$ million
At 31 December 2009 2008
Gross debt 34,627 33,204 Less: Cash and cash equivalents 8,339 8,197 Less: Fair value asset (liability) of hedges related to finance debt 127 (34)Net debt 26,161 25,041Equity 102,113 92,109Net debt ratio 20% 21%
An analysis of changes in net debt is provided below.
$ million
2009 2008
Cash and Cash andFinance cash Net Finance cash Net
Movement in net debt debt a equivalents debt debta equivalents debt
At 1 January (33,238) 8,197 (25,041) (30,379) 3,562 (26,817)Exchange adjustments (60) 110 50 102 (184) (82)Net cash flow (1,141) 32 (1,109) (2,825) 4,819 1,994Other movements (61) – (61) (136) – (136)At 31 December (34,500) 8,339 (26,161) (33,238) 8,197 (25,041)
a Including fair value of associated derivative financial instruments.

158
Notes on financial statements
BOL08439_p142 169.qxp:20 F 5/3/10 17:33 Page 158 Bleed: 0�mm Scale: 100%
34. Provisions$ million
Decommissioning Environmental Litigation Other Total
At 1 January 2009 8,418 1,691 1,446 2,098 13,653
Exchange adjustments 398 15 22 29 464
New or increased provisions 169 588 302 1,256 2,315
Write-back of unused provisions – (259) (99) (228) (586)
Unwinding of discount 184 32 15 16 247
Change in discount rate 324 18 (35) 8 315
Utilization (383) (308) (574) (361) (1,626)
Deletions (90) (58) (1) (3) (152)
At 31 December 2009 9,020 1,719 1,076 2,815 14,630
Of which – expected to be incurred within 1 year 287 368 433 572 1,660
– expected to be incurred in more than 1 year 8,733 1,351 643 2,243 12,970
$ million
Decommissioning Environmental Litigation Other Total
At 1 January 2008 9,501 2,107 1,737 1,750 15,095Exchange adjustments (1,208) (45) (1) (106) (1,360)New or increased provisions 327 270 886 1,173 2,656 Write-back of unused provisions – (107) (383) (130) (620)Unwinding of discount 202 43 22 20 287 Utilization (402) (512) (815) (609) (2,338)Deletions (2) (65) – – (67)At 31 December 2008 8,418 1,691 1,446 2,098 13,653 Of which – expected to be incurred within 1 year 322 418 521 284 1,545
– expected to be incurred in more than 1 year 8,096 1,273 925 1,814 12,108
The group makes full provision for the future cost of decommissioning oil and natural gas production facilities and related pipelines on a discountedbasis on the installation of those facilities. The provision for the costs of decommissioning these production facilities and pipelines at the end of theireconomic lives has been estimated using existing technology, at current prices or long-term assumptions, depending on the expected timing of theactivity, and discounted using a real discount rate of 1.75% (2008 2.0%). These costs are generally expected to be incurred over the next 30 years.While the provision is based on the best estimate of future costs and the economic lives of the facilities and pipelines, there is uncertainty regardingboth the amount and timing of incurring these costs.
Provisions for environmental remediation are made when a clean-up is probable and the amount of the obligation can be reliably estimated.Generally, this coincides with commitment to a formal plan of action or, if earlier, on divestment or on closure of inactive sites. The provision forenvironmental liabilities has been estimated using existing technology, at current prices and discounted using a real discount rate of 1.75% (20082.0%). The majority of these costs are expected to be incurred over the next 10 years. The extent and cost of future remediation programmes areinherently difficult to estimate. They depend on the scale of any possible contamination, the timing and extent of corrective actions, and also thegroup’s share of the liability.
The litigation category includes provisions for matters related to, for example, commercial disputes, product liability, and allegations ofexposures of third parties to toxic substances. Included within the other category at 31 December 2009 are provisions for deferred employeecompensation of $789 million (2008 $792 million) and for expected rental shortfalls on surplus properties of $246 million (2008 $251 million). Theseprovisions are discounted using either a nominal discount rate of 4.0% (2008 2.5%) or a real discount rate of 1.75% (2008 2.0%), as appropriate.

159
Notes on financial statements
Fin
an
cia
l sta
tem
en
ts
BOL08439_p142 169.qxp:20 F 5/3/10 17:33 Page 159 Bleed: 0�mm Scale: 100%
35. Pensions and other post-retirement benefitsMost group companies have pension plans, the forms and benefits of which vary with conditions and practices in the countries concerned. Pensionbenefits may be provided through defined contribution plans (money purchase schemes) or defined benefit plans (final salary and other types ofschemes with committed pension payments). For defined contribution plans, retirement benefits are determined by the value of funds arising fromcontributions paid in respect of each employee. For defined benefit plans, retirement benefits are based on such factors as the employees’pensionable salary and length of service. Defined benefit plans may be externally funded or unfunded. The assets of funded plans are generally held inseparately administered trusts.
In particular, the primary pension arrangement in the UK is a funded final salary pension plan under which retired employees draw the majorityof their benefit as an annuity. During 2009, BP announced that, with effect from 1 April 2010, it will close its UK plan to new joiners other than some ofthose joining the North Sea SPU. The plan will remain open to those employees who joined BP on or before 31 March 2010.
In the US, a range of retirement arrangements are provided. These include a funded final salary pension plan for certain heritage employees and acash balance arrangement for new hires. Retired US employees typically take their pension benefit in the form of a lump sum payment. US employeesare also eligible to participate in a defined contribution (401k) plan in which employee contributions are matched with company contributions.
The level of contributions to funded defined benefit plans is the amount needed to provide adequate funds to meet pension obligations as theyfall due. During 2009, contributions of $9 million (2008 $6 million and 2007 $524 million) and $795 million (2008 $362 million and 2007 $97 million) weremade to the UK plans and US plans respectively. In addition, contributions of $204 million (2008 $130 million and 2007 $127 million) were made to otherfunded defined benefit plans. The aggregate level of contributions in 2010 is expected to be approximately $1,000 million, and includes contributions in allcountries that we expect to be required to make by law or under contractual agreements as well as an allowance for discretionary funding.
Certain group companies, principally in the US, provide post-retirement healthcare and life insurance benefits to their retired employees anddependants. The entitlement to these benefits is usually based on the employee remaining in service until retirement age and completion of aminimum period of service. The plans are funded to a limited extent.
The obligation and cost of providing pensions and other post-retirement benefits is assessed annually using the projected unit credit method.The date of the most recent actuarial review was 31 December 2009. The group’s principal plans are subject to a formal actuarial valuation every threeyears in the UK, with valuations being required more frequently in many other countries. The most recent formal actuarial valuation of the UK pensionplans was as at 31 December 2008.
The material financial assumptions used for estimating the benefit obligations of the various plans are set out below. The assumptions are reviewedby management at the end of each year, and are used to evaluate accrued pension and other post-retirement benefits at 31 December. The sameassumptions are used to determine pension and other post-retirement benefit expense for the following year, that is, the assumptions at 31 December2009 are used to determine the pension liabilities at that date and the pension expense for 2010.
%
Financial assumptions UK US Other
2009 2008 2007 2009 2008 2007 2009 2008 2007
Discount rate for pension plan liabilities 5.8 6.3 5.7 5.4 6.3 6.1 5.8 5.7 5.6
Discount rate for other post-retirement benefit plans n/a n/a n/a 5.8 6.2 6.4 n/a n/a n/a
Rate of increase in salaries 5.3 4.9 5.1 4.2 2.2 4.2 3.8 3.5 3.7Rate of increase for pensions
in payment 3.4 3.0 3.2 – – – 1.8 1.7 1.8Rate of increase in deferred
pensions 3.4 3.0 3.2 – – – 1.2 1.0 1.2Inflation 3.4 3.0 3.2 2.4 0.4 2.4 2.3 2.0 2.2
Our discount rate assumptions are based on third-party AA corporate bond indices and for our largest plans in the UK, US and Germany we use yieldsthat reflect the maturity profile of the expected benefit payments. The inflation rate assumptions for our UK and US plans are based on the differencebetween the yields on index-linked and fixed-interest long-term government bonds. In other countries we use either this approach, or the central bankinflation target, or advice from the local actuary depending on the information that is available to us. The inflation assumptions are used to determinethe rate of increase for pensions in payment and the rate of increase in deferred pensions where there is such an increase.
Our assumptions for the rate of increase in salaries are based on our inflation assumption plus an allowance for expected long-term real salarygrowth. These include allowance for promotion-related salary growth, of between 0.3% and 0.4% depending on country. In addition to the financialassumptions, we regularly review the demographic and mortality assumptions.

160
Notes on financial statements
BOL08439_p142 169.qxp:20 F 5/3/10 17:33 Page 160 Bleed: 0�mm Scale: 100%
35. Pensions and other post-retirement benefits continuedThe mortality assumptions reflect best practice in the countries in which we provide pensions, and have been chosen with regard to the latestavailable published tables adjusted where appropriate to reflect the experience of the group and an extrapolation of past longevity improvements intothe future. BP’s most substantial pension liabilities are in the UK, the US and Germany where our mortality assumptions are as follows:
Years
Mortality assumptions UK US Germany
2009 2008 2007 2009 2008 2007 2009 2008 2007
Life expectancy at age 60 for a male currently aged 60 26.0 25.9 24.0 24.6 24.4 24.3 23.2 23.0 22.4
Life expectancy at age 60 for a male currently aged 40 29.0 28.9 25.1 26.1 25.9 25.8 26.1 25.9 25.3
Life expectancy at age 60 for a female currently aged 60 28.6 28.5 26.9 26.3 26.1 26.1 27.8 27.6 27.0
Life expectancy at age 60 for a female currently aged 40 31.5 31.4 27.9 27.2 27.0 27.0 30.4 30.3 29.7
Our assumptions for future US healthcare cost trend rate reflect the rate of actual cost increases seen in recent years for the initial trend rate, and theultimate trend rate reflects our long-term expectations based on past healthcare cost inflation seen over a longer period of time. The assumed futureUS healthcare cost trend rate is as follows:
%
2009 2008 2007
Initial US healthcare cost trend rate 8.2 8.6 9.0Ultimate US healthcare cost trend rate 5.0 5.0 5.0Year in which ultimate trend rate is reached 2017 2015 2013
Pension plan assets are generally held in trusts. The primary objective of the trusts is to accumulate pools of assets sufficient to meet the obligationsof the various plans. The assets of the trusts are invested in a manner consistent with fiduciary obligations and principles that reflect current practicesin portfolio management.
A significant proportion of the assets are held in equities, owing to a higher expected level of return over the long term with an acceptable levelof risk. In order to provide reasonable assurance that no single security or type of security has an unwarranted impact on the total portfolio, theinvestment portfolios are highly diversified. The long-term asset allocation policy for the major plans is as follows:
Policy range
Asset category %
Total equity 45-75Bonds/cash 17.5-50Property/real estate 0-10
Some of the group’s pension plans use derivative financial instruments as part of their asset mix and to manage the level of risk. The group’s mainpension plans do not invest directly in either securities or property/real estate of the company or of any subsidiary.
Return on asset assumptions reflect the group’s expectations built up by asset class and by plan. The group’s expectation is derived from acombination of historical returns over the long term and the forecasts of market professionals. Our assumption for return on equities is based on along-term view, and the size of the resulting equity risk premium over government bond yields is reviewed each year for reasonableness. Ourassumption for return on bonds reflects the portfolio mix of government fixed-interest, index-linked and corporate bonds.

161
Notes on financial statements
Fin
an
cia
l sta
tem
en
ts
BOL08439_p142 169.qxp:20 F 5/3/10 17:33 Page 161 Bleed: 0�mm Scale: 100%
35. Pensions and other post-retirement benefits continuedThe expected long-term rates of return and market values of the various categories of asset held by the defined benefit plans at 31 December are set outbelow. The market values shown include the effects of derivative financial instruments. The amounts classified as equities include investments incompanies listed on stock exchanges as well as unlisted investments. The market value of unlisted investments at 31 December 2009 was $2,956 million(2008 $2,819 million and 2007 $2,491 million). The market value of pension assets at the end of 2009 is higher than at the end of 2008 due to a rise in themarket value of investments when expressed in their local currencies and an increase in value that arises from changes in exchange rates (increasing thereported value of investments when expressed in US dollars). Movements in the value of plan assets during the year are shown in detail in the table onpage 162.
2009 2008 2007
Expected Expected Expectedlong-term long-term long-term
rate of Market rate of Market rate of Marketreturn value return value return value
% $ million % $ million % $ million
UK pension plansEquities 8.0 16,945 8.0 13,704 8.0 24,106Bonds 5.3 3,701 6.1 3,258 4.4 5,279Property 6.5 1,269 6.5 978 6.5 1,259Cash 1.1 634 2.9 299 5.6 977
7.3 22,549 7.4 18,239 7.3 31,621US pension plans
Equities 8.5 4,326 8.5 3,991 8.5 6,610Bonds 4.8 1,218 3.7 1,247 5.0 1,347Property 8.0 8 8.0 8 8.0 16Cash 0.9 271 1.9 131 3.6 72
8.0 5,823 8.0 5,377 8.0 8,045US other post-retirement benefit plans
Equities 8.5 8 8.5 9 8.5 17Bonds 4.8 4 3.7 4 5.0 6
7.6 12 7.3 13 7.6 23Other plans
Equities 8.6 1,091 8.4 799 8.1 1,260Bonds 4.4 1,651 4.2 1,481 5.0 1,491Property 6.5 82 6.3 127 5.7 145Cash 2.0 245 3.1 118 4.2 214
5.9 3,069 5.8 2,525 6.4 3,110
The assumed rate of investment return, discount rate, inflation, US healthcare cost trend rate and the mortality assumptions all have a significanteffect on the amounts reported.
A one-percentage point change in the following assumptions for the group’s plans would have had the effects shown in the table below. Theeffects shown for the expense in 2010 include current service cost and interest on plan liabilities.
$ million
One-percentage point
Increase Decrease
Investment returnEffect on pension and other post-retirement benefit expense in 2010 (313) 313
Discount rateEffect on pension and other post-retirement benefit expense in 2010 (75) 98
Effect on pension and other post-retirement benefit obligation at 31 December 2009 (4,778) 6,084
Inflation rateEffect on pension and other post-retirement benefit expense in 2010 424 (343)
Effect on pension and other post-retirement benefit obligation at 31 December 2009 4,394 (3,706)
US healthcare cost trend rateEffect on US other post-retirement benefit expense in 2010 31 (28)
Effect on US other post-retirement obligation at 31 December 2009 339 (304)
One additional year of longevity in the mortality assumptions would have the effects shown in the table below. The effect shown for the expense in2010 includes current service cost and interest on plan liabilities.
$ million
US other post-
UK US retirement German
pension pension benefit pension
plans plans plans plans
One additional year’s longevityEffect on pension and other post-retirement benefit expense in 2010 39 5 4 9Effect on pension and other post-retirement benefit obligation at 31 December 2009 528 90 62 149

162
Notes on financial statements
BOL08439_p142 169.qxp:20 F 5/3/10 17:33 Page 162 Bleed: 0�mm Scale: 100%
35. Pensions and other post-retirement benefits continued$ million
2009
US other post-
UK US retirement
pension pension benefit Other
plans plans plans plans Total
Analysis of the amount charged to profit before interest and taxationCurrent service costa 311 243 48 117 719Past service cost – – (22) 1 (21)Settlement, curtailment and special termination benefits 37 – – 53 90Payments to defined contribution plans – 205 – 28 233
Total operating chargeb 348 448 26 199 1,021
Analysis of the amount credited (charged) to other finance expenseExpected return on plan assets 1,426 405 1 147 1,979Interest on plan liabilities (1,112) (456) (183) (420) (2,171)
Other finance income (expense) 314 (51) (182) (273) (192)
Analysis of the amount recognized in other comprehensive incomeActual return less expected return on pension plan assets 1,761 617 2 169 2,549Change in assumptions underlying the present value of the plan liabilities (2,217) (501) (50) (42) (2,810)Experience gains and losses arising on the plan liabilities (141) (229) 71 (122) (421)
Actuarial (loss) gain recognized in other comprehensive income (597) (113) 23 5 (682)
Movements in benefit obligation during the yearBenefit obligation at 1 January 16,655 7,534 3,003 7,655 34,847 Exchange adjustments 1,896 – – 363 2,259Current service costa 311 243 48 117 719Past service cost – – (22) 1 (21)Interest cost 1,112 456 183 420 2,171Curtailment – – – 11 11Settlement – – – (3) (3)Special termination benefitsc 37 – – 45 82Contributions by plan participants 37 – – 10 47Benefit payments (funded plans)d (977) (1,371) (4) (209) (2,561)Benefit payments (unfunded plans)d (4) (73) (191) (399) (667)Disposals – – – (42) (42)Actuarial (gain) loss on obligation 2,358 730 (21) 164 3,231
Benefit obligation at 31 Decembera e 21,425 7,519 2,996 8,133 40,073
Movements in fair value of plan assets during the yearFair value of plan assets at 1 January 18,239 5,377 13 2,525 26,154 Exchange adjustments 2,054 – – 242 2,296Expected return on plan assetsa f 1,426 405 1 147 1,979Contributions by plan participants 37 – – 10 47Contributions by employers (funded plans) 9 795 – 204 1,008Benefit payments (funded plans)d (977) (1,371) (4) (209) (2,561)Disposals – – – (19) (19)Actuarial gain on plan assetsf 1,761 617 2 169 2,549
Fair value of plan assets at 31 December 22,549 5,823 12 3,069 31,453
Surplus (deficit) at 31 December 1,124 (1,696) (2,984) (5,064) (8,620)
Represented byAsset recognized 1,290 – – 100 1,390Liability recognized (166) (1,696) (2,984) (5,164) (10,010)
1,124 (1,696) (2,984) (5,064) (8,620)
The surplus (deficit) may be analysed between funded and unfunded plans as followsFunded 1,287 (1,280) (33) (164) (190)Unfunded (163) (416) (2,951) (4,900) (8,430)
1,124 (1,696) (2,984) (5,064) (8,620)
The defined benefit obligation may be analysed between funded and unfunded plansas followsFunded (21,262) (7,103) (45) (3,233) (31,643)Unfunded (163) (416) (2,951) (4,900) (8,430)
(21,425) (7,519) (2,996) (8,133) (40,073)
aThe costs of managing the plan’s investments are treated as being part of the investment return, the costs of administering our pension plan benefits are generally included in current service costand the costs of administering our other post-retirement benefit plans are included in the benefit obligation.
b Included within production and manufacturing expenses and distribution and administration expenses.cThe charge for special termination benefits represents the increased liability arising as a result of early retirements occurring as part of restructuring programmes.dThe benefit payments amount shown above comprises $3,174 million benefits plus $54 million of plan expenses incurred in the administration of the benefit. e The benefit obligation for other plans includes $3,880 million for the German plan, which is largely unfunded.f The actual return on plan assets is made up of the sum of the expected return on plan assets and the actuarial gain on plan assets as disclosed above.
At 31 December 2009, reimbursement balances due from or to other companies in respect of pensions amounted to $443 million reimbursementassets (2008 $455 million) and $14 million reimbursement liabilities (2008 $61 million). These balances are not included as part of the pension liability,but are reflected elsewhere in the group balance sheet.

163
Notes on financial statements
Fin
an
cia
l sta
tem
en
ts
BOL08439_p142 169.qxp:20 F 5/3/10 17:33 Page 163 Bleed: 0�mm Scale: 100%
35. Pensions and other post-retirement benefits continued$ million
2008
US other post-UK US retirement
pension pension benefit Otherplans plans plans plans Total
Analysis of the amount charged to profit before interest and taxationCurrent service costa 448 235 40 128 851Past service cost 7 74 – 1 82Settlement, curtailment and special termination benefits 30 – – 12 42 Payments to defined contribution plans – 170 – 25 195 Total operating chargeb 485 479 40 166 1,170Analysis of the amount credited (charged) to other finance expenseExpected return on plan assets 2,094 632 2 194 2,922 Interest on plan liabilities (1,239) (444) (198) (450) (2,331)Other finance income (expense) 855 188 (196) (256) 591Analysis of the amount recognized in other comprehensive incomeActual return less expected return on pension plan assets (6,946) (2,895) (8) (404) (10,253)Change in assumptions underlying the present value of the plan liabilities 1,570 3 215 214 2,002 Experience gains and losses arising on the plan liabilities (73) (194) 18 70 (179)Actuarial (loss) gain recognized in other comprehensive income (5,449) (3,086) 225 (120) (8,430)Movements in benefit obligation during the yearBenefit obligation at 1 January 23,927 7,409 3,178 8,586 43,100 Exchange adjustments (6,408) – – (628) (7,036)Current service costa 448 235 40 128 851Past service cost 7 74 – 1 82Interest cost 1,239 444 198 450 2,331Curtailment – – – (3) (3)Settlement (3) – – (3) (6)Special termination benefitsc 33 – – 18 51Contributions by plan participants 42 – – 12 54 Benefit payments (funded plans)d (1,131) (767) (4) (203) (2,105)Benefit payments (unfunded plans)d (2) (52) (176) (419) (649)Actuarial (gain) loss on obligation (1,497) 191 (233) (284) (1,823)Benefit obligation at 31 Decembera e 16,655 7,534 3,003 7,655 34,847Movements in fair value of plan assets during the yearFair value of plan assets at 1 January 31,621 8,045 23 3,110 42,799 Exchange adjustments (7,447) – – (314) (7,761)Expected return on plan assetsa f 2,094 632 2 194 2,922Contributions by plan participants 42 – – 12 54 Contributions by employers (funded plans) 6 362 – 130 498 Benefit payments (funded plans)d (1,131) (767) (4) (203) (2,105)Actuarial loss on plan assetsf (6,946) (2,895) (8) (404) (10,253)Fair value of plan assets at 31 December 18,239 5,377 13 2,525 26,154 Surplus (deficit) at 31 December 1,584 (2,157) (2,990) (5,130) (8,693)Represented by
Asset recognized 1,682 – – 56 1,738Liability recognized (98) (2,157) (2,990) (5,186) (10,431)
1,584 (2,157) (2,990) (5,130) (8,693)
The surplus (deficit) may be analysed between funded and unfunded plans as followsFunded 1,682 (1,734) (31) (354) (437)Unfunded (98) (423) (2,959) (4,776) (8,256)
1,584 (2,157) (2,990) (5,130) (8,693)
The defined benefit obligation may be analysed between funded and unfunded plans as followsFunded (16,557) (7,111) (44) (2,879) (26,591)Unfunded (98) (423) (2,959) (4,776) (8,256)
(16,655) (7,534) (3,003) (7,655) (34,847)
aThe costs of managing the plan’s investments are treated as being part of the investment return, the costs of administering our pension plan benefits are generally included in current service costand the costs of administering our other post-retirement benefit plans are included in the benefit obligation.
b Included within production and manufacturing expenses and distribution and administration expenses. cThe charge for special termination benefits represents the increased liability arising as a result of early retirements occurring as part of restructuring programmes. dThe benefit payments amount shown above comprises $2,697 million benefits plus $57 million of plan expenses incurred in the administration of the benefit. e The benefit obligation for other plans includes $3,837 million for the German plan, which is largely unfunded.f The actual return on plan assets is made up of the sum of the expected return on plan assets and the actuarial loss on plan assets as disclosed above.

164
Notes on financial statements
BOL08439_p142 169.qxp:20 F 5/3/10 17:33 Page 164 Bleed: 0�mm Scale: 100%
35. Pensions and other post-retirement benefits continued$ million
2007
US other post-
UK US retirementpension pension benefit Other
plans plans plans plans Total
Analysis of the amount charged to profit before interest and taxationCurrent service costa 492 227 43 132 894Past service cost 5 10 – – 15Settlement, curtailment and special termination benefits 36 – – 2 38 Payments to defined contribution plans – 184 – 25 209 Total operating chargeb 533 421 43 159 1,156Analysis of the amount credited (charged) to other finance expenseExpected return on plan assets 2,075 613 2 165 2,855 Interest on plan liabilities (1,198) (425) (190) (390) (2,203)Other finance income (expense) 877 188 (188) (225) 652Analysis of the amount recognized in other comprehensive incomeActual return less expected return on pension plan assets 406 (28) – (76) 302 Change in assumptions underlying the present value of the plan liabilities 513 358 137 607 1,615 Experience gains and losses arising on the plan liabilities (162) (27) 29 (40) (200)Actuarial gain recognized in other comprehensive income 757 303 166 491 1,717
aThe costs of managing the plan’s investments are treated as being part of the investment return, the costs of administering our pension plan benefits are generally included in current service cost,and the costs of administering our other post-retirement benefit plans are included in the benefit obligation.
b Included within production and manufacturing expenses and distribution and administration expenses.
$ million
2009 2008 2007 2006 2005
History of surplus (deficit) and of experience gains and lossesBenefit obligation at 31 December 40,073 34,847 43,100 42,433 38,855 Fair value of plan assets at 31 December 31,453 26,154 42,799 39,910 32,907 Deficit (8,620) (8,693) (301) (2,523) (5,948)Experience losses on plan liabilities (421) (178) (200) (124) (212)Actual return less expected return on pension plan assets 2,549 (10,253) 302 1,967 3,364Actual return on plan assets 4,528 (7,331) 3,157 4,377 5,502Actuarial (loss) gain recognized in other comprehensive income (682) (8,430) 1,717 2,615 975Cumulative amount recognized in other comprehensive income (3,622) (2,940) 5,490 3,773 1,158
Estimated future benefit payments
The expected benefit payments, which reflect expected future service, as appropriate, but exclude plan expenses, up until 2019 are as follows:
$ million
US
other post-
UK US retirement
pension pension benefit Other
plans plans plans plans Total
2010 1,003 618 201 612 2,434
2011 1,019 637 206 587 2,449
2012 1,061 679 208 581 2,529
2013 1,095 677 213 578 2,563
2014 1,148 672 218 584 2,622
2015-2019 6,496 3,275 1,123 2,835 13,729

165
Notes on financial statements
Fin
an
cia
l sta
tem
en
ts
BOL08439_p142 169.qxp:20 F 5/3/10 17:33 Page 165 Bleed: 0�mm Scale: 100%
36. Called-up share capitalThe allotted, called-up and fully paid share capital at 31 December was as follows:
2009 2008 2007
Shares Shares SharesIssued (thousand) $ million (thousand) $ million (thousand) $ million
8% cumulative first preference shares of £1 each 7,233 12 7,233 12 7,233 129% cumulative second preference shares of £1 each 5,473 9 5,473 9 5,473 9
21 21 21Ordinary shares of 25 cents each
At 1 January 20,618,458 5,155 20,863,424 5,216 21,457,301 5,364Issue of new shares for employee share schemesa 11,207 3 24,791 6 69,273 18Repurchase of ordinary share capitalb – – (269,757) (67) (663,150) (166)
At 31 December 20,629,665 5,158 20,618,458 5,155 20,863,424 5,2165,179 5,176 5,237
Authorized8% cumulative first preference shares of £1 each 7,250 12 7,250 12 7,250 129% cumulative second preference shares of £1 each 5,500 9 5,500 9 5,500 9Ordinary shares of 25 cents each 36,000,000 9,000 36,000,000 9,000 36,000,000 9,000
aConsideration received relating to the issue of new shares for employee share schemes amounted to $84 million (2008 $180 million and 2007 $492 million).b Purchased for a total consideration of nil (2008 $2,914 million and 2007 $7,497 million), all of which were for cancellation. At 31 December 2009, 112,803,287 (2008 150,444,408 and 2007
150,966,096) ordinary shares bought back were awaiting cancellation. These shares have been excluded from ordinary shares in issue shown above. Transaction costs of share repurchases amounted tonil (2008 $16 million and 2007 $40 million).
Voting on substantive resolutions tabled at a general meeting is on a poll. On a poll, shareholders present in person or by proxy have two votes forevery £5 in nominal amount of the first and second preference shares held and one vote for every ordinary share held. On a show-of-hands vote onother resolutions (procedural matters) at a general meeting, shareholders present in person or by proxy have one vote each.
In the event of the winding up of the company, preference shareholders would be entitled to a sum equal to the capital paid up on thepreference shares, plus an amount in respect of accrued and unpaid dividends and a premium equal to the higher of (i) 10% of the capital paid up onthe preference shares and (ii) the excess of the average market price of such shares on the London Stock Exchange during the previous six monthsover par value.
Treasury shares
2009 2008 2007
Shares Nominal value Shares Nominal value Shares Nominal value(thousand) $ million (thousand) $ million (thousand) $ million
At 1 January 1,888,151 472 1,940,639 485 1,946,805 487Shares gifted to the Employee Share Ownership Plans (1,265) (1) (10,000) (2) (1,700) – Shares transferred at market price to the Employee Share
Ownership Plans – – (20,000) (5) – –Shares re-issued to employee share schemes (17,109) (4) (22,488) (6) (4,466) (2)At 31 December 1,869,777 467 1,888,151 472 1,940,639 485
For each year presented, the balance at 1 January represents the maximum number of shares held in treasury during the year, representing 9.2%(2008 9.3% and 2007 9.1%) of the called-up ordinary share capital of the company.
During 2009, the movement in treasury shares represented less than 0.1% (2008 0.25% and 2007 less than 0.1%) of the ordinary share capitalof the company.

166
Notes on financial statements
–––––
–––––
–––––
–
–––––
BOL08439_p142 169.qxp:20 F 5/3/10 17:33 Page 166 Bleed: 0�mm Scale: 100%
37. Capital and reserves
Share Capital
Share premium redemption
capital account reserve
At 1 January 2009 5,176 9,763 1,072
Currency translation differences (including recycling) – –Actuarial gain relating to pensions and other post-retirement benefits – –Available-for-sale investments (including recycling) – –Cash flow hedges (including recycling) – –Profit for the year – –
Total comprehensive income – –Dividends – –Share-based paymentsa 3 84Changes in associates’ equity – –Minority interest buyout – –
At 31 December 2009 5,179 9,847 1,072
Share CapitalShare premium redemptioncapital account reserve
At 1 January 2008 5,237 9,581 1,005
Currency translation differences (including recycling) – – –Actuarial gain relating to pensions and other post-retirement benefits – – –Available-for-sale investments (including recycling) – –Cash flow hedges (including recycling) – –Profit for the year – –Total comprehensive income – –Dividends – –Repurchase of ordinary share capital (67) – 67Share-based paymentsa 6 182 –Minority interest buyout – –At 31 December 2008 5,176 9,763 1,072
Share CapitalShare premium redemptioncapital account reserve
At 1 January 2007 5,385 9,074 839
Currency translation differences (including recycling) – – –Actuarial gain relating to pensions and other post-retirement benefits – – –Available-for-sale investments (including recycling) – –Cash flow hedges (including recycling) – –Profit for the year – –Total comprehensive income – –Dividends – –Repurchase of ordinary share capital (166) – 166Share-based paymentsa 18 507 –At 31 December 2007 5,237 9,581 1,005
aIncludes new share issues and movements in own shares and treasury shares where these relate to share-based payment plans.

Notes on financial statements
Fin
an
cia
l sta
tem
en
ts
BOL08439_p142 169.qxp:20 F 5/3/10 17:33 Page 167 Bleed: 0�mm Scale: 100%
167
$ million
Foreign Share-
currency Available- based Profit BP
Merger Other Own Treasury translation for-sale Cash flow payment and loss shareholders’ Minority Total
reserve reserve shares shares reserve investments hedges reserve account equity interest equity
27,206 – (326) (21,513) 2,353 63 (866) 1,295 67,080 91,303 806 92,109
– – – – 2,458 (2) (37) – – 2,419 (56) 2,363– – – – – – – – (478) (478) – (478)– – – – – 693 – – – 693 – 693– – – – – – 925 – – 925 – 925– – – – – – – – 16,578 16,578 181 16,759
– – – – 2,458 691 888 – 16,100 20,137 125 20,262– – – – – – – – (10,483) (10,483) (416) (10,899)– – 112 210 – – – 289 23 721 – 721– – – – – – – – (43) (43) – (43)– – – – – – – – (22) (22) (15) (37)
27,206 – (214) (21,303) 4,811 754 22 1,584 72,655 101,613 500 102,113
Foreign Share-currency Available- based Profit BP
Merger Other Own Treasury translation for-sale Cash flow payment and loss shareholders’ Minority Totalreserve reserve shares shares reserve investments hedges reserve account equity interest equity
27,206 – (60) (22,112) 6,540 481 106 1,196 64,510 93,690 962 94,652
– – – – (4,187) – – – – (4,187) (75) (4,262)– – – – – – – – (5,828) (5,828) – (5,828)– – – – – (418) – – – (418) – (418)– – – – – – (972) – – (972) – (972)– – – – – – – – 21,157 21,157 509 21,666– – – – (4,187) (418) (972) – 15,329 9,752 434 10,186– – – – – – – – (10,342) (10,342) (425) (10,767)– – – – – – – – (2,414) (2,414) – (2,414)– – (266) 599 – – – 99 (3) 617 – 617– – – – – – – – – – (165) (165)
27,206 – (326) (21,513) 2,353 63 (866) 1,295 67,080 91,303 806 92,109
Foreign Share-currency Available- based Profit BP
Merger Other Own Treasury translation for-sale Cash flow payment and loss shareholders’ Minority Totalreserve reserve shares shares reserve investments hedges reserve account equity interest equity
27,201 5 (154) (22,182) 4,685 386 39 859 58,487 84,624 841 85,465
– – – – 1,855 – – – – 1,855 24 1,879– – – – – – – – 1,290 1,290 – 1,290– – – – – 95 – – – 95 – 95– – – – – – 67 – – 67 – 67– – – – – – – – 20,845 20,845 324 21,169– – – – 1,855 95 67 – 22,135 24,152 348 24,500– – – – – – – – (8,106) (8,106) (227) (8,333)– – – – – – – – (7,997) (7,997) – (7,997)5 (5) 94 70 – – – 337 (9) 1,017 – 1,017
27,206 – (60) (22,112) 6,540 481 106 1,196 64,510 93,690 962 94,652

37. Capital and reserves continuedShare capital
The balance on the share capital account represents the aggregate nominal value of all ordinary and preference shares in issue, including treasury shares.
Share premium account
The balance on the share premium account represents the amounts received in excess of the nominal value of the ordinary and preference shares.
Capital redemption reserve
The balance on the capital redemption reserve represents the aggregate nominal value of all the ordinary shares repurchased and cancelled.
Merger reserve
The balance on the merger reserve represents the fair value of the consideration given in excess of the nominal value of the ordinary shares issued inan acquisition made by the issue of shares.
Other reserve
The balance on the other reserve represented the fair value of the consideration given in excess of the nominal value of the ordinary shares issued inthe ARCO acquisition on the exercise of ARCO share options.
Own shares
Own shares represent BP shares held in Employee Share Ownership Plans (ESOPs) to meet the future requirements of the employee share-basedpayment plans.
Treasury shares
Treasury shares represent BP shares repurchased and available for re-issue.
Foreign currency translation reserve
The foreign currency translation reserve is used to record exchange differences arising from the translation of the financial statements of foreignoperations. Upon disposal of foreign operations, the related accumulated exchange differences are recycled to the income statement. This reserve isalso used to record the effect of hedging net investments in foreign operations.
Available-for-sale investments
This reserve records the changes in fair value of available-for-sale investments. On disposal or impairment, the cumulative changes in fair value arerecycled to the income statement.
Cash flow hedges
This reserve records the portion of the gain or loss on a hedging instrument in a cash flow hedge that is determined to be an effective hedge. Whenthe hedged transaction occurs, the gain or loss on the hedging instrument is transferred out of equity to either profit or loss or the carrying value ofassets, as appropriate. If the forecast transaction is no longer expected to occur the gain or loss recognized in equity is transferred to profit or loss.
Share-based payment reserve
This reserve represents cumulative amounts charged to profit in respect of employee share-based payment plans where the scheme has not yet beensettled by means of an award of shares to an individual.
Profit and loss account
The balance held on this reserve is the accumulated retained profits of the group.
168
Notes on financial statements
BOL08439_p142 169.qxp:20 F 5/3/10 17:33 Page 168 Bleed: 0�mm Scale: 100%

169
Fin
an
cia
l sta
tem
en
ts
Notes on financial statements
BOL08439_p142 169.qxp:20 F 5/3/10 17:33 Page 169 Bleed: 0�mm Scale: 100%
37. Capital and reserves continuedThe pre-tax amounts of each component of other comprehensive income, and the related amounts of tax, are shown in the table below.
$ million
2009
Pre-tax Tax Net of tax
Currency translation differences (including recycling) 1,799 564 2,363Actuarial loss relating to pensions and other post-retirement benefits (682) 204 (478)Available-for-sale investments (including recycling) 707 (14) 693Cash flow hedges (including recycling) 1,154 (229) 925
Other comprehensive income 2,978 525 3,503
$ million
2008
Pre-tax Tax Net of tax
Currency translation differences (including recycling) (4,362) 100 (4,262)Actuarial loss relating to pensions and other post-retirement benefits (8,430) 2,602 (5,828)Available-for-sale investments (including recycling) (468) 50 (418)Cash flow hedges (including recycling) (1,166) 194 (972)Other comprehensive income (14,426) 2,946 (11,480)
$ million
2007
Pre-tax Tax Net of tax
Currency translation differences (including recycling) 1,740 139 1,879 Actuarial gain relating to pensions and other post-retirement benefits 1,717 (427) 1,290 Available-for-sale investments (including recycling) 109 (14) 95 Cash flow hedges (including recycling) 41 26 67Other comprehensive income 3,607 (276) 3,331

170
Notes on financial statements
38. Share-based payments Effect of share-based payment transactions on the group’s result and financial position
$ million
2009 2008 2007
Total expense recognized for equity-settled share-based payment transactions 506 524 412Total expense (credit) recognized for cash-settled share-based payment transactions 15 (16) 16 Total expense recognized for share-based payment transactions 521 508 428Closing balance of liability for cash-settled share-based payment transactions 32 21 40Total intrinsic value for vested cash-settled share-based payments 7 7 2 22
For ease of presentation, option and share holdings detailed in the tables within this note are stated as UK ordinary share equivalents in US dollars. USemployees are granted American Depositary Shares (ADSs) or options over the company’s ADSs (one ADS is equivalent to six oshare-based payment plans that existed during the year are detailed below. All plans are ongoing unless otherwise stated.
rdinary shares). The
Plans for executive directors
Executive Directors’ Incentive Plan (EDIP) – share elementAn equity-settled incentive plan for executive directors with a three-year performance period. For share plan performance periods 2007-2009 and 2008-2010the award of shares is determined by comparing BP’s total shareholder return (TSR) against the other oil majors (ExxonMobil, Shell, Total and Chevron). Forthe performance period 2009-2011 the award of shares is determined 50% on TSR versus a competitor group of oil majors (which in this period also includedConocoPhillips) and 50% on a balanced scorecard (BSC) of three underlying performance measures versus the same competitor group. After theperformance period, the shares that vest (net of tax) are then subject to a three-year retention period. The directors’ remuneration report on pages 77 to 88includes full details of the plan.
Executive Directors’ Incentive Plan (EDIP) – share option elementAn equity-settled share option plan for executive directors that permits options to be granted at an exercise price no lower than the market price of ashare on the date that the option is granted. The options are exercisable up to the seventh anniversary of the grant date and the last grants were madein 2004. From 2005 onwards the remuneration committee’s policy is not to make further grants of share options to executive directors.
Plans for senior employees
The group operates a number of equity-settled share plans under which share units are granted to its senior leaders and certain employees. Theseplans typically have a three-year performance or restricted period during which the units accrue net notional dividends which are treated as havingbeen reinvested. Leaving employment during the three-year period will normally preclude the conversion of units into shares, but special arrangementsapply where the participant leaves for a qualifying reason.
Grants are settled in cash where participants are located in a country whose regulatory environment prohibits the holding of BP shares.
Performance unit plansThe number of units granted is made by reference to level ofreference to performance measures over the three-year perfother oil majors. In addition, free cash flow (FCF) is used as a
seniority of the employees. The number of units converted to shares is determined byormance period. The main performance measure used is BP’s TSR compared against the performance measure for one of the performance plans. Plans included in this category
are the Competitive Performance Plan (CPP), the Medium Term Performance Plan (MTPP) and, in part, the Performance Share Plan (PSP).
Restricted share unit plansShare unit grants under BP’s restricted plans typically take into account the employee’s performance in either the current or the prior year, track recordof delivery, business and leadership skills and long-term potential. One restricted share unit plan used in special circumstances for senior employees,such as recruitment and retention, normally has no performance conditions. Plans included in this category are the Executive Performance Plan (EPP),the Restricted Share Plan (RSP), the Deferred Annual Bonus Plan (DAB) and, in part, the Performance Share Plan (PSP).
BP Share Option Plan (BPSOP)Share options with an exercise price equivalent to the market price of a share immediately preceding the date of grant were granted to participantsannually until 2006. There were no performance conditions and the options are exercisable between the third and tenth anniversaries of the grant date.
Savings and matching plans
BP ShareSave PlanThis is a savings-related share option plan under which employees save on a monthly basis, over a three- or five-year period, towards the purchase ofshares at a fixed price determined when the option is granted. This price is usually set at a 20% discount to the market price at the time of grant. Theoption must be exercised within six months of maturity of the savings contract; otherwise it lapses. The plan is run in the UK and options are grantedannually, usually in June. Participants leaving for a qualifying reason have six months in which to use their savings to exercise their options on a pro-rated basis.
BOL08439_p170 174.qxp:20 F 5/3/10 17:33 Page 170 Bleed: 0�mm Scale: 100%

171
38. Share-based payments continuedBP ShareMatch PlansThese are matching share plans under which BP matches employees’ own contributions of shares up to a predetermined limit. The plans are run in theUK and in more than 70 other countries. The UK plan is run on a monthly basis with shares being held in trust for five years before they can be releasedfree of any income tax and national insurance liability. In other countries the plan is run on an annual basis with shares being held in trust for threeyears. The plan is operated on a cash basis in those countries where there are regulatory restrictions preventing the holding of BP shares. When theemployee leaves BP all shares must be removed from trust and units under the plan operated on a cash basis must be encashed.
Local plansIn some countries BP provides local scheme benefits, the rules and qualifications for which vary according to local circumstances.
Employee Share Ownership Plans (ESOPs)
295,895,357 3.58 8.73 274,685,068 8.80
ESOPs have been established to acquire BP shares to satisfy any awards made to participants under the BP share plans as required. The ESOPs havewaived their rights to dividends on shares held for future awards and are funded by the group. Until such time as the company’s own shares held bythe ESOP trusts vest unconditionally to employees, the amount paid for those shares is deducted in arriving at shareholders’ equity (see Note 37).Assets and liabilities of the ESOPs are recognized as assets and liabilities of the group.
At 31 December 2009 the ESOPs held 18,062,246 shares (2008 29,051,082 shares and 2007 6,448,838 shares) for potential future awards,which had a market value of $174 million (2008 $220 million and 2007 $79 million).
Share option transactions 2009 2008 2007
Weighted Weighted WeightedNumber average Number average Number average
of exercise price of exercise price of exercise priceoptions $ options $ options $
Outstanding at 1 January 326,254,599 8.70 358,094,243 8.51 426,471,462 8.25Granted 9,679,836 6.55 8,062,899 8.96 6,004,025 9.11Forfeited (5,954,325) 8.81 (2,502,784) 8.50 (3,924,714) 9.10Exercised (21,293,871) 7.53 (37,277,895) 6.97 (69,715,558) 6.94 Expired (12,790,882) 8.01 (121,864) 7.00 (740,972) 8.68Outstanding at 31 December 295,895,357 8.73 326,254,599 8.70 358,094,243 8.51Exercisable at 31 December 274,685,068 8.80 260,178,938 8.22 238,707,055 7.70
As share options are exercised continuously throughout the year, the weighted average share price during the year of $9.10 (2008 $10.87 and 2007$11.72) is representative of the weighted average share price at the date of exercise. For the options outstanding at 31 December 2009, the exerciseprice ranges and weighted average remaining contractual lives are shown below.
Options outstanding Options exercisable
Weighted Weighted Weighted
Number average average Number average
of remaining life exercise price of exercise price
Range of exercise prices shares Years $ shares $
$6.18 – $7.61 53,511,852 3.31 6.43 43,956,777 6.40
$7.62 – $9.05 143,736,259 2.48 8.18 137,625,273 8.16
$9.06 – $10.48 27,046,156 4.10 9.83 21,501,928 10.01
$10.49 – $11.92 71,601,090 5.81 11.14 71,601,090 11.14
Fair values and associated details for options and shares granted
Notes on financial statements
Fin
an
cia
l sta
tem
en
ts
BOL08439_p170 174.qxp:20 F 5/3/10 17:33 Page 171 Bleed: 0�mm Scale: 100%
2009 2008 2007
ShareSave ShareSave ShareSave ShareSave ShareSave ShareSave3 year 5 year 3 year 5 year 3 year 5 year
Option pricing model used Binomial Binomial Binomial Binomial Binomial BinomialWeighted average fair value $1.07 $1.07 $1.82 $1.74 $3.57 $3.79Weighted average share price $7.87 $7.87 $11.26 $11.26 $12.10 $12.10Weighted average exercise price $6.92 $6.92 $9.70 $9.70 $9.13 $9.13Expected volatility 32% 32% 23% 23% 21% 21%Option life 3.5 years 5.5 years 3.5 years 5.5 years 3.5 years 5.5 yearsExpected dividends 7.40% 7.40% 4.60% 4.60% 3.48% 3.48%Risk free interest rate 3.00% 3.75% 5.00% 5.00% 5.75% 5.75%Expected exercise behaviour 100% year 4 100% year 6 100% year 4 100% year 6 100% year 4 100% year 6
The group uses a valuation model to determine the fair value of options granted. The model uses the implied volatility of ordinary share price for thequarter within which the grant date of the relevant plan falls. The fair value is adjusted for the expected rates of early cancellation. Management isresponsible for all inputs and assumptions in relation to the model, including the determination of expected volatility.

172
remuneration committee according to established criteria.
Notes on financial statements
BOL08439_p170 174.qxp:20 F 5/3/10 17:33 Page 172 Bleed: 0�mm Scale: 100%
38. Share-based payments continuedEDIP- EDIP-
Shares granted in 2009 CPP EPP TSR BSC RSP DAB PSP
Number of equity instruments granted (million) 1.4 7.6 2.1 2.1 2.4 38.9 16.5
Weighted average fair value $9.76 $6.56 $2.74 $7.27 $8.76 $6.56 $8.32
Fair value measurement basis Monte Market Monte Market Market Market Monte
Carlo value Carlo value value value Carlo
MTPP- MTPP- EDIP- EDIP-Shares granted in 2008 TSR FCF TSR RETa RSP DAB PSP
Number of equity instruments granted (million) 9.1 9.1 2.6 0.5 7.7 5.8 16.7Weighted average fair value $5.07 $10.34 $4.55 $11.13 $8.83 $10.34 $12.89Fair value measurement basis Monte Market Monte Market Market Market Monte
Carlo value Carlo value value value Carlo
MTPP- MTPP- EDIP- EDIP-Shares granted in 2007 TSR FCF TSR LTLb RSP DAB PSP
Number of equity instruments granted (million) 9.4 8.5 4.5 0.5 7.7 4.4 14.8Weighted average fair value $4.73 $10.02 $2.81 $9.92 $11.93 $10.02 $12.37Fair value measurement basis Monte Market Monte Market Market Market Monte
Carlo value Carlo value value value Carlo
aEDIP – retention element.bEDIP – long-term leadership element.
The group used a Monte Carlo simulation to determine the fair value of the TSR element of the 2009, 2008 and 2007 CPP, PSP, MTPP and EDIP plans.In accordance with the rules of the plans the model simulates BP’s TSR and compares it against our principal strategic competitors over the three-yearperiod of the plans. The model takes into account the historic dividends, share price volatilities and covariances of BP and each comparator company toproduce a predicted distribution of relative share performance. This is applied to the reward criteria to give an expected value of the TSR element.
Accounting expense does not necessarily represent the actual value of share-based payments made to recipients, which are determined by the
39. Employee costs and numbers$ million
Employee costs 2009 2008 2007
Wages and salariesa 9,702 10,388 9,808Social security costs 780 805 771Share-based payments 521 508 428Pension and other post-retirement benefit costs 1,213 579 504
12,216 12,280 11,511
Number of employees at 31 December 2009 2008 2007
Exploration and Production 21,500 21,400 21,800Refining and Marketingb 51,600 61,500 67,200Other businesses and corporate 7,200 9,100 9,100
80,300 92,000 98,100By geographical areaUS 22,800 29,300 33,000Non-USb 57,500 62,700 65,100
80,300 92,000 98,100
2009 2008 2007
Average number of employees US Non-US Total US Non-US Total US Non-US Total
Exploration and Production 7,900 13,800 21,700 7,800 13,800 21,600 7,700 13,800 21,500Refining and Marketing 14,700 40,700 55,400 21,600 43,400 65,000 23,400 43,900 67,300Other businesses and corporate 2,300 5,800 8,100 2,600 6,500 9,100 2,500 5,900 8,400
24,900 60,300 85,200 32,000 63,700 95,700 33,600 63,600 97,200
a Includes termination payments of $945 million (2008 $669 million and 2007 $422 million). b Includes 13,900 (2008 21,200 and 2007 24,500) service station staff.

173
Notes on financial statements
40. Remuneration of directors and senior managementRemuneration of directors
210
$ million
2009 2008 2007
Total for all directorsEmoluments 19 19 26Gains made on the exercise of share options 2 1Amounts awarded under incentive schemes 2 –
EmolumentsThese amounts comprise fees paid to the non-executive chairman and the non-executive directors and, for executive directors, salary and benefitsearned during the relevant financial year, plus bonuses awarded for the year. Ex gratia superannuation payments of $3 million were included in 2007.Also included was compensation for loss of office of $1 million in 2008 and $1 million in 2007.
Pension contributionsThree executive directors participated in a non-contributory pension scheme established for UK employees by a separate trust fund to whichcontributions are made by BP based on actuarial advice.Two US executive directors participated in the US BP Retirement Accumulation Plan during 2009.
Office facilities for former chairmen and deputy chairmenIt is customary for the company to make available to former chairmen and deputy chairmen, who were previously employed executives, the use ofoffice and basic secretarial facilities following their retirement. The cost involved in doing so is not significant.
Further informationFull details of individual directors’ remuneration are given in the directors’ remuneration report on pages 77 to 88.
Remuneration of directors and senior management
6
$ million
2009 2008 2007
Total for all senior managementShort-term employee benefits 36 34 35Post-retirement benefits 3 4Share-based payments 20 20 22
Senior management, in addition to executive and non-executive directors, includes other senior managers who are members of the executivemanagement team.
Short-term employee benefitsIn addition to fees paid to the non-executive chairman and non-executive directors, these amounts comprise, for executive directors and seniormanagers, salary and benefits earned during the year, plus cash bonuses awarded for the year. Deferred annual bonus awards, to be settled in shares,are included in share-based payments. Short-term employee benefits includes an ex gratia superannuation payment of nil (2008 nil and 2007$3 million) and compensation for loss of office of $6 million (2008 $3 million and 2007 $1 million).
Post-retirement benefitsThe amounts represent the estimated cost to the group of providing defined benefit pensions and other post-retirement benefits to seniormanagement in respect of the current year of service measured in accordance with IAS 19 ‘Employee Benefits’.
Share-based paymentsThis is the cost to the group of senior management’s participation in share-based payment plans, as measured by the fair value of options and sharesgranted accounted for in accordance with IFRS 2 ‘Share-based Payments’. The main plans in which senior management have participated are the EDIPand MTPP. For details of these plans refer to Note 38.
Fin
an
cia
l sta
tem
en
ts
BOL08439_p170 174.qxp:20 F 5/3/10 17:33 Page 173 Bleed: 0�mm Scale: 100%

174
Notes on financial statements
41. Contingent liabilitiesThere were contingent liabilities at 31 December 2009 in respect of guarantees and indemnities entered into as part of the ordinary course of thegroup’s business. No material losses are likely to arise from such contingent liabilities. Further information is included in Note 24.
Lawsuits arising out of the Exxon Valdez oil spill in Prince William Sound, Alaska, in March 1989 were filed against Exxon (now ExxonMobil),Alyeska Pipeline Service Company (Alyeska), which operates the oil terminal at Valdez, and the other oil companies that own Alyeska. Alyeska initiallyresponded to the spill until the response was taken over by Exxon. BP owns a 46.9% interest (reduced during 2001 from 50% by a sale of 3.1% toPhillips) in Alyeska through a subsidiary of BP America Inc. and briefly indirectly owned a further 20% interest in Alyeska following BP’s combinationwith Atlantic Richfield Company (Atlantic Richfield). Alyeska and its owners have settled all the claims against them under these lawsuits. Exxon hasindicated that it may file a claim for contribution against Alyeska for a portion of the costs and damages that Exxon has incurred. BP will defend anysuch claims vigorously. It is not possible to estimate any financial effect.
In the normal course of the group’s business, legal proceedings are pending or may be brought against BP group entities arising out of currentand past operations, including matters related to commercial disputes, product liability, antitrust, premises-liability claims, general environmental claimsand allegations of exposures of third parties to toxic substances, such as lead pigment in paint, asbestos and other chemicals. BP believes that theimpact of these legal proceedings on the group’s results of operations, liquidity or financial position will not be material.
With respect to lead pigment in paint in particular, Atlantic Richfield, a subsidiary of BP, has been named as a co-defendant in numerouslawsuits brought in the US alleging injury to persons and property. Although it is not possible to predict the outcome of the legal proceedings, AtlanticRichfield believes it has valid defences that render the incurrence of a liability remote; however, the amounts claimed and the costs of implementingthe remedies sought in the various cases could be substantial. The majority of the lawsuits have been abandoned or dismissed against AtlanticRichfield. No lawsuit against Atlantic Richfield has been settled nor has Atlantic Richfield been subject to a final adverse judgment in any proceeding.Atlantic Richfield intends to defend such actions vigorously.
The group files income tax returns in many jurisdictions throughout the world. Various tax authorities are currently examining the group’sincome tax returns. Tax returns contain matters that could be subject to differing interpretations of applicable tax laws and regulations and theresolution of tax positions through negotiations with relevant tax authorities, or through litigation, can take several years to complete. While it isdifficult to predict the ultimate outcome in some cases, the group does not anticipate that there will be any material impact upon the group’s results ofoperations, financial position or liquidity.
The group is subject to numerous national and local environmental laws and regulations concerning its products, operations and other activities.These laws and regulations may require the group to take future action to remediate the effects on the environment of prior disposal or release ofchemicals or petroleum substances by the group or other parties. Such contingencies may exist for various sites including refineries, chemical plants,oil fields, service stations, terminals and waste disposal sites. In addition, the group may have obligations relating to prior asset sales or closedfacilities. The ultimate requirement for remediation and its cost are inherently difficult to estimate. However, the estimated cost of knownenvironmental obligations has been provided in these accounts in accordance with the group’s accounting policies. While the amounts of future costscould be significant and could be material to the group’s results of operations in the period in which they are recognized, it is not practical to estimatethe amounts involved. BP does not expect these costs to have a material effect on the group’s financial position or liquidity.
The group also has obligations to decommission oil and natural gas production facilities and related pipelines. Provision is made for theestimated costs of these activities, however there is uncertainty regarding both the amount and timing of these costs, given the long-term nature ofthese obligations. BP believes that the impact of any reasonably foreseeable changes to these provisions on the group’s results of operations, financialposition or liquidity will not be material.
The group generally restricts its purchase of insurance to situations where this is required for legal or contractual reasons. This is becauseexternal insurance is not considered an economic means of financing losses for the group. Losses will therefore be borne as they arise rather thanbeing spread over time through insurance premiums with attendant transaction costs. The position is reviewed periodically.
42. Capital commitmentsAuthorized future capital expenditure for property, plant and equipment by group companies for which contracts had been placed at 31 December2009 amounted to $9,812 million (2008 $14,062 million). In addition, at 31 December 2009, the group had contracts in place for future capitalexpenditure relating to investments in jointly controlled entities of $622 million (2008 $644 million) and investments in associates of $170 million (2008$160 million).
BP’s share of capital commitments of jointly controlled entities amounted to $926 million (2008 $1,540 million).
BOL08439_p170 174.qxp:20 F 5/3/10 17:33 Page 174 Bleed: 0�mm Scale: 100%

175
Notes on financial statements
Fin
an
cia
l sta
tem
en
ts
BOL08439_p175 197.qxp:20 F 5/3/10 17:33 Page 175 Bleed: 0�mm Scale: 100%
43. Subsidiaries, jointly controlled entities and associatesThe more important subsidiaries, jointly controlled entities and associates of the group at 31 December 2009 and the group percentage of ordinaryshare capital or joint venture interest (to nearest whole number) are set out below. The principal country of operation is generally indicated by thecompany’s country of incorporation or by its name. Those held directly by the parent company are marked with an asterisk (*), the percentage ownedbeing that of the group unless otherwise indicated. A complete list of investments in subsidiaries, jointly controlled entities and associates will beattached to the parent company’s annual return made to the Registrar of Companies.
Country of Country ofSubsidiaries % incorporation Principal activities Subsidiaries % incorporation Principal activities
International Netherlands*BP Corporate Holdings 100 England Investment holding BP Capital 100 Netherlands FinanceBP Exploration Op. Co. 100 England Exploration and production BP Nederland 100 Netherlands Refining and marketing
*BP Global Investments 100 England Investment holding*BP International 100 England Integrated oil operations New ZealandBP Oil International 100 England Integrated oil operations BP Oil New Zealand 100 New Zealand Marketing
*BP Shipping 100 England Shipping*Burmah Castrol 100 Scotland Lubricants NorwayJupiter Insurance 100 Guernsey Insurance BP Norge 100 Norway Exploration and production
Algeria SpainBP Amoco Exploration BP España 100 Spain Refining and marketing
(In Amenas) 100 Scotland Exploration and productionBP Exploration (El South Africa
Djazair) 100 Bahamas Exploration and production *BP Southern Africa 75 South Africa Refining and marketing
Angola Trinidad & TobagoBP Exploration (Angola) 100 England Exploration and production BP Trinidad and
Tobago 70 US Exploration and productionAustralia
BP Oil Australia 100 Australia Integrated oil operations UKBP Australia Capital BP Capital Markets 100 England Finance
Markets 100 Australia Finance BP Oil UK 100 England MarketingBP Developments Britoil 100 Scotland Exploration and production
Australia 100 Australia Exploration and productionBP Finance Australia 100 Australia Finance US
*BP Holdings NorthAzerbaijan America 100 England Investment holding
Amoco Caspian Sea British Virgin Exploration and production Atlantic Richfield Co.Petroleum 100 Islands BP America
BP Exploration BP America (Caspian Sea) 100 England Exploration and production Production
CompanyCanada BP Amoco Chemical
BP Canada Energy 100 Canada Exploration and production Company Exploration and production,BP Canada Finance 100 Canada Finance BP Company refining and marketing,100 US
North America pipelines and petrochemicalsEgypt BP Corporation
BP Egypt Co. 100 US Exploration and production North AmericaBP Exploration
Germany (Alaska) Inc.Deutsche BP 100 Germany Refining and marketing BP Products
and petrochemicals North AmericaBP West Coast
Indonesia ProductsBP Berau 100 US Exploration and production Standard Oil Co.
BP Capital MarketsAmerica Finance

176
Notes on financial statements
BOL08439_p175 197.qxp:20 F 5/3/10 17:33 Page 176 Bleed: 0�mm Scale: 100%
43. Subsidiaries, jointly controlled entities and associates continuedCountry of incorporation
Jointly controlled entities % or registration Principal activities
Angola LNG Supply Services 14 US LNG processing and transportationAtlantic 4 Holdings 38 US LNG manufactureAtlantic LNG 2/3 Company of Trinidad and Tobago 43 Trinidad & Tobago LNG manufactureBP-Husky Refining 50 US RefiningElvary Neftegaz Holdings BV 49 Netherlands Exploration and appraisalPan American Energya 60 US Exploration and productionPetromonagas 17 Venezuela Exploration and productionRuhr Oel 50 Germany Refining and marketing and petrochemicalsShanghai SECCO Petrochemical Co. 50 China PetrochemicalsSunrise Oil Sands 50 Canada Exploration and productionUnited Gas Derivatives Company 33 Egypt LNG manufactureWatson Cogenerationa 51 US Power generation
aThe entity is not controlled by BP as certain key business decisions require joint approval of both BP and the minority partner. It is therefore classified as a jointly controlled entity rather than a subsidiary.
Associates % Country of incorporation Principal activities
Abu DhabiAbu Dhabi Marine Areas 37 England Crude oil productionAbu Dhabi Petroleum Co. 24 England Crude oil production
AzerbaijanThe Baku-Tbilisi-Ceyhan Pipeline Co. 30 Cayman Islands PipelinesSouth Caucasus Pipeline Co. 26 Cayman Islands Pipelines
RussiaTNK-BP 50 British Virgin Islands Integrated oil operations
Trinidad & TobagoAtlantic LNG Company of Trinidad and Tobago 34 Trinidad & Tobago LNG manufacture

177
Notes on financial statements
Fin
an
cia
l sta
tem
en
ts
BOL08439_p175 197.qxp:20 F 5/3/10 17:33 Page 177 Bleed: 0�mm Scale: 100%
44. Condensed consolidating information on certain US subsidiariesBP p.l.c. fully and unconditionally guarantees the payment obligations of its 100% owned subsidiary BP Exploration (Alaska) Inc. under the BP PrudhoeBay Royalty Trust. The following financial information for BP p.l.c., BP Exploration (Alaska) Inc. and all other subsidiaries on a condensed consolidatingbasis is intended to provide investors with meaningful and comparable financial information about BP p.l.c. and its subsidiary issuers of registeredsecurities and is provided pursuant to Rule 3-10 of Regulation S-X in lieu of the separate financial statements of each subsidiary issuer of public debtsecurities. Investments include the investments in subsidiaries recorded under the equity method for the purposes of the condensed consolidatingfinancial information. Equity income of subsidiaries is the group’s share of profit related to such investments. The eliminations and reclassificationscolumn includes the necessary amounts to eliminate the intercompany balances and transactions between BP p.l.c., BP Exploration (Alaska) Inc. andother subsidiaries. The financial information presented in the following tables for BP Exploration (Alaska) Inc. for all years includes equity income arisingfrom subsidiaries of BP Exploration (Alaska) Inc. some of which operate outside of Alaska and excludes the BP group’s midstream operations in Alaskathat are reported through different legal entities and that are included within the ‘other subsidiaries’ column in these tables. BP p.l.c. also fully andunconditionally guarantees securities issued by BP Capital Markets p.l.c. and BP Capital Markets America Inc. These companies are 100%-ownedfinance subsidiaries of BP p.l.c.
Income statement
$ million
For the year ended 31 December 2009
Issuer Guarantor
BP Eliminations
Exploration Other and
(Alaska) Inc. BP p.l.c. subsidiaries reclassifications BP group
Sales and other operating revenues 4,189 – 239,272 (4,189) 239,272
Earnings from jointly controlled entities – after interest and tax – – 1,286 – 1,286
Earnings from associates – after interest and tax – – 2,615 – 2,615
Equity-accounted income of subsidiaries – after interest and tax 838 17,315 – (18,153) –
Interest and other revenues 17 144 832 (201) 792Gains on sale of businesses and fixed assets – 9 2,173 (9) 2,173
Total revenues and other income 5,044 17,468 246,178 (22,552) 246,138
Purchases 510 – 167,451 (4,189) 163,772
Production and manufacturing expenses 970 – 22,232 – 23,202
Production and similar taxes 602 – 3,150 – 3,752
Depreciation, depletion and amortization 424 – 11,682 – 12,106
Impairment and losses on sale of businesses and fixed assets – – 2,333 – 2,333
Exploration expense – – 1,116 – 1,116
Distribution and administration expenses 27 1,145 12,974 (108) 14,038
Fair value gain on embedded derivatives – – (607) – (607)
Profit before interest and taxation 2,511 16,323 25,847 (18,255) 26,426
Finance costs 22 26 1,155 (93) 1,110
Net finance (income) expense relating to pensions and other post-retirement benefits 10 (310) 492 – 192
Profit before taxation 2,479 16,607 24,200 (18,162) 25,124
Taxation 583 20 7,762 – 8,365
Profit for the year 1,896 16,587 16,438 (18,162) 16,759
Attributable toBP shareholders 1,896 16,587 16,257 (18,162) 16,578
Minority interest – – 181 – 181
1,896 16,587 16,438 (18,162) 16,759

178
Notes on financial statements
BOL08439_p175 197.qxp:20 F 5/3/10 17:33 Page 178 Bleed: 0�mm Scale: 100%
44. Condensed consolidating information on certain US subsidiaries continuedIncome statement continued
$ million
For the year ended 31 December 2008
Issuer Guarantor
BP EliminationsExploration Other and
(Alaska) Inc. BP p.l.c. subsidiaries reclassifications BP group
Sales and other operating revenues 6,782 – 361,143 (6,782) 361,143Earnings from jointly controlled entities – after interest and tax – – 3,023 – 3,023Earnings from associates – after interest and tax – – 798 – 798Equity-accounted income of subsidiaries – after interest and tax 469 20,295 – (20,764) –Interest and other revenues 514 173 1,025 (976) 736Gains on sale of businesses and fixed assets – – 1,353 – 1,353Total revenues and other income 7,765 20,468 367,342 (28,522) 367,053Purchases 895 – 272,869 (6,782) 266,982Production and manufacturing expenses 1,083 – 25,673 – 26,756Production and similar taxes 2,343 – 6,610 – 8,953Depreciation, depletion and amortization 365 – 10,620 – 10,985Impairment and losses on sale of businesses and fixed assets – – 1,733 – 1,733Exploration expense – – 882 – 882Distribution and administration expenses 22 28 15,469 (107) 15,412Fair value loss on embedded derivatives – – 111 – 111Profit before interest and taxation 3,057 20,440 33,375 (21,633) 35,239Finance costs 158 169 2,089 (869) 1,547Net finance (income) expense relating to pensions and
other post-retirement benefits – (822) 231 – (591)Profit before taxation 2,899 21,093 31,055 (20,764) 34,283Taxation 944 (64) 11,737 – 12,617Profit for the year 1,955 21,157 19,318 (20,764) 21,666Attributable to
BP shareholders 1,955 21,157 18,809 (20,764) 21,157Minority interest – – 509 – 509
1,955 21,157 19,318 (20,764) 21,666

179
Notes on financial statements
Fin
an
cia
l sta
tem
en
ts
BOL08439_p175 197.qxp:20 F 5/3/10 17:33 Page 179 Bleed: 0�mm Scale: 100%
44. Condensed consolidating information on certain US subsidiaries continuedIncome statement continued
$ million
For the year ended 31 December 2007
Issuer Guarantor
BP EliminationsExploration Other and
(Alaska) Inc. BP p.l.c. subsidiaries reclassifications BP group
Sales and other operating revenues 5,243 – 284,365 (5,243) 284,365Earnings from jointly controlled entities – after interest and tax – – 3,135 – 3,135Earnings from associates – after interest and tax – – 697 – 697Equity-accounted income of subsidiaries – after interest and tax 586 21,201 – (21,787) –Interest and other revenues 758 205 1,166 (1,375) 754Gains on sale of businesses and fixed assets 1 – 2,486 – 2,487Total revenues and other income 6,588 21,406 291,849 (28,405) 291,438Purchases 650 – 205,359 (5,243) 200,766Production and manufacturing expenses 897 – 23,328 – 24,225Production and similar taxes 1,052 – 4,651 – 5,703Depreciation, depletion and amortization 388 – 10,191 – 10,579Impairment and losses on sale of businesses and fixed assets – – 1,679 – 1,679Exploration expense – – 756 – 756Distribution and administration expenses 22 921 14,536 (108) 15,371Fair value loss on embedded derivatives – – 7 – 7Profit before interest and taxation 3,579 20,485 31,342 (23,054) 32,352Finance costs 49 381 2,230 (1,267) 1,393Net finance (income) expense relating to pensions and
other post-retirement benefits – (820) 168 – (652)Profit before taxation 3,530 20,924 28,944 (21,787) 31,611Taxation 1,055 79 9,308 – 10,442Profit for the year 2,475 20,845 19,636 (21,787) 21,169Attributable to
BP shareholders 2,475 20,845 19,312 (21,787) 20,845Minority interest – – 324 – 324
2,475 20,845 19,636 (21,787) 21,169

180
Notes on financial statements
BOL08439_p175 197.qxp:20 F 5/3/10 17:33 Page 180 Bleed: 0�mm Scale: 100%
44. Condensed consolidating information on certain US subsidiaries continuedBalance sheet
$ million
At 31 December 2009
Issuer Guarantor
BP Eliminations
Exploration Other and
(Alaska) Inc. BP p.l.c. subsidiaries reclassifications BP group
Non-current assetsProperty, plant and equipment 7,366 – 100,909 – 108,275
Goodwill – – 8,620 – 8,620
Intangible assets 321 – 11,227 – 11,548
Investments in jointly controlled entities – – 15,296 – 15,296
Investments in associates – 2 12,961 – 12,963
Other investments – – 1,567 – 1,567
Subsidiaries – equity-accounted basis 4,424 101,760 – (106,184) –
Fixed assets 12,111 101,762 150,580 (106,184) 158,269
Loans 283 1,178 5,490 (5,912) 1,039
Other receivables – – 1,729 – 1,729
Derivative financial instruments – – 3,965 – 3,965
Prepayments – – 1,407 – 1,407
Deferred tax assets – – 516 – 516
Defined benefit pension plan surpluses – 1,071 319 – 1,390
12,394 104,011 164,006 (112,096) 168,315
Current assetsLoans – – 249 – 249
Inventories 221 – 22,384 – 22,605
Trade and other receivables 18,529 30,707 35,852 (55,557) 29,531
Derivative financial instruments – – 4,967 – 4,967
Prepayments 8 2 1,743 – 1,753
Current tax receivable – – 209 – 209
Cash and cash equivalents (22) 28 8,333 – 8,339
18,736 30,737 73,737 (55,557) 67,653
Total assets 31,130 134,748 237,743 (167,653) 235,968
Current liabilitiesTrade and other payables 4,662 2,374 83,725 (55,557) 35,204
Derivative financial instruments – – 4,681 – 4,681
Accruals – 27 6,175 – 6,202
Finance debt 55 – 9,054 – 9,109
Current tax payable 172 – 2,292 – 2,464
Provisions – – 1,660 – 1,660
4,889 2,401 107,587 (55,557) 59,320
Non-current liabilitiesOther payables 229 4,254 4,627 (5,912) 3,198
Derivative financial instruments – – 3,474 – 3,474
Accruals – 74 629 – 703
Finance debt – – 25,518 – 25,518
Deferred tax liabilities 1,872 149 16,641 – 18,662
Provisions 1,048 – 11,922 – 12,970
Defined benefit pension plan and other post-retirement benefit plan deficits – – 10,010 – 10,010
3,149 4,477 72,821 (5,912) 74,535
Total liabilities 8,038 6,878 180,408 (61,469) 133,855
Net assets 23,092 127,870 57,335 (106,184) 102,113
EquityBP shareholders’ equity 23,092 127,870 56,835 (106,184) 101,613
Minority interest – – 500 – 500
Total equity 23,092 127,870 57,335 (106,184) 102,113

181
Notes on financial statements
Fin
an
cia
l sta
tem
en
ts
BOL08439_p175 197.qxp:20 F 5/3/10 17:33 Page 181 Bleed: 0�mm Scale: 100%
44. Condensed consolidating information on certain US subsidiaries continuedBalance sheet continued
$ million
At 31 December 2008
Issuer Guarantor
BP EliminationsExploration Other and
(Alaska) Inc. BP p.l.c. subsidiaries reclassifications BP group
Non-current assetsProperty, plant and equipment 6,959 – 96,241 – 103,200Goodwill – – 9,878 – 9,878Intangible assets 243 – 10,017 – 10,260Investments in jointly controlled entities – – 23,826 – 23,826Investments in associates – 2 3,998 – 4,000Other investments – – 855 – 855Subsidiaries – equity-accounted basis 3,585 111,730 – (115,315) –Fixed assets 10,787 111,732 144,815 (115,315) 152,019Loansa 354 1,174 1,393 (1,926) 995Other receivables – – 710 – 710Derivative financial instruments – – 5,054 – 5,054Prepayments – – 1,338 – 1,338Defined benefit pension plan surpluses – 1,516 222 – 1,738
11,141 114,422 153,532 (117,241) 161,854Current assets
Loans – – 168 – 168Inventories 198 – 16,623 – 16,821Trade and other receivablesa 18,302 6,129 35,745 (30,915) 29,261Derivative financial instruments – – 8,510 – 8,510Prepayments 37 – 3,013 – 3,050Current tax receivable – – 377 – 377Cash and cash equivalents (10) 11 8,196 – 8,197
18,527 6,140 72,632 (30,915) 66,384Total assets 29,668 120,562 226,164 (148,156) 228,238Current liabilities
Trade and other payables 5,070 2,602 57,032 (31,060) 33,644Derivative financial instruments – – 8,977 – 8,977Accruals – 7 6,736 – 6,743Finance debt 55 – 15,685 – 15,740Current tax payable 162 – 2,982 – 3,144Provisions – – 1,545 – 1,545
5,287 2,609 92,957 (31,060) 69,793Non-current liabilities
Other payables 398 33 4,430 (1,781) 3,080Derivative financial instruments – – 6,271 – 6,271Accruals – 47 737 – 784Finance debt – – 17,464 – 17,464Deferred tax liabilities 1,630 322 14,246 – 16,198Provisions 1,074 – 11,034 – 12,108Defined benefit pension plan and other post-retirement
benefit plan deficits – – 10,431 – 10,4313,102 402 64,613 (1,781) 66,336
Total liabilities 8,389 3,011 157,570 (32,841) 136,129Net assets 21,279 117,551 68,594 (115,315) 92,109Equity
BP shareholders’ equity 21,279 117,551 67,788 (115,315) 91,303Minority interest – – 806 – 806
Total equity 21,279 117,551 68,594 (115,315) 92,109
aWithin Non-current assets – Loans, the amount of loans receivable by BP Exploration (Alaska) Inc. (BPXA) has been increased by $145 million from the amounts previously reported and within Currentliabilities – Trade and other payables, the amount of other payables of BPXA has been increased by $145 million to better reflect the commercial relationship between BPXA and certain other BPsubsidiaries.

182
Notes on financial statements
BOL08439_p175 197.qxp:20 F 5/3/10 17:33 Page 182 Bleed: 0�mm Scale: 100%
44. Condensed consolidating information on certain US subsidiaries continuedCash flow statement
$ million
2009
Issuer Guarantor
BP Eliminations
Exploration Other and
(Alaska) Inc. BP p.l.c. subsidiaries reclassifications BP group
Net cash provided by operating activities 1,022 14,514 47,466 (35,286) 27,716
Net cash used in investing activities (935) (4,227) (12,971) – (18,133)
Net cash used in financing activities (99) (10,270) (34,468) 35,286 (9,551)
Currency translation differences relating to cash and cash equivalents – – 110 – 110
(Decrease) increase in cash and cash equivalents (12) 17 137 – 142
Cash and cash equivalents at beginning of year (10) 11 8,196 – 8,197
Cash and cash equivalents at end of year (22) 28 8,333 – 8,339
$ million
2008
Issuer Guarantor
BP EliminationsExploration Other and
(Alaska) Inc. BP p.l.c. subsidiaries reclassifications BP group
Net cash provided by operating activitiesa 1,105 12,665 41,600 (17,275) 38,095Net cash used in investing activities (896) – (21,871) – (22,767)Net cash used in financing activitiesa (209) (12,898) (14,677) 17,275 (10,509)Currency translation differences relating to cash and cash equivalents – – (184) – (184)(Decrease) increase in cash and cash equivalents – (233) 4,868 – 4,635Cash and cash equivalents at beginning of year (10) 244 3,328 – 3,562Cash and cash equivalents at end of year (10) 11 8,196 – 8,197
aNet cash provided by operating activities and net cash used in financing activities for BP Exploration (Alaska) Inc. have both been reduced by $5,688 million from the amounts previously reported to betterreflect the substance of the commercial relationship between BP Exploration (Alaska) Inc. and certain other BP subsidiaries.
$ million
2007
Issuer Guarantor
BP EliminationsExploration Other and
(Alaska) Inc. BP p.l.c. subsidiaries reclassifications BP group
Net cash provided by operating activitiesb 716 15,403 25,195 (16,605) 24,709Net cash used in investing activities (532) 1 (14,306) – (14,837)Net cash used in financing activitiesb (189) (15,139) (10,312) 16,605 (9,035)Currency translation differences relating to cash and cash equivalents – – 135 – 135(Decrease) increase in cash and cash equivalents (5) 265 712 – 972Cash and cash equivalents at beginning of year (5) (21) 2,616 – 2,590Cash and cash equivalents at end of year (10) 244 3,328 – 3,562
bNet cash provided by operating activities and net cash used in financing activities for BP Exploration (Alaska) Inc. have both been reduced by $2,356 million from the amounts previously reported to betterreflect the substance of the commercial relationship between BP Exploration (Alaska) Inc. and certain other BP subsidiaries.

Supplementary information on oil and natural gas (unaudited)The regional analysis presented below is on a continent basis, with separate disclosure for countries that contain 15% or more of the total provedreserves (for subsidiaries plus equity-accounted entities), in accordance with revised SEC and FASB requirements. The comparative information for2008 and 2007 is also presented on this basis. For 2009, where relevant, information for equity-accounted entities is provided in the same level ofdetail as for subsidiaries. Also for 2009, proved reserves are based on revised SEC definitions.
Oil and gas reserves – certain definitions
Unless the context indicates otherwise, the following terms have the meanings shown below:
Proved oil and gas reservesProved oil and gas reserves are those quantities of oil and gas, which, by analysis of geoscience and engineering data, can be estimated withreasonable certainty to be economically producible – from a given date forward, from known reservoirs, and under existing economic conditions,operating methods, and government regulations – prior to the time at which contracts providing the right to operate expire, unless evidence indicatesthat renewal is reasonably certain, regardless of whether deterministic or probabilistic methods are used for the estimation. The project to extract thehydrocarbons must have commenced or the operator must be reasonably certain that it will commence the project within a reasonable time.(i) The area of the reservoir considered as proved includes:
(A) The area identified by drilling and limited by fluid contacts, if any, and(B) Adjacent undrilled portions of the reservoir that can, with reasonable certainty, be judged to be continuous with it and to contain economically
producible oil or gas on the basis of available geoscience and engineering data.(ii) In the absence of data on fluid contacts, proved quantities in a reservoir are limited by the lowest known hydrocarbons (LKH) as seen in a well
penetration unless geoscience, engineering, or performance data and reliable technology establishes a lower contact with reasonable certainty.(iii) Where direct observation from well penetrations has defined a highest known oil (HKO) elevation and the potential exists for an associated gas
cap, proved oil reserves may be assigned in the structurally higher portions of the reservoir only if geoscience, engineering, or performance dataand reliable technology establish the higher contact with reasonable certainty.
(iv) Reserves which can be produced economically through application of improved recovery techniques (including, but not limited to, fluid injection)are included in the proved classification when:(A) Successful testing by a pilot project in an area of the reservoir with properties no more favorable than in the reservoir as a whole, the operation
of an installed program in the reservoir or an analogous reservoir, or other evidence using reliable technology establishes the reasonablecertainty of the engineering analysis on which the project or program was based; and
(B) The project has been approved for development by all necessary parties and entities, including governmental entities.(v) Existing economic conditions include prices and costs at which economic producibility from a reservoir is to be determined. The price shall be the
average price during the 12-month period prior to the ending date of the period covered by the report, determined as an unweighted arithmeticaverage of the first-day-of-the-month price for each month within such period, unless prices are defined by contractual arrangements, excludingescalations based upon future conditions.
Undeveloped oil and gas reservesUndeveloped oil and gas reserves are reserves of any category that are expected to be recovered from new wells on undrilled acreage, or fromexisting wells where a relatively major expenditure is required for recompletion.(i) Reserves on undrilled acreage shall be limited to those directly offsetting development spacing areas that are reasonably certain of production
when drilled, unless evidence using reliable technology exists that establishes reasonable certainty of economic producibility at greater distances.(ii) Undrilled locations can be classified as having undeveloped reserves only if a development plan has been adopted indicating that they are
scheduled to be drilled within five years, unless the specific circumstances, justify a longer time.(iii) Under no circumstances shall estimates for undeveloped reserves be attributable to any acreage for which an application of fluid injection or other
improved recovery technique is contemplated, unless such techniques have been proved effective by actual projects in the same reservoir or ananalogous reservoir, or by other evidence using reliable technology establishing reasonable certainty.
Developed oil and gas reservesDeveloped oil and gas reserves are reserves of any category that can be expected to be recovered: (i) Through existing wells with existing equipment and operating methods or in which the cost of the required equipment is relatively minor compared
to the cost of a new well; and (ii) Through installed extraction equipment and infrastructure operational at the time of the reserves estimate if the extraction is by means not
involving a well.
For details on BP’s proved reserves and production compliance and governance processes, see pages 20 to 22.
183
Supplementary information on oil and natural gas (unaudited)
Fin
an
cia
l sta
tem
en
ts
BOL08439_p175 197.qxp:20 F 5/3/10 17:33 Page 183 Bleed: 0�mm Scale: 100%

184
Supplementary information on oil and natural gas (unaudited)
BOL08439_p175 197.qxp:20 F 5/3/10 17:33 Page 184 Bleed: 0�mm Scale: 100%
Oil and natural gas exploration and production activities
$ million
2009
Europe North South Africa Asia Australasia Total
America America
Rest of
Rest of North Rest of
UK Europe US America Russia Asia
Subsidiariesa
Capitalized costs at 31 Decemberb
Gross capitalized costsProved properties 35,096 6,644 64,366 3,967 8,346 24,476 – 10,900 2,894 156,689
Unproved properties 752 – 5,464 147 198 2,377 – 733 1,039 10,710
35,848 6,644 69,830 4,114 8,544 26,853 – 11,633 3,933 167,399
Accumulated depreciation 26,794 3,306 31,728 2,309 4,837 12,492 – 4,798 1,038 87,302
Net capitalized costs 9,054 3,338 38,102 1,805 3,707 14,361 – 6,835 2,895 80,097
Costs incurred for the year ended 31 Decemberb
Acquisition of propertiesc
Proved 179 – (17) – – – – 306 – 468
Unproved (1) – 370 1 – 18 – – 10 398
178 – 353 1 – 18 – 306 10 866
Exploration and appraisal costsd 183 – 1,377 79 78 712 8 315 53 2,805
Development 751 1,054 4,208 386 453 2,707 – 560 277 10,396
Total costs 1,112 1,054 5,938 466 531 3,437 8 1,181 340 14,067
Results of operations for the year ended 31 DecemberSales and other operating revenuese
Third parties 2,239 68 4,759 99 1,525 1,846 – 636 785 11,957
Sales between businesses 2,482 809 11,313 484 1,409 5,313 – 6,257 726 28,793
4,721 877 16,072 583 2,934 7,159 – 6,893 1,511 40,750
Exploration expenditure 59 – 663 80 16 219 8 49 22 1,116
Production costs 1,243 164 2,821 284 395 908 15 361 70 6,261
Production taxes (3) – 649 1 220 – – 2,854 72 3,793
Other costs (income)f (1,259) 51 2,353 145 184 144 76 967 178 2,839
Depreciation, depletion and amortization 1,148 185 3,857 170 697 2,041 – 757 96 8,951
Impairments and (gains) losses on sale of businesses and fixed assets (122) (7) (208) – (11) (1) – (702)j – (1,051)
1,066 393 10,135 680 1,501 3,311 99 4,286 438 21,909
Profit before taxationg 3,655 484 5,937 (97) 1,433 3,848 (99) 2,607 1,073 18,841
Allocable taxes 1,568 76 1,902 (58) 916 1,517 (25) 682 2 6,580
Results of operations 2,087 408 4,035 (39) 517 2,331 (74) 1,925 1,071 12,261
Exploration and Production segment replacement cost profit before interest and taxExploration and production activities –
subsidiaries (as above) 3,655 484 5,937 (97) 1,433 3,848 (99) 2,607 1,073 18,841
Midstream activities – subsidiariesh 925 17 719 833 17 (27) (37) 518 (315) 2,650
Equity-accounted entitiesi – 5 29 134 630 56 1,924 531 – 3,309
Total replacement cost profit before interest and tax 4,580 506 6,685 870 2,080 3,877 1,788 3,656 758 24,800
aThese tables contain information relating to oil and natural gas exploration and production activities of subsidiaries. Midstream activities relating to the management and ownership of crude oil and naturalgas pipelines, processing and export terminals and LNG processing facilities and transportation are excluded. In addition, our midstream activities of marketing and trading of natural gas, power and NGL’s inthe US, Canada, UK and Europe are excluded. The most significant midstream pipeline interests include the Trans-Alaska Pipeline System, the Forties Pipeline System, the Central Area Transmission Systempipeline, the South Caucasus Pipeline and the Baku-Tbilisi-Ceyhan pipeline. Major LNG activities are located in Trinidad, Indonesia and Australia and BP is also investing in the LNG business in Angola.
bDecommissioning assets are included in capitalized costs at 31 December but are excluded from costs incurred for the year.c Includes costs capitalized as a result of asset exchanges.dIncludes exploration and appraisal drilling expenditures, which are capitalized within intangible assets, and geological and geophysical exploration costs, which are charged to income as incurred.ePresented net of transportation costs, purchases and sales taxes.f Includes property taxes, other government take and the fair value gain on embedded derivatives of $663 million. The UK region includes a $783 million gain offset by corresponding charges primarily inthe US, relating to the group self-insurance programme.
gExcludes the unwinding of the discount on provisions and payables amounting to $308 million which is included in finance costs in the group income statement.hMidstream activities exclude inventory holding gains and losses.iThe profits of equity-accounted entities are included after interest and tax.j Includes the gain on disposal of upstream assets associated with our sale of our 46% stake in LukArco (see Note 3).

185
Supplementary information on oil and natural gas (unaudited)
Fin
an
cia
l sta
tem
en
ts
–
41
41
60
72
BOL08439_p175 197.qxp:20 F 5/3/10 17:33 Page 185 Bleed: 0�mm Scale: 100%
Oil and natural gas exploration and production activities continued
$ million
2009
Europe North South Africa Asia Australasia Total
America America
Rest of
Rest of North Rest of
UK Europe US America Russia Asia
Equity-accounted entities (BP share)a
Capitalized costs at 31 Decemberb
Gross capitalized costsProved properties – – – – 5,789 – 13,266 2,259 – 21,314
Unproved properties – – – 1,378 197 – 737 – – 2,312
– – – 1,378 5,986 – 14,003 2,259 – 23,626
Accumulated depreciation – – – – 2,084 – 5,550 1,739 – 9,373
Net capitalized costs – – – 1,378 3,902 – 8,453 520 – 14,253
Costs incurred for the year ended 31 Decemberb
Acquisition of propertiesc
Proved – – – – – – – – –
Unproved – – – – 31 – 10 – –
– – – – 31 – 10 – –
Exploration and appraisal costsd – – – – 21 – 77 3 – 101
Development – – – 30 538 – 1,182 246 – 1,996
Total costs – – – 30 590 – 1,269 249 – 2,138
Results of operations for the year ended 31 DecemberSales and other operating revenuese
Third parties – – – – 1,977 – 4,919 351 – 7,247
Sales between businesses – – – – – – 2,838 – – 2,838
– – – – 1,977 – 7,757 351 – 10,085
Exploration expenditure – – – – 23 – 37 – –
Production costs – – – – 354 – 1,428 159 – 1,941
Production taxes – – – – 702 – 2,597 – – 3,299
Other costs (income) – – – – (69) – 12 (2) – (59)
Depreciation, depletion and amortization – – – – 281 – 1,073 274 – 1,628
Impairments and (gains) losses on sale of businesses and fixed assets – – – – – – 72 – –
– – – – 1,291 – 5,219 431 – 6,941
Profit before taxation – – – – 686 – 2,538 (80) – 3,144
Allocable taxes – – – – 270 – 501 – – 771
Results of operations – – – – 416 – 2,037 (80) – 2,373
Exploration and production activities –equity-accounted entities (as above) – – – – 416 – 2,037 (80) – 2,373
Midstream and other activities after taxf – 5 29 134 214 56 (113) 611 – 936
Total replacement cost profit after interest and tax – 5 29 134 630 56 1,924 531 – 3,309
aThese tables contain information relating to oil and natural gas exploration and production activities of equity-accounted entities. Midstream activities relating to the management and ownership of crudeoil and natural gas pipelines, processing and export terminals and LNG processing facilities and transportation as well as downstream activities of TNK-BP are excluded. The amounts reported for equity-accounted entities exclude the corresponding amounts for their equity-accounted entities.
bDecommissioning assets are included in capitalized costs at 31 December but are excluded from costs incurred for the year.c Includes costs capitalized as a result of asset exchanges.d Includes exploration and appraisal drilling expenditures, which are capitalized within intangible assets, and geological and geophysical exploration costs, which are charged to income as incurred. ePresented net of transportation costs, purchases and sales taxes.f Includes interest, minority interest and the net results of equity-accounted entities of equity-accounted entities.

186
Supplementary information on oil and natural gas (unaudited)
BOL08439_p175 197.qxp:20 F 5/3/10 17:33 Page 186 Bleed: 0�mm Scale: 100%
Oil and natural gas exploration and production activities continued
$ million
2008
Europe North South Africa Asia Australasia TotalAmerica America
Rest ofRest of North Rest of
UK Europe US America Russia Asia
Subsidiariesa
Capitalized costs at 31 Decemberb
Gross capitalized costsProved properties 34,614 5,507 59,918 3,517 7,934 21,563 – 10,689 2,581 146,323Unproved properties 626 – 5,006 165 134 2,011 – 465 1,018 9,425
35,240 5,507 64,924 3,682 8,068 23,574 – 11,154 3,599 155,748Accumulated depreciation 26,564 3,125 28,511 2,141 4,217 10,451 – 4,395 945 80,349Net capitalized costs 8,676 2,382 36,413 1,541 3,851 13,123 – 6,759 2,654 75,399
The group’s share of equity-accounted entities’ net capitalized costs at 31 December 2008 was $13,393 million.
Costs incurred for the year ended 31 Decemberb
Acquisition of propertiesc
Proved – – 1,374 2 – – – 136 – 1,512Unproved 4 – 2,942 – – – – 41 – 2,987
4 – 4,316 2 – – – 177 – 4,499Exploration and appraisal costsd 137 – 862 33 90 838 12 269 49 2,290Development 907 695 4,914 309 768 2,966 – 859 349 11,767Total costs 1,048 695 10,092 344 858 3,804 12 1,305 398 18,556
The group’s share of equity-accounted entities’ costs incurred in 2008 was $3,259 million: in Russia $1,921 million, South America $1,039 million, andRest of Asia $299 million.
Results of operations for the year ended 31 DecemberSales and other operating revenuese
Third parties 3,865 105 8,010 147 3,339 3,745 – 1,186 860 21,257Sales between businesses 4,374 1,416 15,610 1,237 2,605 6,022 – 11,249 1,171 43,684
8,239 1,521 23,620 1,384 5,944 9,767 – 12,435 2,031 64,941Exploration expenditure 121 1 305 32 30 213 14 140 26 882Production costs 1,357 150 3,002 289 429 875 18 485 62 6,667Production taxesf 503 – 2,603 2 358 – – 5,510 110 9,086Other costs (income)f g (28) (43) 3,440 343 198 (122)k 196 2,064 226 6,274Depreciation, depletion and amortization 1,049 199 2,729 181 730 2,120 – 788 87 7,883 Impairments and (gains) losses on sale
of businesses and fixed assets – – 308 2 4 8 – 219 – 541 3,002 307 12,387 849 1,749 3,094 228 9,206 511 31,333
Profit before taxationh 5,237 1,214 11,233 535 4,195 6,673 (228) 3,229 1,520 33,608Allocable taxes 2,280 883 3,857 205 2,218 2,672 (36) 984 513 13,576Results of operations 2,957 331 7,376 330 1,977 4,001 (192) 2,245 1,007 20,032
The group’s share of equity-accounted entities’ results of operations (including the group’s share of total TNK-BP results) in 2008 was a profit of $2,793million after deducting interest of $355 million, taxation of $1,217 million and minority interest of $169 million.
Exploration and Production segment replacement cost profit before interest and taxExploration and production activities
Subsidiaries (as above) 5,237 1,214 11,233 535 4,195 6,673 (228) 3,229 1,520 33,608Equity-accounted entities (1) – 1 40 304 (1) 2,259 191 – 2,793
Midstream activitiesi j 743 16 490 673 274 112 – (272) (129) 1,907Total replacement cost profit
before interest and tax 5,979 1,230 11,724 1,248 4,773 6,784 2,031 3,148 1,391 38,308
aThese tables contain information relating to oil and natural gas exploration and production activities. Midstream activities relating to the management and ownership of crude oil and natural gas pipelines,processing and export terminals and LNG processing facilities and transportation are excluded. In addition, our midstream activities of marketing and trading of natural gas, power and NGLs in the US,Canada, UK and Europe are excluded. The most significant midstream pipeline interests include the Trans-Alaska Pipeline System, the Forties Pipeline System, the Central Area Transmission Systempipeline, the South Caucasus Pipeline and the Baku-Tbilisi-Ceyhan pipeline. Major LNG activities are located in Trinidad, Indonesia and Australia and BP is also investing in the LNG business in Angola. Thegroup’s share of equity-accounted entities’ activities are excluded from the tables and included in the footnotes, with the exception of Abu Dhabi production taxes, which are included in the results ofoperations above.
b Decommissioning assets are included in capitalized costs at 31 December but are excluded from costs incurred for the year.c Includes costs capitalized as a result of asset exchanges.d Includes exploration and appraisal drilling expenditures, which are capitalized within intangible assets, and geological and geophysical exploration costs, which are charged to income as incurred.ePresented net of transportation costs, purchases and sales taxes.fComparative figures have been restated to include in Production taxes amounts previously reported within Other costs (income) amounting to $2,427 million.g Includes property taxes, other government take and the fair value loss on embedded derivatives of $102 million. The UK region includes a $499 million gain offset by corresponding charges primarily
in the US, relating to the group self-insurance programme.hExcludes the unwinding of the discount on provisions and payables amounting to $285 million which is included in finance costs in the group income statement.i Includes a $517 million write-down of our investment in Rosneft based on its quoted market price at the end of the year.j Midstream activities exclude inventory holding gains and losses.k Includes $367 million previously reported within the ‘Other’ region.

187
Supplementary information on oil and natural gas (unaudited)
Fin
an
cia
l sta
tem
en
ts
BOL08439_p175 197.qxp:20 F 5/3/10 17:33 Page 187 Bleed: 0�mm Scale: 100%
Oil and natural gas exploration and production activities continued
$ million
2007
Europe North South Africa Asia Australasia TotalAmerica America
Rest ofRest of North Rest of
UK Europe US America Russia Asia
Subsidiariesa
Capitalized costs at 31 Decemberb
Gross capitalized costsProved properties 34,774 4,925 53,079 3,261 7,366 18,333 – 9,629 1,495 132,862Unproved properties 606 – 1,660 182 115 1,533 4 536 1,001 5,637
35,380 4,925 54,739 3,443 7,481 19,866 4 10,165 2,496 138,499Accumulated depreciation 25,515 2,925 25,500 1,968 3,560 8,315 – 3,638 423 71,844Net capitalized costs 9,865 2,000 29,239 1,475 3,921 11,551 4 6,527 2,073 66,655
The group’s share of equity-accounted entities’ net capitalized costs at 31 December 2007 was $11,787 million.
Costs incurred for the year ended 31 Decemberb
Acquisition of propertiesc
Proved – – 245 – – – – 232 – 477Unproved – – 54 16 – 321 – 126 – 517
– – 299 16 – 321 – 358 – 994Exploration and appraisal costsd 209 16 646 40 32 677 119 118 35 1,892Development 804 443 3,861 240 817 2,634 – 1,109 245 10,153Total costs 1,013 459 4,806 296 849 3,632 119 1,585 280 13,039
The group’s share of equity-accounted entities’ costs incurred in 2007 was $2,552 million: in Russia $1,787 million, South America $569 million, andRest of Asia $196 million.
Results of operations for the year ended 31 DecemberSales and other operating revenuese
Third parties 4,503 434 1,436 147 1,995 2,219 – 1,388 681 12,803Sales between businesses 2,260 902 14,353 868 2,274 3,223 – 10,137 816 34,833
6,763 1,336 15,789 1,015 4,269 5,442 – 11,525 1,497 47,636Exploration expenditure 46 – 252 57 77 183 116 18 7 756Production costs 1,658 147 2,782 267 503 637 2 470 64 6,530Production taxesf 227 3 1,260 1 272 – – 3,914 56 5,733Other costs (income)f g (419) 123 2,505 237 158 224j 169 1,316 366 4,679Depreciation, depletion and amortization 1,569 207 2,118 169 653 1,372 – 1,148 52 7,288 Impairments and (gains) losses on sale
of businesses and fixed assets 112 (534) (413) (38) (5) (76) – – – (954)3,193 (54) 8,504 693 1,658 2,340 287 6,866 545 24,032
Profit before taxationh 3,570 1,390 7,285 322 2,611 3,102 (287) 4,659 952 23,604Allocable taxes 1,664 611 2,560 35 1,167 1,462 3 1,133 267 8,902Results of operations 1,906 779 4,725 287 1,444 1,640 (290) 3,526 685 14,702
The group’s share of equity-accounted entities’ results of operations (including the group’s share of total TNK-BP results) in 2007 was a profit of $2,704million after deducting interest of $401 million, taxation of $1,355 million and minority interest of $215 million.
Exploration and Production segment replacement cost profit before interest and taxExploration and production activities
Subsidiaries (as above) 3,570 1,390 7,285 322 2,611 3,102 (287) 4,659 952 23,604Equity-accounted entities – – 1 (33) 414 – 2,292 30 – 2,704
Midstream activitiesi 15 12 643 626 13 96 (112) 38 (37) 1,294Total replacement cost profit
before interest and tax 3,585 1,402 7,929 915 3,038 3,198 1,893 4,727 915 27,602
a These tables contain information relating to oil and natural gas exploration and production activities. Midstream activities relating to the management and ownership of crude oil and natural gaspipelines, processing and export terminals and LNG processing facilities and transportation are excluded. In addition, our midstream activities of marketing and trading of natural gas, power andNGLs in the US, Canada, UK and Europe are excluded. The most significant midstream pipeline interests include the Trans-Alaska Pipeline System, the Forties Pipeline System, the Central AreaTransmission System pipeline, the South Caucasus Pipeline and the Baku-Tbilisi-Ceyhan pipeline. Major LNG activities are located in Trinidad, Indonesia and Australia. The group’s share of equity-accounted entities’ activities are excluded from the tables and included in the footnotes with the exception of the Abu Dhabi operations which are included in the results of operations above.
b Decommissioning assets are included in capitalized costs at 31 December but are excluded from costs incurred for the year.c Includes costs capitalized as a result of asset exchanges.d Includes exploration and appraisal drilling expenditures, which are capitalized within intangible assets, and geological and geophysical exploration costs, which are charged to income as incurred. ePresented net of transportation costs, purchases and sales taxes.fComparative figures have been restated to include in Production taxes amounts previously reported within Other costs (income) amounting to $1,690 million.g Includes property taxes, other government take and the fair value gain on embedded derivatives of $47 million. The UK region includes a $409 million gain offset by corresponding charges primarily in
the US, relating to the group self-insurance programme.hExcludes the unwinding of the discount on provisions and payables amounting to $179 million which is included in finance costs in the group income statement.i Midstream activities exclude inventory holding gains and losses.j Includes $24 million previously reported within the ‘Other’ region.

188
Supplementary information on oil and natural gas (unaudited)
Movements in estimated net proved reserves
2
58
–
90
BOL08439_p175 197.qxp:20 F 5/3/10 17:33 Page 188 Bleed: 0�mm Scale: 100%
million barrels
Crude oila 2009
Europe North South Africa Asia Australasia Total
America America
Rest of
Rest of North Rest of
UK Europe USe America Russia Asia
SubsidiariesAt 1 January 2009
Developed 410 81 1,717 11 47 464 – 195 56 2,981
Undeveloped 119 194 1,273 1 55 496 – 488 58 2,684
529 275 2,990 12 102 960 – 683 114 5,665
Changes attributable toRevisions of previous estimates 7 (1) 165 2 18 (121) – (128) 3 (55)
Improved recovery 42 7 82 – 7 32 – 31 2 203
Purchases of reserves-in-place 1 – – – – – – 1 –
Discoveries and extensions 184 – 73 – – 114 – – 7 378
Productionb (61) (14) (237) (2) (22) (109) – (45) (11) (501)
Sales of reserves-in-place (8) – – – – – – (26) – (34)
165 (8) 83 – 3 (84) – (167) 1 (7)
At 31 December 2009c
Developed 403 83 1,862 11 49 422 – 182 58 3,070
Undeveloped 291 184 1,211 1 56 454 – 334 57 2,588
694 267 3,073 12 105 876 – 516 115 5,658
Equity-accounted entities (BP share)f
At 1 January 2009Developed – – – – 399 – 2,227 499 – 3,125
Undeveloped – – – – 409 11 944 199 – 1,563
– – – – 808 11 3,171 698 – 4,688
Changes attributable toRevisions of previous estimates – – – – 2 (2) 590 (28) – 562
Improved recovery – – – – 50 – 8 – –
Purchases of reserves-in-place – – – – – – – – –
Discoveries and extensions – – – – 3 – 87 – –
Production – – – – (37) – (307) (71) – (415)
Sales of reserves-in-place – – – – (14) – – (116) – (130)
– – – – 4 (2) 378 (215) – 165
At 31 December 2009d
Developed – – – – 407 – 2,351 363 – 3,121
Undeveloped – – – – 405 9 1,198 120 – 1,732
– – – – 812 9 3,549 483 – 4,853
Total subsidiaries and equity-accounted entities (BP share)At 1 January 2009
Developed 410 81 1,717 11 446 464 2,227 694 56 6,106
Undeveloped 119 194 1,273 1 464 507 944 687 58 4,247
529 275 2,990 12 910 971 3,171 1,381 114 10,353
At 31 December 2009Developed 403 83 1,862 11 456 422 2,351 545 58 6,191
Undeveloped 291 184 1,211 1 461 463 1,198 454 57 4,320
694 267 3,073 12 917 885 3,549 999 115 10,511
a Crude oil includes NGLs and condensate. Proved reserves exclude royalties due to others, whether payable in cash or in kind, where the royalty owner has a direct interest in the underlyingproduction and the option and ability to make lifting and sales arrangements independently.
bExcludes NGLs from processing plants in which an interest is held of 26 thousand barrels a day.c Includes 819 million barrels of NGLs. Also includes 23 million barrels of crude oil in respect of the 30% minority interest in BP Trinidad and Tobago LLC.d Includes 20 million barrels of NGLs. Also includes 243 million barrels of crude oil in respect of the 6.86% minority interest in TNK-BP.e Proved reserves in the Prudhoe Bay field in Alaska include an estimated 68 million barrels upon which a net profits royalty will be payable over the life of the field under the terms of the BP Prudhoe
Bay Royalty Trust.fVolumes of equity-accounted entities include volumes of equity-accounted investments of those entities.

189
Supplementary information on oil and natural gas (unaudited)
Fin
an
cia
l sta
tem
en
ts
–
29
BOL08439_p175 197.qxp:20 F 5/3/10 17:33 Page 189 Bleed: 0�mm Scale: 100%
Movements in estimated net proved reserves continued
billion cubic feet
Natural gasa 2009
Europe North South Africa Asia Australasia Total
America America
Rest of
Rest of North Rest of
UK Europe US America Russia Asia
SubsidiariesAt 1 January 2009
Developed 1,822 61 9,059 659 3,316 1,050 – 1,102 1,887 18,956
Undeveloped 582 402 5,473 468 7,434 1,382 – 1,308 4,000 21,049
2,404 463 14,532 1,127 10,750 2,432 – 2,410 5,887 40,005
Changes attributable toRevisions of previous estimates (114) (8) 549 43 322 270 – (231) 22 853
Improved recovery 34 – 550 5 322 49 – 82 75 1,117
Purchases of reserves-in-place 159 – – – – – – 31 – 190
Discoveries and extensions 150 – 496 94 105 59 – – 531 1,435
Productionb (243) (9) (907) (100) (929) (249) – (241) (189) (2,867)
Sales of reserves-in-place (118) – (4) – – – – (223) – (345)
(132) (17) 684 42 (180) 129 – (582) 439 383
At 31 December 2009c
Developed 1,602 49 9,583 716 3,177 1,107 – 1,579 3,219 21,032
Undeveloped 670 397 5,633 453 7,393 1,454 – 249 3,107 19,356
2,272 446 15,216 1,169 10,570 2,561 – 1,828 6,326 40,388
Equity-accounted entities (BP share)e
At 1 January 2009Developed – – – – 1,498 – 1,560 176 – 3,234
Undeveloped – – – – 1,023 182 653 111 – 1,969
– – – – 2,521 182 2,213 287 – 5,203
Changes attributable toRevisions of previous estimates – – – – (26) (17) 204 (19) – 142
Improved recovery – – – – 314 – 1 4 – 319
Purchases of reserves-in-place – – – – – – – – –
Discoveries and extensions – – – – 6 – 23 – –
Productionb – – – – (165) – (219) (25) – (409)
Sales of reserves-in-place – – – – (388) – – (154) – (542)
– – – – (259) (17) 9 (194) – (461)
At 31 December 2009d
Developed – – – – 1,252 – 1,703 80 – 3,035
Undeveloped – – – – 1,010 165 519 13 – 1,707
– – – – 2,262 165 2,222 93 – 4,742
Total subsidiaries and equity-accounted entities (BP share)At 1 January 2009
Developed 1,822 61 9,059 659 4,814 1,050 1,560 1,278 1,887 22,190
Undeveloped 582 402 5,473 468 8,457 1,564 653 1,419 4,000 23,018
2,404 463 14,532 1,127 13,271 2,614 2,213 2,697 5,887 45,208
At 31 December 2009Developed 1,602 49 9,583 716 4,429 1,107 1,703 1,659 3,219 24,067
Undeveloped 670 397 5,633 453 8,403 1,619 519 262 3,107 21,063
2,272 446 15,216 1,169 12,832 2,726 2,222 1,921 6,326 45,130
a Proved reserves exclude royalties due to others, whether payable in cash or in kind, where the royalty owner has a direct interest in the underlying production and the option and ability to makelifting and sales arrangements independently.
b Includes 195 billion cubic feet of natural gas consumed in operations, 164 billion cubic feet in subsidiaries, 31 billion cubic feet in equity-accounted entities and excludes 16 billion cubic feet of producednon-hydrocarbon components which meet regulatory requirements for sales.
c Includes 3,068 billion cubic feet of natural gas in respect of the 30% minority interest in BP Trinidad and Tobago LLC.d Includes 131 billion cubic feet of natural gas in respect of the 5.79% minority interest in TNK-BP.e Volumes of equity-accounted entities include volumes of equity-accounted investments of those entities.

190
Supplementary information on oil and natural gas (unaudited)
Movements in estimated net proved reserves continued
–
62
39
(1)
BOL08439_p175 197.qxp:20 F 5/3/10 17:33 Page 190 Bleed: 0�mm Scale: 100%
million barrels
Crude oila 2008
Europe North South Africa Asia Australasia TotalAmerica America
Rest ofRest of North Rest of
UK Europe USe America Russia Asia
SubsidiariesAt 1 January 2008
Developed 414 105 1,882 13 102 256 – 121 44 2,937Undeveloped 123 169 1,265 1 202 350 – 372 73 2,555
537 274 3,147 14 304 606 – 493 117 5,492Changes attributable to
Revisions of previous estimates 16 (11) (212) 1 7 264 – 194 5 264 Improved recovery 39 28 182 – 8 18 – 43 3 321Purchases of reserves-in-place – – – – – – – – –Discoveries and extensions – – 64 – 5 173 – – – 242 Productionb (63) (16) (191) (3) (23) (101) – (47) (11) (455)Sales of reserves-in-place – – – – (199) – – – – (199)
(8) 1 (157) (2) (202) 354 – 190 (3) 173At 31 December 2008c
Developed 410 81 1,717 11 47 464 – 195 56 2,981Undeveloped 119 194 1,273 1 55 496 – 488 58 2,684
529 275 2,990 12 102 960 – 683 114 5,665
Equity-accounted entities (BP share)f
At 1 January 2008Developed – – – – 328 – 2,094 574 – 2,996Undeveloped – – – – 243 – 1,137 205 – 1,585
– – – – 571 – 3,231 779 – 4,581Changes attributable to
Revisions of previous estimates – – – – (3) 11 217 (1) – 224Improved recovery – – – – 62 – – – – Purchases of reserves-in-place – – – – 199 – – – – 199 Discoveries and extensions – – – – 13 – 26 – –Production – – – – (34) – (302) (80) – (416)Sales of reserves-in-place – – – – – – (1) – –
– – – – 237 11 (60) (81) – 107At 31 December 2008d
Developed – – – – 399 – 2,227 499 – 3,125Undeveloped – – – – 409 11 944 199 – 1,563
– – – – 808 11 3,171 698 – 4,688
Total subsidiaries and equity-accounted entities (BP share)At 1 January 2008
Developed 414 105 1,882 13 430 256 2,094 695 44 5,933Undeveloped 123 169 1,265 1 445 350 1,137 577 73 4,140
537 274 3,147 14 875 606 3,231 1,272 117 10,073At 31 December 2008
Developed 410 81 1,717 11 446 464 2,227 694 56 6,106Undeveloped 119 194 1,273 1 464 507 944 687 58 4,247
529 275 2,990 12 910 971 3,171 1,381 114 10,353
a Crude oil includes NGLs and condensate. Proved reserves exclude royalties due to others, whether payable in cash or in kind, where the royalty owner has a direct interest in the underlyingproduction and the option and ability to make lifting and sales arrangements independently.
bExcludes NGLs from processing plants in which an interest is held of 19 thousand barrels a day.c Includes 807 million barrels of NGLs. Also includes 21 million barrels of crude oil in respect of the 30% minority interest in BP Trinidad and Tobago LLC.d Includes 36 million barrels of NGLs. Also includes 216 million barrels of crude oil in respect of the 6.80% minority interest in TNK-BP.e Proved reserves in the Prudhoe Bay field in Alaska include an estimated 54 million barrels upon which a net profits royalty will be payable over the life of the field under the terms of the BP Prudhoe
Bay Royalty Trust.fVolumes of equity-accounted entities include volumes of equity-accounted investments of those entities.

191
Supplementary information on oil and natural gas (unaudited)
Fin
an
cia
l sta
tem
en
ts
Movements in estimated net proved reserves continued
(3)
3
–
BOL08439_p175 197.qxp:20 F 5/3/10 17:33 Page 191 Bleed: 0�mm Scale: 100%
billion cubic feet
Natural gasa 2008
Europe North South Africa Asia Australasia TotalAmerica America
Rest ofRest of North Rest of
UK Europe US America Russia Asia
SubsidiariesAt 1 January 2008
Developed 2,049 63 10,670 608 3,075 990 – 1,270 1,135 19,860Undeveloped 553 410 4,705 421 7,973 1,410 – 1,269 4,529 21,270
2,602 473 15,375 1,029 11,048 2,400 – 2,539 5,664 41,130Changes attributable to
Revisions of previous estimates 23 (8) (2,063) 51 (456) 142 – – 361 (1,950)Improved recovery 77 9 1,322 16 159 6 – 108 2 1,699Purchases of reserves-in-place – – 183 – – – – – – 183 Discoveries and extensions – – 549 125 948 82 – 37 – 1,741 Productionb (298) (11) (834) (94) (946) (198) – (274) (140) (2,795)Sales of reserves-in-place – – – – (3) – – – –
(198) (10) (843) 98 (298) 32 – (129) 223 (1,125)At 31 December 2008c
Developed 1,822 61 9,059 659 3,316 1,050 – 1,102 1,887 18,956Undeveloped 582 402 5,473 468 7,434 1,382 – 1,308 4,000 21,049
2,404 463 14,532 1,127 10,750 2,432 – 2,410 5,887 40,005
Equity-accounted entities (BP share)e
At 1 January 2008Developed – – – – 1,478 – 808 187 – 2,473Undeveloped – – – – 831 – 353 113 – 1,297
– – – – 2,309 – 1,161 300 – 3,770Changes attributable to
Revisions of previous estimates – – – – (96) 182 1,273 (2) – 1,357Improved recovery – – – – 301 – – 11 – 312Purchases of reserves-in-place – – – – 3 – – – –Discoveries and extensions – – – – 192 – – – – 192 Productionb – – – – (188) – (221) (22) – (431)Sales of reserves-in-place – – – – – – – – –
– – – – 212 182 1,052 (13) – 1,433At 31 December 2008d
Developed – – – – 1,498 – 1,560 176 – 3,234Undeveloped – – – – 1,023 182 653 111 – 1,969
– – – – 2,521 182 2,213 287 – 5,203
Total subsidiaries and equity-accounted entities (BP share)At 1 January 2008
Developed 2,049 63 10,670 608 4,553 990 808 1,457 1,135 22,333Undeveloped 553 410 4,705 421 8,804 1,410 353 1,382 4,529 22,567
2,602 473 15,375 1,029 13,357 2,400 1,161 2,839 5,664 44,900At 31 December 2008
Developed 1,822 61 9,059 659 4,814 1,050 1,560 1,278 1,887 22,190Undeveloped 582 402 5,473 468 8,457 1,564 653 1,419 4,000 23,018
2,404 463 14,532 1,127 13,271 2,614 2,213 2,697 5,887 45,208
a Proved reserves exclude royalties due to others, whether payable in cash or in kind, where the royalty owner has a direct interest in the underlying production and the option and ability to makelifting and sales arrangements independently.
b Includes 193 billion cubic feet of natural gas consumed in operations, 149 billion cubic feet in subsidiaries, 44 billion cubic feet in equity-accounted entities and excludes 17 billion cubic feet of producednon-hydrocarbon components which meet regulatory requirements for sales.
c Includes 3,108 billion cubic feet of natural gas in respect of the 30% minority interest in BP Trinidad and Tobago LLC.d Includes 131 billion cubic feet of natural gas in respect of the 5.92% minority interest in TNK-BP.eVolumes of equity-accounted entities include volumes of equity-accounted investments of those entities.

192
Supplementary information on oil and natural gas (unaudited)
33
60 16
BOL08439_p175 197.qxp:20 F 5/3/10 17:33 Page 192 Bleed: 0�mm Scale: 100%
Movements in estimated net proved reserves continued
million barrels
Crude oila 2007
Europe North South Africa Asia Australasia TotalAmerica America
Rest ofRest of North Rest of
UK Europe USf America Russia Asia
SubsidiariesAt 1 January 2007
Developed 458 189 1,916 15 115 193 – 104 51 3,041Undeveloped 146 97 1,292 2 235 512 – 487 81 2,852
604 286 3,208 17 350 705 – 591 132 5,893Changes attributable to
Revisions of previous estimates (1) (25) 18 – (29) (133) – (29) (5) (204)Improved recovery 7 1 99 – 6 12 – 6 – 131Purchases of reserves-in-place – – 25 – – – – 8 –Discoveries and extensions – 31 60 – 1 93 – – 2 187 Productionb (73) (19) (169) (3) (24) (71) – (83) (12) (454)Sales of reserves-in-place – – (94) – – – – – – (94)
(67) (12) (61) (3) (46) (99) – (98) (15) (401)At 31 December 2007c
Developed 414 105 1,882 13 102 256 – 121 44 2,937Undeveloped 123 169 1,265 1 202 350 – 372 73 2,555
537 274 3,147 14 304 606 – 493 117 5,492
Equity-accounted entities (BP share)d g
At 1 January 2007Developed – – – – 221 – 2,200 521 – 2,942Undeveloped – – – – 139 – 644 163 – 946
– – – – 360 – 2,844 684 – 3,888Changes attributable to
Revisions of previous estimates – – – – 178 – 413 167 – 758Improved recovery – – – – 59 – – 1 –Purchases of reserves-in-place – – – – – – 16 – –Discoveries and extensions – – – – 2 – 283 – – 285Production – – – – (28) – (304) (73) – (405)Sales of reserves-in-place – – – – – – (21) – – (21)
– – – – 211 – 387 95 – 693At 31 December 2007e
Developed – – – – 328 – 2,094 574 – 2,996Undeveloped – – – – 243 – 1,137 205 – 1,585
– – – – 571 – 3,231 779 – 4,581
Total subsidiaries and equity-accounted entities (BP share)At 1 January 2007
Developed 458 189 1,916 15 336 193 2,200 625 51 5,983Undeveloped 146 97 1,292 2 374 512 644 650 81 3,798
604 286 3,208 17 710 705 2,844 1,275 132 9,781At 31 December 2007
Developed 414 105 1,882 13 430 256 2,094 695 44 5,933Undeveloped 123 169 1,265 1 445 350 1,137 577 73 4,140
537 274 3,147 14 875 606 3,231 1,272 117 10,073
a Crude oil includes NGLs and condensate. Proved reserves exclude royalties due to others, whether payable in cash or in kind, where the royalty owner has a direct interest in the underlyingproduction and the option and ability to make lifting and sales arrangements independently.
bExcludes NGLs from processing plants in which an interest is held of 54 thousand barrels a day.c Includes 739 million barrels of NGLs. Also includes 20 million barrels of crude oil in respect of the 30% minority interest in BP Trinidad and Tobago LLC.d The BP group holds interests, through associates, in onshore and offshore concessions in Abu Dhabi, expiring in 2014 and 2018 respectively. During the second quarter of 2007, we updated our
reporting policy in Abu Dhabi to be consistent with general industry practice and as a result have started reporting production and reserves there gross of production taxes. This change resulted in anincrease in our reserves of 153 million barrels and in our production of 33mb/d.
e Includes 26 million barrels of NGLs. Also includes 210 million barrels of crude oil in respect of the 6.51% minority interest in TNK-BP. fProved reserves in the Prudhoe Bay field in Alaska include an estimated 98 million barrels upon which a net profits royalty will be payable over the life of the field under the terms of the BP PrudhoeBay Royalty Trust.
g Volumes of equity-accounted entities include volumes of equity-accounted investments of those entities.

193
Supplementary information on oil and natural gas (unaudited)
Fin
an
cia
l sta
tem
en
ts
Movements in estimated net proved reserves continued
8
22
–
BOL08439_p175 197.qxp:20 F 5/3/10 17:33 Page 193 Bleed: 0�mm Scale: 100%
billion cubic feet
Natural gasa 2007
Europe North South Africa Asia Australasia TotalAmerica America
Rest ofRest of North Rest of
UK Europe US America Russia Asia
SubsidiariesAt 1 January 2007
Developed 1,968 242 10,438 627 3,305 1,032 – 808 882 19,302 Undeveloped 825 56 4,660 310 8,884 1,675 – 1,781 4,675 22,866
2,793 298 15,098 937 12,189 2,707 – 2,589 5,557 42,168 Changes attributable to
Revisions of previous estimates 93 (37) 744 (72) (204) (146) – (21) 140 497 Improved recovery 15 1 326 32 – 9 – 100 16 499Purchases of reserves-in-place – – 23 – – – – 109 – 132Discoveries and extensions – 293 95 237 12 17 – – 88 742Productionb (299) (14) (879) (98) (949) (187) – (238) (137) (2,801)Sales of reserves-in-place – (68) (32) (7) – – – – – (107)
(191) 175 277 92 (1,141) (307) – (50) 107 (1,038)At 31 December 2007c
Developed 2,049 63 10,670 608 3,075 990 – 1,270 1,135 19,860 Undeveloped 553 410 4,705 421 7,973 1,410 – 1,269 4,529 21,270
2,602 473 15,375 1,029 11,048 2,400 – 2,539 5,664 41,130
Equity-accounted entities (BP share)e
At 1 January 2007Developed – – – – 1,460 – 1,087 222 – 2,769Undeveloped – – – – 735 – 184 75 – 994
– – – – 2,195 – 1,271 297 – 3,763Changes attributable to
Revisions of previous estimates – – – – 73 – 61 9 – 143 Improved recovery – – – – 195 – – 16 – 211Purchases of reserves-in-place – – – – – – 8 – –Discoveries and extensions – – – – 22 – – – –Productionb – – – – (176) – (179) (22) – (377)Sales of reserves-in-place – – – – – – – – –
– – – – 114 – (110) 3 – 7At 31 December 2007d
Developed – – – – 1,478 – 808 187 – 2,473Undeveloped – – – – 831 – 353 113 – 1,297
– – – – 2,309 – 1,161 300 – 3,770
Total subsidiaries and equity-accounted entities (BP share)At 1 January 2007
Developed 1,968 242 10,438 627 4,765 1,032 1,087 1,030 882 22,071 Undeveloped 825 56 4,660 310 9,619 1,675 184 1,856 4,675 23,860
2,793 298 15,098 937 14,384 2,707 1,271 2,886 5,557 45,931 At 31 December 2007
Developed 2,049 63 10,670 608 4,553 990 808 1,457 1,135 22,333 Undeveloped 553 410 4,705 421 8,804 1,410 353 1,382 4,529 22,567
2,602 473 15,375 1,029 13,357 2,400 1,161 2,839 5,664 44,900
a Proved reserves exclude royalties due to others, whether payable in cash or in kind, where the royalty owner has a direct interest in the underlying production and the option and ability to makelifting and sales arrangements independently.
b Includes 202 billion cubic feet of natural gas consumed in operations, 161 billion cubic feet in subsidiaries, 41 billion cubic feet in equity-accounted entities and excludes 10.9 billion cubic feet ofproduced non-hydrocarbon components which meet regulatory requirements for sales.
c Includes 3,211 billion cubic feet of natural gas in respect of the 30% minority interest in BP Trinidad and Tobago LLC.d Includes 68 billion cubic feet of natural gas in respect of the 5.88% minority interest in TNK-BP.e Volumes of equity-accounted entities include volumes of equity-accounted investments of those entities.

194
Supplementary information on oil and natural gas (unaudited)
Standardized measure of discounted future net cash flows and changes therein relating to proved oil and gas reserves
BOL08439_p175 197.qxp:20 F 5/3/10 17:33 Page 194 Bleed: 0�mm Scale: 100%
The following tables set out the standardized measure of discounted future net cash flows, and changes therein, relating to crude oil and natural gasproduction from the group’s estimated proved reserves. This information is prepared in compliance with FASB Oil and Gas Disclosures requirements.
Future net cash flows have been prepared on the basis of certain assumptions which may or may not be realized. These include the timing offuture production, the estimation of crude oil and natural gas reserves and the application of average crude oil and natural gas prices and exchange ratesfrom the previous 12 months. Furthermore, both proved reserves estimates and production forecasts are subject to revision as further technicalinformation becomes available and economic conditions change. BP cautions against relying on the information presented because of the highly arbitrarynature of the assumptions on which it is based and its lack of comparability with the historical cost information presented in the financial statements.
$ million
2009
Europe North South Africa Asia Australasia Total
America America
Rest of
Rest of North Rest of
UK Europe US America Russia Asia
At 31 December 2009SubsidiariesFuture cash inflowsa 50,800 17,700 204,000 4,900 26,400 58,400 – 36,100 32,500 430,800
Future production costb 20,000 8,000 91,300 2,700 6,700 12,000 – 9,200 11,000 160,900
Future development costb 5,000 2,500 24,900 1,000 5,600 12,200 – 6,400 3,100 60,700
Future taxationc 12,900 3,700 27,300 200 5,800 11,300 – 4,700 4,500 70,400
Future net cash flows 12,900 3,500 60,500 1,000 8,300 22,900 – 15,800 13,900 138,800
10% annual discountd 5,800 1,600 29,500 500 3,200 9,800 – 6,300 7,300 64,000
Standardized measure of discounted future net cash flowse 7,100 1,900 31,000 500 5,100 13,100 – 9,500 6,600 74,800
Equity-accounted entities (BP share)f
Future cash inflowsa – – – – 37,700 – 96,700 30,000 – 164,400
Future production costb – – – – 17,000 – 65,200 25,200 – 107,400
Future development costb – – – – 4,000 – 10,200 3,100 – 17,300
Future taxationc – – – – 5,200 – 4,300 100 – 9,600
Future net cash flows – – – – 11,500 – 17,000 1,600 – 30,100
10% annual discountd – – – – 6,800 – 7,900 800 – 15,500
Standardized measure of discounted future net cash flowsg h – – – – 4,700 – 9,100 800 – 14,600
Total subsidiaries and equity-accounted entitiesStandardized measure of discounted
future net cash flows 7,100 1,900 31,000 500 9,800 13,100 9,100 10,300 6,600 89,400
The following are the principal sources of change in the standardized measure of discounted future net cash flows:
$ million
Equity-accounted Total subsidiaries and
Subsidiaries entities (BP share) equity-accounted entities
Sales and transfers of oil and gas produced, net of production costs (18,900) (3,400) (22,300)
Previously estimated development costs incurred during the year 11,700 2,100 13,800
Extensions, discoveries and improved recovery, less related costs 8,500 1,600 10,100
Net changes in prices and production cost 37,200 5,900 43,100
Revisions of previous reserves estimates (4,300) (200) (4,500)
Net change in taxation (10,600) (1,600) (12,200)
Future development costs (600) 900 300
Net change in purchase and sales of reserves-in-place (100) (900) (1,000)
Addition of 10% annual discount 4,700 900 5,600
Total change in the standardized measure during the yeari 27,600 5,300 32,900
aThe marker prices used were Brent $59.91/bbl, Henry Hub $3.82/mmBtu.b Production costs, which include production taxes, and development costs relating to future production of proved reserves are based on the continuation of existing economic conditions. Future
decommissioning costs are included.cTaxation is computed using appropriate year-end statutory corporate income tax rates.d Future net cash flows from oil and natural gas production are discounted at 10% regardless of the group assessment of the risk associated with its producing activities.e Minority interest in BP Trinidad and Tobago LLC amounted to $1,300 million.f The standardized measure of discounted future net cash flows of equity-accounted entities includes standardized measure of discounted future net cash flows of equity-accounted investments of
those entities.gMinority interest in TNK-BP amounted to $600 million.hNo equity-accounted future cash flows in Africa because proved reserves are received as a result of contractual arrangements, with no associated costs.i Total change in the standardized measure during the year includes the effect of exchange rate movements.

195
Supplementary information on oil and natural gas (unaudited)
Fin
an
cia
l sta
tem
en
ts
BOL08439_p175 197.qxp:20 F 5/3/10 17:33 Page 195 Bleed: 0�mm Scale: 100%
Standardized measure of discounted future net cash flows and changes therein relating to proved oil and gas reserves continued
$ million
Europe North South Africa Asia Australasia TotalAmerica America
Rest ofRest of North Rest of
UK Europe US America Russia Asia
At 31 December 2008SubsidiariesFuture cash inflowsa 36,400 13,800 165,800 6,400 26,300 40,400 – 31,400 24,200 344,700Future production costb 18,100 6,300 80,400 2,700 7,200 11,600 – 11,800 10,700 148,800Future development costb 3,300 2,900 25,600 1,300 7,200 10,900 – 7,500 3,200 61,900Future taxationc 7,300 2,300 17,500 500 5,500 6,600 – 2,400 2,800 44,900Future net cash flows 7,700 2,300 42,300 1,900 6,400 11,300 – 9,700 7,500 89,10010% annual discountd 2,200 1,200 21,000 1,000 2,900 5,500 – 4,200 3,900 41,900Standardized measure of discounted
future net cash flowse 5,500 1,100 21,300 900 3,500 5,800 – 5,500 3,600 47,200
Equity-accounted entities (BP share)g
Standardized measure of discounted future net cash flowsh – – – – 3,600 – 4,800 900 – 9,300
Total subsidiaries and equity-accounted entitiesStandardized measure of discounted
future net cash flowse 5,500 1,100 21,300 900 7,100 5,800 4,800 6,400 3,600 56,500
At 31 December 2007SubsidiariesFuture cash inflowsa 72,100 29,500 350,100 7,500 60,200 63,300 – 55,100 41,900 679,700Future production costb 27,500 7,500 109,800 3,000 14,900 9,900 – 9,700 11,600 193,900Future development costb 4,000 3,300 21,900 700 5,800 8,300 – 3,900 3,700 51,600Future taxationc 20,200 13,000 71,600 900 20,800 17,100 – 9,800 8,600 162,000Future net cash flows 20,400 5,700 146,800 2,900 18,700 28,000 – 31,700 18,000 272,20010% annual discountd 6,500 2,800 76,000 1,300 8,200 9,400 – 12,600 9,200 126,000Standardized measure of discounted
future net cash flowse 13,900 2,900 70,800 1,600 10,500 18,600 – 19,100 8,800 146,200
Equity-accounted entities (BP share)g
Standardized measure of discounted future net cash flowsh – – – – 5,000 – 21,700 3,000 – 29,700
Total subsidiaries and equity-accounted entitiesStandardized measure of discounted
future net cash flowse 13,900 2,900 70,800 1,600 15,500 18,600 21,700 22,100 8,800 175,900
The following are the principal sources of change in the standardized measure of discounted future net cash flows for subsidiaries:
$ million
2008 2007
Sales and transfers of oil and gas produced, net of production costs (43,600) (28,300)Previously estimated development costs incurred during the year 9,400 9,400 Extensions, discoveries and improved recovery, less related costs 4,400 12,300 Net changes in prices and production cost (146,800) 102,100 Revisions of previous reserves estimates 1,200 (12,200)Net change in taxation 69,400 (28,300)Future development costs (7,400) (7,800)Net change in purchase and sales of reserves-in-place (200) (700)Addition of 10% annual discount 14,600 9,100Total change in the standardized measure during the year of subsidiariesf (99,000) 55,600
a The year-end marker prices used were 2008 Brent $36.55/bbl, Henry Hub $5.63/mmBtu and 2007 Brent $96.02/bbl, Henry Hub $7.10/mmBtu.b Production costs, which include production taxes, and development costs relating to future production of proved reserves are based on year-end cost levels and assume continuation of existing
economic conditions. Future decommissioning costs are included.c Taxation is computed using appropriate year-end statutory corporate income tax rates.d Future net cash flows from oil and natural gas production are discounted at 10% regardless of the group assessment of the risk associated with its producing activities.e Minority interest in BP Trinidad and Tobago LLC amounted to $900 million at 31 December 2008 and $2,300 million at 31 December 2007.f Total change in the standardized measure during the year includes the effect of exchange rate movements.g The standardized measure of discounted future net cash flows of equity-accounted entities includes standardized measure of discounted future net cash flows of equity-acccounted investments of
those entities.h Minority interest in TNK-BP amounted to $300 million at 31 December 2008 and $1,400 million at 31 December 2007.

196
Supplementary information on oil and natural gas (unaudited)
Operational and statistical information
The following tables present operational and statistical information related to production, drilling, productive wells and acreage.
Crude oil and natural gas production
The following table shows crude oil and natural gas production for the years ended 31 December 2009, 2008 and 2007.
Production for the yeara
BOL08439_p175 197.qxp:20 F 5/3/10 17:33 Page 196 Bleed: 0�mm Scale: 100%
Europe North South Africa Asia Australasia TotalAmerica America
Rest ofRest of North Rest of
UK Europe US America Russia Asia
SubsidiariesCrude oilb thousand barrels per day
2009 168 40 665 8 61 304 – 123 31 1,400
2008 173 43 538 9 66 277 – 128 29 1,2632007 201 51 513 8 74 195 – 228 34 1,304Natural gasc million cubic feet per day
2009 618 16 2,316 263 2,492 621 – 610 514 7,450
2008 759 23 2,157 245 2,532 484 – 696 381 7,2772007 768 29 2,174 255 2,543 468 – 609 376 7,222Equity-accounted entities (BP share)Crude oilb thousand barrels per day
2009 – – – – 101 – 840 194 – 1,135
2008 – – – – 92 – 826 220 – 1,1382007 – – – – 77 – 832 201 – 1,110Natural gasc million cubic feet per day
2009 – – – – 392 – 601 42 – 1,035
2008 – – – – 454 – 564 39 – 1,0572007 – – – – 429 – 451 41 – 921
aProduction excludes royalties due to others, whether payable in cash or in kind, where the royalty owner has a direct interest in the underlying production and the option and ability to make lifting andsales arrangements independently.
bCrude oil includes natural gas liquids and condensate. cNatural gas production excludes gas consumed in operations.
Productive oil and gas wells and acreage
The following tables show the number of gross and net productive oil and natural gas wells and total gross and net developed and undeveloped oil andnatural gas acreage in which the group and its equity-accounted entities had interests as at 31 December 2009. A ‘gross’ well or acre is one in which awhole or fractional working interest is owned, while the number of ‘net’ wells or acres is the sum of the whole or fractional working interests in grosswells or acres. Productive wells are producing wells and wells capable of production. Developed acreage is the acreage within the boundary of a field,on which development wells have been drilled, which could produce the reserves; while undeveloped acres are those on which wells have not beendrilled or completed to a point that would permit the production of commercial quantities, whether or not such acres contain proved reserves. Thesetables do not include any information relating to our recent entry into Iraq.
Europe North South Africa Asia Australasia TotalAmerica America
Rest ofRest of North Rest of
UK Europe US America Russia Asia
Number of productive wells at 31 December 2009Oil wellsa – gross 282 83 5,793 197 3,650 668 20,593 1,657 13 32,936
– net 151 26 2,090 76 2,045 529 8,750 303 2 13,972
Gas wellsb – gross 279 – 21,974 1,852 487 104 46 563 68 25,373
– net 133 – 12,359 1,236 171 47 23 258 15 14,242
a Includes approximately 3,982 gross (1,750 net) multiple completion wells (more than one formation producing into the same well bore). b Includes approximately 2,834 gross (1,841 net) multiple completion wells. If one of the multiple completions in a well is an oil completion, the well is classified as an oil well.
Europe North South Africa Asia Australasia TotalAmerica America
Rest ofRest of North Rest of
UK Europe US America Russia Asia
Oil and natural gas acreage at 31 December 2009 Thousands of acres
Developed – gross 366 65 7,587 1,186 1,740 539 4,123 2,191 200 17,997
– net 201 19 4,609 850 470 222 1,794 842 39 9,046
Undevelopeda – gross 1,602 486 7,985 6,967 7,361 105,512 10,357 15,191 4,109 159,570
– net 919 226 4,979 5,009 3,471 33,341 4,683 6,597 911 60,136
aUndeveloped acreage includes leases and concessions.

197
Supplementary information on oil and natural gas (unaudited)
Fin
an
cia
l sta
tem
en
ts
BOL08439_p175 197.qxp:20 F 5/3/10 17:34 Page 197 Bleed: 0�mm Scale: 100%
Net oil and gas wells completed or abandoned
The following table shows the number of net productive and dry exploratory and development oil and natural gas wells completed or abandoned in theyears indicated by the group and its equity-accounted entities. Productive wells include wells in which hydrocarbons were encountered and the drillingor completion of which, in the case of exploratory wells, has been suspended pending further drilling or evaluation. A dry well is one found to beincapable of producing hydrocarbons in sufficient quantities to justify completion.
Europe North South Africa Asia Australasia Total
America America
Rest of
Rest of North Rest of
UK Europe US America Russia Asia
2009ExploratoryProductive 0.1 – 47.2 – 3.0 4.5 7.0 5.3 0.6 67.7
Dry 0.2 – 4.2 – – 1.4 4.5 6.0 0.2 16.5
DevelopmentProductive 9.3 1.5 403.8 17.9 135.4 20.8 293.0 45.8 1.6 929.1
Dry – – 3.3 – – 0.5 4.0 0.4 0.6 8.8
2008ExploratoryProductive 0.8 – 2.4 – 4.4 4.3 12.5 0.5 0.6 25.5Dry – 0.5 0.9 0.1 0.4 2.6 23.0 0.5 0.4 28.4
DevelopmentProductive 6.6 0.5 379.8 28.3 112.5 18.6 10.0 45.4 4.5 606.2Dry 0.2 – 1.1 0.9 2.9 1.5 19.5 2.1 – 28.2
2007ExploratoryProductive 1.6 – 4.1 0.5 – 6.1 16.0 1.7 1.1 31.1Dry – – 0.7 0.5 – 1.6 9.0 1.4 – 13.2
DevelopmentProductive 0.4 0.8 401.2 36.0 10.0 15.3 246.0 27.5 2.1 739.3Dry 0.6 – 4.2 8.8 – – 9.5 – – 23.1
Drilling and production activities in progress
The following table shows the number of exploratory and development oil and natural gas wells in the process of being drilled by the group and its equity-accounted entities as at 31 December 2009. Suspended development wells and long-term suspended exploratory wells are also included in the table.
Europe North South Africa Asia Australasia Total
America America
Rest of
Rest of North Rest of
UK Europe US America Russia Asia
At 31 December 2009ExploratoryGross – – 112.0 4.0 – 5.0 8.0 3.0 – 132.0
Net – – 30.2 1.8 – 2.6 4.0 2.0 – 40.6
DevelopmentGross 4.0 1.0 366.0 30.0 15.0 23.0 45.0 16.0 – 500.0
Net 2.7 0.3 176.9 19.8 9.2 7.5 20.0 3.4 – 239.8

198
SignaturesThe registrant hereby certifies that it meets all of the requirements for filing on Form 20-F and that it has duly caused and authorized the undersignedto sign this annual report on its behalf.
BP p.l.c.(Registrant)
/s/D.J. JACKSOND.J. JacksonCompany Secretary
Dated: 5 March 2010
Fin
an
cia
l sta
tem
en
ts
BOL08439_p198.qxp:20 F 5/3/10 17:34 Page 198 Bleed: 0�mm Scale: 100%

AcknowledgementsDesign sasdesign.co.ukTypesetting Bowne, LondonPrinting St Ives Westerham Press Ltd, UK,ISO 14001, FSC-certifi ed and CarbonNeutral®
Paper This Annual Report on Form 20-F is printed on FSC-certifi ed Revive Pure White Uncoated (cover) and Revive Pure White Offset (text pages). This paper has been independently certi fied according to the rules of the Forest Stewardship Council (FSC) and was manufactured at a mill that holds ISO 14001 accreditation. The inks used are all vegetable oil based.
© BP p.l.c. 2010

bp.com/form20F
Annual Reporton Form 20–F2009
What’s inside?
beyond petroleum®
BP A
nnual Report on Form
20–F 2009
5 Business review6 Group overview18 Exploration and Production32 Refi ning and Marketing38 Other businesses and corporate40 Research and technology42 Corporate responsibility48 Relationships with suppliers and contractors48 Regulation of the group’s business48 Organizational structure49 Financial performance57 Liquidity and capital resources
61 Board performance and biographies62 Directors and senior management65 Board performance report
77 Directors’ remuneration report78 Part 1 Summary80 Part 2 Executive directors’ remuneration87 Part 3 Non-executive directors’ remuneration
89 Additional information forshareholders90 Critical accounting policies92 Property, plants and equipment 92 Share ownership94 Major shareholders and related party transactions94 Dividends95 Legal proceedings96 Share prices and listings97 Memorandum and Articles of Association99 Exchange controls99 Taxation101 Documents on display101 Controls and procedures102 Code of ethics102 Principal accountants’ fees and services102 Corporate governance practices103 Purchases of equity securities by the issuer and affi liated purchasers103 Fees and charges payable by a holder of ADSs104 Fees and payments made by the Depositary to the issuer104 Called-up share capital 104 Administration104 Annual general meeting105 Exhibits
107 Financial statements108 Consolidated fi nancial statements of the BP group114 Notes on fi nancial statements183 Supplementary information on oil and
natural gas (unaudited)