bojangles’ new nnn lease with a 7.54% average cap rate ... · shown bojangles’ to be the...
TRANSCRIPT

For investment information:
J. Tyson Glasser, CCIM • Investment Sales Director
[email protected] • 864.263.5427 o • 404.435.6312 c
102 West Perennial Drive, Temple, GA 30179 · 1.05 Acres · 3,808 Square Feet · $2,470,000 · 6.50% Cap Rate
Bojangles’ - New NNN Lease with a 7.54% Average Cap Rate Over 20 Years
Subject Property
Table of Contents
Property Cover................................................1 Table of Contents...........................................2 Investment Highlights..................................3 Investment Summary....................................4 Location Map & Aerial..................................5 As-Built Survey................................................6 Tenant Profile...................................................7 Market Profile..................................................8 Demographics..........................................9-11 Contact Information...................................12
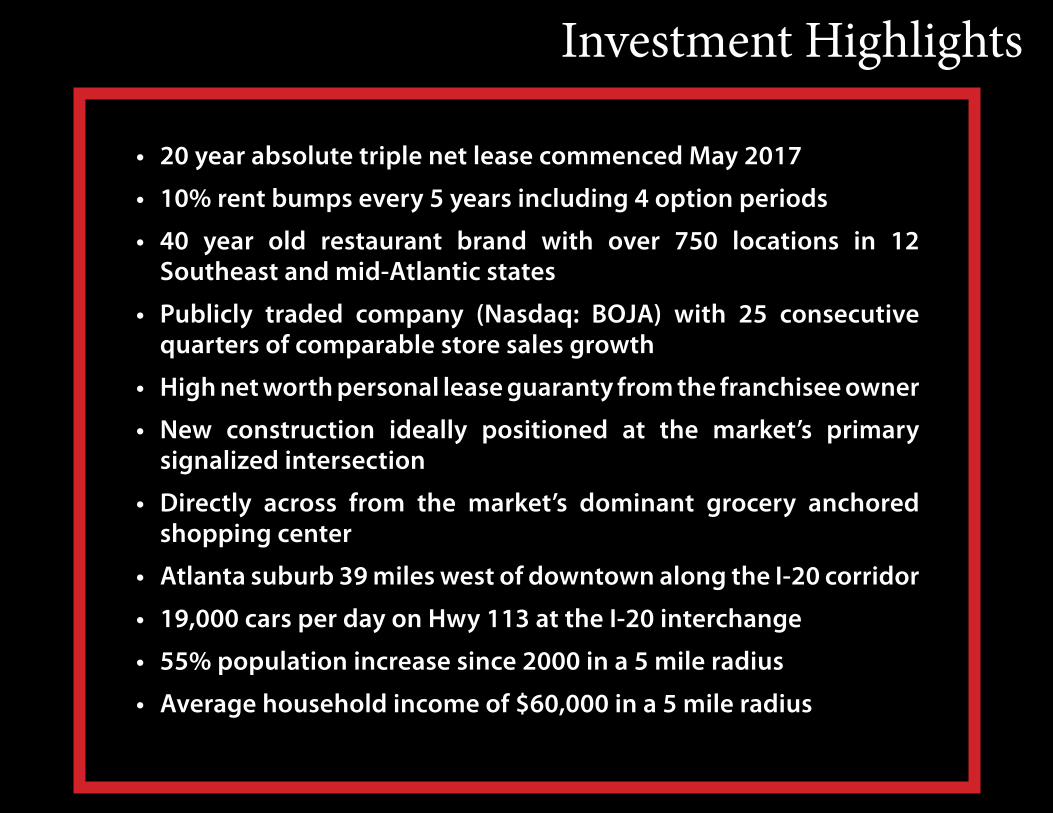
• 20 year absolute triple net lease commenced May 2017
• 10% rent bumps every 5 years including 4 option periods
• 40 year old restaurant brand with over 750 locations in 12 Southeast and mid-Atlantic states
• Publicly traded company (Nasdaq: BOJA) with 25 consecutive quarters of comparable store sales growth
• High net worth personal lease guaranty from the franchisee owner
• New construction ideally positioned at the market’s primary signalized intersection
• Directly across from the market’s dominant grocery anchored shopping center
• Atlanta suburb 39 miles west of downtown along the I-20 corridor
• 19,000 cars per day on Hwy 113 at the I-20 interchange
• 55% population increase since 2000 in a 5 mile radius
• Average household income of $60,000 in a 5 mile radius
Investment Highlights

Investment SummaryAsking Price: $2,470,000
CAP Rate: 6.50% (increases to 7.15% on 6/1/22, 7.86% on 6/1/27 and 8.65% on 6/1/32)
Address: 102 West Perennial Drive, Temple, GA 30179
Land Size: 1.05 Acres and 45,738 Square Feet
Building Size: 3,808 Square Feet with Drive Thru
Building Age: New construction completed May 2017
Tenant/Guarantor: Bovilla, LLC (personal guarantees included)
Lease Type: Absolute Triple Net with zero Landlord responsibility
Lease Term: 20 year initial term with 4 renewal options of 5 years each
Lease Commencement: May 15, 2017
Lease Expiration: May 31, 2037
Annual Base Rent: $160,577.00 (Estimated years 1-5)
Rental Increases: 10% every 5 years including renewal options
Frontage: +/- 215 Feet on W Perrenial Drive
+/- 186 on GA Hwy 113
Access: One entrance/exit on W. Perennial Dr. and one entrance/exit on GA Hwy 113
Parking: 45 total spaces with 2 handicap spaces
Zoning: DCD
Traffic Counts: +/- 19,000 on GA Hwy 113 (2015 data)
+/- 44,700 in I-20 (2015 data)
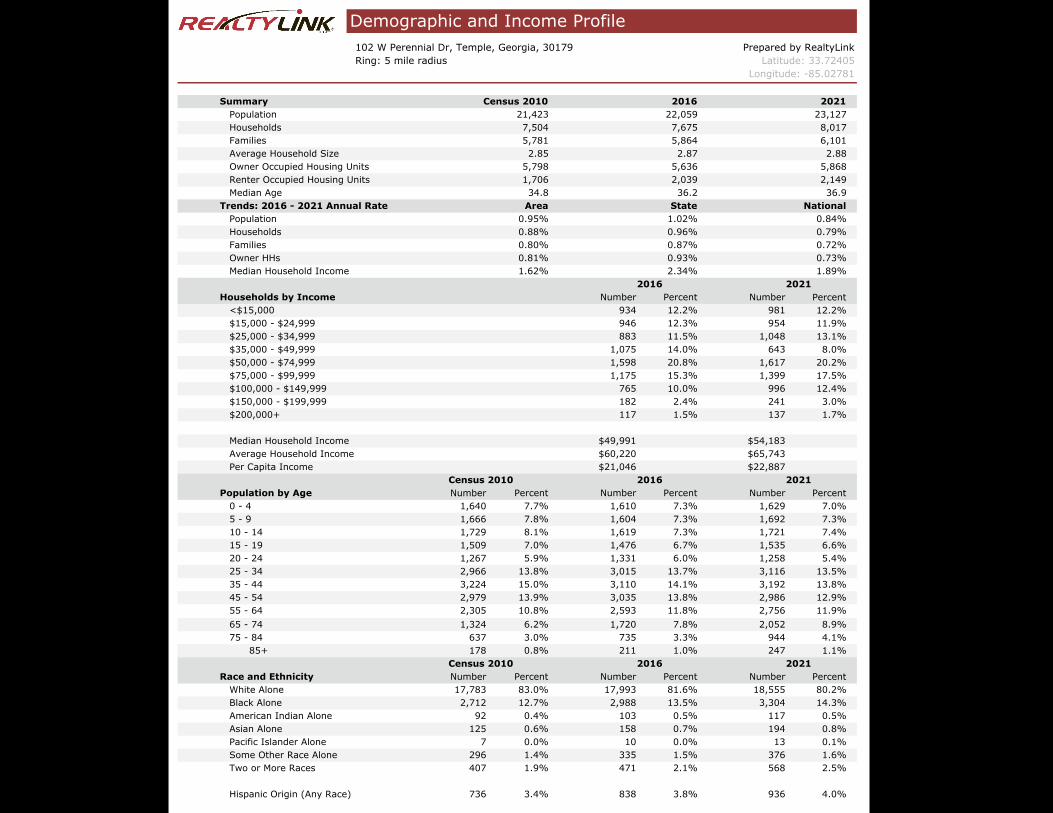
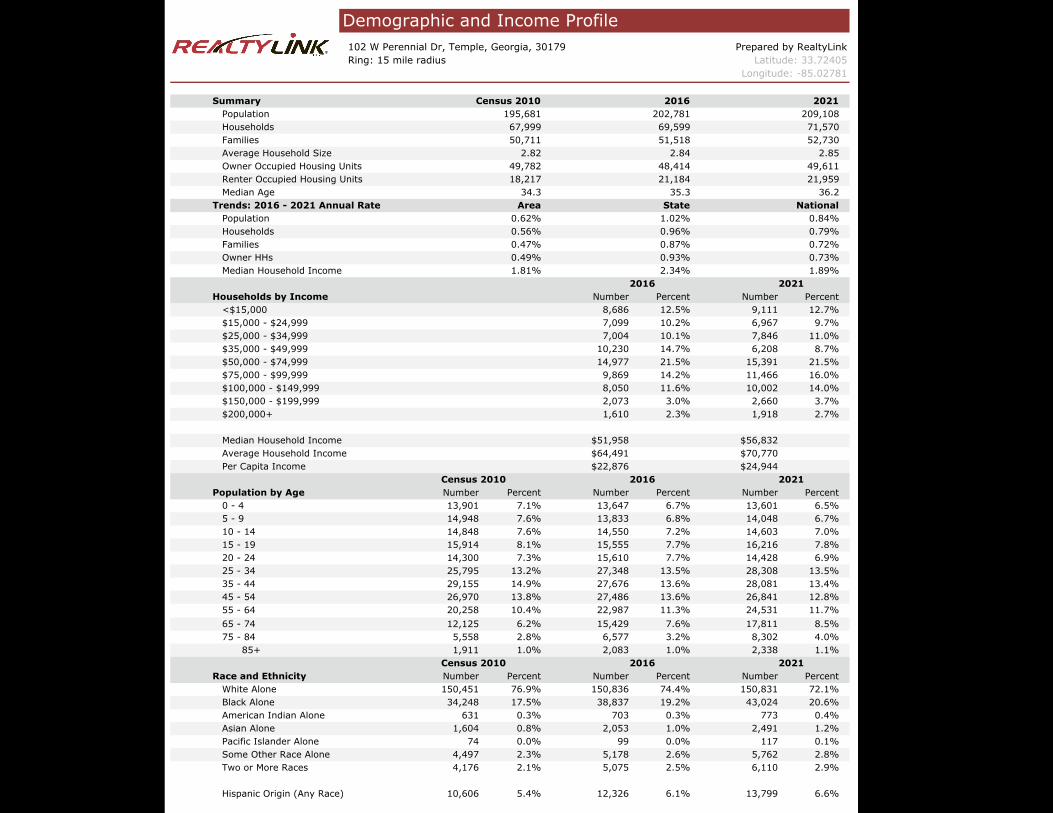
DEMOGRAPHIC SUMMARY - 2016 5 Mile 10 Mile 15 Mile
POPULATIONHOUSEHOLDSAVERAGE HH INCOMEMEDIAN HH INCOME
22,059 94,871 202,781 7,675 33,736 71,570$60,220 $62,458 $64,491$49,991 $51,163 $51,958
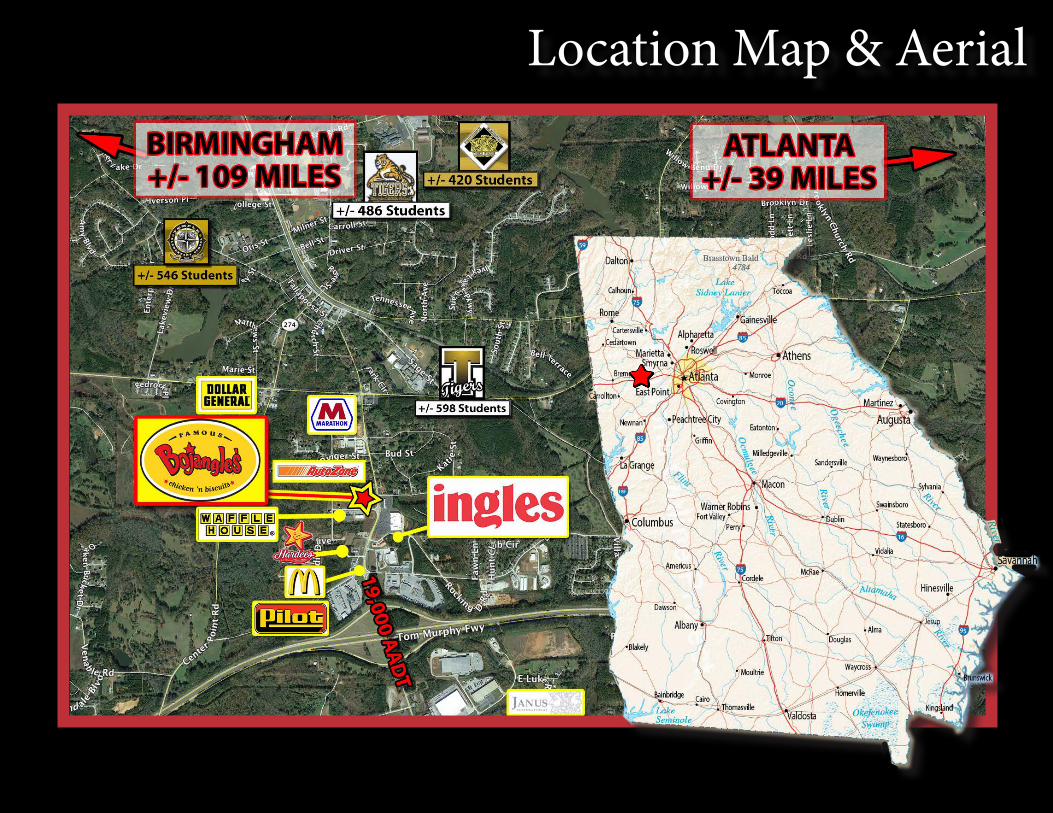
Location Map & Aerial
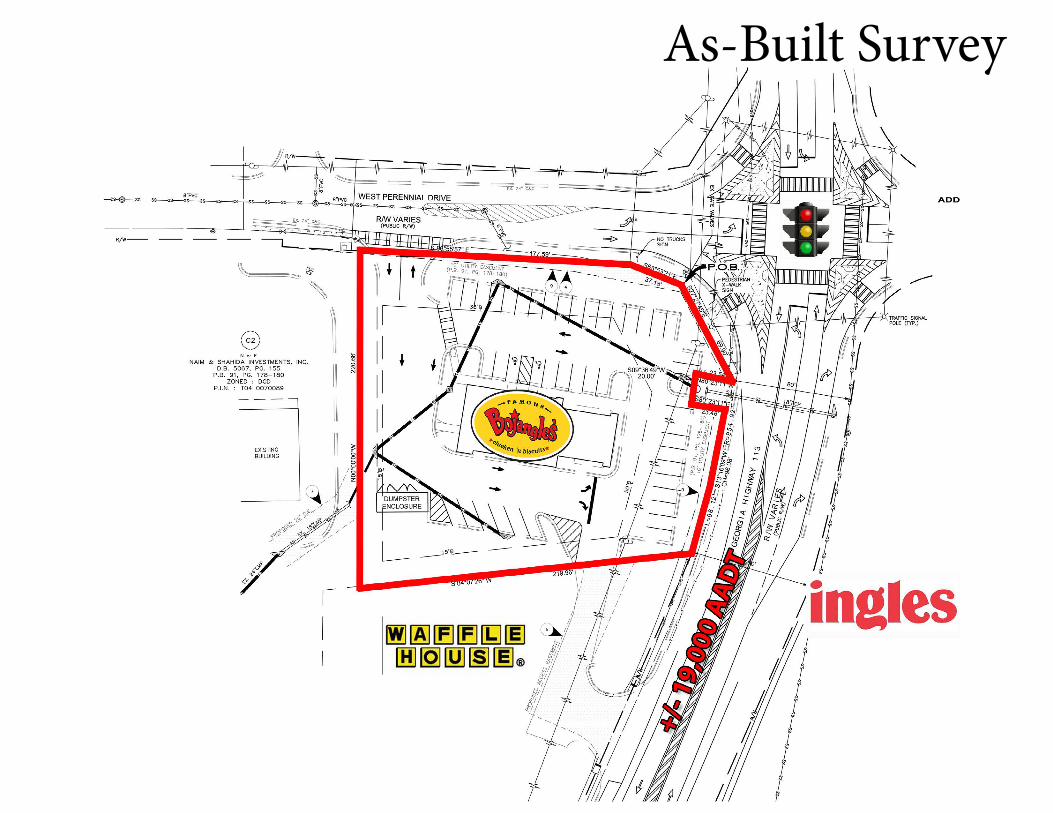
As-Built Survey
Tenant ProfileFounded in 1977 by Jack Fulk and Richard Thomas, Bojangles’ Famous Chicken ‘n Biscuits is a regional chain of quick service restaurants specializing in spicy, “Cajun” fried chicken and buttermilk biscuits. The restaurants, named after the stage name of Bill Robinson and memorialized in song by Jerry Jeff Walker, are also known for their distinctive side dishes including dirty rice, Cajun-style pinto beans, seasoned French fries and Southern sweet tea.
Based in Charlotte, North Carolina, Bojangles’ grew rapidly from its inception and currently has over 750 restaurants. They open a new restaurant on average every ten days. Currently Bojangles’ has restaurants in North Carolina, South Carolina, Georgia, Tennessee, Florida, Alabama, Mississippi, Virginia, Maryland, Pennsylvania and DC. They’re also located internationally with three restaurants in Honduras. The Wall Street Journal has ranked Bojangles’ as one of “25 High-Performing Franchises across all industries.“ Among its other recognitions, Entrepreneur Magazine has named Bojangles’ the number 1 restaurant in the chicken category, QSR Magazine has listed Bojangles’ in its Top 10, Franchise Deals, Inc. magazine has listed Bojangles’ among the fastest growing private companies for several years, GE Capital has shown Bojangles’ to be among its top ten fastest growing restaurant chains and The Nations Restaurant News has shown Bojangles’ to be the fastest growing chicken chain in 2010 and the fastest growing drive-thru, free standing QSR restaurant chain.
Bovilla, LLC is a multi-unit Bojangles franchisee based in Amarillo, Texas with a second office in Stone Mountain, Georgia. Founded in 2012 by John Broadfoot, Jr., Bovilla currently operates two Bojangles restaurants in the metro Atlanta region with plans to develop three more over the next eighteen months. Mr. Broadfoot is a successful entrepreneur with strong family ties to the restaurant industry.
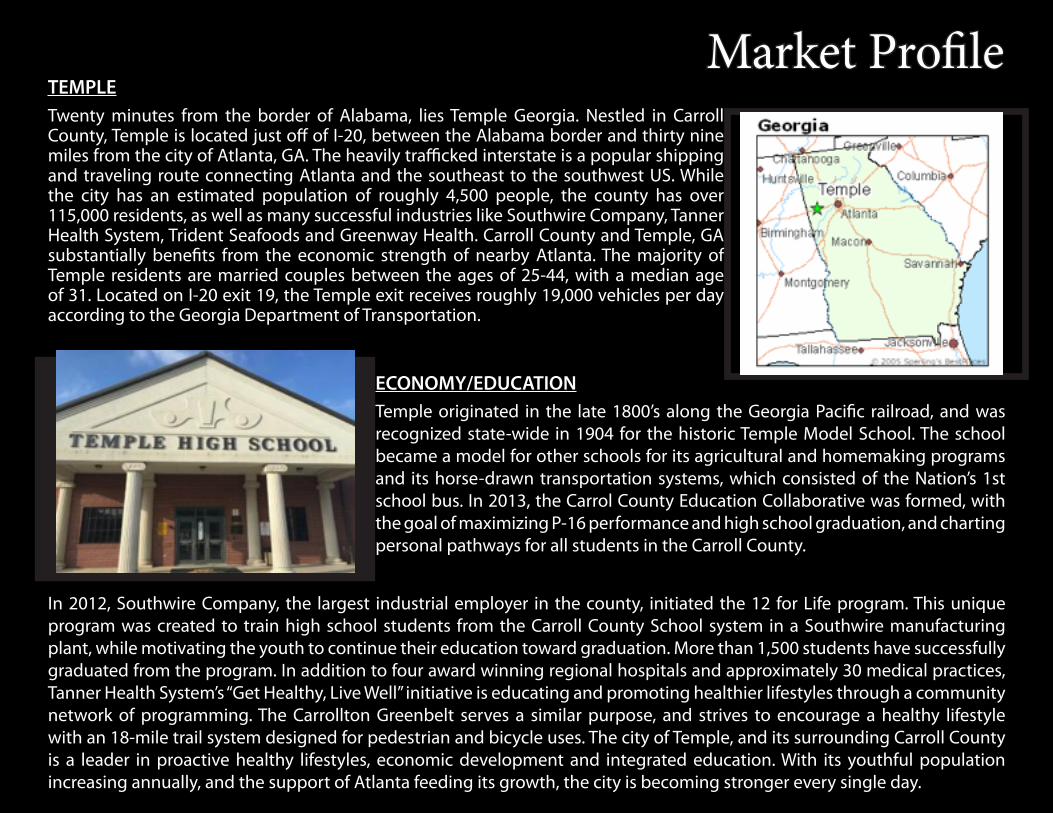
Market ProfileTEMPLETwenty minutes from the border of Alabama, lies Temple Georgia. Nestled in Carroll County, Temple is located just off of I-20, between the Alabama border and thirty nine miles from the city of Atlanta, GA. The heavily trafficked interstate is a popular shipping and traveling route connecting Atlanta and the southeast to the southwest US. While the city has an estimated population of roughly 4,500 people, the county has over 115,000 residents, as well as many successful industries like Southwire Company, Tanner Health System, Trident Seafoods and Greenway Health. Carroll County and Temple, GA substantially benefits from the economic strength of nearby Atlanta. The majority of Temple residents are married couples between the ages of 25-44, with a median age of 31. Located on I-20 exit 19, the Temple exit receives roughly 19,000 vehicles per day according to the Georgia Department of Transportation.
ECONOMY/EDUCATIONTemple originated in the late 1800’s along the Georgia Pacific railroad, and was recognized state-wide in 1904 for the historic Temple Model School. The school became a model for other schools for its agricultural and homemaking programs and its horse-drawn transportation systems, which consisted of the Nation’s 1st school bus. In 2013, the Carrol County Education Collaborative was formed, with the goal of maximizing P-16 performance and high school graduation, and charting personal pathways for all students in the Carroll County.
In 2012, Southwire Company, the largest industrial employer in the county, initiated the 12 for Life program. This unique program was created to train high school students from the Carroll County School system in a Southwire manufacturing plant, while motivating the youth to continue their education toward graduation. More than 1,500 students have successfully graduated from the program. In addition to four award winning regional hospitals and approximately 30 medical practices, Tanner Health System’s “Get Healthy, Live Well” initiative is educating and promoting healthier lifestyles through a community network of programming. The Carrollton Greenbelt serves a similar purpose, and strives to encourage a healthy lifestyle with an 18-mile trail system designed for pedestrian and bicycle uses. The city of Temple, and its surrounding Carroll County is a leader in proactive healthy lifestyles, economic development and integrated education. With its youthful population increasing annually, and the support of Atlanta feeding its growth, the city is becoming stronger every single day.
Percent12.2%11.9%13.1%8.0%
20.2%17.5%12.4%3.0%1.7%
Number Percent1,640 7.0%1,666 7.3%1,729 7.4%1,509 6.6%1,267 5.4%2,966 13.5%3,224 13.8%2,979 12.9%2,305 11.9%1,324 8.9%
637 4.1%178 1.1%
Number Percent17,783 80.2%2,712 14.3%
92 0.5%125 0.8%
7 0.1%296 1.6%407 2.5%
736 4.0%936Hispanic Origin (Any Race) 3.4% 838 3.8%
568Two or More Races 1.9% 471 2.1%
13Some Other Race Alone 1.4% 335 1.5% 376Pacific Islander Alone 0.0% 10 0.0%
117Asian Alone 0.6% 158 0.7% 194American Indian Alone 0.4% 103 0.5%
18,555Black Alone 12.7% 2,988 13.5% 3,304White Alone 83.0% 17,993 81.6%
Race and Ethnicity Percent Number Percent NumberCensus 2010 2016 2021
94485+ 0.8% 211 1.0% 247
75 - 84 3.0% 735 3.3%
2,75665 - 74 6.2% 1,720 7.8% 2,05255 - 64 10.8% 2,593 11.8%
3,19245 - 54 13.9% 3,035 13.8% 2,98635 - 44 15.0% 3,110 14.1%
1,25825 - 34 13.8% 3,015 13.7% 3,11620 - 24 5.9% 1,331 6.0%
1,72115 - 19 7.0% 1,476 6.7% 1,53510 - 14 8.1% 1,619 7.3%
1,6295 - 9 7.8% 1,604 7.3% 1,6920 - 4 7.7% 1,610 7.3%
Population by Age Percent Number Percent NumberCensus 2010 2016 2021
$65,743Per Capita Income $21,046 $22,887Average Household Income $60,220Median Household Income $49,991 $54,183
241$200,000+ 117 1.5% 137$150,000 - $199,999 182 2.4%
1,399$100,000 - $149,999 765 10.0% 996$75,000 - $99,999 1,175 15.3%
643$50,000 - $74,999 1,598 20.8% 1,617$35,000 - $49,999 1,075 14.0%
954$25,000 - $34,999 883 11.5% 1,048$15,000 - $24,999 946 12.3%
Number<$15,000 934 12.2% 981
Households by Income Number Percent2016 2021
Median Household Income 1.62% 2.34% 1.89%Owner HHs 0.81% 0.93% 0.73%Families 0.80% 0.87% 0.72%Households 0.88% 0.96% 0.79%Population 0.95% 1.02% 0.84%
Trends: 2016 - 2021 Annual Rate Area State NationalMedian Age 34.8 36.2 36.9Renter Occupied Housing Units 1,706 2,039 2,149Owner Occupied Housing Units 5,798 5,636 5,868Average Household Size 2.85 2.87 2.88Families 5,781 5,864 6,101Households 7,504 7,675 8,017Population 21,423 22,059 23,127
Summary Census 2010 2016 2021
102 W Perennial Dr, Temple, Georgia, 30179 Prepared by RealtyLinkRing: 5 mile radius Latitude: 33.72405
Longitude: -85.02781
Demographic and Income Profile

Percent13.4%10.2%11.2%8.4%
21.6%16.1%13.4%3.3%2.3%
Number Percent6,915 6.9%7,215 7.1%7,046 7.4%6,372 6.8%5,966 6.0%
12,705 13.4%13,385 13.8%12,425 12.8%9,699 11.7%5,830 8.7%2,762 4.2%
933 1.2%
Number Percent71,037 73.6%15,418 19.6%
298 0.4%735 1.2%23 0.0%
1,793 2.3%1,949 2.9%
4,394 5.8%5,682Hispanic Origin (Any Race) 4.8% 5,080 5.4%
2,822Two or More Races 2.1% 2,335 2.5%
40Some Other Race Alone 2.0% 2,053 2.2% 2,285Pacific Islander Alone 0.0% 33 0.0%
381Asian Alone 0.8% 948 1.0% 1,169American Indian Alone 0.3% 342 0.4%
72,560Black Alone 16.9% 17,395 18.3% 19,329White Alone 77.8% 71,767 75.6%
Race and Ethnicity Percent Number Percent NumberCensus 2010 2016 2021
4,09685+ 1.0% 1,035 1.1% 1,156
75 - 84 3.0% 3,234 3.4%
11,51665 - 74 6.4% 7,449 7.9% 8,61855 - 64 10.6% 10,830 11.4%
13,58745 - 54 13.6% 12,771 13.5% 12,64335 - 44 14.7% 13,130 13.8%
5,88025 - 34 13.9% 13,227 13.9% 13,23720 - 24 6.5% 6,189 6.5%
7,24915 - 19 7.0% 6,318 6.7% 6,74610 - 14 7.7% 7,033 7.4%
6,8495 - 9 7.9% 6,825 7.2% 7,0100 - 4 7.6% 6,831 7.2%
Population by Age Percent Number Percent NumberCensus 2010 2016 2021
$68,387Per Capita Income $22,385 $24,381Average Household Income $62,458Median Household Income $51,163 $55,613
1,162$200,000+ 677 2.0% 814$150,000 - $199,999 893 2.6%
5,609$100,000 - $149,999 3,731 11.1% 4,672$75,000 - $99,999 4,775 14.2%
2,950$50,000 - $74,999 7,322 21.7% 7,542$35,000 - $49,999 4,877 14.5%
3,556$25,000 - $34,999 3,437 10.2% 3,915$15,000 - $24,999 3,581 10.6%
Number<$15,000 4,442 13.2% 4,696
Households by Income Number Percent2016 2021
Median Household Income 1.68% 2.34% 1.89%Owner HHs 0.63% 0.93% 0.73%Families 0.61% 0.87% 0.72%Households 0.69% 0.96% 0.79%Population 0.77% 1.02% 0.84%
Trends: 2016 - 2021 Annual Rate Area State NationalMedian Age 34.5 35.8 36.7Renter Occupied Housing Units 9,158 10,697 11,149Owner Occupied Housing Units 23,580 23,038 23,767Average Household Size 2.77 2.79 2.80Families 24,425 24,989 25,762Households 32,738 33,736 34,916Population 91,253 94,871 98,587
Summary Census 2010 2016 2021
102 W Perennial Dr, Temple, Georgia, 30179 Prepared by RealtyLinkRing: 10 mile radius Latitude: 33.72405
Longitude: -85.02781
Demographic and Income Profile
Percent12.7%9.7%
11.0%8.7%
21.5%16.0%14.0%3.7%2.7%
Number Percent13,901 6.5%14,948 6.7%14,848 7.0%15,914 7.8%14,300 6.9%25,795 13.5%29,155 13.4%26,970 12.8%20,258 11.7%12,125 8.5%5,558 4.0%1,911 1.1%
Number Percent150,451 72.1%34,248 20.6%
631 0.4%1,604 1.2%
74 0.1%4,497 2.8%4,176 2.9%
10,606 6.6%13,799Hispanic Origin (Any Race) 5.4% 12,326 6.1%
6,110Two or More Races 2.1% 5,075 2.5%
117Some Other Race Alone 2.3% 5,178 2.6% 5,762Pacific Islander Alone 0.0% 99 0.0%
773Asian Alone 0.8% 2,053 1.0% 2,491American Indian Alone 0.3% 703 0.3%
150,831Black Alone 17.5% 38,837 19.2% 43,024White Alone 76.9% 150,836 74.4%
Race and Ethnicity Percent Number Percent NumberCensus 2010 2016 2021
8,30285+ 1.0% 2,083 1.0% 2,338
75 - 84 2.8% 6,577 3.2%
24,53165 - 74 6.2% 15,429 7.6% 17,81155 - 64 10.4% 22,987 11.3%
28,08145 - 54 13.8% 27,486 13.6% 26,84135 - 44 14.9% 27,676 13.6%
14,42825 - 34 13.2% 27,348 13.5% 28,30820 - 24 7.3% 15,610 7.7%
14,60315 - 19 8.1% 15,555 7.7% 16,21610 - 14 7.6% 14,550 7.2%
13,6015 - 9 7.6% 13,833 6.8% 14,0480 - 4 7.1% 13,647 6.7%
Population by Age Percent Number Percent NumberCensus 2010 2016 2021
$70,770Per Capita Income $22,876 $24,944Average Household Income $64,491Median Household Income $51,958 $56,832
2,660$200,000+ 1,610 2.3% 1,918$150,000 - $199,999 2,073 3.0%
11,466$100,000 - $149,999 8,050 11.6% 10,002$75,000 - $99,999 9,869 14.2%
6,208$50,000 - $74,999 14,977 21.5% 15,391$35,000 - $49,999 10,230 14.7%
6,967$25,000 - $34,999 7,004 10.1% 7,846$15,000 - $24,999 7,099 10.2%
Number<$15,000 8,686 12.5% 9,111
Households by Income Number Percent2016 2021
Median Household Income 1.81% 2.34% 1.89%Owner HHs 0.49% 0.93% 0.73%Families 0.47% 0.87% 0.72%Households 0.56% 0.96% 0.79%Population 0.62% 1.02% 0.84%
Trends: 2016 - 2021 Annual Rate Area State NationalMedian Age 34.3 35.3 36.2Renter Occupied Housing Units 18,217 21,184 21,959Owner Occupied Housing Units 49,782 48,414 49,611Average Household Size 2.82 2.84 2.85Families 50,711 51,518 52,730Households 67,999 69,599 71,570Population 195,681 202,781 209,108
Summary Census 2010 2016 2021
102 W Perennial Dr, Temple, Georgia, 30179 Prepared by RealtyLinkRing: 15 mile radius Latitude: 33.72405
Longitude: -85.02781
Demographic and Income Profile
©2017 RealtyLink, LLC, We have obtained the contained information from sources we believe are reliable. We have not however verified that all information is accurate and make no guarantee, warranty or representation of it. The information is subject to the possibility of errors, omissions, change of price, rental or other conditions, prior sale, lease or financing or withdrawal without notice, and it is not a substitute for a thorough due diligence investigation. We include opinions, projections, estimations and assumptions for example purposes only. This information may not represent current or future performance of the property. Seek legal advise and conduct due diligence if exact numbers are desired.
RealtyLink, LLC and the RealtyLink logo are trademarks of RealtyLink, LLC and/or its affiliates. All other logos or company materials displayed in these contents are the property of their respective owners.
Investment Contacts:
J. Tyson Glasser, CCIMInvestment Sales [email protected] o • 404.435.6312 c
550 S. Main Street, Suite 300 • Greenville, SC 29601864.242.4008 p • 864.232.0160 f • www.REALTYLINKDEV.com