boe fs report june 2013 global financial environment
DESCRIPTION
BoE FS Report June 2013 Global Financial EnvironmentTRANSCRIPT
6 Financial Stability Report June 2013
This section summarises key developments in the globalfinancial environment since the November 2012 Report,including the provision of financial services to UK householdsand companies during this period. During much of the period,market sentiment improved and asset prices increased. But,more recently, market sentiment has deteriorated andvolatility has increased, reflecting shifting expectations of thepath of monetary policy in some of the major advancedeconomies. By the end of the period, rises in most risky assetprices had partially reversed, while many risk-free rates endedthe period higher than at the time of the November 2012Report. Following the 17 June data cut-off for this Report,
risk-free rates continued to rise.
The rest of this Report examines: short-term (Section 2) andmedium-term (Section 3) risks to the financial system; theactivity of the Financial Policy Committee (FPC) and progresson previous recommendations (Section 4); and, against thatbackdrop, the policy actions that the FPC advises to reducerisks to the financial system (Section 5). In addition, anannex provides an update of the core indicators for thecountercyclical capital buffer and sectoral capital requirementsthat were published in the draft Policy Statement issued by theFPC in January 2013.
Growth prospects were in general subdued…
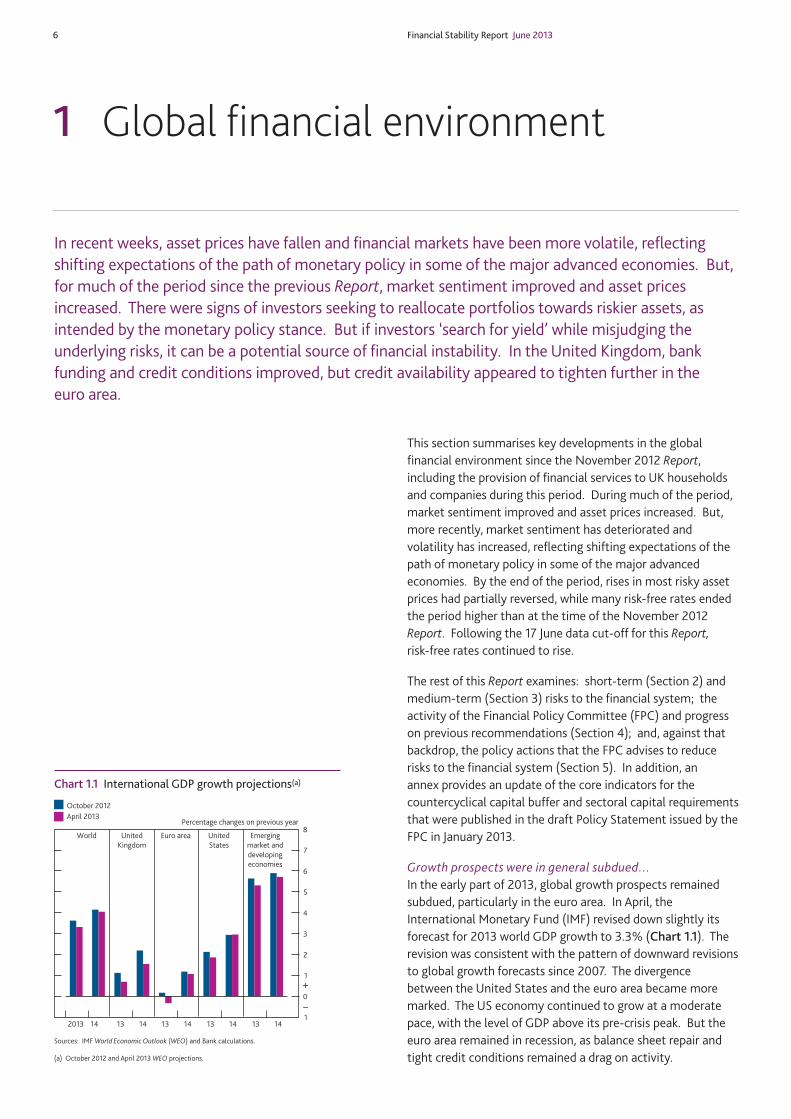
In the early part of 2013, global growth prospects remainedsubdued, particularly in the euro area. In April, theInternational Monetary Fund (IMF) revised down slightly itsforecast for 2013 world GDP growth to 3.3% (Chart 1.1). Therevision was consistent with the pattern of downward revisionsto global growth forecasts since 2007. The divergencebetween the United States and the euro area became moremarked. The US economy continued to grow at a moderatepace, with the level of GDP above its pre-crisis peak. But theeuro area remained in recession, as balance sheet repair andtight credit conditions remained a drag on activity.
1 Global financial environment
In recent weeks, asset prices have fallen and financial markets have been more volatile, reflectingshifting expectations of the path of monetary policy in some of the major advanced economies. But,for much of the period since the previous Report, market sentiment improved and asset pricesincreased. There were signs of investors seeking to reallocate portfolios towards riskier assets, asintended by the monetary policy stance. But if investors ‘search for yield’ while misjudging theunderlying risks, it can be a potential source of financial instability. In the United Kingdom, bankfunding and credit conditions improved, but credit availability appeared to tighten further in theeuro area.
1
0
1
2
3
4
5
6
7
8
2013 14 13 14
October 2012
April 2013Percentage changes on previous year
+
–
World United
Kingdom
Euro area United
States
Emerging
market anddeveloping
economies
13 14 13 14 13 14
Sources: IMF World Economic Outlook (WEO) and Bank calculations.
(a) October 2012 and April 2013 WEO projections.
Chart 1.1 International GDP growth projections(a)
Section 1 Global financial environment 7
…prompting continued focus on policy support.
Against an overall weak macroeconomic backdrop, monetarypolicy remained supportive in advanced economies and somecentral banks loosened policy further. The European CentralBank (ECB) cut the interest rate on its main refinancingoperations by 25 basis points in May. The Bank of Japanlaunched a major new monetary stimulus package, as part of awider set of policy measures involving both fiscal stimulus andstructural reform.(1) In the United States, the Federal Reservecommitted in December 2012 to continue its open-endedpurchases of assets until it observed a substantialimprovement in the outlook for the US labour market andprovided inflation expectations remained anchored. Towardsthe end of the period, however, the focus turned to thepossible timing of a slowing in the pace of monetary expansionby the Federal Reserve.
In the United Kingdom, the Monetary Policy Committee keptits policy rate and the stock of purchased assets unchanged. InApril, an extension to the Funding for Lending Scheme (FLS)was announced by the Bank of England and HM Treasury.
Investor sentiment initially improved on the back of policy
support…
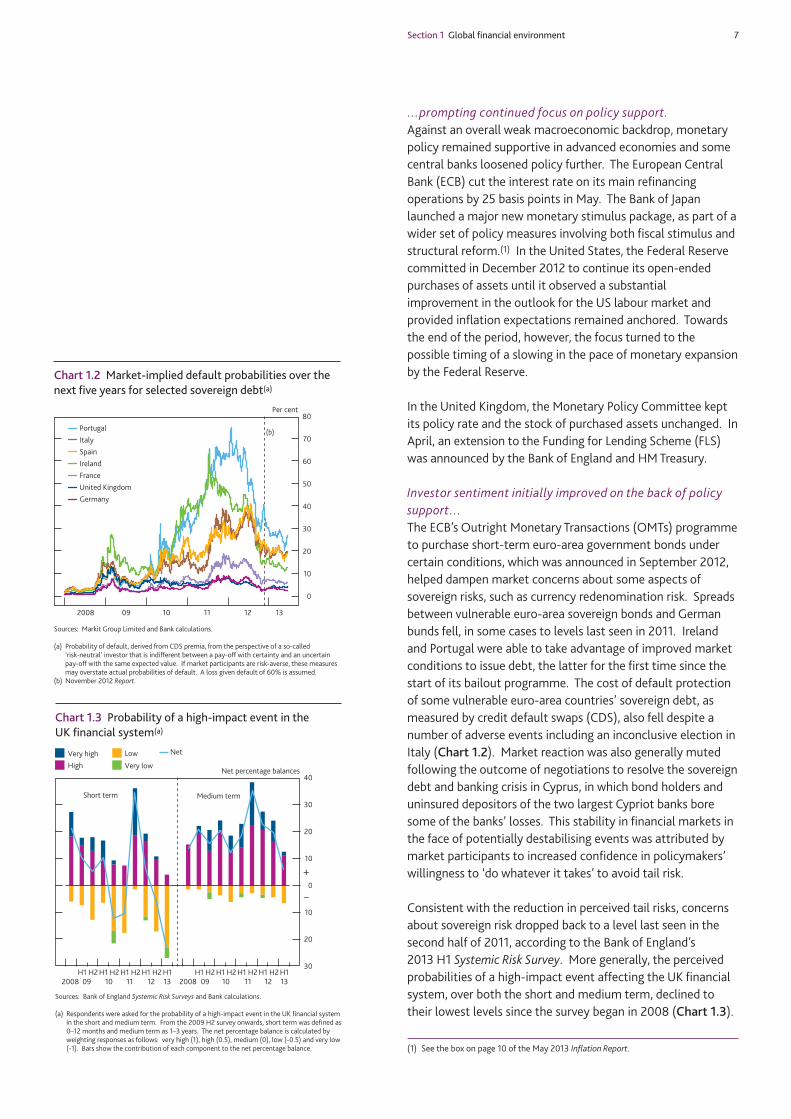
The ECB’s Outright Monetary Transactions (OMTs) programmeto purchase short-term euro-area government bonds undercertain conditions, which was announced in September 2012,helped dampen market concerns about some aspects ofsovereign risks, such as currency redenomination risk. Spreadsbetween vulnerable euro-area sovereign bonds and Germanbunds fell, in some cases to levels last seen in 2011. Irelandand Portugal were able to take advantage of improved marketconditions to issue debt, the latter for the first time since thestart of its bailout programme. The cost of default protectionof some vulnerable euro-area countries’ sovereign debt, asmeasured by credit default swaps (CDS), also fell despite anumber of adverse events including an inconclusive election inItaly (Chart 1.2). Market reaction was also generally mutedfollowing the outcome of negotiations to resolve the sovereigndebt and banking crisis in Cyprus, in which bond holders anduninsured depositors of the two largest Cypriot banks boresome of the banks’ losses. This stability in financial markets inthe face of potentially destabilising events was attributed bymarket participants to increased confidence in policymakers’willingness to ‘do whatever it takes’ to avoid tail risk.
Consistent with the reduction in perceived tail risks, concernsabout sovereign risk dropped back to a level last seen in thesecond half of 2011, according to the Bank of England’s2013 H1 Systemic Risk Survey. More generally, the perceivedprobabilities of a high-impact event affecting the UK financialsystem, over both the short and medium term, declined totheir lowest levels since the survey began in 2008 (Chart 1.3).
(1) See the box on page 10 of the May 2013 Inflation Report.
0
10
20
30
40
50
60
70
80
2008 09 10 11 12 13
Portugal
Ireland
Italy
Spain
France
United Kingdom
Germany
Per cent
(b)
Sources: Markit Group Limited and Bank calculations.
(a) Probability of default, derived from CDS premia, from the perspective of a so-called‘risk-neutral’ investor that is indifferent between a pay-off with certainty and an uncertainpay-off with the same expected value. If market participants are risk-averse, these measuresmay overstate actual probabilities of default. A loss given default of 60% is assumed.
(b) November 2012 Report.
Chart 1.2 Market-implied default probabilities over thenext five years for selected sovereign debt(a)
30
20
10
0
10
20
30
40
2008H1 H2
09H1 H2
10H1 H2
11H1 H2
12H113 2008
H1 H209
H1 H210
H1 H211
H1 H212
H113
High
Very high Low
Very low
Net
Short term Medium term
Net percentage balances
+
–
Sources: Bank of England Systemic Risk Surveys and Bank calculations.
(a) Respondents were asked for the probability of a high-impact event in the UK financial systemin the short and medium term. From the 2009 H2 survey onwards, short term was defined as0–12 months and medium term as 1–3 years. The net percentage balance is calculated byweighting responses as follows: very high (1), high (0.5), medium (0), low (-0.5) and very low(-1). Bars show the contribution of each component to the net percentage balance.
Chart 1.3 Probability of a high-impact event in theUK financial system(a)
8 Financial Stability Report June 2013
…but more recently market sentiment has deteriorated and
volatility increased.
More recently, risky asset prices fell and volatility increased asmarket sentiment was influenced by shifting expectations ofthe path of monetary policy in some of the major advancedeconomies. This highlighted the risk of abrupt changes infinancial markets should expectations of the path of interestrates shift materially, including as central bank policies areexited. Section 2 examines the channels through which thiscould affect financial stability.
Bond yields had remained close to historically low levels…
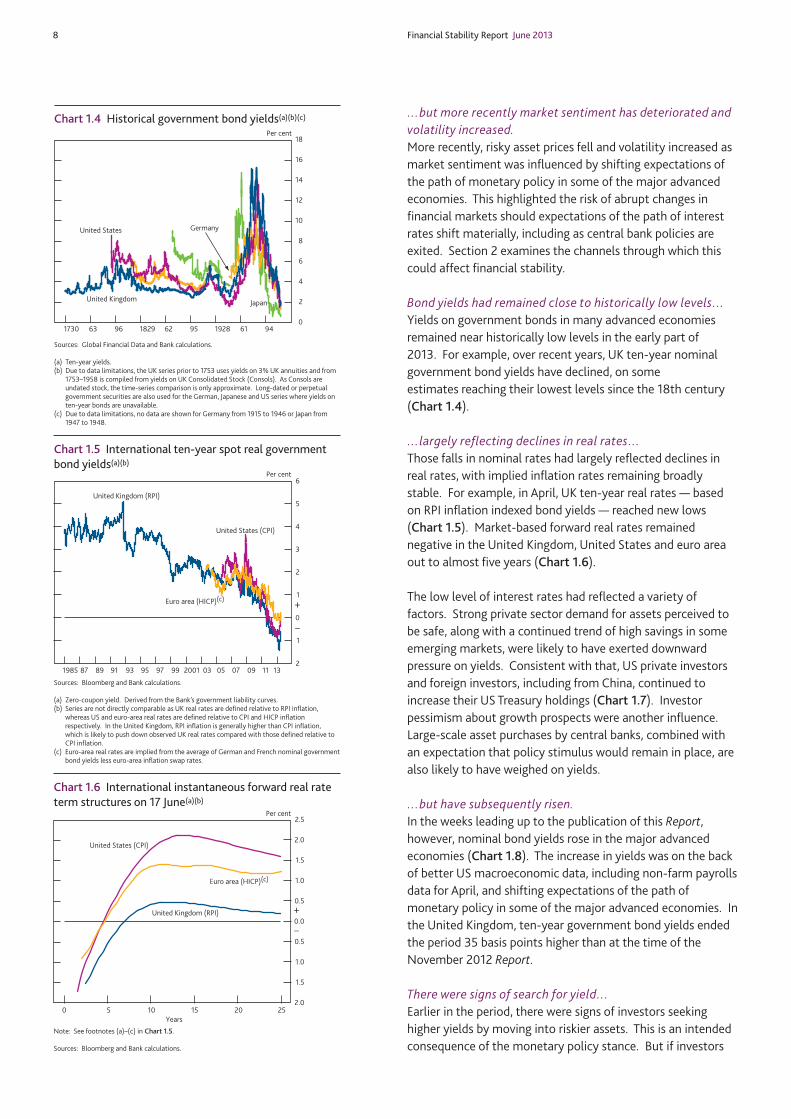
Yields on government bonds in many advanced economiesremained near historically low levels in the early part of2013. For example, over recent years, UK ten-year nominalgovernment bond yields have declined, on someestimates reaching their lowest levels since the 18th century(Chart 1.4).
…largely reflecting declines in real rates…
Those falls in nominal rates had largely reflected declines inreal rates, with implied inflation rates remaining broadlystable. For example, in April, UK ten-year real rates — basedon RPI inflation indexed bond yields — reached new lows(Chart 1.5). Market-based forward real rates remainednegative in the United Kingdom, United States and euro areaout to almost five years (Chart 1.6).
The low level of interest rates had reflected a variety offactors. Strong private sector demand for assets perceived tobe safe, along with a continued trend of high savings in someemerging markets, were likely to have exerted downwardpressure on yields. Consistent with that, US private investorsand foreign investors, including from China, continued toincrease their US Treasury holdings (Chart 1.7). Investorpessimism about growth prospects were another influence.Large-scale asset purchases by central banks, combined withan expectation that policy stimulus would remain in place, arealso likely to have weighed on yields.
…but have subsequently risen.
In the weeks leading up to the publication of this Report,however, nominal bond yields rose in the major advancedeconomies (Chart 1.8). The increase in yields was on the backof better US macroeconomic data, including non-farm payrollsdata for April, and shifting expectations of the path ofmonetary policy in some of the major advanced economies. Inthe United Kingdom, ten-year government bond yields endedthe period 35 basis points higher than at the time of theNovember 2012 Report.
There were signs of search for yield…
Earlier in the period, there were signs of investors seekinghigher yields by moving into riskier assets. This is an intendedconsequence of the monetary policy stance. But if investors
0
2
4
6
8
10
12
14
16
18
1730 63 96 1829 62 95 1928 61 94
United Kingdom
United States
Japan
Germany
Per cent
Sources: Global Financial Data and Bank calculations.
(a) Ten-year yields.(b) Due to data limitations, the UK series prior to 1753 uses yields on 3% UK annuities and from
1753–1958 is compiled from yields on UK Consolidated Stock (Consols). As Consols areundated stock, the time-series comparison is only approximate. Long-dated or perpetualgovernment securities are also used for the German, Japanese and US series where yields onten-year bonds are unavailable.
(c) Due to data limitations, no data are shown for Germany from 1915 to 1946 or Japan from1947 to 1948.
Chart 1.4 Historical government bond yields(a)(b)(c)
2
1
0
1
2
3
4
5
6
1985 87 89 91 93 95 97 99 2001 03 05 07 09 11 13
United Kingdom (RPI)
United States (CPI)
Euro area (HICP)(c)
Per cent
+
–
Sources: Bloomberg and Bank calculations.
(a) Zero-coupon yield. Derived from the Bank’s government liability curves.(b) Series are not directly comparable as UK real rates are defined relative to RPI inflation,
whereas US and euro-area real rates are defined relative to CPI and HICP inflationrespectively. In the United Kingdom, RPI inflation is generally higher than CPI inflation,which is likely to push down observed UK real rates compared with those defined relative toCPI inflation.
(c) Euro-area real rates are implied from the average of German and French nominal governmentbond yields less euro-area inflation swap rates.
Chart 1.5 International ten-year spot real governmentbond yields(a)(b)
2.0
1.5
1.0
0.5
0.0
0.5
1.0
1.5
2.0
2.5
0 5 10 15 20 25
United Kingdom (RPI)
United States (CPI)
Euro area (HICP)(c)
Per cent
+
–
Years
Note: See footnotes (a)–(c) in Chart 1.5.
Sources: Bloomberg and Bank calculations.
Chart 1.6 International instantaneous forward real rateterm structures on 17 June(a)(b)

Section 1 Global financial environment 9
‘search for yield’ while misjudging the underlying risks, it canalso be a potential source of financial instability (Box 1). Therewas some evidence of a potential underpricing of risk in somemarket segments, such as high-yield credit instruments,particularly in the United States.
With government bond yields underpinning the pricing of allasset prices, a rapid change in yields would be expected toaffect other financial assets too. Section 2 examines thepotential impact of a rise in global long-term interest rates.
…with some portfolio rebalancing.
One dimension of investors seeking higher yields was arebalancing of portfolios. There are limited data available onnon-bank financial institutions, but global fund managers’allocations were reported to have switched from beingoverweight in cash in 2012 Q3, relative to past averagepositions, to being underweight in 2013 Q2 (Chart 1.9).
In addition, early in the period, there had been strong interestin emerging market equities and bonds from mutual fundinvestors. Flows into dedicated emerging market localcurrency bond mutual funds during the first four months of2013 were higher than for the whole of 2012 (Chart 1.10). Thatwas accompanied by a substantial compression of yields, onsome measures reaching historical lows in May. Since lateMay, however, some of these flows have reversed, and spreadshave risen sharply, in response to the pickup in the US Treasuryyield curve.
This shift by mutual fund investors into emerging market bondclasses was not, however, accompanied by generally stronginflows into other risky fixed-income asset classes. Forexample, net inflows into US high-yield mutual funds were notparticularly strong in 2013, following the record inflows in2012 (Chart 1.10).
Flows into dedicated equity funds, in both advanced as well asemerging economies, picked up sharply at the start of the year.Market contacts believed that reflected the deployment ofcash holdings that investors had accumulated in late 2012.But, as with emerging market bonds, there has been somereversal of flows more recently, following the onset of moregeneral market volatility in late May.
Portfolio rebalancing was evident too among UK insurancecompanies and pension funds. Contacts reported that someinsurance companies were considering buying residentialproperties as they sought higher yields, diversifying away fromtraditional fixed-income securities. Insurance funds’ corporatebond allocations suggested a shift down the credit spectrum:bonds rated BBB and below accounted for more than a third oftheir corporate bond holdings in 2012, up from a quarter in2008, though some of this may have reflected ratings
0
2
4
6
8
10
12
2000 02 04 06 08 10 12
US government(a)
US private investors
China(b)
Other foreign investors
US$ trillions
Sources: CEIC, Federal Reserve US flow of funds, IMF currency composition of official foreignexchange reserves and Bank calculations.
(a) Includes holdings by state and local government, government retirement funds,government-sponsored enterprises and the Federal Reserve.
(b) Assumes proportion of Chinese reserves held as Treasuries is the same as the world average.Other foreign holdings are calculated as the residual between total foreign holdings ofTreasuries and the estimate of Chinese holdings.
Chart 1.7 Holdings of US Treasury securities
0
1
2
3
4
5
6
2007 08 09 10 11 12 13
United Kingdom
United States
Germany
Japan
Per cent
(b)
Sources: Bloomberg and Bank calculations.
(a) Zero-coupon yield. Derived from the Bank’s government liability curves.(b) November 2012 Report.
Chart 1.8 International ten-year nominal spotgovernment bond yields(a)
3.0
2.5
2.0
1.5
1.0
0.5
0.0
0.5
1.0
1.5
Cash Equities Commodities Bonds Real estate
2012 Q3
2012 Q4
2013 Q1
2013 Q2
Positioning relative to history
+
–
Source: Bank of America Merrill Lynch Global Fund Manager Survey.
(a) Positioning captures whether funds are overweight (positive scores) or underweight (negativescores) in each asset class relative to historical asset allocations. Historical asset allocationsare based on data since 2006 for commodities and real estate and since 2001 for equities,bonds and cash.
Chart 1.9 Global asset class positioning by investmentfunds(a)

10 Financial Stability Report June 2013
Box 1What factors might exaggerate risk-taking infinancial markets?
Risky asset prices have risen internationally since mid-2012,despite the recent volatility in some financial markets,prompting questions about whether investors are demandingsufficient compensation for bearing risk.
In absolute terms, asset valuations are supported by thehistorically low level of risk-free interest rates,notwithstanding recent movements. There are nonethelesssome market segments, such as the US high-yield corporatebond market, where price and non-price measures of risk haveshown signs of becoming overly compressed. This boxinvestigates the economic drivers and investor incentives thathave the potential to exaggerate risk-taking.
Structural factors affecting riskThere are a number of long-standing structural forces thatcontinue to affect measures of risk across financial markets.Current account surpluses in some emerging economies, anddemand for savings by investors in Asia, are likely to continueto exert downward pressure on risk premia in developedmarkets. For example, purchases of US corporate and otherbonds from US residents by overseas investors have totalledUS$4.3 trillion since 2009. And preference shifts by investorsmay continue to affect the constellation of risk premiabetween asset classes. For example, in the United Kingdom,the share of pension funds’ portfolios held in fixed-incomeassets has risen steadily from around 10% in the early 1990s tomore than one third today, while the share of equity holdingshas declined.
Against this backdrop, the extraordinary policy supportmeasures extended internationally since the financial crisishave sought to encourage investors to rebalance theirexposures towards risky assets. Box 3 describes theinteractions between monetary policy and financial stability,including their effects on investors’ perceptions of, andtolerance for, risk.
Why might risk become mispriced?There are a number of reasons why risk could in principlebecome mispriced, and why investors might continue to investin an asset class even where they or managers acting on theirbehalf have concerns about valuations becoming stretchedand/or non-price terms unduly loosening. Symptoms ofexaggerated risk taking among investors might includeelevated appetite for duration, credit and liquidity risk.Increasing balance sheet leverage is also a potential feature,as are the popularity of relatively complex instruments with
greater sensitivity to underlying economic outcomes —so-called ‘embedded leverage’. A rapid unwinding of leveragedportfolios could amplify market price adjustments in the eventof a material change in the financial environment.
Specifically, and most significantly in the current conjuncture,low yields have induced many investors with either explicit orimplicit nominal return targets to maintain returns by movingdown the duration, credit quality and liquidity spectrums.Investment decisions by long-term investors, such as insurancecompanies and pension funds, have the potential to affectoverall demand for fixed-income securities. And this can haveimplications for risk premia in those markets and the type ofsecurities that are issued. Relaxation of non-price terms,including the weakening of covenants in corporate bondmarkets for example, might provide a relatively lesstransparent mechanism for investors to achieve nominalreturn targets.
Investment institutions with comparatively restrictedinvestment mandates, including those tracking benchmarks,necessarily deploy inflows from their investors in the marketsegments that fall within their investment mandates. Theytherefore need, over time, to purchase assets in benchmarkconstituents when they receive inflows even if prices havebeen rising, potentially reinforcing initial price moves. Thisphenomenon is most likely to occur in the public equity andbond markets where investors seek a diversified exposure tothe asset class in question. It is likely to be exacerbated to theextent that less sophisticated investors place undue weight onpast developments in valuations and market conditions whenmaking portfolio decisions, with an inadequate appreciation ofthe underlying risks.
Where agents acting on behalf of investors are remuneratedon the basis of their relative performance, herding could arise— with, for example, fund managers replicating the investmentstrategies of their peers to avoid the risk of underperformance.In addition, there may also be incentives to gameremuneration schemes (for example if short-termperformance drives remuneration) by investing in instrumentswith material but hard-to-measure tail risk, even if that riskmay be underpriced. Some structured products have thepotential to be particularly susceptible to this incentivebecause of their inherent complexity.
Separately, there are reasons why investors mightunderestimate the risks associated with some financialinstruments. Examples here include: where the truedistribution of returns is hard to predict because only shorttime series of data are available; where valuation modelsrequire uncertain parameters that cannot be directly observedand must be inferred; and where pay-off profiles are

Section 1 Global financial environment 11
inherently difficult to model even absent parameteruncertainty, perhaps because of embedded economic leverage.Such frictions are likely to be more important in some marketsegments than others and may be particularly important formore complex products, including structured creditinstruments.
The factors above are likely to have more force if a sustainedperiod of low financial market volatility affects investors’beliefs about the future distribution of returns, leading to tailrisk being underestimated.
ConclusionOver much of the period since the previous Report, there weresigns that conditions in some parts of fixed-income markets, inparticular in the advanced and emerging economies, hadbecome relatively exuberant. It is too soon to tell whether themore recent rise in market volatility and falls in risky assetprices represent the beginning of a longer-run shift in investorsentiment.
Understanding the underlying drivers of recent developmentsin financial markets is important from a policy perspectivebecause it helps to identify particular fault lines that couldprompt wider disruption in the financial system. A concernfrom a financial stability standpoint is that investors seek toexit common risk positions simultaneously, causing marketliquidity to dry up in pockets of the financial system.Contagion could occur if, for example, initial asset disposals byinvestors in some markets led to broader spillovers to othermarkets where liquidity conditions were better. The effectscould be aggravated if concerns about counterparty credit riskrose in tandem.
The risks from a disorderly unwinding of risk positions infinancial markets are described in Section 2.

12 Financial Stability Report June 2013
downgrades. Pension funds reportedly continued to explorealternative and less liquid investments, in particular ininfrastructure and social housing.
For much of the period, there were signs of an increasingappetite for credit risk by US prime money market funds, withholdings of unsecured commercial paper and certificates ofdeposit increasing (Chart 1.11). There were also someindications of an increase in the tenor of their lending toEuropean banks.
Asset prices rose globally…
Asset prices rose strongly in the early months of 2013. Boththe FTSE All-Share and the S&P 500 equity indices reachedrecord highs in nominal terms in mid-May, and finished theperiod 11% and 18% higher respectively than at the time ofthe November 2012 Report (Chart 1.12). The Topix wasmore volatile but rose by around 40%. In debt markets, ascorporate bond spreads narrowed, particularly fornon-investment grade bonds (Chart 1.13), bond yields reachedhistorical lows. Since late May, however, some of these trendshave partially reversed. For example, non-investment gradecorporate bond spreads across the major currencies widenedby around 70 basis points, albeit remaining around 100 basislower than at the time of the November 2012 Report. Inemerging markets, bond spreads also increased sharply overthe weeks leading up to publication, largely reversing theirearlier fall.
There were also signs that the low-yield environment wassupporting prices of physical assets. Residential propertyprices increased in a number of countries since theNovember 2012 Report, including in the United Kingdom. Inthe UK commercial property market, there continued to bestrong appetite for investment in high-quality, so-called‘prime’, property with flows dominated by global investors.Some market contacts reported overheating in certainsubsectors of this market, such as Central London offices, withthe low interest rate environment said to be a key factor(Section 2).
…accompanied by strong market issuance…
Some companies were able to take advantage of improvedmarket conditions in the first few months of 2013 to issue newdebt in both investment-grade and high-yield corporate bondmarkets. Increased risk appetite was evident in strong demandfor lower-grade credit: for example issuance of Europeanhigh-yield corporate bonds in the first half of this year hasbeen almost as high as the total issuance in 2012 (Chart 1.14)and US leveraged loan market issuance reached record highs inQ1. More recently, however, there have been reports thatsome planned bond issues have been put on hold.
In early 2013, flows into, and issuance of, collateralised loanobligations (CLOs) and commercial mortgage-backedsecurities (CMBS) were strong in the United States. For
60
40
20
0
20
40
60
80
100
120
Emerging
market
equities
Emerging
market foreign
currency bonds
Emerging
market local
currency bonds
US high-yield
bonds
2009
2010
2011
2012
2013(a)
+
–
US$ billions
Sources: Emerging Portfolio Fund Research Global and Bank calculations.
(a) Dark bars show data to end-April, while dark plus light areas show annualised data.
Chart 1.10 Flows into mutual funds investing inhigher-risk asset classes
0
5
10
15
20
25
30
35
40
Oct. Dec. Feb. Apr. June Aug. Oct. Dec. Feb. Apr.
Commercial paper
Repurchase agreement
Certificate of deposit Other
Variable-rate demand note
Asset-backed commercial paper
Per cent of total exposures
2011 12 13
(a)
US Treasury and Agency
Sources: Crane data and Bank calculations.
(a) November 2012 Report.
Chart 1.11 Composition of US prime money marketfunds’ exposures
40
50
60
70
80
90
100
110
120
2007 08 09 10 11 12 13
FTSE All-Share
S&P 500
Euro Stoxx Topix
(b)
Indices: 1 January 2007 = 100
Sources: Thomson Reuters Datastream and Bank calculations.
(a) Denominated in units of local currency.(b) November 2012 Report.
Chart 1.12 International equity indices(a)

Section 1 Global financial environment 13
example, US$27 billion of US CLOs were issued in Q1, thehighest quarterly issuance since 2007. There had also beensigns that European markets were starting to revive. Duringthe period since the November 2012 Report, there were sevenCLO deals in Europe, a market which had been dormant sincethe crisis. More recently, issuance of European CLOs hasslowed. That may be related to the publication of an updateddraft on technical standards by the European BankingAuthority,(1) which prohibits third-party investors from holdingthe 5% equity interest in the structure.
…in some cases with greater complexity and on looser terms
and conditions…
Earlier in the period, there had also been some tentative signsof increased risk-taking in equity derivatives markets, withcontacts noting an increased willingness by investors, includingpension and insurance funds, to accept complexity. There wasinterest in contingent capital notes, a capital instrument that,under specified conditions, converts to equity or is writtendown so as to increase the loss-absorbing capacity of a firm.
Accompanying this, market contacts noted a weakening inlending standards during much of the period, particularly inthe United States. Investors became increasingly willing topurchase instruments with less creditor protection in exchangefor higher returns. For example, issuance of ‘covenant-lite’leveraged loans, where investors accept fewer safeguards if adebtor company’s finances deteriorate, increased significantlyin the United States. In Europe, reports suggested that somecorporate issuers, expected imminently to breach covenants,were being refinanced out of these loans into high-yield bondswith no covenants. In the US CLO market, deals werereportedly allowing up to 90% of the loan portfolio to consistof covenant-lite loans, up from as little as 30% in 2011 and therecent market standard of 50%–60%. Partly in response tothese developments, in March 2013 the US supervisoryagencies updated their guidance on leveraged lending.(2)
Despite the recent market volatility, covenant-lite issuance inthe United States has reportedly continued.
A number of European high-yield bonds were issued without‘change of control’ put options, which are designed to protectinvestors against deterioration in credit quality in the event ofa change in control of the issuing entity. Contacts alsoreported greater use of payment-in-kind deals, where nointerest is paid on bonds until maturity.
…and with some pockets of emerging concern.
If investors ‘search for yield’ and misjudge the underlying risks,it can be a potential source of financial instability.
0
500
1,000
1,500
2,000
2,500
3,000
3,500
2007 09 11 13
£
US$
(b)
Basis points
Emerging markets
€
Source: Bank of America Merrill Lynch.
(a) Option-adjusted spreads. The US dollar series refers to US dollar-denominated bonds issuedin the US domestic market, while the sterling and euro series refers to bonds issued indomestic or eurobond markets in the respective currencies. The emerging markets series iscalculated using bonds with a below investment grade country of risk rating that are euro orUS dollar-denominated and issued in the eurobond or US domestic markets.
(b) November 2012 Report.
Chart 1.13 Corporate high-yield bond spreads(a)
0
40
80
120
160
200
240
280
320
360
400
440
480
95 97 99 2001 03 05 07 09 11 13(c)
North America
Europe
Emerging economies
Other
US$ billions
1993
Sources: Dealogic and Bank calculations.
(a) Primary market issuance with an original contractual maturity or earliest call date of at least18 months.
(b) ‘Emerging economies’ includes Africa, Caribbean, Indian subcontinent, Latin America,Middle East, North Asia and South East Asia. ‘Other’ includes Australasia and Japan. Includesissuance in all currencies.
(c) Year to date.
Chart 1.14 Issuance of sub-investment grade corporatebonds by region(a)(b)
(1) http://eba.europa.eu/-/eba-consultation-on-draft-technical-standards-on-securitisation-retention-rules.
(2) See updated guidance by the Federal Reserve Board, the Federal Deposit InsuranceCorporation and the Office of the Comptroller of the Currency, dated 21 March 2013:www.federalreserve.gov/newsevents/press/bcreg/20130321a.htm.

14 Financial Stability Report June 2013
Model-based estimates of the risk premium required byinvestors to hold equities fell during the period since theNovember 2012 Report. And although risk premia do notappear particularly compressed relative to their recentaverages (Chart 1.15), such estimates will be affected bycurrently historically low levels of risk-free rates.
In corporate bond markets, there were pockets of emergingconcern, particularly in the US high-yield corporate bondmarket. Implied liquidity risk premia embodied in corporatebond spreads fell, as measured by the difference betweencorporate bond spreads and CDS premia. While corporatebond spreads appeared to have remained above levelsconsistent with rates of corporate default seen in the long run,yields reached historically low levels over the period.
Perceptions of liquidity improved prior to the recent
volatility…
The improvement in global financial market conditions duringmuch of the period appeared to be underpinned by morepositive perceptions of market liquidity. While a surveymeasure of perceptions of liquidity reached its highest levelsince mid-2007 (Chart 1.16), possible indicators of futureliquidity — such as turnover in investment-grade corporatebonds and equities and estimates of bid-ask spreads —suggested that actual liquidity had not improved materially. Inaddition, market contacts suggest dealers’ inventories are lowin a number of markets, partly due to changes in regulation.
More generally, over recent years, there has been an increase inflows into US real estate investment trusts (REITs) that investin agency mortgage-backed securities and into someexchange-traded funds (ETFs). Products that offerinstantaneous liquidity may be especially susceptible to achange in sentiment, particularly when they invest inlong-dated assets using short-term funding. These risksappeared to crystallise to some extent recently, with reports ofrestrictions on redemptions of underlying assets from ETFs.There have also been examples of a deterioration in liquidity inother markets, such as the Chinese interbank market, whereshort-term money market rates rose to extremely elevatedlevels in mid-June before falling back again.
Sharp moves in the prices of some financial assets since theend of May were associated with a rapid unwinding of somepositions, including those held by hedge funds in popular or‘crowded’ trades. Market liquidity was reported to havebecome strained in some financial assets over this period,illustrating both the risk of abrupt changes in asset pricesshould expectations on the path of interest rates shiftmaterially, and the danger of relying unduly on marketliquidity remaining robust to a widespread exit from widelyheld positions. Section 2 examines the channels throughwhich this could affect financial stability.
2007 08 09 10 11 12 13 8
6
4
2
0
2
4
6
8
80
60
40
20
0
20
40
60
80Survey measure of
liquidity(a)
(left-hand scale)
Credit Suisse Global
Risk Appetite Index(b)
(right-hand scale)
Per cent
(c)
Imp
rove
d
per
ceiv
ed l
iqu
idit
y
Str
on
ger
risk
ap
pet
ite
+
–
+
–
Sources: Bank of America Merrill Lynch Global Fund Manager Survey, Credit Suisse and Bankcalculations.
(a) The net percentage balance of respondents to a monthly Bank of America Merrill Lynchglobal survey of fund managers reporting liquidity conditions as positive.
(b) Summary statistic which tracks the relative performance of safe assets versus more volatileassets, with a positive value implying strong risk appetite and a negative value implying riskaversion.
(c) November 2012 Report.
Chart 1.16 Investor risk appetite and market liquidity
02468
10
2007 08 09 10 11 12 13
Euro Stoxx
Interquartile range since 2000
0
2
4
6
8
10FTSE All-Share
Per cent
Interquartile range since 1998
0
2
4
6
8
10
S&P 500
Interquartile range since 1991
Sources: Bloomberg, Thomson Reuters Datastream and Bank calculations.
(a) As implied by a multi-stage dividend discount model.
Chart 1.15 International equity risk premia(a)

Section 1 Global financial environment 15
Liquidity conditions within the over-the-counter (OTC)derivatives market are difficult to gauge from available data.Only rough indicators are available, such as total activity in themarket. Since the November 2012 Report, there has been littleevidence of any significant generalised change in marketactivity. While the size of the interest rate derivative marketincreased by 7% (as calculated by gross notional amountsoutstanding) during the period since November 2012, thevolumes of credit derivative contracts outstanding remainedbroadly unchanged, standing at less than half the levelexperienced at the market peak at the end of 2007. Andalthough the volume of interest rate derivatives that arecentrally cleared has risen by 11% since the November 2012Report, there was little change in the proportion of OTCderivatives cleared for most other asset classes. The impact ofthe introduction of clearing mandates in the United States andJapan during this time remains unclear.
…and uncertainties around the degree of financial system
leverage remained significant.
Asset prices have the potential to adjust rapidly whereinvestors are leveraged. Increases in asset prices over much ofthe period did not appear to have been accompanied by abroadly based rise in leverage. Leverage remained littlechanged across most global banks. Outside the bankingsector, higher risk appetite was generally being expressedthrough portfolio shifts and not through material increases ininvestors’ balance sheet leverage. For example, hedge fundleverage was reportedly still below 2007 levels. There were,however, some emerging signs of a revival of instruments withinherent sensitivity to economic outcomes — so-called‘embedded leverage’ — such as CLOs in the United States.Moreover, there remain substantial data gaps on balance sheetleverage in the non-bank financial sector, and on embeddedleverage across the financial system.
Regulatory capital ratios rose…
Reported regulatory capital ratios continued to rise in theUnited States and in most major European bankingsystems (Chart 1.17), though as discussed in Section 2 suchmeasures can provide a poor indication of resilience. By theend of 2012 European banks, including those in theUnited Kingdom, had raised their reported aggregate Tier 1capital ratio to 12.5%, a rise of 1.2 percentage points since theend of 2011. While the rise was material, this was mostly dueto a substantial fall in risk-weighted assets (Chart 1.18), asweak profitability constrained the ability of banks to generatecapital out of retained earnings. More recently, some majorEuropean banks have issued new equity. In the United States,the latest bank stress tests, which were published by theFederal Reserve in March 2013, suggested that aggregatelevels of capital among the major US banks were sufficient towithstand a severe stress, with only one institution judged tobe undercapitalised following the stress scenario.
Chart 1.17 Banking system reported Tier 1 capitalratios(a)(b)
0
2
4
6
8
10
12
France Germany Italy Spain United
Kingdom(c)United
States
2009
2010
2011
2012
Per cent16
14
Sources: SNL Financial and Bank calculations.
(a) End-year data.(b) Aggregated Tier 1 capital divided by aggregated risk-weighted assets of selected banks and
large complex financial institutions. Tier 1 capital and risk-weighted assets data are reportedon a Basel I basis for US banks. For European banks, these data are reported on a Basel IIbasis up to and including 2010 and on a Basel 2.5 basis thereafter.
(c) UK banks and building societies included are Barclays, HSBC, LBG, Nationwide and RBS.
1
0
1
2
3
Capital
Risk-weighted assets
Total change
Percentage points
+
–
France Germany Italy Spain United
Kingdom(c)United
States
Sources: SNL Financial and Bank calculations.
(a) Change between end-2011 and end-2012.(b) Chart shows a decomposition of changes in the weighted average Tier 1 capital ratio of
selected banks and large complex financial institutions. Tier 1 capital and risk-weightedassets data are reported on a Basel I basis for US banks. For European banks, these data arereported on a Basel 2.5 basis.
(c) UK banks and building societies included are Barclays, HSBC, LBG, Nationwide and RBS.
Chart 1.18 Contributions to the change in bankingsystems’ reported Tier 1 capital ratios(a)(b)
Chart 1.19 Banking system reported leverage ratios(a)(b)
0
2
4
6
8
10
12
France Germany Italy Spain United
Kingdom(c)
2009
2010
2011
2012
Per cent
Sources: SNL Financial and Bank calculations.
(a) End-year data.(b) Chart shows the average leverage — defined as total shareholders’ equity divided by total
assets — of selected banks and large complex financial institutions.(c) UK banks and building societies included are Barclays, HSBC, LBG, Nationwide and RBS.

16 Financial Stability Report June 2013
…but concerns remain about banks’ resilience.
Despite the improvement in reported regulatory measures ofcapital, market-based measures of banks’ capital adequacycontinued to suggest that investors were uncertain about thevalue of banks’ assets and the prospects for bank profitability.For many banks, market capitalisation remained low relative tothe book value of their assets. For example, 17 of the largest40 listed banks in Europe had a market capitalisation below3% of the book value of their assets.
While reported risk-based capital ratios have increased, theunderlying capital ratios of some of the largest European banksmay be currently lower than the ‘end-point’ Basel III commonequity Tier 1 capital ratio of 7%, to be implemented fully in2019 (Section 2). Separately, bank leverage has remained littlechanged (Chart 1.19). That reflects bank leverage being ameasure of resilience that does not use weights or models tocalibrate risks, although it too may imperfectly measureresilience to the extent that it is based on capital estimatesthat exaggerate loss-absorbing capacity. Increases innon-performing loan ratios in some vulnerable euro-areacountries are also consistent with market participants’uncertainty over valuations (Chart 1.20).
Funding market conditions improved…
Despite continuing concerns about banks’ resilience, theimprovement in bank debt funding conditions seeninternationally over the second half of 2012 continued in thefirst half of 2013. For example, in the United Kingdom,according to the Bank Liabilities Survey,(1) lenders reportedthat spreads on retail funding had fallen significantly in thethree months to end-May and were expected to fallsignificantly further over the next three months. At the sametime, many lenders also reported a fall in ‘other’ (such aswholesale) funding costs, with a further fall expected in Q3.
According to the ECB’s Bank Lending Survey, euro-area banksalso reported improved access to retail and wholesale fundingin 2013 Q1 and expected a further marginal improvement inconditions for most market segments in Q2. Consistent withthat, euro-area banks’ issuance of secured and unsecured termdebt in public markets also picked up, including by some banksin vulnerable euro-area countries (Chart 1.21). Contactssuggested that higher issuance was linked to continuingimprovement in sentiment as investors took comfort that theECB’s OMTs would provide a backstop in euro-area sovereigndebt markets.
…as reflected in lower funding costs.
Term funding costs for banks in Europe and the United Statesfell by about 40 basis points since the November 2012Report, while they remained broadly unchanged in theUnited Kingdom (Chart 1.22).
0
2
4
6
8
10
12
1998 2000 02 04 06 08 10 12
Italy
Portugal
Spain(d)
Per cent of loans
Sources: National central banks and Bank calculations.
(a) Data to April 2013.(b) The chart shows gross non-performing loans as a share of total loans. Definitional
differences of non-performing loans limit cross-country comparability.(c) Loans to resident non-financial firms and households.(d) The fall in the Spanish ratio in December 2012 and February 2013 is due to transfers of assets
to the Asset Management Company for Assets Arising from Bank Restructuring (‘Sareb’),which was set up to remove problematic assets from the balance sheets of Spanish banks.
Chart 1.20 Non-performing loan ratios(a)(b)(c)
(1) www.bankofengland.co.uk/publications/Pages/other/monetary/bls/bls1306.aspx.
0
50
100
150
200
250
300
350
400
H1 H2H1 H2H1 H2H1 H1 H2H1 H2H1 H2H1 H1 H2H1 H2H1 H2H1
Unsecured(b) Secured(c)US$ billions
United KingdomUnited States Euro area
2010 11 12 2010 11 12 2010 11 1213 13 13
Sources: Dealogic and Bank calculations.
(a) Securities with an original contractual maturity or earliest call date of at least 18 months. Includesprimary market issuance only and excludes issuance under government-guarantee schemes.Issuance is allocated to each region according to the bank’s nationality of operations listed onDealogic. 2013 H1 data are up to and including 17 June 2013.
(b) Unsecured issuance includes investment-grade and high-yield bonds and medium-term notes.(c) Secured issuance includes asset-backed securities, mortgage-backed securities and covered bonds.
Chart 1.21 Issuance of term bank senior secured andunsecured debt in public markets(a)
0
50
100
150
200
250
300
350
400
450
July Jan. July Jan.
United Kingdom(c)
Europe(b)
United States(d)
Basis points
(e)
2011 12 13
Sources: Bloomberg, Markit Group Limited and Bank calculations.
(a) Constant-maturity unweighted average of secondary market spreads to mid-swaps of banks’five-year senior unsecured bonds, where available. Where a five-year bond is unavailable, a proxyhas been constructed based on the nearest maturity of bond available for a given institution.
(b) European banks: BBVA, BNP Paribas, Crédit Agricole, Credit Suisse, Deutsche Bank, ING,Intesa, Rabobank, Santander, Société Générale, UBS and UniCredit.
(c) UK banks: Barclays, HSBC, LBG, Nationwide, RBS and Santander UK.(d) US banks: Bank of America Merrill Lynch, Citigroup, Goldman Sachs, JPMorgan, Morgan Stanley
and Wells Fargo.(e) November 2012 Report.
Chart 1.22 Major banks’ indicative senior unsecuredbond spreads(a)

Section 1 Global financial environment 17
A key influence on funding conditions was a decrease inperceptions of bank risk, reflecting improved market sentimentand a perceived reduction in tail risk. For example the cost ofdefault protection on euro-area banks’ unsecured bonds fellover the period as a whole (Chart 1.23). Bank equity pricesalso increased during much of the period, including in somevulnerable euro-area countries. In Italy, for example, bankequity prices rose by around 15% (Chart 1.24).
Credit conditions remained tight in the euro area…
As funding conditions in the euro area eased, there were somesigns that the process of financial fragmentation wasstarting to slow. As outlined in the November 2012 Report,since mid-2011 there had been large net private capitaloutflows from the vulnerable euro-area countries, which hadbeen replaced by official inflows and, in particular, a wideningof intra-Eurosystem TARGET balances.(1) Over recent months,these TARGET balances have narrowed (Chart 1.25), partlyreflecting Spanish banks’ renewed access to private repomarkets.
While the dispersion in funding conditions across euro-areabanks decreased, the divergence in lending conditions in theeuro area remained considerable. Interest rates on newlending to non-financial corporations in Italy, Spain and othervulnerable euro-area countries remained well above thosecharged by banks in Germany and France. Euro-area lendinggrowth also remained particularly weak in the vulnerableeuro-area countries. According to the ECB’s Bank Lending
Survey, credit conditions tightened further in the euro area in2013 Q1, albeit at a slower pace than in Q4. Credit conditionswere expected to tighten further in Q2. That contrasted withthe United States, where the Federal Reserve Board’s Survey of
Senior Loan Officers reported a further easing of creditstandards on commercial and industrial loans.
…while they eased in the United Kingdom…
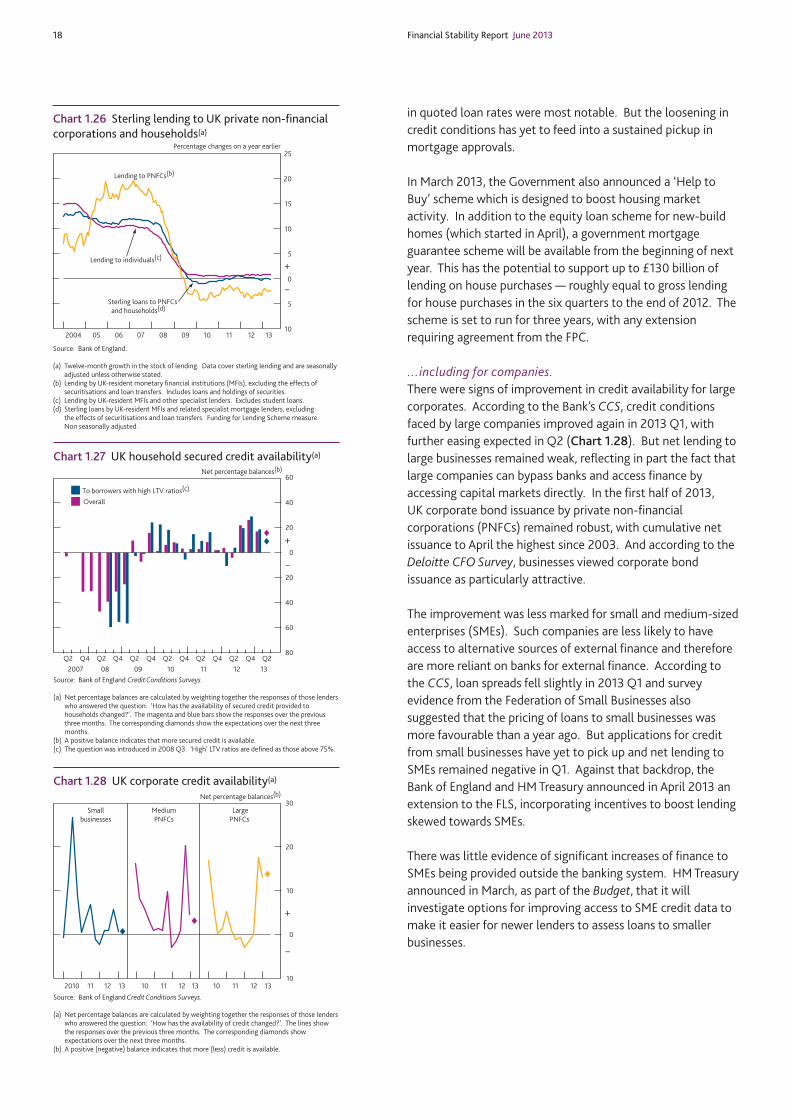
In the United Kingdom, lending growth remained weak.Annual household lending growth has averaged less than 1%over the past three years (Chart 1.26). Lending to businesseshas been weaker still, contracting by around 3% per annumover the same period.
The Bank’s Q1 Credit Conditions Survey (CCS) provided somesigns of improvement in UK credit availability. For households,mortgage availability was reported to have increased in Q1 andwas expected to improve further in Q2. The rise in creditavailability was reported to be a little more marked forborrowers with loan to value (LTV) ratios above 75%(Chart 1.27). FLS participants reported that the incentives tolend created by the Scheme had boosted mortgage marketcompetition, including for higher LTV products where the falls
(1) TARGET2 is a payment system owned and operated by the Eurosystem for thesettlement in central bank money of central bank operations, interbank transfers andother large-value euro-denominated payments.
0
100
200
300
400
500
600
700
800
2008 09 10 11 12 13
United Kingdom
United States
Germany
France
Italy
Spain
Basis points
(b)
Sources: SNL Financial, Thomson Reuters Datastream and Bank calculations.
(a) Average five-year CDS premia of selected banks and large complex financial institutions,weighted by assets as at end-2012.
(b) November 2012 Report.
Chart 1.23 Cost of default protection for selectedbanking systems(a)
0
5
10
15
20
25
30
Spain Germany United
Kingdom
France Italy United
States
Percentage change since the November 2012 Report
Sources: Thomson Reuters Datastream and Bank calculations.
(a) Indices used are FTSE France banks, FTSE Germany banks, FTSE Italy banks, FTSE Spain banks,FTSE UK banks and FTSE USA banks. All indices are denominated in US dollars.
Chart 1.24 Bank equity prices(a)
1,500
1,000
500
0
500
1,000
1,500
2003 04 05 06 07 08 09 10 11 12 13
Private sector flows(b)
Public sector flows (TARGET)(c)
Public sector flows (EU-IMF)(d)
Current account balance
€ billions
+
–
Sources: Central Statistics Office, European Commission, IMF, national central banks and Bankcalculations.
(a) Refers to Greece, Ireland, Italy, Portugal and Spain.(b) Data up to March 2013 with the exception of balance of payments data for Ireland, which are
to December 2012 and extrapolated thereafter.(c) Claims (liabilities) incurred within the Eurosystem via TARGET2 cross-border payment flows.(d) Loans disbursed under joint financing package with contributions from the European
Financial Stabilisation Mechanism, the European Financial Stability Facility, the EuropeanStability Mechanism, individual EU members under bilateral arrangements and the IMF.
Chart 1.25 Cumulative capital flows for selectedeuro-area countries(a)
18 Financial Stability Report June 2013
in quoted loan rates were most notable. But the loosening incredit conditions has yet to feed into a sustained pickup inmortgage approvals.
In March 2013, the Government also announced a ‘Help toBuy’ scheme which is designed to boost housing marketactivity. In addition to the equity loan scheme for new-buildhomes (which started in April), a government mortgageguarantee scheme will be available from the beginning of nextyear. This has the potential to support up to £130 billion oflending on house purchases — roughly equal to gross lendingfor house purchases in the six quarters to the end of 2012. Thescheme is set to run for three years, with any extensionrequiring agreement from the FPC.
…including for companies.
There were signs of improvement in credit availability for largecorporates. According to the Bank’s CCS, credit conditionsfaced by large companies improved again in 2013 Q1, withfurther easing expected in Q2 (Chart 1.28). But net lending tolarge businesses remained weak, reflecting in part the fact thatlarge companies can bypass banks and access finance byaccessing capital markets directly. In the first half of 2013,UK corporate bond issuance by private non-financialcorporations (PNFCs) remained robust, with cumulative netissuance to April the highest since 2003. And according to theDeloitte CFO Survey, businesses viewed corporate bondissuance as particularly attractive.
The improvement was less marked for small and medium-sizedenterprises (SMEs). Such companies are less likely to haveaccess to alternative sources of external finance and thereforeare more reliant on banks for external finance. According tothe CCS, loan spreads fell slightly in 2013 Q1 and surveyevidence from the Federation of Small Businesses alsosuggested that the pricing of loans to small businesses wasmore favourable than a year ago. But applications for creditfrom small businesses have yet to pick up and net lending toSMEs remained negative in Q1. Against that backdrop, theBank of England and HM Treasury announced in April 2013 anextension to the FLS, incorporating incentives to boost lendingskewed towards SMEs.
There was little evidence of significant increases of finance toSMEs being provided outside the banking system. HM Treasuryannounced in March, as part of the Budget, that it willinvestigate options for improving access to SME credit data tomake it easier for newer lenders to assess loans to smallerbusinesses.
2007 08 09 10 11 12 13
80
60
40
20
0
20
40
60
Q2 Q4 Q2 Q4 Q2 Q4 Q2 Q4 Q2 Q4 Q2 Q4 Q2
Overall
To borrowers with high LTV ratios(c)
Net percentage balances(b)
+
–
Source: Bank of England Credit Conditions Surveys.
(a) Net percentage balances are calculated by weighting together the responses of those lenderswho answered the question: ‘How has the availability of secured credit provided tohouseholds changed?’. The magenta and blue bars show the responses over the previousthree months. The corresponding diamonds show the expectations over the next threemonths.
(b) A positive balance indicates that more secured credit is available.(c) The question was introduced in 2008 Q3. ‘High’ LTV ratios are defined as those above 75%.
Chart 1.27 UK household secured credit availability(a)
10
0
10
20
30
2010 11 12 13 10 11 12 13 10 11 12 13
Smallbusinesses
MediumPNFCs
Net percentage balances(b)
+
–
LargePNFCs
Source: Bank of England Credit Conditions Surveys.
(a) Net percentage balances are calculated by weighting together the responses of those lenderswho answered the question: ‘How has the availability of credit changed?’. The lines showthe responses over the previous three months. The corresponding diamonds showexpectations over the next three months.
(b) A positive (negative) balance indicates that more (less) credit is available.
Chart 1.28 UK corporate credit availability(a)
10
5
0
5
10
15
20
25
2004 05 06 07 08 09 10 11 12 13
Percentage changes on a year earlier
Lending to PNFCs(b)
Lending to individuals(c)
Sterling loans to PNFCs
and households(d)
+
–
Source: Bank of England.
(a) Twelve-month growth in the stock of lending. Data cover sterling lending and are seasonallyadjusted unless otherwise stated.
(b) Lending by UK-resident monetary financial institutions (MFIs), excluding the effects ofsecuritisations and loan transfers. Includes loans and holdings of securities.
(c) Lending by UK-resident MFIs and other specialist lenders. Excludes student loans.(d) Sterling loans by UK-resident MFIs and related specialist mortgage lenders, excluding
the effects of securitisations and loan transfers. Funding for Lending Scheme measure.Non seasonally adjusted.
Chart 1.26 Sterling lending to UK private non-financialcorporations and households(a)