bodnar/hopwood ais 7th ed1 chapter 2 u systems techniques and documentation
TRANSCRIPT
Bodnar/Hopwood AIS 7th Ed 1
Chapter 2
Systems Techniques and Documentation
Bodnar/Hopwood AIS 7th Ed 2
Compliance vs Substantive Testing
Compliance Testing confirms assesses checks
the continuity of operation of internal controls (IC)

Bodnar/Hopwood AIS 7th Ed 3
Compliance vs Substantive Testing
Substantive Testing verifies
financial statements

Bodnar/Hopwood AIS 7th Ed 4
Types of Flowcharts
IPO and HIPO Systems and Program Analytic and Document

Bodnar/Hopwood AIS 7th Ed 5
IPO and HIPO
primarily narrative in nature used primarily by systems development
personnel

Bodnar/Hopwood AIS 7th Ed 6
Commonly Used Flowcharts
• Document Flowcharts
• Systems Flowcharts
• Program Flowcharts
• Data Flow Diagrams
Bodnar/Hopwood AIS 7th Ed 7
Document Flowcharts Flowcharts are pictorial representations of
transaction processing systems that portray flows of some type.
A Document Flowchart emphasizes the hardcopy inputs and outputs and their flows through organizational units.
Auditors and accountants may use document flowcharts when analyzing a current system for weaknesses in controls and reports.

Bodnar/Hopwood AIS 7th Ed 8
A Sample Document Flowchart
Requesting Department Central Supplies Department
Goods RequisitionForm
A
A
Goods Requisition Form
1 2
File
1
Bodnar/Hopwood AIS 7th Ed 9
Systems Flowchart
a pictorial or graphical representation of the overall flow of work, documents, and operations in a system
systems flowcharts are used by both auditors and systems development personnel

Bodnar/Hopwood AIS 7th Ed 10
System Flowcharts They use symbols that are industry
conventions standardized by the American National Standards Institute (ANSI).
Flowcharting symbols are grouped as input-output symbols, processing symbols, storage symbols, data and information flow symbols, and miscellaneous symbols.

Bodnar/Hopwood AIS 7th Ed 11
Invoice
(A)Single
Document
1
2
3
4
Shipping Receipt
(B)Overlapping symbols-
same documentSalesInvoice
4
(C)Two overlappingsymbols - same document
SalesOrder
3
Invoice2
(D)Two overlapping symbols -different documents
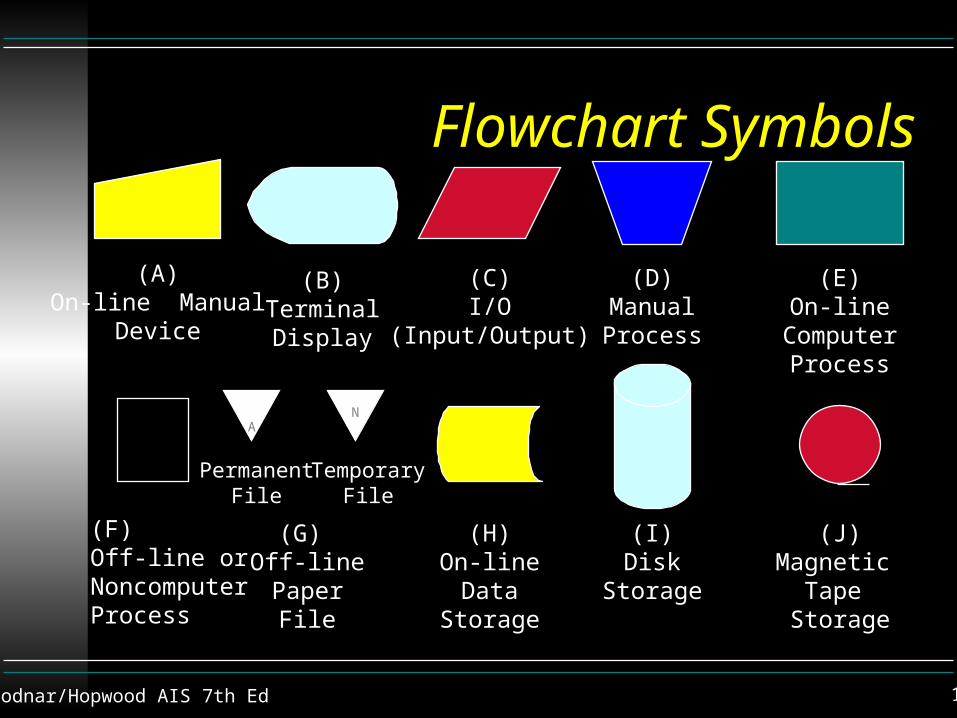
Flowchart Symbols: Documents
Bodnar/Hopwood AIS 7th Ed 12
(A)On-line Manual
Device
(B)TerminalDisplay
(C)I/O
(Input/Output)
(D)ManualProcess
(E)On-line
ComputerProcess
(F)Off-line orNoncomputerProcess
(H)On-lineData
Storage
(J)Magnetic
Tape Storage
PermanentFile
(G) Off-linePaperFile
TemporaryFile
NA
(I)Disk
Storage
Flowchart Symbols

Bodnar/Hopwood AIS 7th Ed 13
(E)Annotation
(F)Decision
(G)Calculator/Register
Tape
(H)PhysicalObject
----------------
(I)FlowLines
(J)Communication
Link
(A)Enter/ExitSystem
ToCustomer
FromBank (B)
Start (or end)Process
Start
(C)On-page
Connectors
1
1
Indicates the flow will continueat the on-page connector #1
Indicates where the flow continuesfrom the on-page connector #1
(D)Off-page
Connectors
p.41
1
p.2
on page 2:
on page 4:
to page 4connector #1
connector #1from page 2
Flowchart Symbols
Bodnar/Hopwood AIS 7th Ed 14
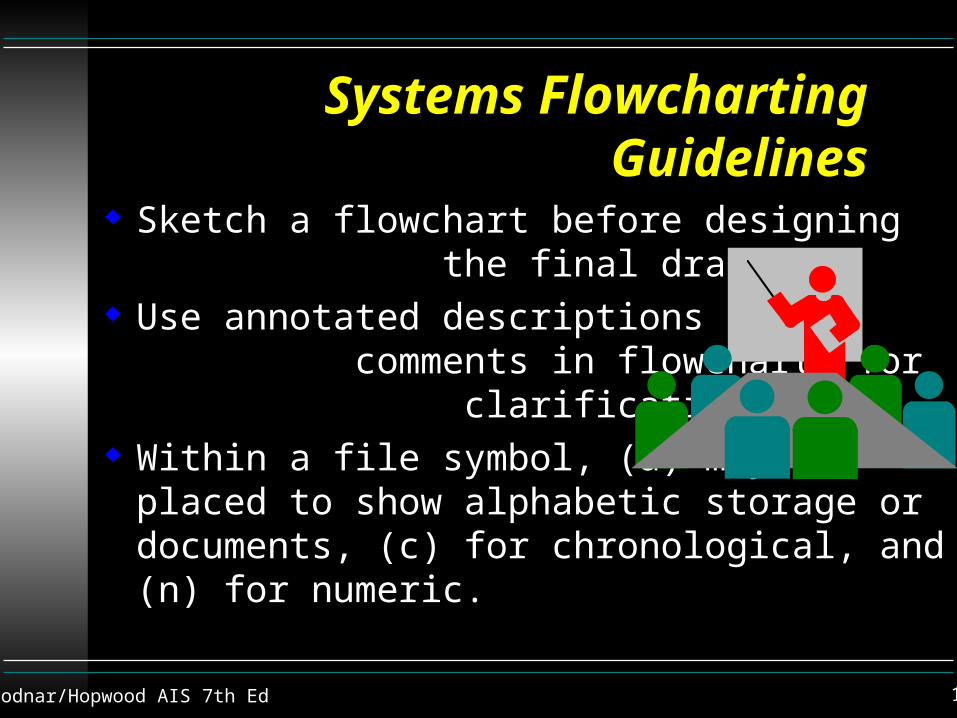
Systems Flowcharting Guidelines
Sketch a flowchart before designing the final draft.
Use annotated descriptions and comments in flowcharts for clarification.
Within a file symbol, (a) may be placed to show alphabetic storage or documents, (c) for chronological, and (n) for numeric.

Bodnar/Hopwood AIS 7th Ed 15
Systems Flowcharting Guidelines Flowcharts should read from top to bottom and
left to right. Use appropriate symbols; the variety should be
limited for clarity. Sandwich rule - a process symbol should always
be found between an input and an output symbol. Use connectors to avoid crossed lines and
cluttered flowcharts.

Bodnar/Hopwood AIS 7th Ed 16
Flowchart Element : Flow Lines Flow lines are used to connect the symbols
on the document flow chart. A solid line indicates the flow of a
document or object A dotted or dashed symbol indicates a flow
of information rather than the physical document

Bodnar/Hopwood AIS 7th Ed 17
Flowchart Element : Flow Lines
Arrows are used when the documents or information flow is not left-to-right or top-to-bottom
Some flowcharts also show communication flows such as by telephone modem or satellite

Bodnar/Hopwood AIS 7th Ed 18
Flowcharting Element: Area of Responsibility
Areas of responsibility are displayed to enable the flowchart reader to clearly identify changes in responsibility as the documents flow through the system.
They are represented on flowcharts by segmenting and labeling columns.
Bodnar/Hopwood AIS 7th Ed 19
Flowcharting Element: Area of Responsibility
Areas of responsibility may be departments, sections within a department, or individual employees within a department.
Judgment must be used in choosing the level of subdivision that one column should represent.

Bodnar/Hopwood AIS 7th Ed 20
Preparation Conventions Left-to-right, Top-to-bottom All documents must have an
origin and termination indicate origin by darkening
one corner of the symbol each copy of the document
must flow to a permanent file symbol a symbol denoting an exit from
the system, or
Keep flowcharts uncluttered place areas with frequent
interchange in adjacent columns
enter narrative only in symbols
Make sure progress of a document is clear. Diagram a document

Bodnar/Hopwood AIS 7th Ed 21
Preparation Conventions
an off-page connector a document destruction
symbol (small black box)
“cradle to grave” documentation
before and after each process entering or leaving a
file entering or leaving a
page or area of responsibility
Make sure the flowchart is complete

Bodnar/Hopwood AIS 7th Ed 22
Program Flowchart
a flowchart indicating detailed processing functions
program flowcharts are used primarily by systems development personnel
Bodnar/Hopwood AIS 7th Ed 23
Logical Data Flow Diagrams
Shows the system’s processes and the flows of data into and out of the processes, i.e., provides a logical view of the system.
Represents what tasks the system is doing, without emphasis on how, where, or by whom the tasks are being performed.
Appropriate for a macro-view of the system.
Bodnar/Hopwood AIS 7th Ed 24
Data Flow Diagrams (DFD) Data flow diagramming symbols are used for a
variety of system analysis purposes, including graphically displaying the logical flows of data through a process.
Unlike flowcharts which represent the physical components of an information system, data flow diagrams can provide a more conceptual, nonphysical display of the movement of data through a system.

Bodnar/Hopwood AIS 7th Ed 25
Data Flow Diagrams (DFD)
Data flow diagrams disregard such things as organizational units, the computer on which the data are processed, and the media on which the data are stored.
The movement of data across offices or departments within a particular system environment are not represented.

Bodnar/Hopwood AIS 7th Ed 26
(A)Process
(B)Data inflow sources,information outflow
destinations
(C)Data store
(D)Data flow lines
Data Flow Diagram Symbols

Bodnar/Hopwood AIS 7th Ed 27
(A)Process
Data Flow Diagram Symbols Process
Circles are used to represent processes that take data inflows and transform them to information outflows.
The circle contains two labels. The first label is a process number
(explained later) and the second is a process name.
Some use rectangular boxes with rounded corners.
Bodnar/Hopwood AIS 7th Ed 28
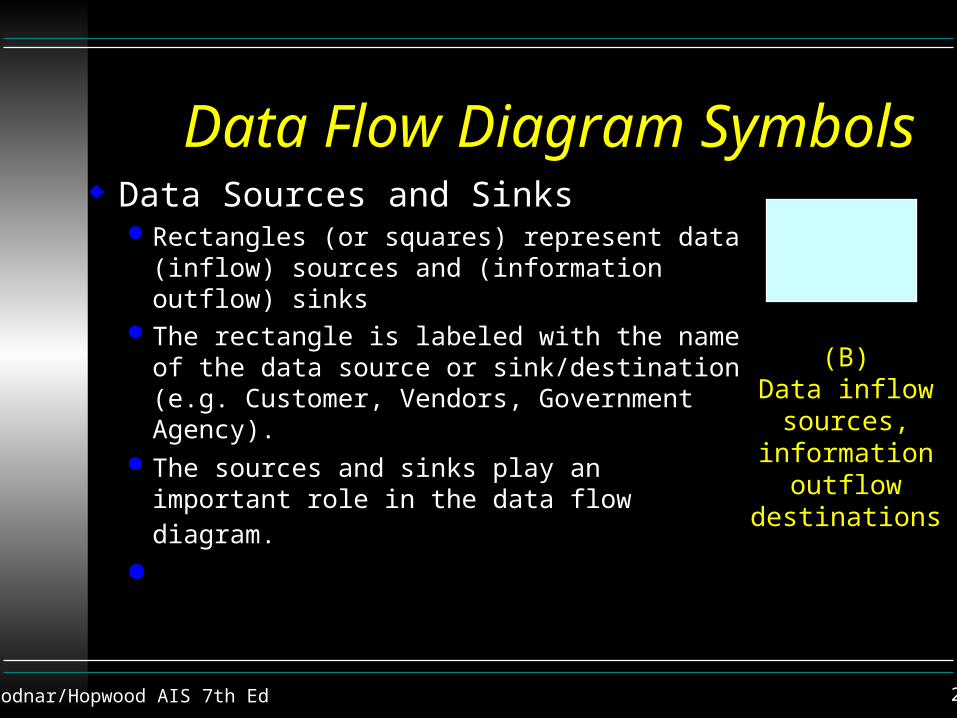
Data Flow Diagram Symbols Data Sources and Sinks
Rectangles (or squares) represent data (inflow) sources and (information outflow) sinks
The rectangle is labeled with the name of the data source or sink/destination (e.g. Customer, Vendors, Government Agency).
The sources and sinks play an important role in the data flow diagram.
(B)Data inflow
sources,information
outflow destinations
Bodnar/Hopwood AIS 7th Ed 29
Data Flow Diagram Symbols
The sources and sinks are agents external to (i.e. outside the scope of) the system represented on the diagram.
They delineate the boundaries of the system.

Bodnar/Hopwood AIS 7th Ed 30
Data Flow Diagram Symbols Data Stores
Two parallel straight lines are used to display a store or collection of data.
Some people refer to data stores as data at rest.
A description of the data store contents is entered on the symbol.
Data stores are used anytime it is necessary to store the output from a process before sending it on to the next process.
(C)Data store
Inventory
Bodnar/Hopwood AIS 7th Ed 31
Data Flow Diagram Symbols
Some use a rectangular box that is open at one end.
Bodnar/Hopwood AIS 7th Ed 32
Data Flow Diagram Symbols
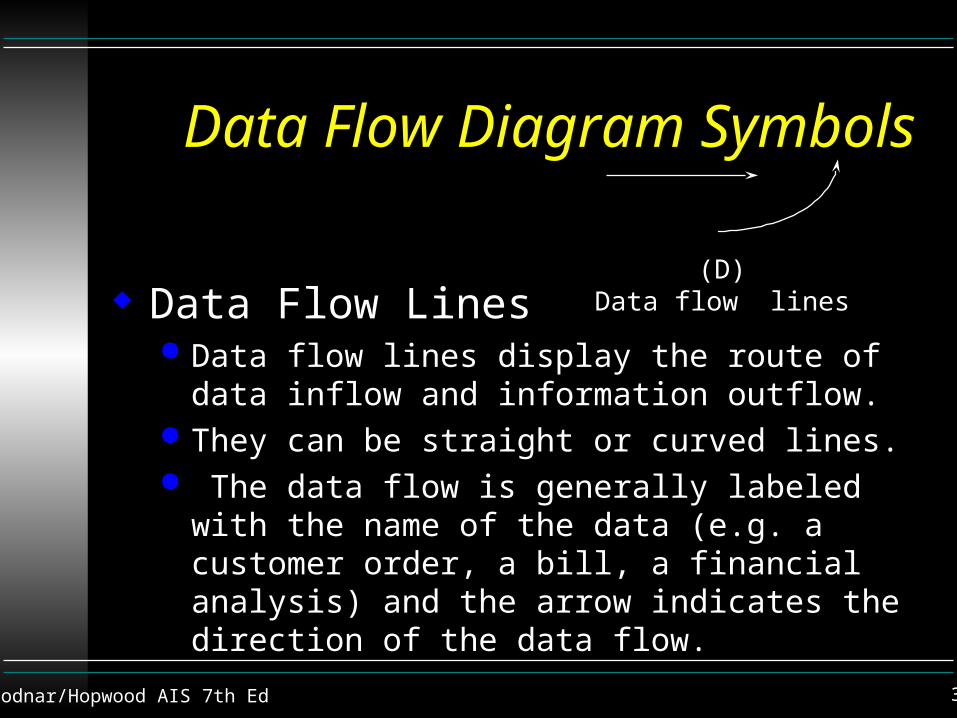
Data Flow Lines Data flow lines display the route of data inflow and
information outflow. They can be straight or curved lines. The data flow is generally labeled with the name of the
data (e.g. a customer order, a bill, a financial analysis) and the arrow indicates the direction of the data flow.
(D)Data flow lines

Bodnar/Hopwood AIS 7th Ed 33
Constraints: General Rules
All processes should have unique names. If two data flow lines (or data stores) have the same label, they should both refer to the exact same data flow (or data store).
The inputs to a process should differ from the outputs of a process.
Any single DFD should not have more than about seven processes.

Bodnar/Hopwood AIS 7th Ed 34
Constraints: Process Rules
No process can have only outputs. (This would imply that the process is making information from nothing.) If an object has only outputs, then it must be a source.
No process can have only inputs. (This is referred to as a “black hole”.) If an object has only inputs, then it must be a sink.
A process has a verb phrase label.
Incorrect
Correct
Incorrect
CorrectEdit
Bodnar/Hopwood AIS 7th Ed 35
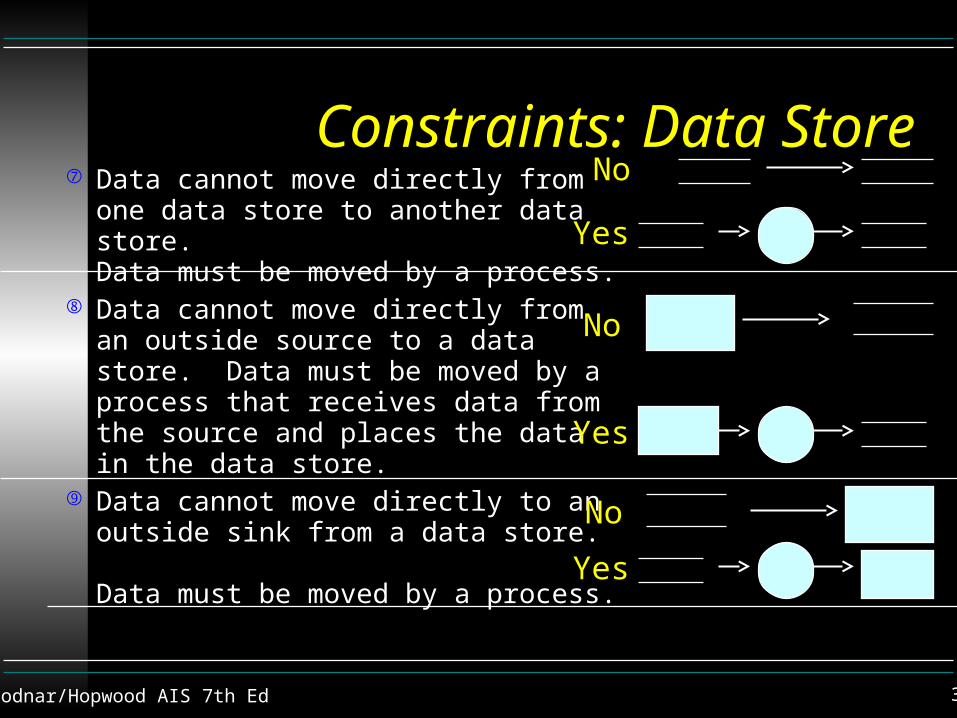
Constraints: Data Store Data cannot move directly from one
data store to another data store. Data must be moved by a process.
Data cannot move directly from an outside source to a data store. Data must be moved by a process that receives data from the source and places the data in the data store.
Data cannot move directly to an outside sink from a data store. Data must be moved by a process.
No
Yes
Yes
Yes
No
No

Bodnar/Hopwood AIS 7th Ed 36
Constraints: Data Store
A data store has a noun phrase label.
CUSTOMER
Bodnar/Hopwood AIS 7th Ed 37
Constraints: Source/Sink
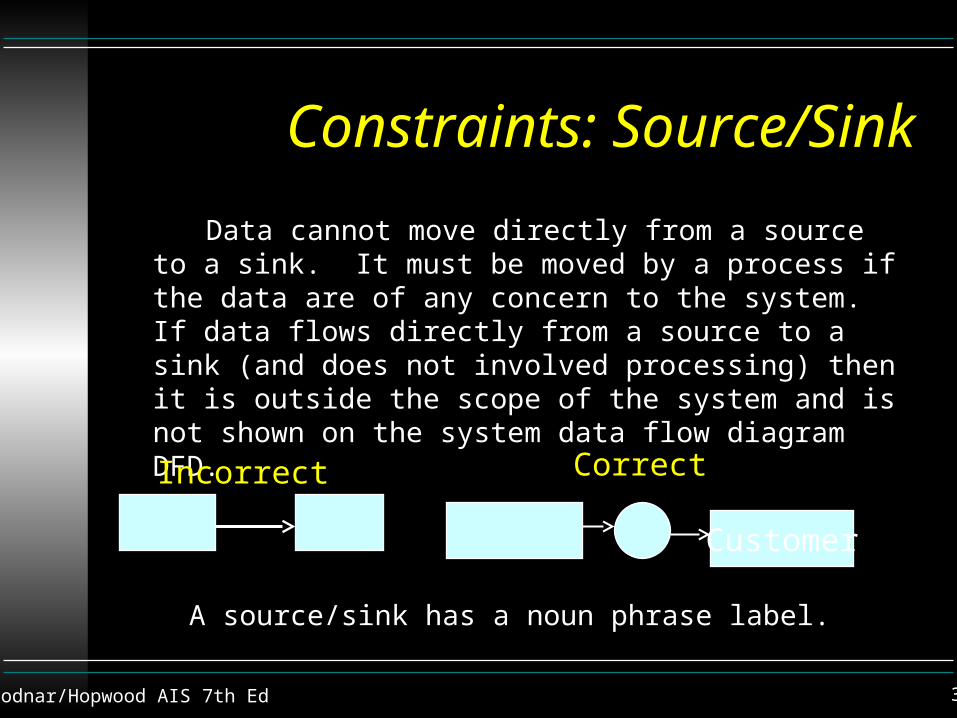
Data cannot move directly from a source to a sink. It must be moved by a process if the data are of any concern to the system. If data flows directly from a source to a sink (and does not involved processing) then it is outside the scope of the system and is not shown on the system data flow diagram DFD.
A source/sink has a noun phrase label.
Correct
Customer
Incorrect
Bodnar/Hopwood AIS 7th Ed 38
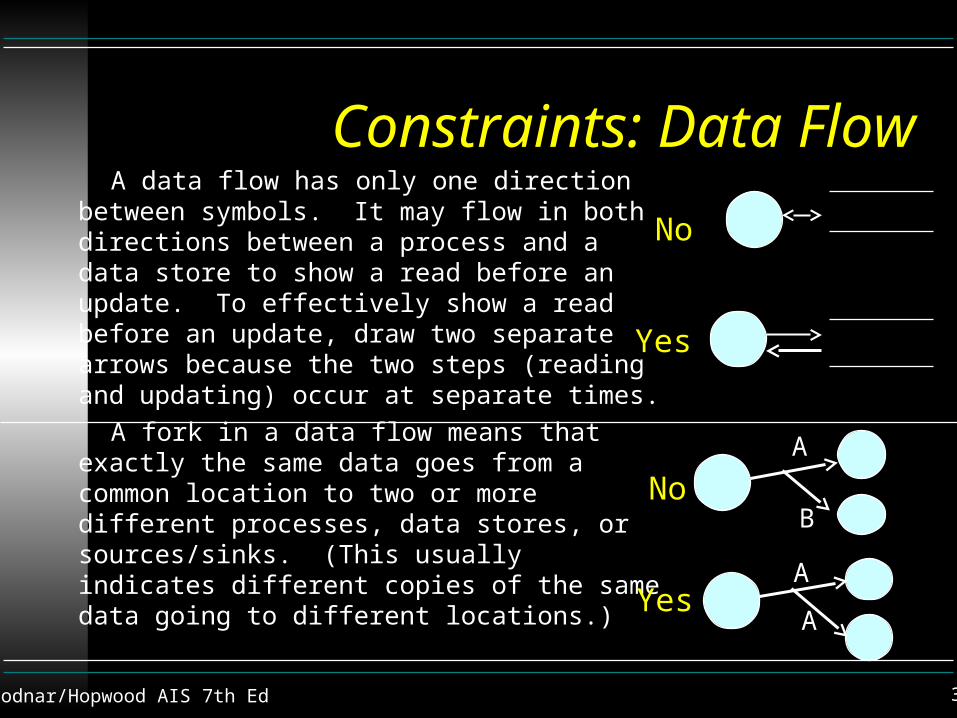
Constraints: Data Flow A data flow has only one direction between
symbols. It may flow in both directions between a process and a data store to show a read before an update. To effectively show a read before an update, draw two separate arrows because the two steps (reading and updating) occur at separate times.
A fork in a data flow means that exactly the same data goes from a common location to two or more different processes, data stores, or sources/sinks. (This usually indicates different copies of the same data going to different locations.)
No
Yes
A
B
A
A
No
Yes

Bodnar/Hopwood AIS 7th Ed 39
Constraints: Data Flow. A join in a data flow means that
exactly the same data comes from any of two or more different processes, data stores, or sources/sinks, to a common location.
A data flow cannot go directly back to the same process it leaves. There must be at least one other process that handles the data flow, produces some other data flow, and returns the original data flow to the originating process.
A data flow to a data store means update (i.e., delete, add, or change).
A data flow from a data store means retrieve or use.
A data flow has a noun phrase label. More than one data flow noun phrase can appear on a single arrow as long as all of the flows on the same arrow move together as one package.
Bodnar/Hopwood AIS 7th Ed 40
Context Diagram
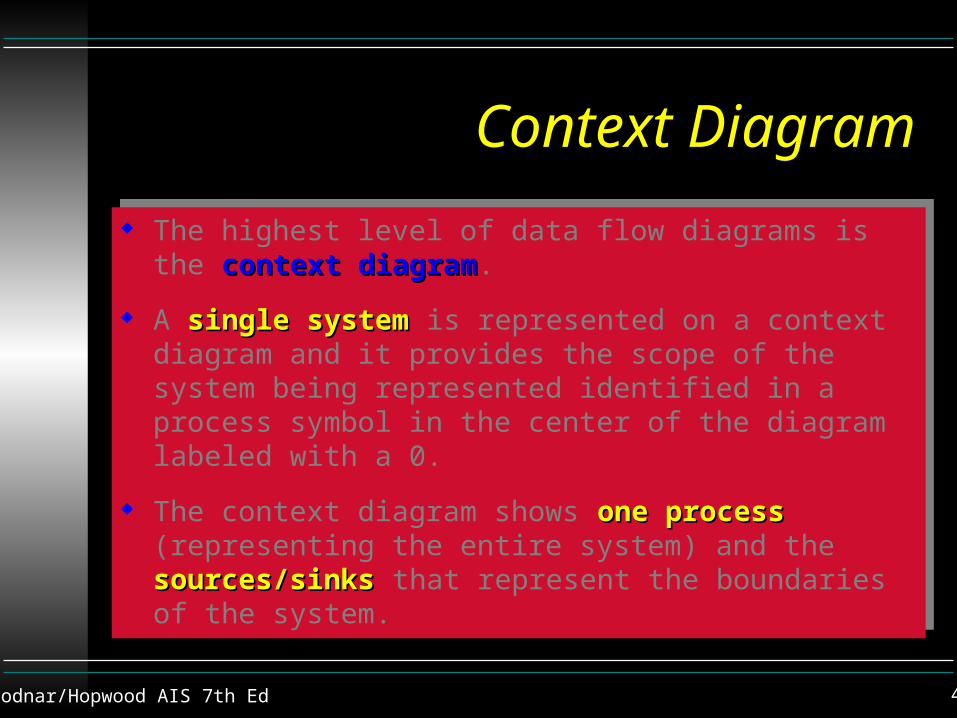
The highest level of data flow diagrams is the context context diagramdiagram.
A single systemsingle system is represented on a context diagram and it provides the scope of the system being represented identified in a process symbol in the center of the diagram labeled with a 0.
The context diagram shows one processone process (representing the entire system) and the sources/sinkssources/sinks that represent the boundaries of the system.
Bodnar/Hopwood AIS 7th Ed 41
Context Diagram
The data flow linesdata flow lines into the process represent the input data to the system (provided by sources) and the data flow lines from the process represent the output information from the system (going to the sinks).

Bodnar/Hopwood AIS 7th Ed 42
InternalDepartments
Customers Management
Investors and
Creditors
0Events Driven System
Reports
Financial Statements
Internal Events
External Events
Context Level Diagram Events Driven System

Bodnar/Hopwood AIS 7th Ed 43
Level Zero DFD Example
CustomersDecision Makers
1.0Process
CustomerOrders
2.0Deliveries toCustomers
3.0Process
Payments
Desire
d
Info
rmati
on
Bill
OrderDesired
Information
Payments
Accounts Receivable
Shipping Request
Bodnar/Hopwood AIS 7th Ed 44
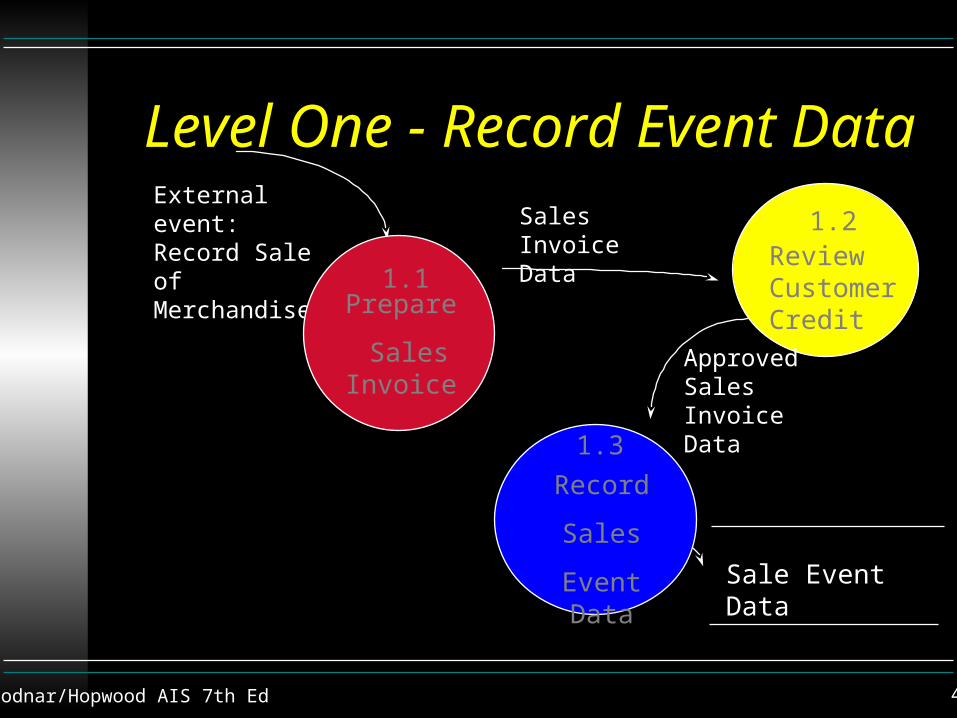
External event: Record Sale of Merchandise
Prepare
Sales Invoice
1.1
Sale Event Data
Review Customer Credit
1.2Sales Invoice Data
Record
Sales
Event Data
1.3
Approved Sales Invoice Data
Level One - Record Event Data

Bodnar/Hopwood AIS 7th Ed 45
Factory supervisor
Reviewtime
cards
Record weeklywages
Time cards
Reviewed time cards
Employee Earnings Records
Time card file(alpha)
Example Data Flow Diagram Example Flowchart
Version 1
FactorySupervisor
AccountingPayroll Clerk
1
2
N
Timecards
Reviewtime
cards
A
Recordwages
Employee EarningsRecords
1
2
N
Timecards
A= alphabetic
Bodnar/Hopwood AIS 7th Ed 46
Analytic Flowchart
charts the flow of documents and processing between different entities - which are represented by separate columns in the flowchart.
Examples of analytic flowcharts

Bodnar/Hopwood AIS 7th Ed 47
Analytic flowcharts and Internal Control Analysis
the grouping of functions facilitates analysis of segregation of duties
interfaces between entities are emphasized interfaces are important control points in a
system