bob economics - market outlook cytd20 21dec20
TRANSCRIPT

INDIA ECONOMICS
@2020 Bank of Baroda. All rights reserved
Important disclosures are provided at the end of this report.
MARKET OUTLOOK 21 December 2020
Year of rollercoaster ride
2020 was one of the worst years for global economy but one of the best years
for NASDAQ (5th highest since inception). Even in India, technology stocks
outperformed. Global yields fell and commodity prices increased. US$ too
fell. 2021 should see the trend continuing as pivot of growth shifts to Asia.
Higher commodity prices will drive inflation up. India’s retail inflation will
remain above 4% and yields will inch up as RBI starts to withdraw liquidity
support gradually (CRR cut upto Mar’21) and credit growth revives.
Sameer Narang +91 22 6698 5713 [email protected] Sonal Badhan
Aditi Gupta
Dipanwita Mazumdar [email protected]
Jahnavi
KEY HIGHLIGHTS
Global growth plunged, technology stocks
outperformed
Commodity prices inching up, US$ weak
Yields fall globally, central banks to remain
accommodative
India and global growth to revive, PLI scheme
and digitisation to benefit India
What a year: The 2020 pandemic, 9th since 1700, brought down global growth
from 2.8% in 2019 to a contraction of 4.4%. Fiscal deficits expanded globally
led by US at 19% and Europe at 10%. Central Banks stepped up stimulus by
bringing rates to record lows and undertaking balance sheet expansion. US Fed
increased its asset size by 14.8% of GDP in a year, and India by 6.7% (till
Dec’20).
Financial assets re-priced: Portfolio allocations moved away from debt into
equities in the US by more than US$ 200bn. US equity markets are higher in the
year led by 40% return on the tech heavy NASDAQ index. Even in India, tech
stocks have given a 39% return during the year. FPI inflows into Indian equity
markets during CY20 are at US$ 21.5bn while debt outflows are US$ 13.8bn.
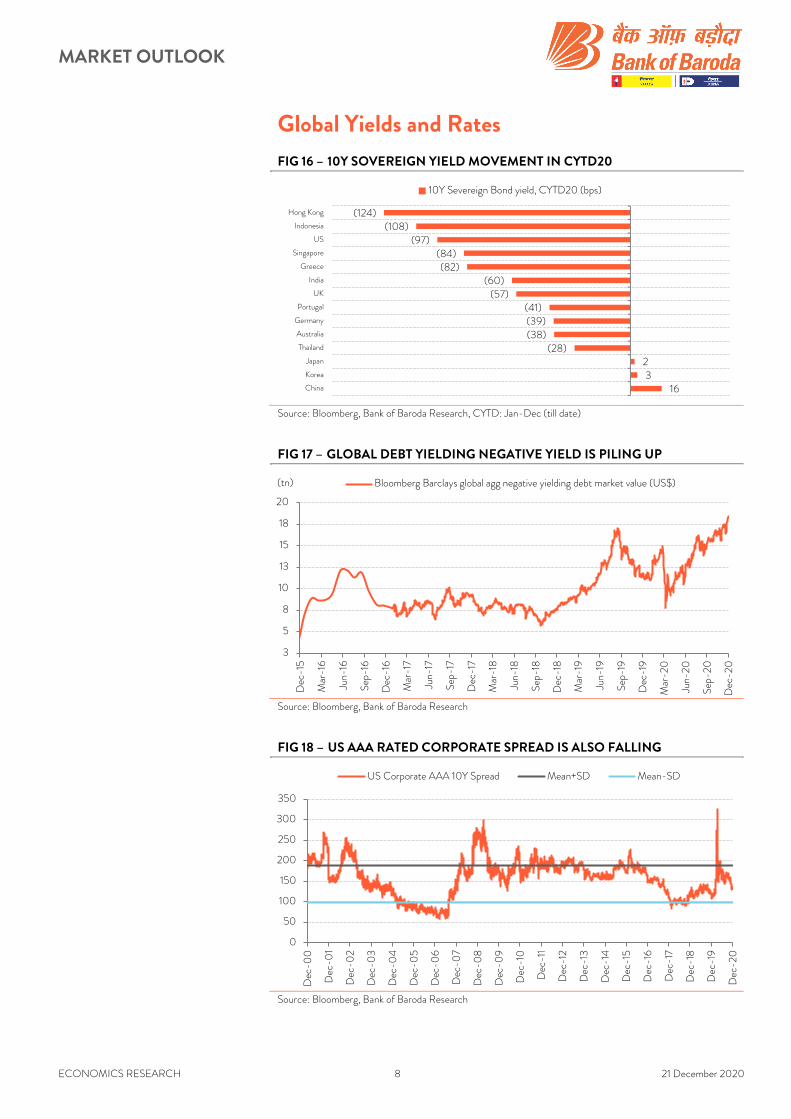
Global yields at rock bottom: As much as US$ 18tn of global debt are yielding a
negative return. Junk bond yields in the US have fallen to lowest level since
Feb’20. Even in India, RBI’s liquidity support has worked wonders with spread of
corporate bond yields over Gsec for prime borrowers falling to levels not seen
since 2010. For AAA borrowers (3yr) spread over Gsec is now less than 20bps.
What will change in 2021: Global liquidity conditions are likely to remain
accommodative, but yields may start to inch up as global growth revives. DXY
index will continue to under-perform. Commodity prices will remain firm as Asia
will continue to drive growth. Inflation will gradually inch up. Services inflation will
pick up gradually. Equity markets will continue to inch up as growth revives.
India’s growth at 8.8% in FY22: Led by revival in domestic consumption, India’s
growth will revive to 8.8% in FY22. Government’s PLI scheme is positive for
exports. So is flow of work to Indian IT firms. Inflation will remain a teething issue
(4.5% in FY22 versus 6.5% in FY21) because of higher global commodity prices.
Yields have bottomed out and will steadily inch upwards as credit growth revives.

MARKET OUTLOOK
ECONOMICS RESEARCH 2 21 December 2020
Contents
Macro Scenario ............................................................................................ 3
Policy Table .................................................................................................. 5
Global Equity Indices: .................................................................................. 6
India Scenario ............................................................................................... 7
Global Yields and Rates ............................................................................... 8
Indian Rates ............................................................................................... 10
Global Currencies and Commodities ..........................................................11

MARKET OUTLOOK
ECONOMICS RESEARCH 3 21 December 2020
Macro Scenario
FIG 1 – IMF PROJECTION SHOWS GDP OF MAJOR
ECONOMIES TO CONTRACT SHARPLY IN CY20 FIG 2 – BALANCE SHEET OF MAJOR ECONOMIES ARE
SKYROCKETING
Source: IMF, Bank of Baroda Research Note: US growth estimates are
FOMC’s projection, FY21 estimates of India are RBI’s projection and FY22
estimates are author’s own calculation
Source: Bloomberg, Bank of Baroda Research
FIG 3 – MANUFACTURING PMI FIG 4 – SERVICES PMI
Source: CEIC, Bank of Baroda Research Source: CEIC, Bank of Baroda Research
FIG 5 – EXPORTS GROWTH COUNTRYWISE FIG 6 – IMPORTS GROWTH COUNTRYWISE
Source: CEIC, Bloomberg, Bank of Baroda Research Source: CEIC, Bloomberg, Bank of Baroda Research
(2.4%)
(8.3%)(9.8%)
(5.3%)
1.9%
(7.5%)
4.2% 5.2% 5.9%
2.3%
8.2% 8.8%
(15%)
(10%)
(5%)
0%
5%
10%
US Euro Area UK Japan China India
CY20 CY21
0
1,000
2,000
3,000
4,000
5,000
6,000
7,000
8,000
0
100
200
300
400
500
600
700
800
Dec-03
Dec-04
Dec-05
Dec-06
Dec-07
Dec-08
Dec-09
Dec-10
Dec-11
Dec-12
Dec-13
Dec-14
Dec-15
Dec-16
Dec-17
Dec-18
Dec-19
Dec-20
BoJ balance sheet (JPY tn)
Fed balance sheet (US$ bn) (R)
27
3642
3338
5652
58 5650
0
10
20
30
40
50
60
70
India China US ISM Eurozone Japan
Min Current* Manufacturing PMI
5
30
42
12
36
5456 56
47 47
0
10
20
30
40
50
60
India China US Eurozone Japan
Min Current* Services PMI
14.8%
(5.9%)
(7.9%)
(13.3%)
(15.4%)
(16.4%)
(17.1%)
(22.6%)
(25%) (15%) (5%) 5% 15%
China
Indonesia
Brazil
Japan
US
UK
India
Russia
Exports, CYTD20
(2%)
(7%)
(10%)
(13%)
(14%)
(15%)
(18%)(28%)
(30%) (20%) (10%) 0%
China
Russia
US
Japan
UK
Brazil
Indonesia
India
Imports, CYTD20

MARKET OUTLOOK
ECONOMICS RESEARCH 4 21 December 2020
FIG 7 – INFLATION PROJECTION COUNTRYWISE
SHOWS INDIA AN OUTLIER FIG 8 – FISCAL DEFICIT AS % OF GDP COUNTRYWISE
Source: IMF, Bank of Baroda Research, Note: US CPI are projections of
FOMC, India print is author’s own calculation Source: IMF, Bank of Baroda Research
1.2%
0.4%0.9% 0.2%
3.0%
6.5%
1.8%
0.9%0.2% 0.3%
2.7%
4.5%
0%
1%
2%
3%
4%
5%
6%
7%
US Euro Area UK Japan China India
CYTD20 CY21
1.9
(0.6)
(6.3)
(8.2)
(3.3)
(2.2)
(6.0)
(6.3)
(5.3)
(10.1)
(11.9)
(13.1)
(14.2)
(16.5)
(16.8)
(18.7)
(22) (17) (12) (7) (2) 3
Russia
Euro Area
China
India
Japan
UK
Brazil
US
(%)
2020 2019

MARKET OUTLOOK
ECONOMICS RESEARCH 5 21 December 2020
Policy Table
FIG 9 – GLOBAL CENTRAL BANKS ARE ON MONETARY EASING CYCLE
Country Current inflation rate
(%)
Current policy rate
(%)
CY19
(change in bps)
CYTD20
(change in bps)
Direction of policy rate
in CYTD20
Turkey 14.03 15.00 (1,200) 300 �
Germany (0.30) 0 0 0 -
Japan (0.90) (0.10) 0 0 -
China (0.50) 4.35 0 0 -
UK 0.30 0.10 0 (65) �
Australia 0.70 0.1 (75) (65) �
Korea 0.60 0.5 (50) (75) �
Thailand (0.41) 0.5 (50) (75) �
India 6.93 4 (135) (115) �
Indonesia 1.59 3.75 (100) (125) �
Malaysia (1.50) 1.75 (25) (125) �
US 1.20 0.25 (75) (150) �
Russia 4.40 4.25 (150) (200) �
Phillipines 3.30 2.00 (75) (200) �
Brazil 4.31 2.00 (200) (250) �
Mexico 3.33 4.25 (100) (300) �
Source: Bloomberg, Bank of Baroda Research

MARKET OUTLOOK
ECONOMICS RESEARCH 6 21 December 2020
Global Equity Indices:
FIG 10 – CYTD20 CHANGE OF MAJOR EQUITY INDICES
Source: Bloomberg, Bank of Baroda Research, CYTD: Jan-Dec (till date)
FIG 11 – PERFORMANCE OF MAJOR STOCKS OF NASDAQ
Source: Bloomberg, Bank of Baroda Research, CYTD: Jan-Dec (till date)
FIG 12 – VOLATILITY IN EQUITY INDICES IS PACIFYING
Source: Bloomberg, Bank of Baroda Research
33%18%18%
12%8%8%
7%6%
(1%)(7%)(7%)(7%)(7%)
(10%)(11%)
(13%)
Korea
Japan
China
MSCI EM Equity
India
Germany
Australia
US
Portugal
Hong Kong
Thailand
Greece
Indonesia
Russia
Singapore
UK
Equity Indices, % change CYTD20
731%126%
119%
73%
73%
65%
52%
39%
35%
29%
13%
(30%) 20% 70% 120% 170%
Tesla
NVIDIA Corp
Paypal
Amazon
Apple
Netflix
Adobe
Microsoft
Comcast
NASDAQ-Top 10 Stocks, YTD
5
25
45
65
85
10
30
50
70
90
Dec-19
Feb-20
Mar-20
May-20
Jun-20
Aug-20
Sep-20
Oct-20
Dec-20
NSE volatility index Chicago board options exchange volatility index (R)

MARKET OUTLOOK
ECONOMICS RESEARCH 7 21 December 2020
India Scenario
FIG 13 – SECTORWISE STOCKS PERFORMANCE FIG 14 – SMALL CAP ROSE THE MOST
Source: Bloomberg, Bank of Baroda Research, CYTD: Jan-Dec (till date) Source: Bloomberg, Bank of Baroda Research, CYTD: Jan-Dec (till date)
FIG 15 – PERFORMANCE OF MAJOR STOCKS IN THE DOMESTIC MARKET
Source: Bloomberg, Bank of Baroda Research, CYTD: Jan-Dec (till date)
39.1%
18.6%
12.2%
9.8%
9.0%
7.9%
5.0%
(2.4%)
(4.0%)
(20%) (10%) 0% 10% 20% 30% 40% 50%
Teck
Cons durables
Auto
Cap goods
Metal
Power
Realty
Oil & Gas
BANKEX
Performance of majore sectors in BSE, CYTD20
29.7%
18.9%
13.8%
12.8%
BSE SmallCap
BSE MidCap
BSE
BSE LargeCap
Performances according to mcap, CYTD20
63%57%
46%38%
34%33%33%32%
28%27%
24%24%22%21%
16%12%11%
5%3%3%2%
(1%)(2%)(4%)
(10%)(13%)
(19%)(19%)
(23%)(40%)
Infosys Ltd
HCL Technologies Ltd
Asian Paints Ltd
Mahindra & Mahindra LTD
Tata Steel Ltd
Sun Pharma Ltd
Reliance Industries Ltd
TCS
Titan Co Ltd
Ultra tech Cement Ltd
Nestle India Ltd
Bajaj Finance Ltd
Tech Mahindra Ltd
HUL
Kotak Mahindra Bank Ltd
Bharti Airtel Ltd
HDFC Bank Ltd
Bajaj Auto Ltd
HDFC
Maruti Suzuki India Ltd
Powere Grid Corp of India, LTD
L&T
Bajaj Finserv ltd
ICICI Bank Ltd
ITC Ltd
NTPC Ltd
State Bank of India
Axis Bank Ltd
ONGC
IndusInd Bank Ltd
Performance of major stocks of Sensex, CYTD20
MARKET OUTLOOK
ECONOMICS RESEARCH 8 21 December 2020
Global Yields and Rates
FIG 16 – 10Y SOVEREIGN YIELD MOVEMENT IN CYTD20
Source: Bloomberg, Bank of Baroda Research, CYTD: Jan-Dec (till date)
FIG 17 – GLOBAL DEBT YIELDING NEGATIVE YIELD IS PILING UP
Source: Bloomberg, Bank of Baroda Research
FIG 18 – US AAA RATED CORPORATE SPREAD IS ALSO FALLING
Source: Bloomberg, Bank of Baroda Research
1632
(28)(38)(39)(41)
(57)(60)
(82)(84)
(97)(108)
(124)
China
Korea
Japan
Thailand
Australia
Germany
Portugal
UK
India
Greece
Singapore
US
Indonesia
Hong Kong
10Y Severeign Bond yield, CYTD20 (bps)
3
5
8
10
13
15
18
20
Dec-15
Mar-16
Jun-16
Sep-16
Dec-16
Mar-17
Jun-17
Sep-17
Dec-17
Mar-18
Jun-18
Sep-18
Dec-18
Mar-19
Jun-19
Sep-19
Dec-19
Mar-20
Jun-20
Sep-20
Dec-20
(tn) Bloomberg Barclays global agg negative yielding debt market value (US$)
0
50
100
150
200
250
300
350
Dec-00
Dec-01
Dec-02
Dec-03
Dec-04
Dec-05
Dec-06
Dec-07
Dec-08
Dec-09
Dec-10
Dec-11
Dec-12
Dec-13
Dec-14
Dec-15
Dec-16
Dec-17
Dec-18
Dec-19
Dec-20
US Corporate AAA 10Y Spread Mean+SD Mean-SD

MARKET OUTLOOK
ECONOMICS RESEARCH 9 21 December 2020
FIG 19 – US JUNK BOND YIELD
Source: Bloomberg, Bank of Baroda Research
FIG 20 – US MORTGAGE RATE
Source: Bloomberg, Bank of Baroda Research
0
5
10
15
20
Dec-04
Dec-05
Dec-06
Dec-07
Dec-08
Dec-09
Dec-10
Dec-11
Dec-12
Dec-13
Dec-14
Dec-15
Dec-16
Dec-17
Dec-18
Dec-19
Dec-20
Bloomberg Barclays US Corporate High Yield Average OAS
1%
2%
3%
4%
5%
6%
Dec-10
Jun-11
Dec-11
Jun-12
Dec-12
Jun-13
Dec-13
Jun-14
Dec-14
Jun-15
Dec-15
Jun-16
Dec-16
Jun-17
Dec-17
Jun-18
Dec-18
Jun-19
Dec-19
Jun-20
Dec-20
US 30Y Mortgage rates US 30Y Sovereign bond yield

MARKET OUTLOOK
ECONOMICS RESEARCH 10 21 December 2020
Indian Rates
FIG 21 – CORP SPREAD FOR 3Y AAA RATED PAPERS
BELOW ITS MEAN REVERSION LEVEL FIG 22 – FOR 10Y AAA RATED CORPORATE PAPERS AS
WELL IT IS APPROACHING ITS LOWS
Source: Bloomberg, Bank of Baroda Research Source: Bloomberg, Bank of Baroda Research
FIG 23 – SPREAD OF NBFC AAA RATED IS ALSO
BELOW ITS MEAN REVERSION LEVEL
FIG 24 – FOR 10Y AAA RATED NBFC PAPER, THE
SPREAD IS ALSO SIGNIFICANTLY LOWER
Source: Bloomberg, Bank of Baroda Research Source: Bloomberg, Bank of Baroda Research
FIG 25 – INR SWAP 3-YR FIG 26 – INR SWAP 10-YR
Source: Bloomberg, Bank of Baroda Research Source: Bloomberg, Bank of Baroda Research
0
50
100
150
200
250
Dec-13
Jun-14
Dec-14
Jun-15
Dec-15
Jun-16
Dec-16
Jun-17
Dec-17
Jun-18
Dec-18
Jun-19
Dec-19
Jun-20
Dec-20
Average traded spreads of corporates for 3Y AAA
Mean+SD
Mean-SD
0
30
60
90
120
150
180
Dec-13
Jun-14
Dec-14
Jun-15
Dec-15
Jun-16
Dec-16
Jun-17
Dec-17
Jun-18
Dec-18
Jun-19
Dec-19
Jun-20
Dec-20
Average traded spreads of corporates for 10Y AAA
Mean+SD
Mean-SD
0
50
100
150
200
250
Dec-13
Jun-14
Dec-14
Jun-15
Dec-15
Jun-16
Dec-16
Jun-17
Dec-17
Jun-18
Dec-18
Jun-19
Dec-19
Jun-20
Dec-20
Average traded spreads of NBFCs for 3Y AAA
Mean+SD
Mean-SD
0
50
100
150
200
Dec-13
Jun-14
Dec-14
Jun-15
Dec-15
Jun-16
Dec-16
Jun-17
Dec-17
Jun-18
Dec-18
Jun-19
Dec-19
Jun-20
Dec-20
Average traded spreads of NBFCs for 10Y AAA
Mean+SD
Mean-SD
3
5
7
9
11
Dec-00
Dec-02
Dec-04
Dec-06
Dec-08
Dec-10
Dec-12
Dec-14
Dec-16
Dec-18
Dec-20
INR Swap 3Y Mean+SD Mean-SD
3
5
7
9
11
Dec-04
Dec-05
Dec-06
Dec-07
Dec-08
Dec-09
Dec-10
Dec-11
Dec-12
Dec-13
Dec-14
Dec-15
Dec-16
Dec-17
Dec-18
Dec-19
Dec-20
INR Swap 10Y Mean+SD Mean-SD

MARKET OUTLOOK
ECONOMICS RESEARCH 11 21 December 2020
Global Currencies and Commodities
FIG 27 – MOVEMENT OF MAJOR CURRENCIES, CYTD20
Source: Bloomberg, Bank of Baroda Research
FIG 28 – FX RESERVES ACCRETION, CYTD20
Source: Bloomberg, Bank of Baroda Research
FIG 29 – EQUITY IN CYTD20 FIG 30 – DEBT IN CYTD20
Source: Bloomberg, Bank of Baroda Research Source: Bloomberg, Bank of Baroda Research
9.3
8.6
6.5
5.9
5.3
5.2 5.1
2.0
1.6 1.4
1.3
0.5 (1.7)
(3.0)
(6.6)
(15.5)
EUR
AUD
CNY
NZD
PHP
KRW
JPY
GBP
CAD
SGD
MYR
THB
IDR
INR
DXY
RUB
CYTD20 change (%)
121
71
51
33
20
17
3
2
2
1
(3)
(3)
(20) 0 20 40 60 80 100 120 140
India
China
Japan
Hong Kong
Euro Area
Mexico
Indonesia
U.K
US
Germany
South Africa
Brazil
(bn)
Forex Reserves accretion, YTD
228.1110.1104.0
21.517.312.3
(3.1)(4.6)(8.1)
(11.8)(16.1)
(19.2)
US
Euro Area
China
India
UK
Russia
Indonesia
Turkey
South Africa
Italy
Germany
Taiwan
Net FII Equity, YTD
(US$ bn) 310.5119.3
49.620.29.63.72.7
(3.9)(6.9)
(13.8)(15.2)
(307.7)
Euro Area
China
Germany
UK
Russia
Philippines
Malaysia
Brazil
Turkey
India
Italy
USNet FII Debt
(US$ bn)

MARKET OUTLOOK
ECONOMICS RESEARCH 12 21 December 2020
FIG 31 – MOVEMENT OF MAJOR ASSET CLASSES
Source: Bloomberg, Bank of Baroda Research
17.6%
9.8%
(5.3%)
(1.0%)
(8.9%)
(6.0%)
(10.5%)
50.4%
26.8%
1.3%
(0.6%)
(1.9%)
(3.9%)
(33.2%)
(40%) (20%) 0% 20% 40% 60%
Precious metal index
Gold
MSCI EM equity
MSCI EM currency
Roger Agri index
CRB index
Brent
CYTD20 CY19

MARKET OUTLOOK
ECONOMICS RESEARCH 13 21 December 2020
Disclaimer
The views expressed in this research note are personal views of the author(s) and do not necessarily reflect the views of Bank of Baroda. Nothing contained in this
publication shall constitute or be deemed to constitute an offer to sell/ purchase or as an invitation or solicitation to do so for any securities of any entity. Bank of Baroda
and/ or its Affiliates and its subsidiaries make no representation as to the accuracy; completeness or reliability of any information contained herein or otherwise provided
and hereby disclaim any liability with regard to the same. Bank of Baroda Group or its officers, employees, personnel, directors may be associated in a commercial or
personal capacity or may have a commercial interest including as proprietary traders in or with the securities and/ or companies or issues or matters as contained in this
publication and such commercial capacity or interest whether or not differing with or conflicting with this publication, shall not make or render Bank of Baroda Group
liable in any manner whatsoever & Bank of Baroda Group or any of its officers, employees, personnel, directors shall not be liable for any loss, damage, liability whatsoever
for any direct or indirect loss arising from the use or access of any information that may be displayed in this publication from time to time.
Visit us at www.bankofbaroda.in
For further details about this publication, please contact:
Economics Research Department
Bank of Baroda
+91 22 6698 5713