board of trustees meeting public school retirement system ... · board of trustees meeting . public...
TRANSCRIPT

2019-02-25 TOC.doc
Board of Trustees Meeting Public School Retirement System
of the City of St. Louis February 25, 2019
Table of Contents
Meeting Agenda and Notice
Minutes of Board of Trustees Meetings ................................................................ Tab 1Board of Trustees Regular Meeting: December 17, 2018
Consent Agenda Items for Approval ..................................................................... Tab 2Retirements and Benefits: January and February 2019
Refund Distributions Paid: December 2018 and January 2019
Bills Paid: December 2018 and January 2019
Minutes of Committee Meetings ............................................................................ Tab 3None
Action Items, Communications and Reports ......................................................... Tab 42018 Actuarial Cost Statement
Routine Information Items ..................................................................................... Tab 5Investment Information: November and December 2018
Year-to-Date Budget Information: December 2018 and January 2019
Professional Services Invoices
Travel Expenses Report: No Report
2019-02-25 AGENDA.DOC
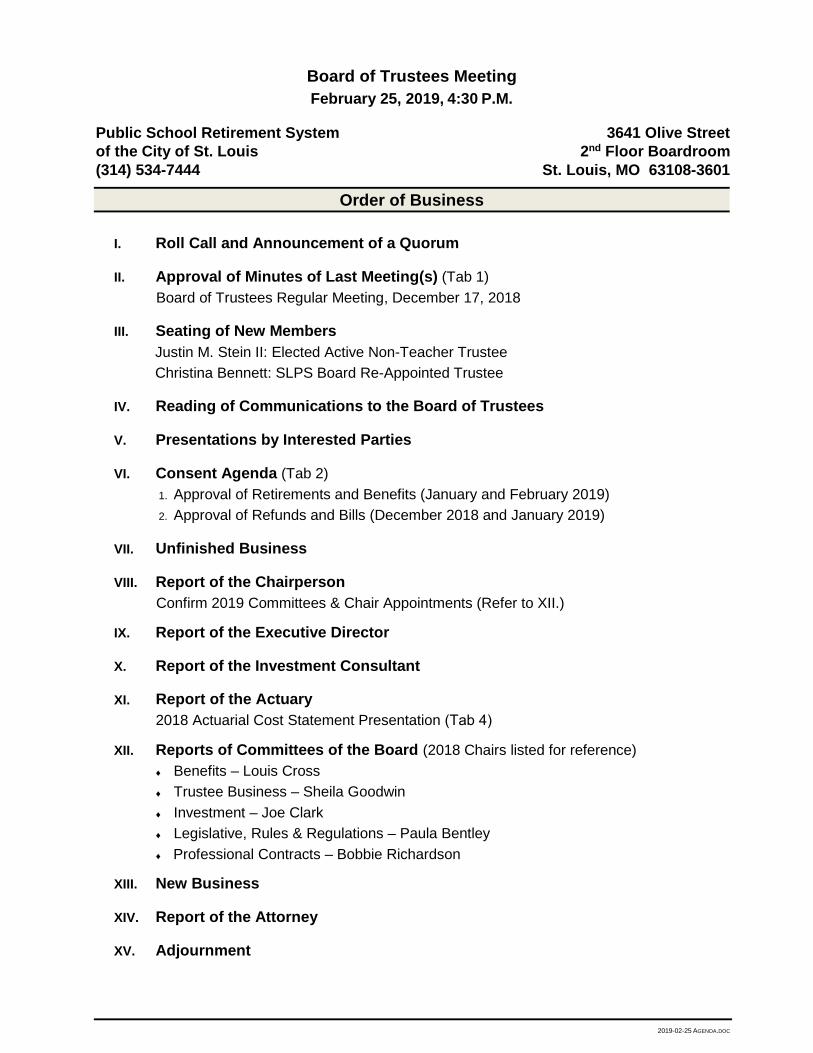
Board of Trustees Meeting February 25, 2019, 4:30 P.M.
Public School Retirement System 3641 Olive Street of the City of St. Louis 2nd Floor Boardroom (314) 534-7444 St. Louis, MO 63108-3601
Order of Business
I. Roll Call and Announcement of a Quorum
II. Approval of Minutes of Last Meeting(s) (Tab 1)Board of Trustees Regular Meeting, December 17, 2018
III. Seating of New MembersJustin M. Stein II: Elected Active Non-Teacher TrusteeChristina Bennett: SLPS Board Re-Appointed Trustee
IV. Reading of Communications to the Board of Trustees
V. Presentations by Interested Parties
VI. Consent Agenda (Tab 2)1. Approval of Retirements and Benefits (January and February 2019)2. Approval of Refunds and Bills (December 2018 and January 2019)
VII. Unfinished Business
VIII. Report of the ChairpersonConfirm 2019 Committees & Chair Appointments (Refer to XII.)
IX. Report of the Executive Director
X. Report of the Investment Consultant
XI. Report of the Actuary2018 Actuarial Cost Statement Presentation (Tab 4)
XII. Reports of Committees of the Board (2018 Chairs listed for reference)♦ Benefits – Louis Cross♦ Trustee Business – Sheila Goodwin♦ Investment – Joe Clark♦ Legislative, Rules & Regulations – Paula Bentley♦ Professional Contracts – Bobbie Richardson
XIII. New Business
XIV. Report of the Attorney
XV. Adjournment

Public School Retirement System of the City of St. Louis
3641 Olive Street, Suite 300 St. Louis, MO 63108-3601
Voice: (314) 534-7444 Fax: (314) 533-0531
TO: Angela Banks Christina Bennett Paula Bentley Joseph Clark Darnetta Clinkscale Louis Cross Sheila P. Goodwin Yvette A. Levy Bobbie Richardson Justin Stein Rick Sullivan
Cc: Kristin Finney-Cooke, Jeff Hartnett, Thomas Helm, Troy Jaros
FROM: Andrew Clark
TODAY: February 15, 2019
RE: Board of Trustees Regular Meeting Monday, February 25, 2019
Board of Trustees Regular Meeting A regular meeting of the Board of Trustees will be conducted on Monday, February 25, 2019, beginning at 4:30 p.m. The Board of Trustees may close a portion of the meeting pursuant to R. S. Mo. §610.021 (1) to discuss a legal matter with the Attorney. The meeting venue will be the boardroom on the second floor of the retirement system’s office building at 3641 Olive Street, St. Louis, MO 63108. Please contact me whether you plan to attend the meeting or not. Thank you.

TAB 1

Regular Board Meeting Minutes 12-17-18.doc
PUBLIC SCHOOL RETIREMENT SYSTEM OF THE CITY OF ST. LOUIS
MINUTES OF THE BOARD OF TRUSTEES REGULAR MEETING December 17, 2018
I. ROLL CALL AND ANNOUNCEMENT OF A QUORUM
The December meeting of the Board of Trustees of the Public School Retirement System of the City of St. Louis (PSRSSTL) was called to order at approximately 4:40 p.m., Monday, December 17, 2018. The meeting was held in the 2nd floor boardroom of the PSRSSTL office building located at 3641 Olive Street, St. Louis, Missouri. Joseph Clark, Chairman of the Board of Trustees, was the presiding officer.
Roll Call was taken, and Trustees Paula Bentley, Joseph Clark, Darnetta Clinkscale, Louis Cross, Sheila Goodwin and Bobbie Richardson were present. The Board of Trustees had a quorum at the meeting. Trustee Yvette Levy joined the meeting in progress. Trustees Angela Banks, Christina Bennett and Rick Sullivan were absent.
Executive Director, Andrew Clark, Accounting Specialist, Terry Mayes, PSRSSTL Attorney Representative, Matt Gierse, and PSRSSTL Actuary, Troy Jaros, were also in attendance.
II. APPROVAL OF MINUTES FROM LAST MEETING
Sheila Goodwin made a motion, seconded by Paula Bentley, to approve the minutes of the Board of Trustees Regular Meeting of October 15, 2018. There was a clarification made regarding the approval of the retiree health insurance plans for 2019.
By voice vote, motion carried.
III. READING OF COMMUNICATIONS TO THE BOARD OF TRUSTEES
None
IV. PRESENTATIONS BY INTERESTED PARTIES
None
V. CONSENT AGENDA
Louis Cross made a motion, seconded by Paula Bentley, to approve the Retirements and Benefits of November and December 2018.
By voice vote, motion carried.
Paula Bentley made a motion, seconded by Bobbie Richardson, to approve the Refunds and Bills of October and November 2018.
By voice vote, motion carried.

Board of Trustees Meeting December 17, 2018 Page 2 of 4
VI. UNFINISHED BUSINESS None
VII. REPORT OF THE CHAIRPERSON The Chairperson asked the Attorney to conduct the election of the 2019 officers of the Board of Trustees. The floor was opened for nominations of a Chairperson. Sheila Goodwin nominated Joe Clark. There were no other nominations and the floor was closed. It was announced by acclimation that Joe Clark will serve as Chairperson of the Board of Trustees in 2019. The floor was opened for nominations of a Vice Chairperson. Sheila Goodwin nominated Bobbie Richardson. There were no other nominations and the floor was closed. It was announced by acclimation that Bobbie Richardson will serve as Vice Chairperson of the Board of Trustees in 2019.
VIII. REPORT OF THE EXECUTIVE DIRECTOR The Executive Director referred the Trustees to the proposed Board of Trustees Meeting Schedule for Calendar Year 2019 that needed approval. There was some discussion regarding the February and April 2019 meeting dates. Louis Cross made a motion, seconded by Bobbie Richardson, to approve the Board of Trustees Meeting Schedule for 2019, as presented by the Executive Director. By voice vote, motion carried. The Executive Director reported on the Independent Auditor’s Report on the Schedules of Pension Information for Participating Employers as required under Governmental Accounting Standards Board (GASB) Statement No. 68, and that all Trustees are eligible for travel in 2019. The Executive Director also reported on the status of the election of an Active Non-Teacher Trustee, and that the SPLS Special Administrative Board is expected to appoint a Trustee to fill the expiring term for Christina Bennett at a meeting in January 2019. There was extended discussion on the timing of when the SLPS Elected School Board is expected to resume control and replace the SLPS Special Administrative Board.
IX. REPORT OF THE INVESTMENT CONSULTANT None
X. REPORT OF THE ACTUARY None
XI. REPORTS OF COMMITTEES OF THE BOARD OF TRUSTEES The Chairman asked for reports from the Committees.
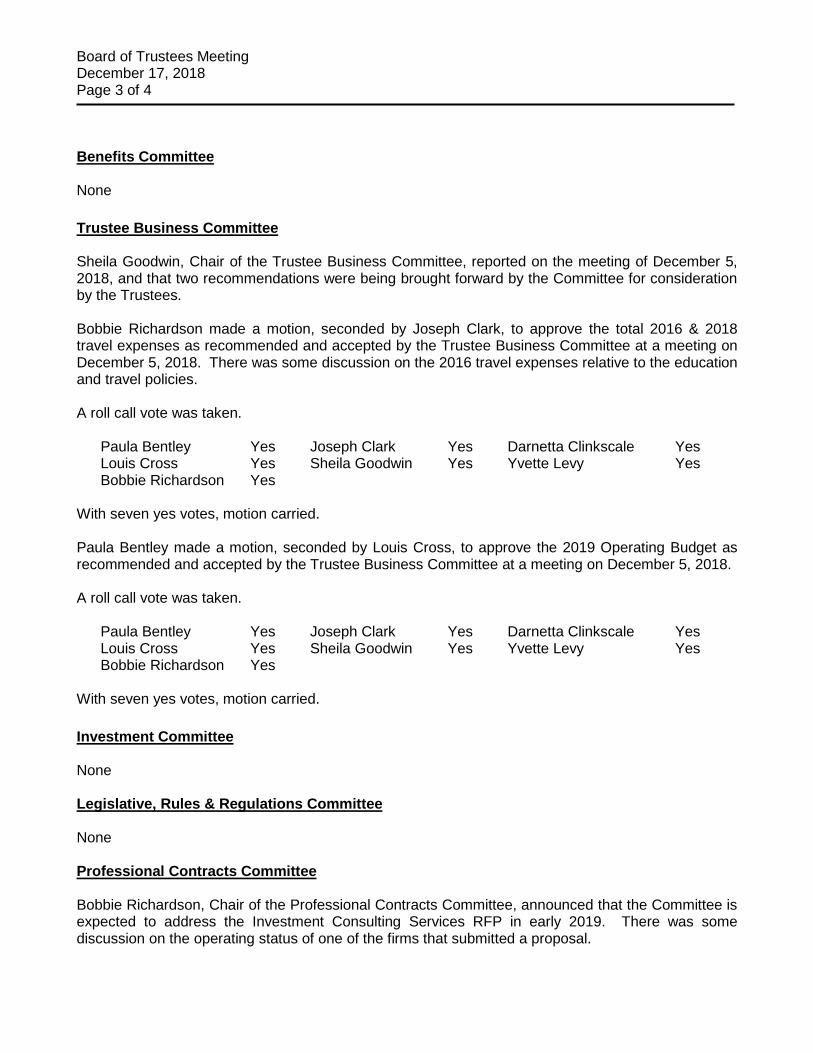
Board of Trustees Meeting December 17, 2018 Page 3 of 4 Benefits Committee None Trustee Business Committee Sheila Goodwin, Chair of the Trustee Business Committee, reported on the meeting of December 5, 2018, and that two recommendations were being brought forward by the Committee for consideration by the Trustees. Bobbie Richardson made a motion, seconded by Joseph Clark, to approve the total 2016 & 2018 travel expenses as recommended and accepted by the Trustee Business Committee at a meeting on December 5, 2018. There was some discussion on the 2016 travel expenses relative to the education and travel policies. A roll call vote was taken. Paula Bentley Yes Joseph Clark Yes Darnetta Clinkscale Yes Louis Cross Yes Sheila Goodwin Yes Yvette Levy Yes Bobbie Richardson Yes With seven yes votes, motion carried. Paula Bentley made a motion, seconded by Louis Cross, to approve the 2019 Operating Budget as recommended and accepted by the Trustee Business Committee at a meeting on December 5, 2018. A roll call vote was taken. Paula Bentley Yes Joseph Clark Yes Darnetta Clinkscale Yes Louis Cross Yes Sheila Goodwin Yes Yvette Levy Yes Bobbie Richardson Yes With seven yes votes, motion carried. Investment Committee None Legislative, Rules & Regulations Committee None Professional Contracts Committee Bobbie Richardson, Chair of the Professional Contracts Committee, announced that the Committee is expected to address the Investment Consulting Services RFP in early 2019. There was some discussion on the operating status of one of the firms that submitted a proposal.

Board of Trustees Meeting December 17, 2018 Page 4 of 4
XII. NEW BUSINESS
None
XIII. REPORT OF THE ATTORNEY
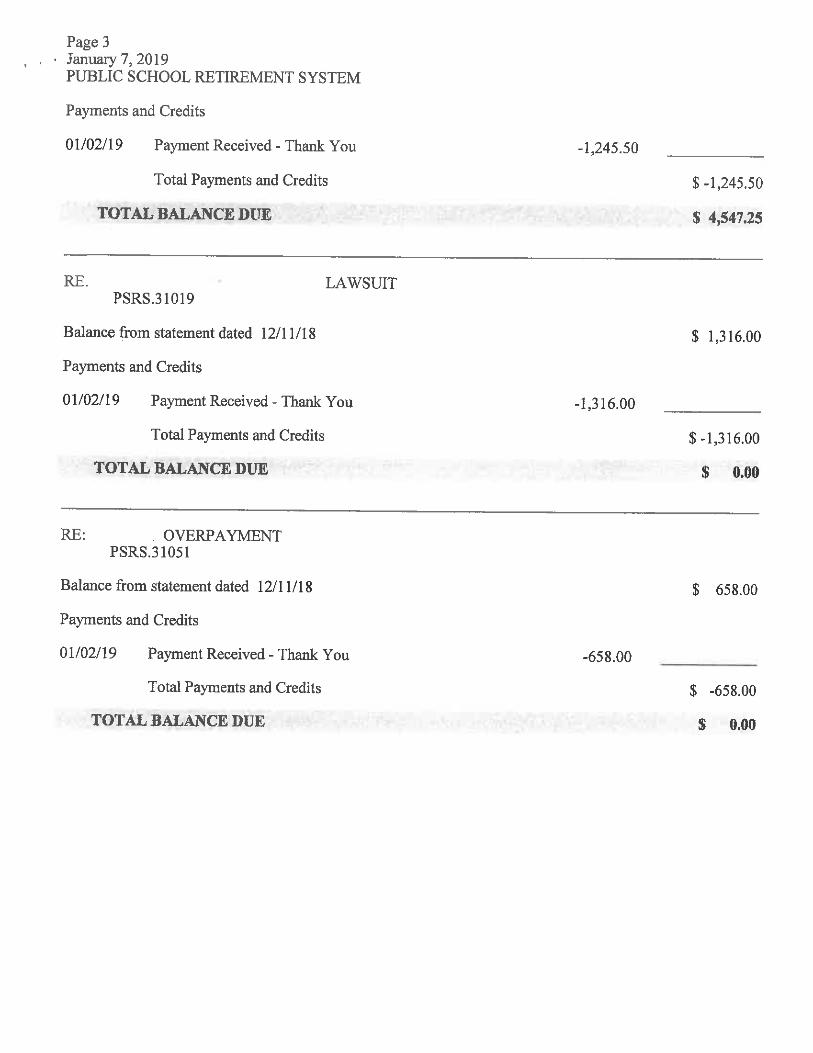
The Attorney reported on the status of two outstanding lawsuits and extended discussion ensued regarding them.
XIV. ADJOURNMENT
Sheila Goodwin made a motion, seconded by Louis Cross, to adjourn the meeting.
By voice vote, motion carried, and the meeting adjourned at just past 5:35 p.m.
Attachments: Retirements Paid: November and December 2018 Refunds & Bills Paid: October and November 2018 2019 Regular Board of Trustees Meeting Schedule Schedules for Employers and Independent Auditors’ Report, December 31, 2017 and 2016 2016 & 2018 Trustee Travel Expenses Approved by the Board of Trustees 2019 Operating Budget

To be Authorized and Approvedby the Board of Trustees
NAME \POSITION DATE
Susie Billups-Glenn October 1, 2018 Normal 27.1944 $70,243.86 $3,183.74Teacher
Lynetta Brown October 1, 2018 Normal 21.1180 $29,684.58 $1,044.80Child Care Attendant
Walter Gibson October 1, 2018 Normal 24.2163 $76,657.40 $3,093.93Parent & Student Specialist
Janet Jenkins October 1, 2018 Normal 23.1223 $67,029.79 $2,583.14Teacher
James Thompson October 1, 2018 Normal 30.0000 $48,249.75 $2,412.49Head Custodian
Alice Urbantke October 1, 2018 Normal 5.3020 $40,659.48 $359.29Nurse
RETIREMENT
APPLICATIONS FOR RETIREMENT
TYPE BENEFITMONTHLYFINAL AVG
SALARYCREDITEDSERVICE
Page 1 of 1 November 2018
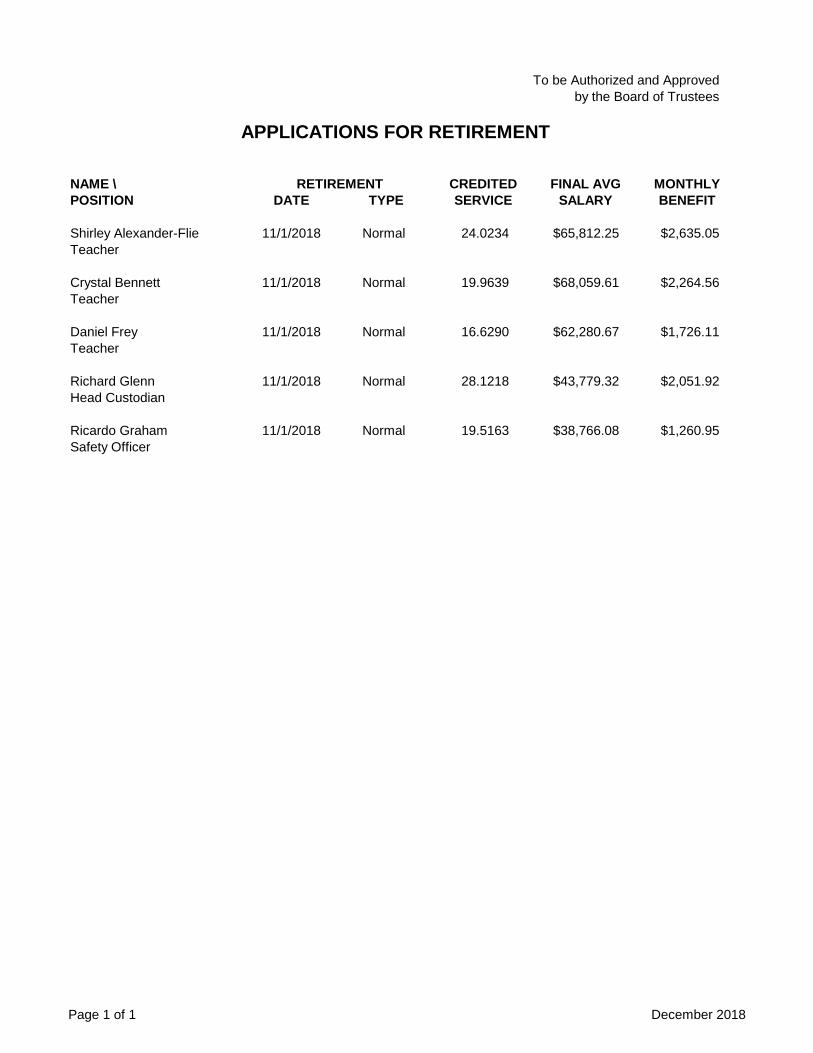
To be Authorized and Approvedby the Board of Trustees
NAME \POSITION DATE
Shirley Alexander-Flie 11/1/2018 Normal 24.0234 $65,812.25 $2,635.05Teacher
Crystal Bennett 11/1/2018 Normal 19.9639 $68,059.61 $2,264.56Teacher
Daniel Frey 11/1/2018 Normal 16.6290 $62,280.67 $1,726.11Teacher
Richard Glenn 11/1/2018 Normal 28.1218 $43,779.32 $2,051.92Head Custodian
Ricardo Graham 11/1/2018 Normal 19.5163 $38,766.08 $1,260.95Safety Officer
RETIREMENT
APPLICATIONS FOR RETIREMENT
TYPE BENEFITMONTHLYFINAL AVG
SALARYCREDITEDSERVICE
Page 1 of 1 December 2018

Pag
e 1
of 2
CH
ECK
CH
ECK
GR
OSS
FED
ERAL
NET
A(ct
ive)
D(e
ath)
NU
MB
ERD
ATE
LAST
NAM
EFI
RST
NAM
E/M
IPA
YTA
XES
W/H
PAY
R(e
tired
)S(
epar
atio
n) N
OTE
S07
4497
09/0
6/18
NY
BE
RG
MIC
HA
EL
(5,0
15.7
0)(5
,015
.70)
AS
0745
6510
/04/
18A
RN
OLD
JAC
LYN
5,24
4.64
1,04
8.93
4,19
5.71
AS
CA
0745
6610
/04/
18B
OR
NS
AR
AH
4,09
1.08
818.
223,
272.
86A
SC
A G
CA
A07
4567
10/0
4/18
CR
OS
BY
SU
SA
N4,
538.
0590
7.61
3,63
0.44
AS
CA
LS
MS
0745
6810
/04/
18E
BE
RT
ALL
ISO
N2,
381.
602,
381.
60A
SC
A07
4570
10/0
4/18
GA
LLO
WA
YS
AR
AH
2,09
4.63
418.
931,
675.
70A
SC
A07
4571
10/0
4/18
GR
ICE
KIR
K4,
892.
0297
8.40
3,91
3.62
AS
CA
0745
7210
/04/
18G
RO
SS
SC
OTT
8,63
4.41
1,72
6.88
6,90
7.53
AS
SLL
IS07
4573
10/0
4/18
JOR
DA
NA
LYS
SA
4,47
4.39
4,47
4.39
AS
CA
0745
7410
/04/
18LO
FTO
N
CO
RTE
Z30
,329
.17
6,06
5.83
24,2
63.3
4A
SC
A G
CA
A A
QS
-GS
0745
7510
/04/
18M
AC
KE
NB
ER
GJA
IME
7,07
0.83
1,41
4.17
5,65
6.66
AS
SLP
S C
A
0745
7610
/04/
18M
CA
DO
OD
AR
YL
10,2
80.9
210
,280
.92
AS
PR
EC
0745
7710
/04/
18O
DE
MN
ICH
OLA
S R
8,
631.
568,
631.
56A
SLS
MS
0745
7810
/04/
18O
LSO
NS
TEP
HA
NIE
2,
221.
072,
221.
07A
SS
LLIS
0745
7910
/04/
18R
EE
DJO
8,50
3.91
8,50
3.91
AS
GS
AS
TL P
RE
M07
4580
10/0
4/18
SIK
UA
DE
AN
THO
NY
11,3
53.4
52,
270.
699,
082.
76A
SC
A J
AM
MA
0745
8110
/04/
18TI
TSW
OR
THJO
HN
12
,031
.91
2,40
6.38
9,62
5.53
AS
CA
0745
8210
/04/
18V
AR
LEY
SA
RA
H10
,514
.70
2,10
2.94
8,41
1.76
AS
CA
GC
AA
0745
8310
/04/
18C
AR
TER
KE
LVIN
15
,000
.00
15,0
00.0
0A
S07
4584
10/0
4/18
CA
RTE
RK
ELV
IN
13,0
70.7
32,
614.
1510
,456
.58
AS
0745
8510
/04/
18C
AS
IME
RE
JR
V
ER
NO
N
2,32
6.01
465.
201,
860.
81A
S07
4586
10/0
4/18
CLA
YS
TAC
Y D
37,3
38.2
637
,338
.26
AS
0745
8710
/04/
18C
OLL
INS
CA
RR
IE V
4,27
7.95
855.
593,
422.
36A
S07
4588
10/0
4/18
GA
LLE
TTA
VE
RO
NIC
A A
17
,438
.07
3,48
7.61
13,9
50.4
6A
S07
4589
10/0
4/18
HA
LLS
TEV
EN
7,
405.
567,
405.
56A
S07
4590
10/0
4/18
HA
LLS
TEV
EN
17
,000
.00
3,40
0.00
13,6
00.0
0A
S07
4591
10/0
4/18
JAC
KS
ON
-JO
NE
SD
ELI
ND
A1,
431.
2028
6.24
1,14
4.96
AS
0745
9210
/04/
18K
ME
TZA
LAN
57,8
75.4
857
,875
.48
AS
0745
9310
/04/
18M
CD
EV
ITT
JES
SIC
A R
7,64
2.52
7,64
2.52
AS
0745
9410
/04/
18M
EY
ER
KY
LIE
B1,
629.
091,
629.
09A
S07
4595
10/0
4/18
RE
TTM
AN
JEFF
RE
Y5,
015.
701,
003.
144,
012.
56A
S07
4596
10/0
4/18
TRA
MB
LEC
ALV
IN
4,03
7.59
807.
523,
230.
07A
S07
4597
10/0
4/18
NY
BE
RG
MIC
HA
EL
5,01
5.70
5,01
5.70
AS
0745
9810
/04/
18FE
NTE
RC
HR
ISTO
PH
ER
1,54
4.02
1,54
4.02
AS
EA
GLE
0746
2210
/18/
18E
AN
ES
-CA
SO
NTR
YP
HE
NA
13,9
01.3
22,
780.
2611
,121
.06
AS
IAC
A C
LA S
LPS
0746
2310
/18/
18C
AR
SO
NM
AD
ELE
INE
8,50
8.33
8,50
8.33
AS
CA
0746
2410
/18/
18E
ME
RS
ON
LAU
RE
N5,
976.
771,
195.
354,
781.
42A
SE
AG
LE
Dis
tribu
tions
- O
ctob
er, 2
018
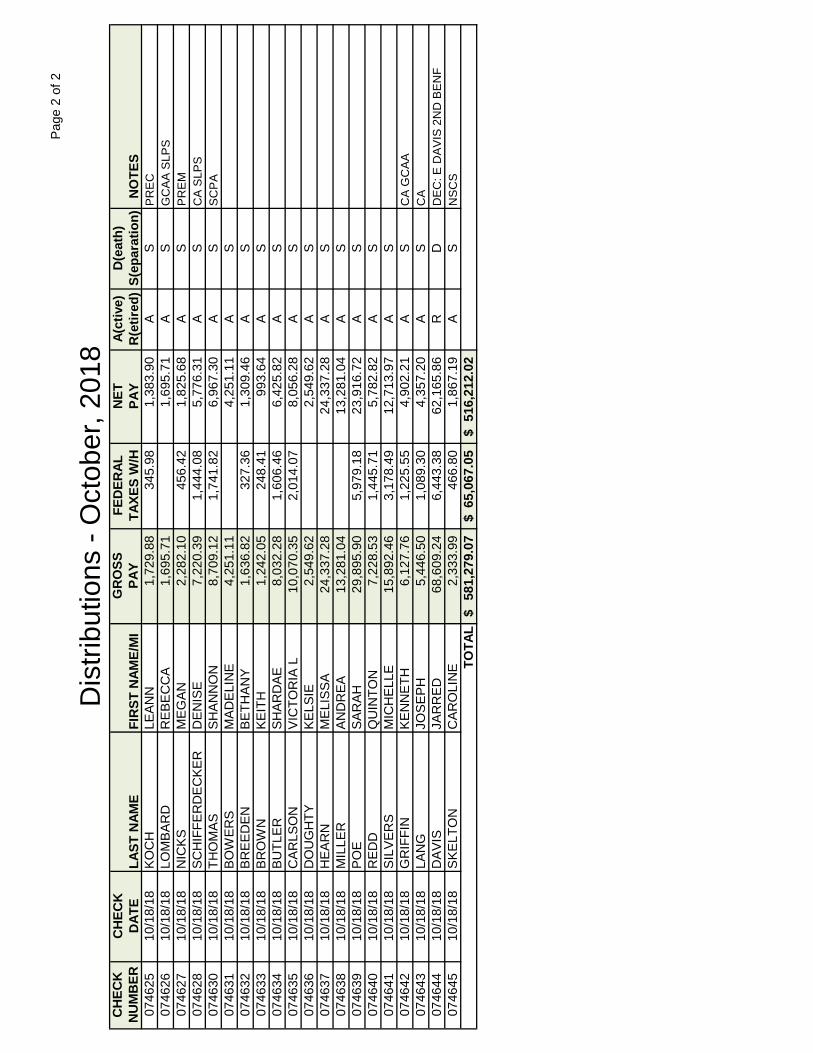
Pag
e 2
of 2
CH
ECK
CH
ECK
GR
OSS
FED
ERAL
NET
A(ct
ive)
D(e
ath)
NU
MB
ERD
ATE
LAST
NAM
EFI
RST
NAM
E/M
IPA
YTA
XES
W/H
PAY
R(e
tired
)S(
epar
atio
n) N
OTE
S
Dis
tribu
tions
- O
ctob
er, 2
018
0746
2510
/18/
18K
OC
HLE
AN
N1,
729.
8834
5.98
1,38
3.90
AS
PR
EC
0746
2610
/18/
18LO
MB
AR
DR
EB
EC
CA
1,69
5.71
1,69
5.71
AS
GC
AA
SLP
S07
4627
10/1
8/18
NIC
KS
ME
GA
N
2,28
2.10
456.
421,
825.
68A
SP
RE
M
0746
2810
/18/
18S
CH
IFFE
RD
EC
KE
RD
EN
ISE
7,22
0.39
1,44
4.08
5,77
6.31
AS
CA
SLP
S07
4630
10/1
8/18
THO
MA
SS
HA
NN
ON
8,70
9.12
1,74
1.82
6,96
7.30
AS
SC
PA
0746
3110
/18/
18B
OW
ER
SM
AD
ELI
NE
4,25
1.11
4,25
1.11
AS
0746
3210
/18/
18B
RE
ED
EN
BE
THA
NY
1,63
6.82
327.
361,
309.
46A
S07
4633
10/1
8/18
BR
OW
NK
EIT
H1,
242.
0524
8.41
993.
64A
S07
4634
10/1
8/18
BU
TLE
RS
HA
RD
AE
8,03
2.28
1,60
6.46
6,42
5.82
AS
0746
3510
/18/
18C
AR
LSO
NV
ICTO
RIA
L
10,0
70.3
52,
014.
078,
056.
28A
S07
4636
10/1
8/18
DO
UG
HTY
KE
LSIE
2,
549.
622,
549.
62A
S07
4637
10/1
8/18
HE
AR
NM
ELI
SS
A24
,337
.28
24,3
37.2
8A
S07
4638
10/1
8/18
MIL
LER
AN
DR
EA
13,2
81.0
413
,281
.04
AS
0746
3910
/18/
18P
OE
SA
RA
H
29,8
95.9
05,
979.
1823
,916
.72
AS
0746
4010
/18/
18R
ED
DQ
UIN
TON
7,22
8.53
1,44
5.71
5,78
2.82
AS
0746
4110
/18/
18S
ILV
ER
SM
ICH
ELL
E15
,892
.46
3,17
8.49
12,7
13.9
7A
S07
4642
10/1
8/18
GR
IFFI
NK
EN
NE
TH6,
127.
761,
225.
554,
902.
21A
SC
A G
CA
A07
4643
10/1
8/18
LAN
GJO
SE
PH
5,
446.
501,
089.
304,
357.
20A
SC
A07
4644
10/1
8/18
DA
VIS
JA
RR
ED
68,6
09.2
46,
443.
3862
,165
.86
RD
DE
C: E
DA
VIS
2N
D B
EN
F07
4645
10/1
8/18
SK
ELT
ON
C
AR
OLI
NE
2,
333.
9946
6.80
1,86
7.19
AS
NS
CS
581,
279.
07$
65
,067
.05
$
516,
212.
02$
TO
TAL

Page
1 o
f 2
CH
ECK
CH
ECK
GR
OSS
FED
ERAL
NET
A(ct
ive)
D(e
ath)
NU
MB
ERD
ATE
LAST
NAM
EFI
RST
NAM
E/M
IPA
YTA
XES
W/H
PAY
R(e
tired
)S(
epar
atio
n) N
OTE
S07
4536
09/2
1/18
CO
NG
ERC
RAI
G(3
,050
.49)
(3,0
50.4
9)A
SS
CP
A -
VO
ID &
RE
ISS
UE
0746
7111
/01/
18C
HIL
DS
MAR
CAL
ENE
5,64
4.10
1,12
8.82
4,51
5.28
AS
CA
0746
7211
/01/
18D
ETTM
ERER
IC S
342.
6668
.53
274.
13A
SLF
L07
4673
11/0
1/18
DO
THAG
EM
ICH
AEL
6,21
4.13
6,21
4.13
AS
PR
EM
0746
7411
/01/
18EN
GLE
SUZA
NN
E4,
317.
8286
3.56
3,45
4.26
AS
CA
0746
7511
/01/
18G
OLD
EMIL
Y 23
,791
.03
23,7
91.0
3A
SP
RE
M07
4676
11/0
1/18
HAL
LM
IRAN
DA
4,57
6.91
4,57
6.91
AS
LFL
0746
7711
/01/
18M
CIN
TEE
CO
LLEE
N2,
449.
662,
449.
66A
SS
LLIS
0746
7811
/01/
18M
ENG
DEB
OR
AH
13,5
06.6
013
,506
.60
AS
CA
0746
7911
/01/
18W
AHEE
DLO
RET
TA4,
882.
6297
6.52
3,90
6.10
AS
CA
GC
AA
0746
8011
/01/
18AL
IXG
UER
ARD
D1,
449.
2028
9.84
1,15
9.36
AS
0746
8111
/01/
18BU
CH
ANN
ON
CH
RYS
TAL
4,98
4.13
996.
833,
987.
30A
S07
4682
11/0
1/18
DO
UG
LAS
HAL
IDAY
23,3
21.7
84,
664.
3618
,657
.42
AS
0746
8311
/01/
18G
OVA
NJO
NAT
E16
,469
.68
3,29
3.94
13,1
75.7
4A
S07
4684
11/0
1/18
GR
IFFI
NC
ATH
ALEA
N2,
970.
6559
4.13
2,37
6.52
AS
0746
8511
/01/
18H
OU
STO
N
CO
RN
ELIU
S J
2,72
4.86
544.
972,
179.
89A
S07
4686
11/0
1/18
JOH
NSO
NKA
THLE
EN10
,057
.59
2,01
1.52
8,04
6.07
AS
0746
8711
/01/
18KA
RIM
IN
ATH
AN1,
528.
1230
5.62
1,22
2.50
AS
0746
8811
/01/
18PE
EBLE
SAN
THO
NY
36,5
56.1
67,
311.
2329
,244
.93
AS
0746
8911
/01/
18PO
LK
TIM
I8,
326.
891,
665.
386,
661.
51A
S07
4690
11/0
1/18
SMIT
H-B
ELL
KEW
ANA
45,8
95.9
99,
179.
2036
,716
.79
AS
0746
9111
/01/
18TI
MBE
RSO
NTA
MIK
O
22,5
95.1
34,
519.
0318
,076
.10
AS
0746
9211
/01/
18VA
N D
YKE
KEN
DR
A2,
290.
9245
8.18
1,83
2.74
AS
0746
9311
/01/
18W
ARBR
ITTO
NBR
OC
K2,
879.
1057
5.82
2,30
3.28
AS
0746
9411
/01/
18W
HIT
EAD
RIA
N N
2,37
2.44
474.
491,
897.
95A
S07
4695
11/0
1/18
HAR
RIS
DO
NAL
D
5,98
2.12
1,19
6.42
4,78
5.70
RD
DE
C: K
HA
RR
IS07
4696
11/0
1/18
EDD
YSE
AN
5,98
2.11
5,98
2.11
RD
DE
C: K
HA
RR
IS07
4697
11/0
1/18
CO
NG
ERC
RAI
G3,
050.
493,
050.
49A
SS
CP
A -
VO
ID &
RE
ISS
UE
0747
3111
/08/
18BE
RTI
SHD
EBO
RAH
22
,362
.59
4,47
2.52
17,8
90.0
7A
SC
A07
4732
11/0
8/18
BLAN
CO
MAR
TA
2,38
2.54
476.
511,
906.
03A
SS
LLIS
0747
3311
/08/
18C
HU
GH
TAI
CLA
RIS
SA1,
948.
9638
9.79
1,55
9.17
AS
CA
0747
3411
/08/
18EW
BAN
KJO
NAT
HAN
3,57
9.20
3,57
9.20
AS
CA
0747
3511
/08/
18FI
TZSI
MM
ON
SH
EATH
ER4,
874.
0897
4.82
3,89
9.26
AS
EA
GLE
0747
3611
/08/
18H
UD
SON
GR
EGO
RY
2,28
1.86
2,28
1.86
AS
PR
EC
0747
3711
/08/
18LA
CKE
YAL
LISO
N2,
975.
222,
975.
22A
SG
SA
STL
0747
3811
/08/
18M
ITC
HEL
LJA
MIS
ENE
E 1,
723.
8234
4.76
1,37
9.06
AS
BIO
ME
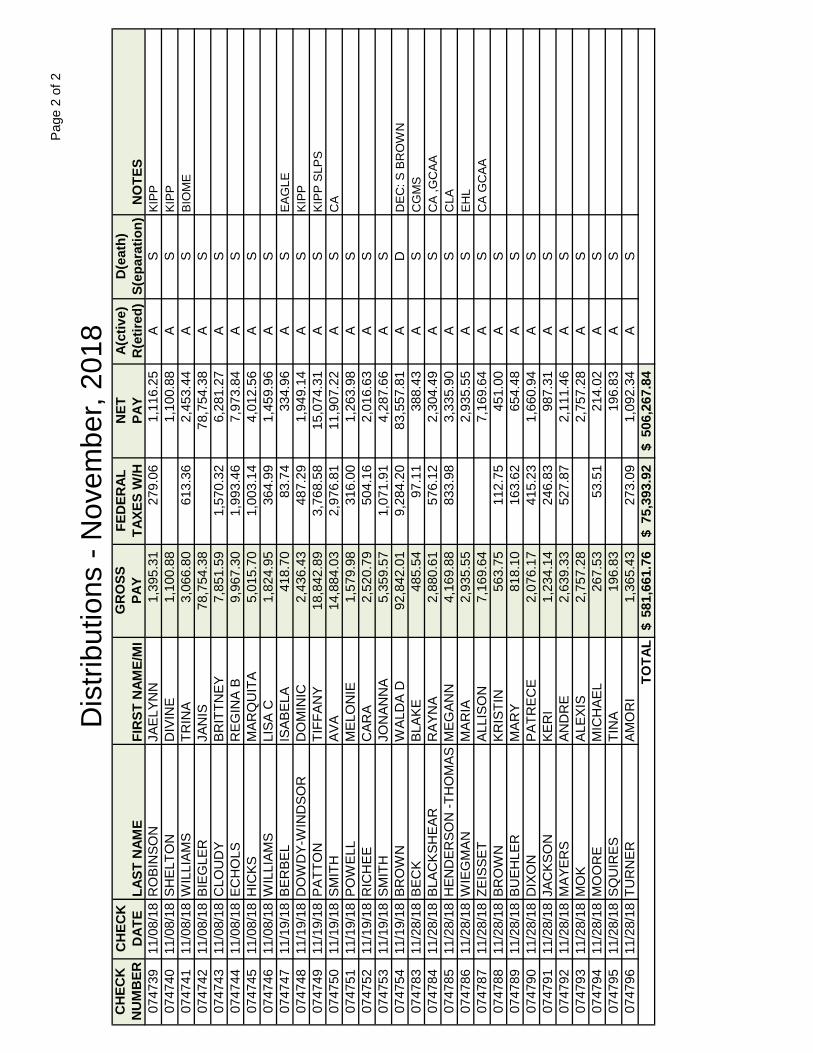
Dis
tribu
tions
- N
ovem
ber,
2018
Page
2 o
f 2
CH
ECK
CH
ECK
GR
OSS
FED
ERAL
NET
A(ct
ive)
D(e
ath)
NU
MB
ERD
ATE
LAST
NAM
EFI
RST
NAM
E/M
IPA
YTA
XES
W/H
PAY
R(e
tired
)S(
epar
atio
n) N
OTE
S
Dis
tribu
tions
- N
ovem
ber,
2018
0747
3911
/08/
18R
OBI
NSO
NJA
ELYN
N1,
395.
3127
9.06
1,11
6.25
AS
KIP
P07
4740
11/0
8/18
SHEL
TON
DIV
INE
1,10
0.88
1,10
0.88
AS
KIP
P07
4741
11/0
8/18
WIL
LIAM
S TR
INA
3,06
6.80
613.
362,
453.
44A
SB
IOM
E07
4742
11/0
8/18
BIEG
LER
JAN
IS78
,754
.38
78,7
54.3
8A
S07
4743
11/0
8/18
CLO
UD
YBR
ITTN
EY7,
851.
591,
570.
326,
281.
27A
S07
4744
11/0
8/18
ECH
OLS
R
EGIN
A B
9,96
7.30
1,99
3.46
7,97
3.84
AS
0747
4511
/08/
18H
ICKS
M
ARQ
UIT
A5,
015.
701,
003.
144,
012.
56A
S07
4746
11/0
8/18
WIL
LIAM
S LI
SA C
1,82
4.95
364.
991,
459.
96A
S07
4747
11/1
9/18
BER
BEL
ISAB
ELA
418.
7083
.74
334.
96A
SE
AG
LE07
4748
11/1
9/18
DO
WD
Y-W
IND
SOR
DO
MIN
IC2,
436.
4348
7.29
1,94
9.14
AS
KIP
P07
4749
11/1
9/18
PATT
ON
TIFF
ANY
18,8
42.8
93,
768.
5815
,074
.31
AS
KIP
P S
LPS
0747
5011
/19/
18SM
ITH
AVA
14,8
84.0
32,
976.
8111
,907
.22
AS
CA
0747
5111
/19/
18PO
WEL
LM
ELO
NIE
1,
579.
9831
6.00
1,26
3.98
AS
0747
5211
/19/
18R
ICH
EEC
ARA
2,52
0.79
504.
162,
016.
63A
S07
4753
11/1
9/18
SMIT
H
JO
NAN
NA
5,35
9.57
1,07
1.91
4,28
7.66
AS
0747
5411
/19/
18BR
OW
NW
ALD
A D
92,8
42.0
19,
284.
2083
,557
.81
AD
DE
C: S
BR
OW
N07
4783
11/2
8/18
BEC
KBL
AKE
485.
5497
.11
388.
43A
SC
GM
S07
4784
11/2
8/18
BLAC
KSH
EAR
RAY
NA
2,88
0.61
576.
122,
304.
49A
SC
A ,G
CA
A07
4785
11/2
8/18
HEN
DER
SON
-TH
OM
ASM
EGAN
N4,
169.
8883
3.98
3,33
5.90
AS
CLA
0747
8611
/28/
18W
IEG
MAN
MAR
IA2,
935.
552,
935.
55A
SE
HL
0747
8711
/28/
18ZE
ISSE
TAL
LISO
N
7,16
9.64
7,16
9.64
AS
CA
GC
AA
0747
8811
/28/
18BR
OW
NKR
ISTI
N56
3.75
112.
7545
1.00
AS
0747
8911
/28/
18BU
EHLE
RM
ARY
818.
1016
3.62
654.
48A
S07
4790
11/2
8/18
DIX
ON
PATR
ECE
2,07
6.17
415.
231,
660.
94A
S07
4791
11/2
8/18
JAC
KSO
NKE
RI
1,23
4.14
246.
8398
7.31
AS
0747
9211
/28/
18M
AYER
SAN
DR
E2,
639.
3352
7.87
2,11
1.46
AS
0747
9311
/28/
18M
OK
ALEX
IS2,
757.
282,
757.
28A
S07
4794
11/2
8/18
MO
OR
EM
ICH
AEL
267.
5353
.51
214.
02A
S07
4795
11/2
8/18
SQU
IRES
TIN
A19
6.83
196.
83A
S07
4796
11/2
8/18
TUR
NER
AMO
RI
1,36
5.43
273.
091,
092.
34A
S58
1,66
1.76
$
75,3
93.9
2$
50
6,26
7.84
$
TOTA
L
1 of 1
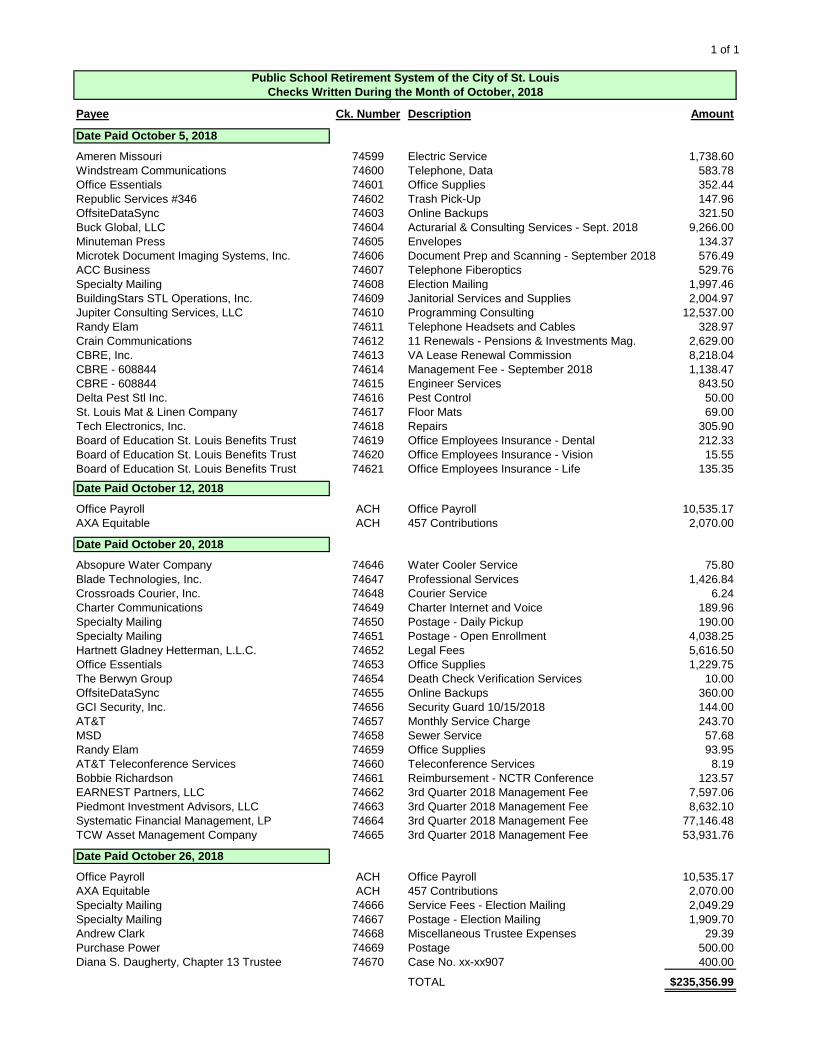
Payee Ck. Number Description Amount
Date Paid October 5, 2018
Ameren Missouri 74599 Electric Service 1,738.60Windstream Communications 74600 Telephone, Data 583.78Office Essentials 74601 Office Supplies 352.44Republic Services #346 74602 Trash Pick-Up 147.96OffsiteDataSync 74603 Online Backups 321.50Buck Global, LLC 74604 Acturarial & Consulting Services - Sept. 2018 9,266.00Minuteman Press 74605 Envelopes 134.37Microtek Document Imaging Systems, Inc. 74606 Document Prep and Scanning - September 2018 576.49ACC Business 74607 Telephone Fiberoptics 529.76Specialty Mailing 74608 Election Mailing 1,997.46BuildingStars STL Operations, Inc. 74609 Janitorial Services and Supplies 2,004.97Jupiter Consulting Services, LLC 74610 Programming Consulting 12,537.00Randy Elam 74611 Telephone Headsets and Cables 328.97Crain Communications 74612 11 Renewals - Pensions & Investments Mag. 2,629.00CBRE, Inc. 74613 VA Lease Renewal Commission 8,218.04CBRE - 608844 74614 Management Fee - September 2018 1,138.47CBRE - 608844 74615 Engineer Services 843.50Delta Pest Stl Inc. 74616 Pest Control 50.00St. Louis Mat & Linen Company 74617 Floor Mats 69.00Tech Electronics, Inc. 74618 Repairs 305.90Board of Education St. Louis Benefits Trust 74619 Office Employees Insurance - Dental 212.33Board of Education St. Louis Benefits Trust 74620 Office Employees Insurance - Vision 15.55Board of Education St. Louis Benefits Trust 74621 Office Employees Insurance - Life 135.35
Date Paid October 12, 2018
Office Payroll ACH Office Payroll 10,535.17AXA Equitable ACH 457 Contributions 2,070.00
Date Paid October 20, 2018
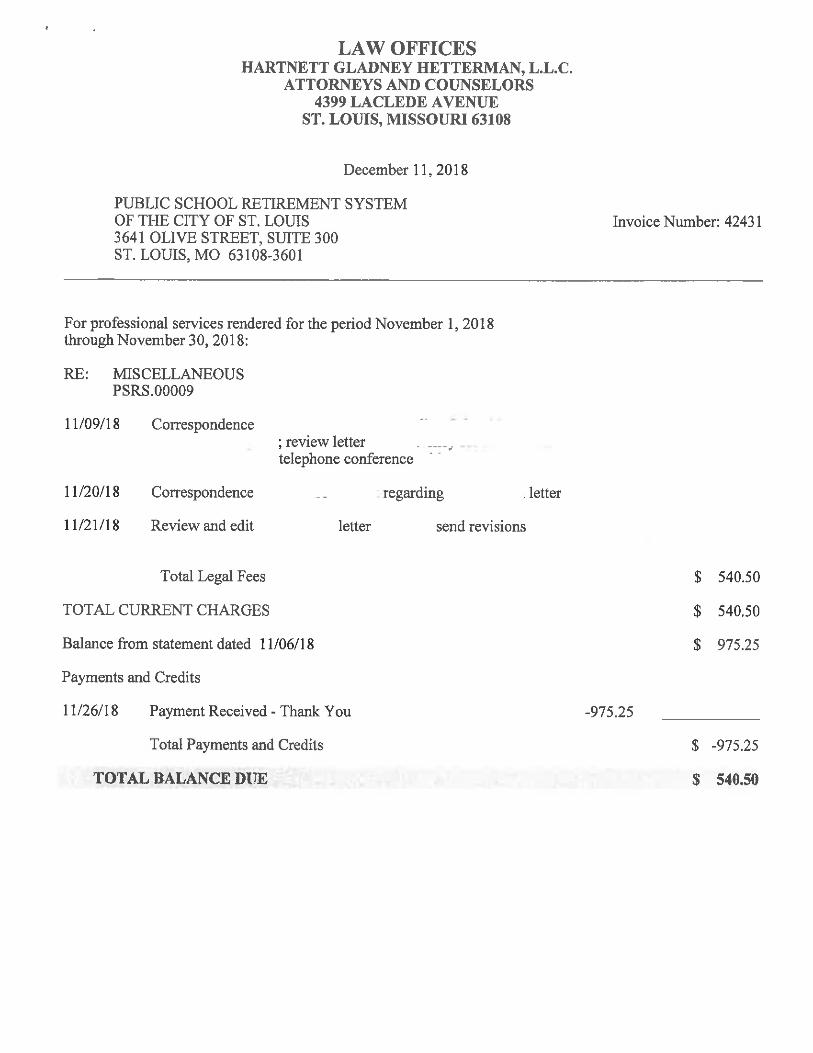
Absopure Water Company 74646 Water Cooler Service 75.80Blade Technologies, Inc. 74647 Professional Services 1,426.84Crossroads Courier, Inc. 74648 Courier Service 6.24Charter Communications 74649 Charter Internet and Voice 189.96Specialty Mailing 74650 Postage - Daily Pickup 190.00Specialty Mailing 74651 Postage - Open Enrollment 4,038.25Hartnett Gladney Hetterman, L.L.C. 74652 Legal Fees 5,616.50Office Essentials 74653 Office Supplies 1,229.75The Berwyn Group 74654 Death Check Verification Services 10.00OffsiteDataSync 74655 Online Backups 360.00GCI Security, Inc. 74656 Security Guard 10/15/2018 144.00AT&T 74657 Monthly Service Charge 243.70MSD 74658 Sewer Service 57.68Randy Elam 74659 Office Supplies 93.95AT&T Teleconference Services 74660 Teleconference Services 8.19Bobbie Richardson 74661 Reimbursement - NCTR Conference 123.57EARNEST Partners, LLC 74662 3rd Quarter 2018 Management Fee 7,597.06Piedmont Investment Advisors, LLC 74663 3rd Quarter 2018 Management Fee 8,632.10Systematic Financial Management, LP 74664 3rd Quarter 2018 Management Fee 77,146.48TCW Asset Management Company 74665 3rd Quarter 2018 Management Fee 53,931.76
Date Paid October 26, 2018
Office Payroll ACH Office Payroll 10,535.17AXA Equitable ACH 457 Contributions 2,070.00Specialty Mailing 74666 Service Fees - Election Mailing 2,049.29Specialty Mailing 74667 Postage - Election Mailing 1,909.70Andrew Clark 74668 Miscellaneous Trustee Expenses 29.39Purchase Power 74669 Postage 500.00Diana S. Daugherty, Chapter 13 Trustee 74670 Case No. xx-xx907 400.00
TOTAL $235,356.99
Public School Retirement System of the City of St. LouisChecks Written During the Month of October, 2018
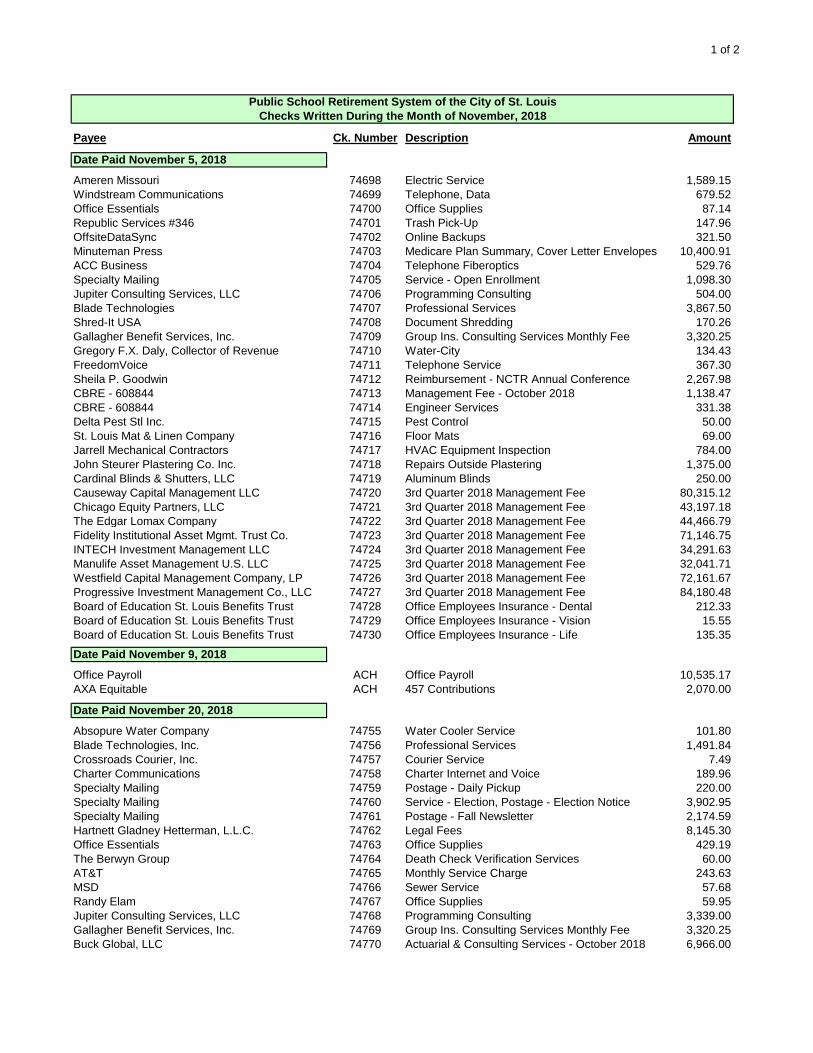
1 of 2
Payee Ck. Number Description Amount
Date Paid November 5, 2018
Ameren Missouri 74698 Electric Service 1,589.15Windstream Communications 74699 Telephone, Data 679.52Office Essentials 74700 Office Supplies 87.14Republic Services #346 74701 Trash Pick-Up 147.96OffsiteDataSync 74702 Online Backups 321.50Minuteman Press 74703 Medicare Plan Summary, Cover Letter Envelopes 10,400.91ACC Business 74704 Telephone Fiberoptics 529.76Specialty Mailing 74705 Service - Open Enrollment 1,098.30Jupiter Consulting Services, LLC 74706 Programming Consulting 504.00Blade Technologies 74707 Professional Services 3,867.50Shred-It USA 74708 Document Shredding 170.26Gallagher Benefit Services, Inc. 74709 Group Ins. Consulting Services Monthly Fee 3,320.25Gregory F.X. Daly, Collector of Revenue 74710 Water-City 134.43FreedomVoice 74711 Telephone Service 367.30Sheila P. Goodwin 74712 Reimbursement - NCTR Annual Conference 2,267.98CBRE - 608844 74713 Management Fee - October 2018 1,138.47CBRE - 608844 74714 Engineer Services 331.38Delta Pest Stl Inc. 74715 Pest Control 50.00St. Louis Mat & Linen Company 74716 Floor Mats 69.00Jarrell Mechanical Contractors 74717 HVAC Equipment Inspection 784.00John Steurer Plastering Co. Inc. 74718 Repairs Outside Plastering 1,375.00Cardinal Blinds & Shutters, LLC 74719 Aluminum Blinds 250.00Causeway Capital Management LLC 74720 3rd Quarter 2018 Management Fee 80,315.12Chicago Equity Partners, LLC 74721 3rd Quarter 2018 Management Fee 43,197.18The Edgar Lomax Company 74722 3rd Quarter 2018 Management Fee 44,466.79Fidelity Institutional Asset Mgmt. Trust Co. 74723 3rd Quarter 2018 Management Fee 71,146.75INTECH Investment Management LLC 74724 3rd Quarter 2018 Management Fee 34,291.63Manulife Asset Management U.S. LLC 74725 3rd Quarter 2018 Management Fee 32,041.71Westfield Capital Management Company, LP 74726 3rd Quarter 2018 Management Fee 72,161.67Progressive Investment Management Co., LLC 74727 3rd Quarter 2018 Management Fee 84,180.48Board of Education St. Louis Benefits Trust 74728 Office Employees Insurance - Dental 212.33Board of Education St. Louis Benefits Trust 74729 Office Employees Insurance - Vision 15.55Board of Education St. Louis Benefits Trust 74730 Office Employees Insurance - Life 135.35
Date Paid November 9, 2018
Office Payroll ACH Office Payroll 10,535.17AXA Equitable ACH 457 Contributions 2,070.00
Date Paid November 20, 2018
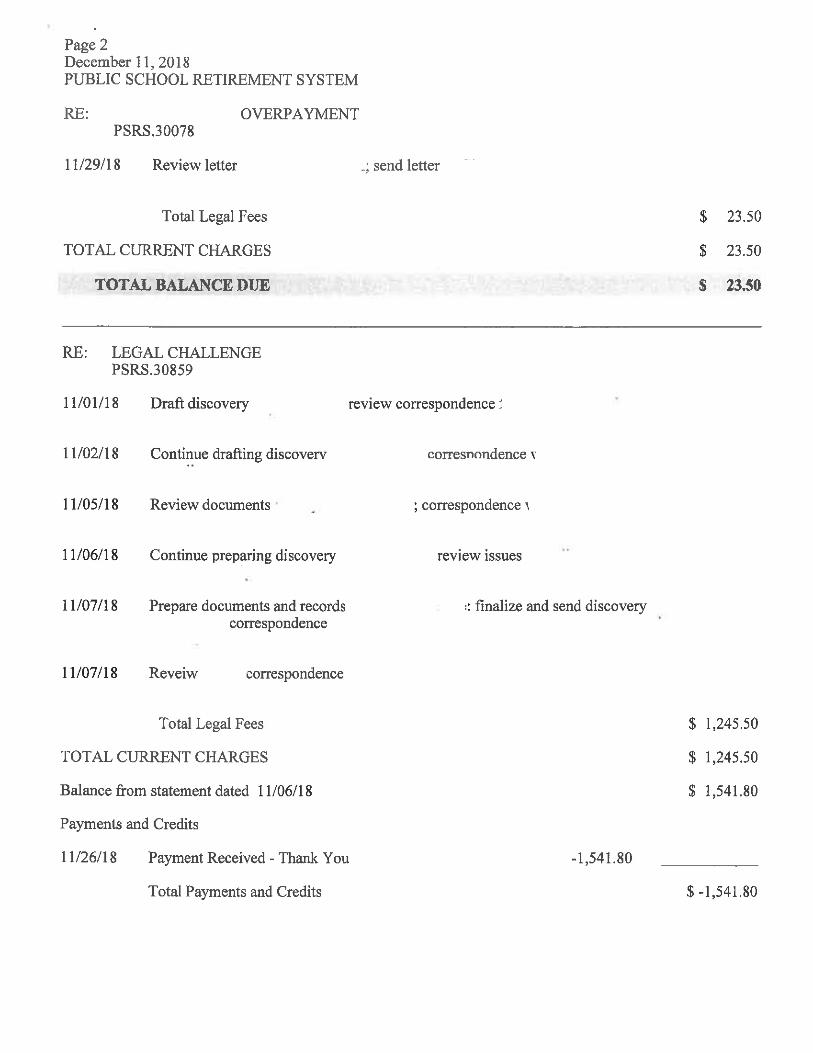
Absopure Water Company 74755 Water Cooler Service 101.80Blade Technologies, Inc. 74756 Professional Services 1,491.84Crossroads Courier, Inc. 74757 Courier Service 7.49Charter Communications 74758 Charter Internet and Voice 189.96Specialty Mailing 74759 Postage - Daily Pickup 220.00Specialty Mailing 74760 Service - Election, Postage - Election Notice 3,902.95Specialty Mailing 74761 Postage - Fall Newsletter 2,174.59Hartnett Gladney Hetterman, L.L.C. 74762 Legal Fees 8,145.30Office Essentials 74763 Office Supplies 429.19The Berwyn Group 74764 Death Check Verification Services 60.00AT&T 74765 Monthly Service Charge 243.63MSD 74766 Sewer Service 57.68Randy Elam 74767 Office Supplies 59.95Jupiter Consulting Services, LLC 74768 Programming Consulting 3,339.00Gallagher Benefit Services, Inc. 74769 Group Ins. Consulting Services Monthly Fee 3,320.25Buck Global, LLC 74770 Actuarial & Consulting Services - October 2018 6,966.00
Public School Retirement System of the City of St. LouisChecks Written During the Month of November, 2018

2 of 2
Payee Ck. Number Description Amount
Public School Retirement System of the City of St. LouisChecks Written During the Month of November, 2018
Microtek Document Imaging Systems, Inc. 74771 Imaging Hosting - October 2018 404.40Anders CPAs & Advisors 74772 GASB 68 7,621.00BuildingStars STL Operations, Inc. 74773 Janitorial Services 1,386.00CBRE - 608844 74774 Management Fee - November 2018 1,138.47CBRE - 608844 74775 Engineer Services 391.63St. Louis Mat & Linen Company 74776 Floor Mats 69.00Tech Electronics, Inc. 74777 Central Monitoring of Fire Alarm System 102.00Yardi Marketplace 74778 Supplies 260.40FastSigns 74779 Removal of Vandalized Sign 125.00US Bank 74780 3rd Quarter 2018 Custodial Fee 29,974.11
Date Paid November 23, 2018
Office Payroll ACH Office Payroll 10,535.17AXA Equitable ACH 457 Contributions 2,070.00Purchase Power 74781 Postage 1,000.00Diana S. Daugherty, Chapter 13 Trustee 74782 Case No. xx-xx907 400.00
TOTAL $590,440.35
Public School Retirement System of the City of St. Louis (PSRSSTL)
3641 Olive Street, 2nd Floor Boardroom St. Louis, MO 63108
Voice: (314) 534-7444 Fax: (314) 534-0531
Website: http://www.psrsstl.org
Board of Trustees Regular Meeting Schedule
Calendar Year 2019
Unless otherwise posted, trustee meetings are conducted in the Boardroom on the 2nd floor of the Retirement System’s office building (address above)
February 25, 2019
April 22, 2019
June 17, 2019
August 19, 2019
October 21, 2019
December 16, 2019

PUBLIC SCHOOL RETIREMENT SYSTEM OF THE CITY OF ST. LOUIS
SCHEDULES OF PENSION INFORMATIONFOR PARTICIPATING EMPLOYERS
ANDINDEPENDENT AUDITORS' REPORT
YEARS ENDED DECEMBER 31, 2017 AND 2016

Contents
Page
Independent Auditors' Report 1 - 2
Schedules of Pension Information for Participating Employers
Schedules of Employer Allocations 3
Schedules of Pension Amounts by Employer 4 - 11
Notes to Schedules 12 - 17

Independent Auditors' Report
The Board of TrusteesPublic School Retirement System of the City of St. LouisSt. Louis, Missouri
Report on the Schedules
We have audited the accompanying schedules of employer allocations for Public SchoolRetirement System of the City of St. Louis (the "System") as of and for the years endedDecember 31, 2017 and 2016, and the related notes to the schedules. We have also auditedthe total for all entities of the columns titled net pension liability, total deferred outflows ofresources, total deferred inflows of resources, and total employer pension plan expense("specified column totals") included in the accompanying schedules of pension amounts byemployer of the System as of and for the years ended December 31, 2017 and 2016, and therelated notes to the schedules.
Management's Responsibility for the Schedules
The System's management is responsible for the preparation and fair presentation of theseschedules in accordance with accounting principles generally accepted in the United States ofAmerica; this includes the design, implementation, and maintenance of internal control relevantto the preparation and fair presentation of the schedules that are free from materialmisstatement, whether due to fraud or error.
Auditors' Responsibility
Our responsibility is to express opinions on the schedules of employer allocations and thespecified column totals included in the schedules of pension amounts by employer based onour audits. We conducted our audits in accordance with auditing standards generally acceptedin the United States of America. Those standards require that we plan and perform the audits toobtain reasonable assurance about whether the schedules of employer allocations andspecified column totals included in the schedules of pension amounts by employer are free frommaterial misstatement.
Page 1

An audit involves performing procedures to obtain audit evidence about the amounts anddisclosures in the schedules of employer allocations and specified column totals included in theschedules of pension amounts by employer. The procedures selected depend on the auditors'judgment, including the assessment of the risks of material misstatement of the schedules ofemployer allocations and specified column totals included in the schedules of pension amountsby employer, whether due to fraud or error. In making those risk assessments, the auditorconsiders internal control relevant to the System's preparation and fair presentation of theschedules of employer allocations and specified column totals included in the schedules ofpension amounts by employer in order to design audit procedures that are appropriate in thecircumstances, but not for the purpose of expressing an opinion on the effectiveness of theSystem's internal control. Accordingly, we express no such opinion. An audit also includesevaluating the appropriateness of accounting policies used and the reasonableness ofsignificant accounting estimates made by management, as well as evaluating the overallpresentation of the schedules of employer allocations and specified column totals included inthe schedules of pension amounts by employer.
We believe that the audit evidence we have obtained is sufficient and appropriate to provide abasis for our audit opinions.
Opinions
In our opinion, the accompanying schedules referred to above present fairly, in all materialrespects, the employer allocations and net pension liability, total deferred outflows of resources,total deferred inflows of resources, and total employer pension plan expense for the total of allparticipating entities of the System as of and for the years ended December 31, 2017 and 2016,in accordance with accounting principles generally accepted in the United States of America.
Other Matters
We have audited, in accordance with auditing standards generally accepted in the UnitedStates of America, the financial statements of the System as of and for the years endedDecember 31, 2017 and 2016, and our report thereon, dated April 13, 2018, expressed anunmodified opinion on those financial statements.
Restriction of Use
Our report is intended solely for the information and use of the System's management, theBoard of Trustees, the System's employers, and their auditors and is not intended to be usedby anyone other than these specified parties.
October 15, 2018
Page 2

Public School Retirement System of the City of St. LouisSchedules of Employer Allocations
December 31, 2017 and 2016
2017 2016
Employer Employer Name Compensation
EmployerAllocation
Percentage Compensation
EmployerAllocation
Percentage
1 Public SchoolsRetirement System ofthe City of St. Louis $ 535,096 0.23 % $ 478,280 0.21 %
2 St. Louis Public Schools 175,741,386 74.74 173,412,355 76.473 Better Learning
CommunitiesAcademy - - - -
4 Carondelet LeadershipAcademy 2,269,316 0.97 2,007,245 0.88
5 City Garden MontessoriSchool 1,600,524 0.68 1,332,315 0.59
6 Confluence Academy 14,138,330 6.01 13,937,922 6.147 Construction Career
Center - - - -8 EAGLE College
Preparatory School 2,236,495 0.95 1,655,809 0.739 Gateway Science
Academy of St. Louis 5,785,082 2.46 4,794,992 2.1110 Grand Center Arts
Academy 3,124,331 1.33 3,155,676 1.3911 Hawthorn Leadership
School for Girls 1,210,545 0.51 879,164 0.3912 JAMAA Learning Center - - - -13 KIPP Inspire Academy 8,155,182 3.47 6,452,042 2.8414 La Salle Middle School 692,541 0.29 595,310 0.2615 Lafayette Preparatory
Academy 1,364,175 0.58 931,056 0.4116 Lift for Life Academy 3,601,413 1.53 3,636,601 1.6017 North Side Community
School 2,126,487 0.90 2,001,352 0.8818 Preclarus Mastery
Academy 754,013 0.32 608,211 0.2719 Premier Charter School 5,915,343 2.52 5,976,622 2.6320 South City Preparatory
Academy 1,917,863 0.82 1,476,991 0.6521 St. Louis Language
Immersion School 3,177,575 1.35 3,158,352 1.3922 The Arch Community
School 176,366 0.08 - -23 The Biome 610,529 0.26 352,188 0.16
Total Compensation forall Employers $ 235,132,592 100.00 % $ 226,842,483 100.00 %
See notes to schedules Page 3

Pu
bli
c S
ch
oo
l R
eti
rem
en
t S
ys
tem
of
the
Cit
y o
f S
t. L
ou
isS
ch
ed
ule
of
Pen
sio
n A
mo
un
ts b
y E
mp
loyer
Decem
ber
31, 2017
Ne
t P
en
sio
n L
iab
ilit
yD
efe
rre
d O
utf
low
s o
f R
es
ou
rce
s
ER
Em
plo
yer
Na
me
Begin
nin
g N
et
Pensi
on
Lia
bili
ty
Endin
g N
et
Pensi
on
Lia
bili
ty
Diffe
ren
ce
Betw
een
Exp
ect
ed a
nd
Act
ual
Exp
erience
Changes
inA
ssu
mp
tio
ns
Ne
t D
iffe
ren
ce
Betw
een
Pro
ject
ed a
nd
Act
ual
Inve
stm
en
tE
arn
ings
on
Pensi
on P
lan
Inve
stm
en
ts
Changes
inP
roport
ion
and
Diffe
ren
ce
sB
etw
een
Em
plo
yer
Contr
ibutio
ns
and
Pro
port
ionate
Share
of
Contr
ibutio
ns
To
tal D
efe
rre
dO
utflo
ws
of
Re
so
urc
es
1P
ublic
Sch
ools
Re
tire
me
nt
Sys
tem
of th
e C
ity o
f S
t.Louis
$876,4
34
$1,7
27,3
61
$7,2
74
$746,3
30
$119,0
79
$46,3
52
$919,0
35
2S
t. L
ouis
Public
Sch
ools
317,7
72,7
35
567,3
17,0
55
2,3
88,8
91
245,1
17,1
00
39,1
09,1
88
-286,6
15,1
79
3B
etter
Learn
ing
Co
mm
un
itie
sA
ca
de
my
--
--
--
-4
Caro
ndele
t Leaders
hip
Aca
de
my
3,6
78,2
15
7,3
25,6
60
30,8
47
3,1
65,1
51
505,0
10
202,8
99
3,9
03,9
07
5C
ity G
ard
en
Mo
nte
sso
riS
chool
2,4
41,4
26
5,1
66,7
08
21,7
56
2,2
32,3
47
356,1
78
265,8
28
2,8
76,1
09
6C
on
flu
en
ce
Aca
de
my
25,5
40,8
08
45,6
40,4
50
192,1
85
19,7
19,5
81
3,1
46,3
20
-23,0
58,0
86
7C
onstr
uctio
n C
are
er
Cente
r-
--
--
--
8E
AG
LE
Colle
ge
Pre
para
tory
Sch
ool
3,0
34,2
18
7,2
19,7
10
30,4
01
3,1
19,3
74
497,7
06
904,9
13
4,5
52,3
94
9G
ate
way
Sci
ence
Aca
de
my
of
St.
Louis
8,7
86,6
73
18,6
75,0
29
78,6
38
8,0
68,8
02
1,2
87,4
02
964,6
47
10,3
99,4
89
10
Gra
nd C
ente
r A
rts
Aca
de
my
5,7
82,6
78
10,0
85,7
65
42,4
70
4,3
57,6
93
695,2
83
265,5
83
5,3
61,0
29
11
Haw
thorn
Leaders
hip
Sch
oo
l fo
r G
irls
1,6
11,0
40
3,9
07,8
05
16,4
55
1,6
88,4
21
269,3
93
613,4
92
2,5
87,7
61
12
JAM
AA
Learn
ing C
ente
r-
--
--
30,0
70
30,0
70
See n
ote
s to
sch
edule
s P
ag
e 4

Pu
bli
c S
ch
oo
l R
eti
rem
en
t S
ys
tem
of
the
Cit
y o
f S
t. L
ou
isS
ch
ed
ule
of
Pen
sio
n A
mo
un
ts b
y E
mp
loyer
(Co
nti
nu
ed
)D
ecem
ber
31, 2017
Ne
t P
en
sio
n L
iab
ilit
yD
efe
rre
d O
utf
low
s o
f R
es
ou
rce
s
ER
Em
plo
yer
Na
me
Begin
nin
g N
et
Pensi
on
Lia
bili
ty
Endin
g N
et
Pensi
on
Lia
bili
ty
Diffe
ren
ce
Betw
een
Exp
ect
ed a
nd
Act
ual
Exp
erience
Changes
inA
ssu
mp
tio
ns
Ne
t D
iffe
ren
ce
Betw
een
Pro
ject
ed a
nd
Act
ual
Inve
stm
en
tE
arn
ings
on
Pensi
on P
lan
Inve
stm
en
ts
Changes
inP
roport
ion
and
Diffe
ren
ce
sB
etw
een
Em
plo
yer
Contr
ibutio
ns
and
Pro
port
ionate
Share
of
Contr
ibutio
ns
To
tal D
efe
rre
dO
utflo
ws
of
Re
so
urc
es
13
KIP
P Insp
ire A
cadem
y$
11,8
23,1
65
$26,3
26,0
36
$110,8
55
$11,3
74,5
24
$1,8
14,8
40
$2,9
06,9
12
$16,2
07,1
31
14
La S
alle
Mid
dle
Sch
ool
1,0
90,8
86
2,2
35,6
16
9,4
14
965,9
28
154,1
17
318,8
91
1,4
48,3
50
15
La
faye
tte P
repara
tory
Aca
de
my
1,7
06,1
30
4,4
03,7
41
18,5
44
1,9
02,6
97
303,5
81
539,9
21
2,7
64,7
43
16
Lift
for
Life
Aca
de
my
6,6
63,9
59
11,6
25,8
50
48,9
55
5,0
23,1
08
801,4
52
150,0
16
6,0
23,5
31
17
No
rth
Sid
e C
om
mu
nity
Sch
ool
3,6
67,4
15
6,8
64,5
88
28,9
06
2,9
65,9
39
473,2
25
315,6
03
3,7
83,6
73
18
Pre
cla
rus M
aste
ryA
ca
de
my
1,1
14,5
27
2,4
34,0
56
10,2
49
1,0
51,6
67
167,7
97
131,5
64
1,3
61,2
77
19
Pre
mie
r C
ha
rte
r S
ch
oo
l10,9
51,9
73
19,0
95,5
31
80,4
09
8,2
50,4
86
1,3
16,3
90
478,3
23
10,1
25,6
08
20
South
City
Pre
para
tory
Aca
de
my
2,7
06,5
40
6,1
91,1
24
26,0
70
2,6
74,9
60
426,7
98
550,3
92
3,6
78,2
20
21
St. L
ouis
Language
Imm
ers
ion
Sch
oo
l5,7
87,5
81
10,2
57,6
44
43,1
93
4,4
31,9
55
707,1
32
57,1
91
5,2
39,4
71
22
Th
e A
rch
Co
mm
un
ity
Sch
ool
-569,3
34
2,3
97
245,9
88
39,2
48
156,6
55
444,2
88
23
Th
e B
iom
e645,3
75
1,9
70,8
69
8,2
99
851,5
41
135,8
66
394,4
66
1,3
90,1
72
$415,6
81,7
78
$759,0
39,9
32
$3,1
96,2
08
$327,9
53,5
92
$52,3
26,0
05
$9,2
93,7
18
$392,7
69,5
23
See n
ote
s to
sch
edule
s P
ag
e 5

Pu
bli
c S
ch
oo
l R
eti
rem
en
t S
ys
tem
of
the
Cit
y o
f S
t. L
ou
isS
ch
ed
ule
of
Pen
sio
n A
mo
un
ts b
y E
mp
loyer
(Co
nti
nu
ed
)D
ecem
ber
31, 2017
De
ferr
ed
In
flo
ws
of
Re
so
urc
es
ER
Em
plo
yer
Na
me
Diffe
ren
ce
Betw
een
Exp
ect
ed a
nd
Act
ual
Exp
erience
Diffe
ren
ce
Betw
een
Pro
ject
ed a
nd
Actu
al In
ve
stm
en
tE
arn
ings
Changes
inP
roport
ion a
nd
Diffe
ren
ce
sB
etw
een
Em
plo
yer
Contr
ibutio
ns
and
Pro
port
ionate
Share
of
Contr
ibutio
ns
To
tal D
efe
rre
dIn
flow
s of
Re
so
urc
es
To
tal E
mp
loye
rP
ensi
on P
lan
Exp
en
se
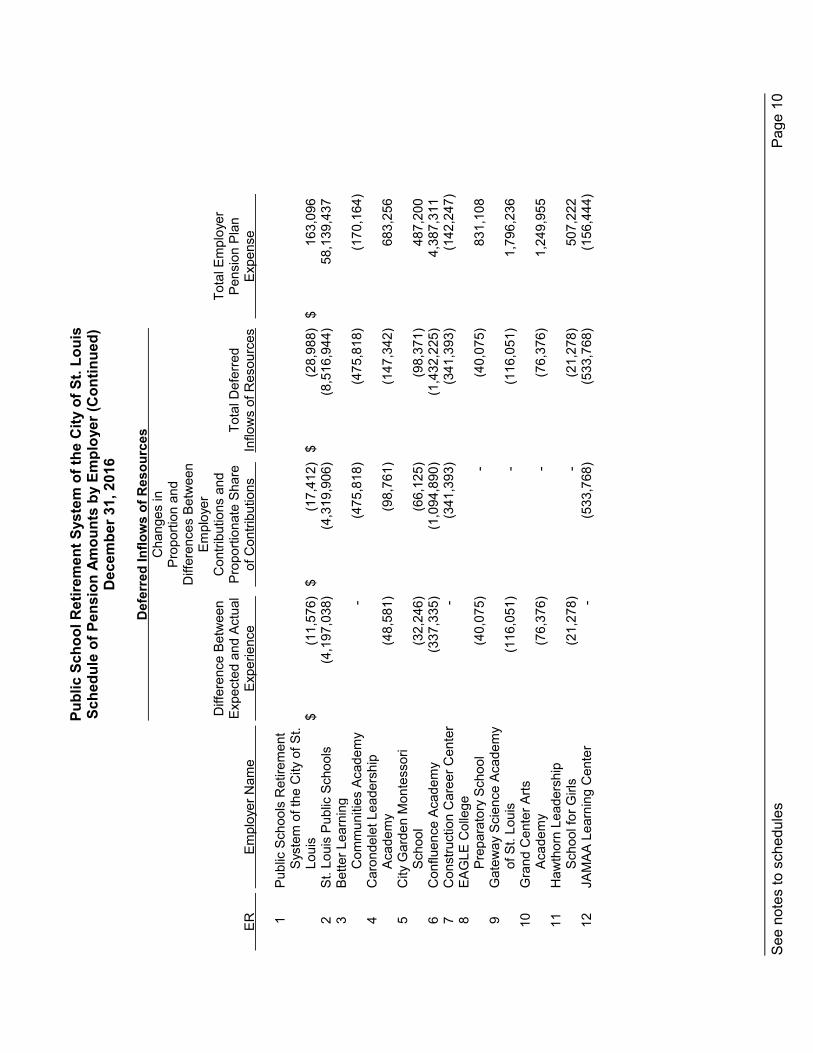
1P
ublic
Sch
ools
Re
tire
me
nt
Sys
tem
of th
e C
ity o
f S
t.Louis
$(2
1,0
64)
$(1
15,0
90)
$(1
0,1
57)
$(1
46,3
11)
$450,2
04
2S
t. L
ouis
Public
Sch
ools
(6,9
18,0
94)
(37,7
98,9
72)
(6,3
23,8
88)
(51,0
40,9
54)
141,4
42,6
61
3B
etter
Learn
ing
Co
mm
un
itie
sA
ca
de
my
--
(305,6
54)
(305,6
54)
(170,1
64)
4C
aro
ndele
t Leaders
hip
Aca
de
my
(89,3
32)
(488,0
91)
(65,8
40)
(643,2
63)
1,9
15,0
83
5C
ity G
ard
en
Mo
nte
sso
riS
chool
(63,0
05)
(344,2
45)
(44,0
84)
(451,3
34)
1,4
12,1
10
6C
on
flu
en
ce
Aca
de
my
(556,5
58)
(3,0
40,9
13)
(958,6
08)
(4,5
56,0
79)
11,0
97,8
01
7C
onstr
uctio
n C
are
er
Cente
r-
-(1
99,1
46)
(199,1
46)
(142,2
47)
8E
AG
LE
Colle
ge
Pre
para
tory
Sch
ool
(88,0
40)
(481,0
32)
-(5
69,0
72)
2,2
62,1
19
9G
ate
way
Sci
ence
Aca
de
my
of
St.
Louis
(227,7
31)
(1,2
44,2
72)
-(1
,472,0
03)
5,1
53,2
15
10
Gra
nd C
ente
r A
rts
Aca
de
my
(122,9
90)
(671,9
90)
(130,2
79)
(925,2
59)
2,6
81,9
54
11
Haw
thorn
Leaders
hip
Sch
oo
l fo
r G
irls
(47,6
53)
(260,3
68)
-(3
08,0
21)
1,2
93,2
75
12
JAM
AA
Learn
ing C
ente
r-
-(3
55,8
46)
(355,8
46)
(156,4
44)
See n
ote
s to
sch
edule
s P
ag
e 6

Pu
bli
c S
ch
oo
l R
eti
rem
en
t S
ys
tem
of
the
Cit
y o
f S
t. L
ou
isS
ch
ed
ule
of
Pen
sio
n A
mo
un
ts b
y E
mp
loyer
(Co
nti
nu
ed
)D
ecem
ber
31, 2017
De
ferr
ed
In
flo
ws
of
Re
so
urc
es
ER
Em
plo
yer
Na
me
Diffe
ren
ce
Betw
een
Exp
ect
ed a
nd
Act
ual
Exp
erience
Diffe
ren
ce
Betw
een
Pro
ject
ed a
nd
Actu
al In
ve
stm
en
tE
arn
ings
Changes
inP
roport
ion a
nd
Diffe
ren
ce
sB
etw
een
Em
plo
yer
Contr
ibutio
ns
and
Pro
port
ionate
Share
of
Contr
ibutio
ns
To
tal D
efe
rre
dIn
flow
s of
Re
so
urc
es
To
tal E
mp
loye
rP
ensi
on P
lan
Exp
en
se
13
KIP
P Insp
ire A
cadem
y$
(321,0
30)
$(1
,754,0
41)
$-
$(2
,075,0
71)
$8,1
07,2
81
14
La S
alle
Mid
dle
Sch
ool
(27,2
62)
(148,9
54)
-(1
76,2
16)
741,6
50
15
La
faye
tte P
repara
tory
Aca
de
my
(53,7
01)
(293,4
11)
-(3
47,1
12)
1,3
55,3
88
16
Lift
for
Life
Aca
de
my
(141,7
70)
(774,6
02)
(149,3
04)
(1,0
65,6
76)
2,9
84,1
15
17
No
rth
Sid
e C
om
mu
nity
Sch
ool
(83,7
10)
(457,3
71)
-(5
41,0
81)
1,9
16,7
63
18
Pre
cla
rus M
aste
ryA
ca
de
my
(29,6
82)
(162,1
75)
(91,5
25)
(283,3
82)
628,0
00
19
Pre
mie
r C
ha
rte
r S
ch
oo
l(2
32,8
59)
(1,2
72,2
89)
(376,0
24)
(1,8
81,1
72)
4,9
15,3
61
20
South
City
Pre
para
tory
Aca
de
my
(75,4
97)
(412,5
00)
(33,6
88)
(521,6
85)
1,7
76,4
64
21
St. L
ouis
Language
Imm
ers
ion
Sch
oo
l(1
25,0
86)
(683,4
42)
(249,6
76)
(1,0
58,2
04)
2,4
89,3
28
22
Th
e A
rch
Co
mm
un
ity
Sch
ool
(6,9
43)
(37,9
33)
-(4
4,8
76)
200,7
32
23
Th
e B
iom
e(2
4,0
34)
(131,3
14)
-(1
55,3
48)
671,8
58
$(9
,256,0
41)
$(5
0,5
73,0
05)
$(9
,293,7
19)
$(6
9,1
22,7
65)
$193,0
26,5
07
See n
ote
s to
sch
edule
s P
ag
e 7

Pu
bli
c S
ch
oo
l R
eti
rem
en
t S
ys
tem
of
the
Cit
y o
f S
t. L
ou
isS
ch
ed
ule
of
Pen
sio
n A
mo
un
ts b
y E
mp
loyer
Decem
ber
31, 2016
Ne
t P
en
sio
n L
iab
ilit
yD
efe
rre
d O
utf
low
s o
f R
es
ou
rce
s
ER
Em
plo
yer
Na
me
Begin
nin
g N
et
Pensi
on
Lia
bili
ty
Endin
g N
et
Pensi
on
Lia
bili
ty
Diffe
ren
ce
Betw
een
Exp
ect
ed a
nd
Act
ual
Exp
erience
Changes
inA
ssu
mp
tio
ns
Ne
t D
iffe
ren
ce
Betw
een
Pro
ject
ed a
nd
Act
ual
Inve
stm
en
tE
arn
ings
on
Pensi
on P
lan
Inve
stm
en
ts
Changes
inP
roport
ion
and
Diffe
ren
ce
sB
etw
een
Em
plo
yer
Contr
ibutio
ns
and
Pro
port
ionate
Share
of
Contr
ibutio
ns
To
tal D
efe
rre
dO
utflo
ws
of
Re
so
urc
es
1P
ublic
Sch
ools
Re
tire
me
nt
Sys
tem
of th
e C
ity o
f S
t.Louis
$649,3
99
$876,4
34
$10,1
08
$111,5
34
$168,7
47
$17,1
19
$307,5
08
2S
t. L
ouis
Public
Sch
ools
251,4
73,4
29
317,7
72,7
35
3,6
65,0
67
40,4
39,3
84
61,1
83,2
76
-105,2
87,7
27
3B
etter
Learn
ing
Co
mm
un
itie
sA
ca
de
my
591,5
30
--
--
--
4C
aro
ndele
t Leaders
hip
Aca
de
my
3,0
24,7
44
3,6
78,2
15
42,4
23
468,0
85
708,1
95
60,4
73
1,2
79,1
76
5C
ity G
ard
en
Mo
nte
sso
riS
chool
2,0
08,6
88
2,4
41,4
26
28,1
58
310,6
93
470,0
67
121,4
46
930,3
64
6C
on
flu
en
ce
Aca
de
my
20,7
57,7
79
25,5
40,8
08
294,5
78
3,2
50,2
93
4,9
17,5
72
-8,4
62,4
43
7C
onstr
uctio
n C
are
er
Cente
r-
--
--
--
8E
AG
LE
Colle
ge
Pre
para
tory
Sch
ool
1,6
73,8
43
3,0
34,2
18
34,9
95
386,1
31
584,2
02
703,9
84
1,7
09,3
12
9G
ate
way
Sci
ence
Aca
de
my
of
St.
Louis
6,4
86,8
15
8,7
86,6
73
101,3
42
1,1
18,1
82
1,6
91,7
67
386,4
59
3,2
97,7
50
10
Gra
nd C
ente
r A
rts
Aca
de
my
4,1
62,7
51
5,7
82,6
78
66,6
95
735,8
97
1,1
13,3
84
429,2
20
2,3
45,1
96
11
Haw
thorn
Leaders
hip
Sch
oo
l fo
r G
irls
711,3
12
1,6
11,0
40
18,5
81
205,0
19
310,1
86
552,2
62
1,0
86,0
48
12
JAM
AA
Learn
ing C
ente
r936,5
64
--
--
51,5
49
51,5
49
See n
ote
s to
sch
edule
s P
ag
e 8
Pu
bli
c S
ch
oo
l R
eti
rem
en
t S
ys
tem
of
the
Cit
y o
f S
t. L
ou
isS
ch
ed
ule
of
Pen
sio
n A
mo
un
ts b
y E
mp
loyer
(Co
nti
nu
ed
)D
ecem
ber
31, 2016
Ne
t P
en
sio
n L
iab
ilit
yD
efe
rre
d O
utf
low
s o
f R
es
ou
rce
s
ER
Em
plo
yer
Na
me
Begin
nin
g N
et
Pensi
on
Lia
bili
ty
Endin
g N
et
Pensi
on
Lia
bili
ty
Diffe
ren
ce
Betw
een
Exp
ect
ed a
nd
Act
ual
Exp
erience
Changes
inA
ssu
mp
tio
ns
Ne
t D
iffe
ren
ce
Betw
een
Pro
ject
ed a
nd
Act
ual
Inve
stm
en
tE
arn
ings
on
Pensi
on P
lan
Inve
stm
en
ts
Changes
inP
roport
ion
and
Diffe
ren
ce
sB
etw
een
Em
plo
yer
Contr
ibutio
ns
and
Pro
port
ionate
Share
of
Contr
ibutio
ns
To
tal D
efe
rre
dO
utflo
ws
of
Re
so
urc
es
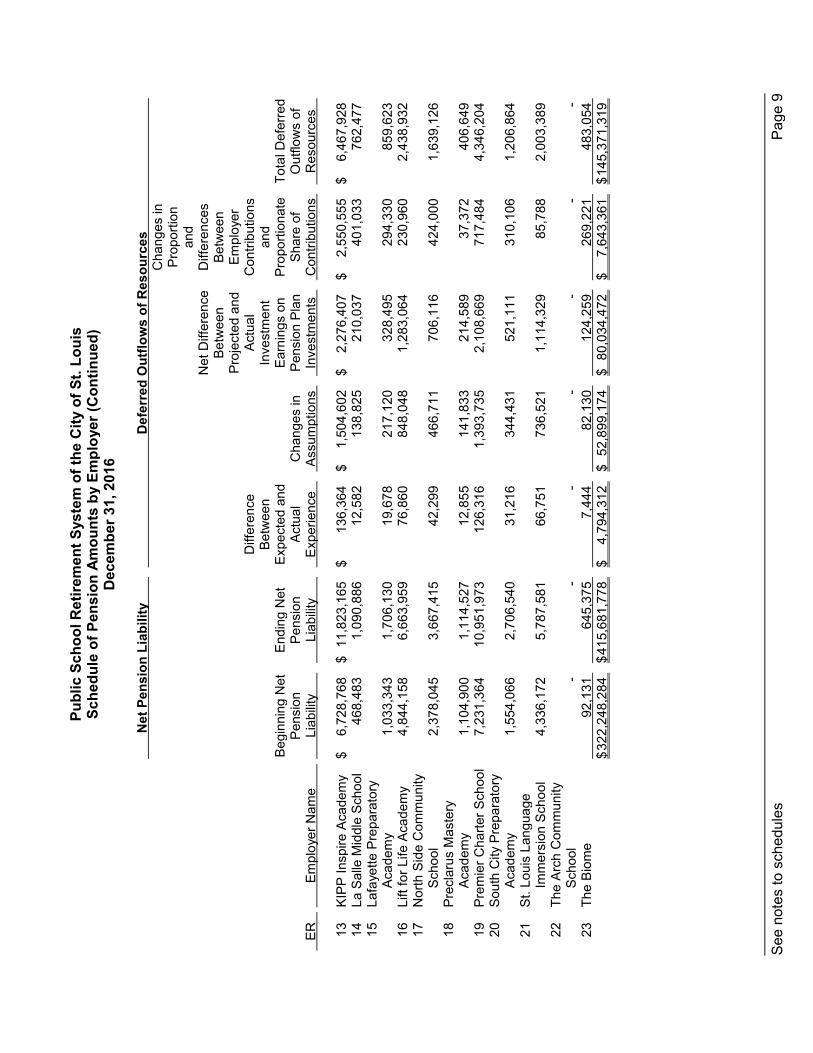
13
KIP
P Insp
ire A
cadem
y$
6,7
28,7
68
$11,8
23,1
65
$136,3
64
$1,5
04,6
02
$2,2
76,4
07
$2,5
50,5
55
$6,4
67,9
28
14
La S
alle
Mid
dle
Sch
ool
468,4
83
1,0
90,8
86
12,5
82
138,8
25
210,0
37
401,0
33
762,4
77
15
La
faye
tte P
repara
tory
Aca
de
my
1,0
33,3
43
1,7
06,1
30
19,6
78
217,1
20
328,4
95
294,3
30
859,6
23
16
Lift
for
Life
Aca
de
my
4,8
44,1
58
6,6
63,9
59
76,8
60
848,0
48
1,2
83,0
64
230,9
60
2,4
38,9
32
17
No
rth
Sid
e C
om
mu
nity
Sch
ool
2,3
78,0
45
3,6
67,4
15
42,2
99
466,7
11
706,1
16
424,0
00
1,6
39,1
26
18
Pre
cla
rus M
aste
ryA
ca
de
my
1,1
04,9
00
1,1
14,5
27
12,8
55
141,8
33
214,5
89
37,3
72
406,6
49
19
Pre
mie
r C
ha
rte
r S
ch
oo
l7,2
31,3
64
10,9
51,9
73
126,3
16
1,3
93,7
35
2,1
08,6
69
717,4
84
4,3
46,2
04
20
South
City
Pre
para
tory
Aca
de
my
1,5
54,0
66
2,7
06,5
40
31,2
16
344,4
31
521,1
11
310,1
06
1,2
06,8
64
21
St. L
ouis
Language
Imm
ers
ion
Sch
oo
l4,3
36,1
72
5,7
87,5
81
66,7
51
736,5
21
1,1
14,3
29
85,7
88
2,0
03,3
89
22
Th
e A
rch
Co
mm
un
ity
Sch
ool
--
--
--
-23
Th
e B
iom
e92,1
31
645,3
75
7,4
44
82,1
30
124,2
59
269,2
21
483,0
54
$322,2
48,2
84
$415,6
81,7
78
$4,7
94,3
12
$52,8
99,1
74
$80,0
34,4
72
$7,6
43,3
61
$145,3
71,3
19
See n
ote
s to
sch
edule
s P
ag
e 9
Pu
bli
c S
ch
oo
l R
eti
rem
en
t S
ys
tem
of
the
Cit
y o
f S
t. L
ou
isS
ch
ed
ule
of
Pen
sio
n A
mo
un
ts b
y E
mp
loyer
(Co
nti
nu
ed
)D
ecem
ber
31, 2016
De
ferr
ed
In
flo
ws
of
Re
so
urc
es
ER
Em
plo
yer
Na
me
Diff
ere
nce
Betw
een
Exp
ect
ed a
nd A
ctual
Exp
erience
Changes
inP
roport
ion a
nd
Diffe
ren
ce
s B
etw
ee
nE
mplo
yer
Contr
ibutio
ns
and
Pro
port
ionate
Share
of C
ontr
ibutio
ns
To
tal D
efe
rre
dIn
flo
ws o
f R
eso
urc
es
To
tal E
mp
loye
rP
ensi
on P
lan
Exp
en
se
1P
ublic
Sch
ools
Retir
em
ent
Sys
tem
of
the
City
of
St.
Louis
$(1
1,5
76)
$(1
7,4
12)
$(2
8,9
88)
$163,0
96
2S
t. L
ouis
Public
Sch
ools
(4,1
97,0
38)
(4,3
19,9
06)
(8,5
16,9
44)
58,1
39,4
37
3B
etter
Learn
ing
Co
mm
un
itie
s A
ca
de
my
-(4
75,8
18)
(475,8
18)
(170,1
64)
4C
aro
ndele
t Leaders
hip
Aca
de
my
(48,5
81)
(98,7
61)
(147,3
42)
683,2
56
5C
ity G
ard
en
Mo
nte
sso
riS
chool
(32,2
46)
(66,1
25)
(98,3
71)
487,2
00
6C
on
flu
en
ce
Aca
de
my
(337,3
35)
(1,0
94,8
90)
(1,4
32,2
25)
4,3
87,3
11
7C
onst
ruct
ion C
are
er
Cente
r-
(341,3
93)
(341,3
93)
(142,2
47)
8E
AG
LE
Colle
ge
Pre
para
tory
Sch
ool
(40,0
75)
-(4
0,0
75)
831,1
08
9G
ate
way
Scie
nce
Aca
de
my
of S
t. L
ouis
(116,0
51)
-(1
16,0
51)
1,7
96,2
36
10
Gra
nd C
ente
r A
rts
Aca
de
my
(76,3
76)
-(7
6,3
76)
1,2
49,9
55
11
Haw
thorn
Leaders
hip
Sch
oo
l fo
r G
irls
(21,2
78)
-(2
1,2
78)
507,2
22
12
JAM
AA
Learn
ing C
ente
r-
(533,7
68)
(533,7
68)
(156,4
44)
See n
ote
s to
sch
edule
s P
ag
e 1
0

Pu
bli
c S
ch
oo
l R
eti
rem
en
t S
ys
tem
of
the
Cit
y o
f S
t. L
ou
isS
ch
ed
ule
of
Pen
sio
n A
mo
un
ts b
y E
mp
loyer
(Co
nti
nu
ed
)D
ecem
ber
31, 2016
De
ferr
ed
In
flo
ws
of
Re
so
urc
es
ER
Em
plo
yer
Na
me
Diff
ere
nce
Betw
een
Exp
ect
ed a
nd A
ctual
Exp
erience
Changes
inP
roport
ion a
nd
Diffe
ren
ce
s B
etw
ee
nE
mplo
yer
Contr
ibutio
ns
and
Pro
port
ionate
Share
of C
ontr
ibutio
ns
To
tal D
efe
rre
dIn
flo
ws o
f R
eso
urc
es
To
tal E
mp
loye
rP
ensi
on P
lan
Exp
en
se
13
KIP
P Insp
ire A
cadem
y$
(156,1
56)
$-
$(1
56,1
56)
$3,1
68,0
62
14
La S
alle
Mid
dle
Sch
ool
(14,4
08)
-(1
4,4
08)
354,1
13
15
La
faye
tte P
repara
tory
Aca
de
my
(22,5
34)
-(2
2,5
34)
429,4
06
16
Lift
for
Life
Aca
de
my
(88,0
15)
-(8
8,0
15)
1,3
32,8
16
17
No
rth
Sid
e C
om
mu
nity
Sch
ool
(48,4
38)
-(4
8,4
38)
843,5
31
18
Pre
cla
rus M
aste
ryA
ca
de
my
(14,7
20)
(137,2
87)
(152,0
07)
179,1
81
19
Pre
mie
r C
ha
rte
r S
ch
oo
l(1
44,6
50)
(218,7
18)
(363,3
68)
2,2
05,4
36
20
South
City
Pre
para
tory
Aca
de
my
(35,7
47)
(57,7
51)
(93,4
98)
587,7
49
21
St. L
ouis
Language
Imm
ers
ion
Sch
oo
l(7
6,4
41)
(281,5
32)
(357,9
73)
998,5
29
22
Th
e A
rch
Co
mm
un
ity
Sch
ool
--
--
23
Th
e B
iom
e(8
,524)
-(8
,524)
214,0
28
$(5
,490,1
89)
$(7
,643,3
61)
$(1
3,1
33,5
50)
$78,0
88,8
17
See n
ote
s to
sch
edule
s P
ag
e 1
1

Public School Retirement System of the City of St. LouisNotes to Schedules
December 31, 2017 and 2016
1. Description of System
General
The Public School Retirement System of the City of St. Louis (the "System") is theadministrator of a cost-sharing multiple-employer defined benefit pension plan existingunder provisions of the Revised Statutes of the State of Missouri (the “Statutes”) toprovide retirement benefits for all employees of the Board of Education of the City of St.Louis, of the Charter Schools located within the St. Louis School District, and of allemployees of the System.
Operations and management of the System are generally prescribed in the Statutes andare supervised by the Board of Trustees. The System's annual reports for December 31,2017 and 2016 are available at www.psrsstl.org.
Membership and Eligibility
All persons employed on a full-time basis by the St. Louis Schools Board of Education,Charter Schools in the City of St. Louis, and the System are members of the plan as acondition of employment.
Benefits
Upon retirement at age 65, or at any age if age plus years of credited service equals orexceeds 80 (Rule of 80) for the year ended December 31, 2017 and 85 (Rule of 85) forthe year ended December 31, 2016, members receive monthly payments for life ofyearly benefits equal to years of credited service multiplied by 2% of average finalcompensation, but not to exceed 60% of average final compensation. Early retirementcan occur at age 60 with five years of service. The service retirement allowance isreduced five ninths of one percent for each month of commencement prior to age 65 orthe age at which the Rule of 80 would apply for the year ended December 31, 2017 andRule of 85 would apply for the year ended December 31, 2016, would have beensatisfied had the employee continued working until that age, if earlier.
In lieu of the benefit paid over the lifetime of the member, reduced benefit options areavailable for survivor and beneficiary payments.
Members are eligible, after accumulation of five years of credited service, for disabilitybenefits prior to eligibility of normal retirement. Survivor benefits are available forqualified beneficiaries of members who die after at least 18 months of activemembership.
Page 12

Public School Retirement System of the City of St. LouisNotes to Schedules
December 31, 2017 and 2016
2. Summary of Significant Accounting Policies
Basis of Presentation and Accounting
The schedules of the System have been prepared in accordance with the criteriaestablished by the Governmental Accounting Standards Board ("GASB"), which is thesource of authoritative accounting principles generally accepted in the United States ofAmerica ("GAAP"), as applied to governmental units. The System's schedules areprepared using the accrual basis of accounting.
The System's employers are required to report pension information in their schedulesfor periods beginning after June 15, 2014, in accordance with Governmental AccountingStandards Board Statement No. 68, Accounting and Financial Reporting for Pensions.The Schedules of Employer Allocations and Pension Amounts by Employer provideemployers with the required information for financial reporting under that standard.
The underlying financial information used to prepare the pension allocation schedules isbased on the System's financial statements, accounting, and payroll reporting systems.
Member and employer contributions are recognized when due, pursuant to formalcommitments and statutory requirements. Benefits and refunds of employeecontributions are recognized when due and payable in accordance with the state ofMissouri statutes governing the System. Expenses are recognized when the liability isincurred, regardless of when payment is made. Investments are reported at fair value ona trade date basis.
Total employer compensation as of and for the years ended December 31, 2017 and2016, was used as the basis for determining each employer's proportionate share of thecollective pension amounts reported on the schedules, respectively.
Use of Estimates
The preparation of schedules in conformity with GAAP requires management to makeestimates and assumptions that affect certain reported amounts and disclosures.Accordingly, actual results could differ from those estimates.
Fair Value Measurements
The System follows guidance issued by the GASB on fair value measurements, whichestablishes a framework for measuring fair value, clarifies the definition of fair valuewithin that framework, and expands disclosures about the use of fair valuemeasurements. This guidance applies whenever fair value is the applicablemeasurement. The three general valuation techniques used to measure fair value arethe market approach, cost approach, and income approach.
Subsequent Events
The System has evaluated subsequent events through October 15, 2018, the date theschedules of pension information for participating employers were available to beissued.
Page 13
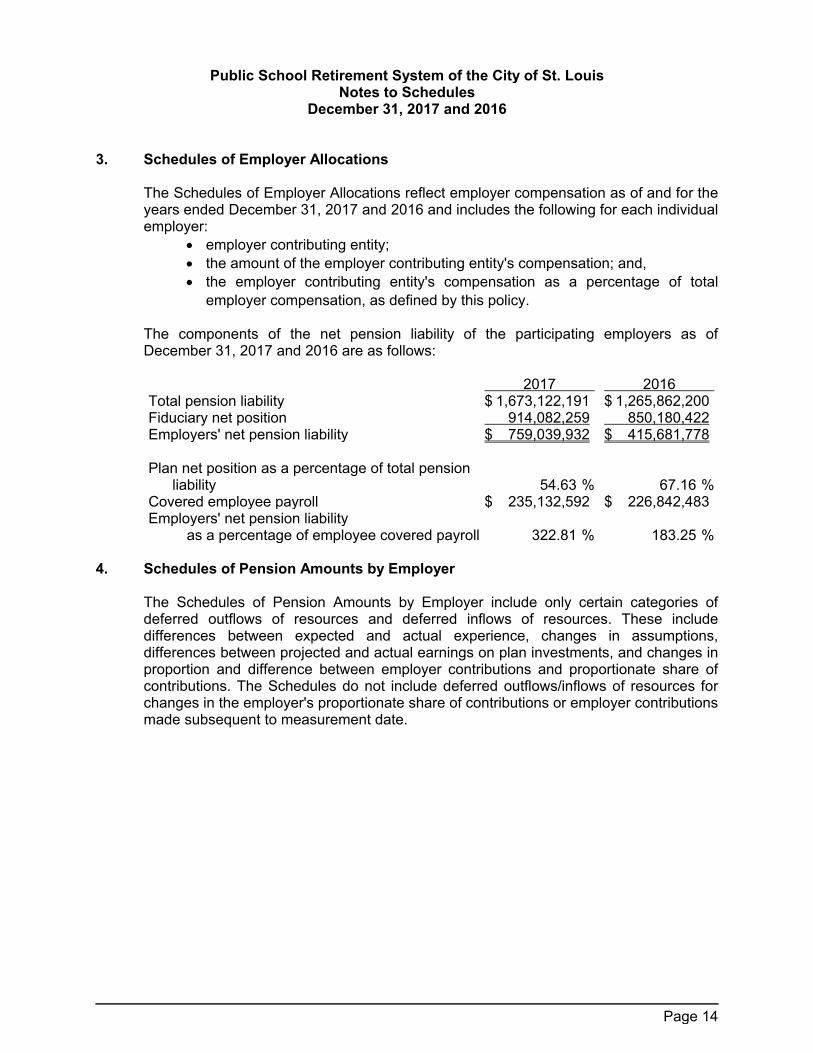
Public School Retirement System of the City of St. LouisNotes to Schedules
December 31, 2017 and 2016
3. Schedules of Employer Allocations
The Schedules of Employer Allocations reflect employer compensation as of and for theyears ended December 31, 2017 and 2016 and includes the following for each individualemployer:
employer contributing entity;
the amount of the employer contributing entity's compensation; and,
the employer contributing entity's compensation as a percentage of total
employer compensation, as defined by this policy.
The components of the net pension liability of the participating employers as ofDecember 31, 2017 and 2016 are as follows:
2017 2016Total pension liability $ 1,673,122,191 $ 1,265,862,200Fiduciary net position 914,082,259 850,180,422Employers' net pension liability $ 759,039,932 $ 415,681,778
Plan net position as a percentage of total pensionliability %54.63 %67.16
Covered employee payroll $ 235,132,592 $ 226,842,483Employers' net pension liability
as a percentage of employee covered payroll %322.81 %183.25
4. Schedules of Pension Amounts by Employer
The Schedules of Pension Amounts by Employer include only certain categories ofdeferred outflows of resources and deferred inflows of resources. These includedifferences between expected and actual experience, changes in assumptions,differences between projected and actual earnings on plan investments, and changes inproportion and difference between employer contributions and proportionate share ofcontributions. The Schedules do not include deferred outflows/inflows of resources forchanges in the employer's proportionate share of contributions or employer contributionsmade subsequent to measurement date.
Page 14

Public School Retirement System of the City of St. LouisNotes to Schedules
December 31, 2017 and 2016
5. Sensitivity of Net Pension Eligibility to Changes in the Discount Rate
The following presents the net pension liability at December 31, 2017 and 2016,calculated using the discount rate of 4.78 percent and 7.50 percent, respectively, as wellas what the net pension liability would have been if it were calculated using a discountrate that is one-percentage point lower or one-percentage-point higher than the currentrate:
1% Decrease(3.78%)
Current DiscountRate (4.78%)
1% Increase(5.78%)
Net pension liability - 2017 $ 961,985,980 $ 759,039,932 $ 590,565,070
1% Decrease(6.50%)
Current DiscountRate (7.50%)
1% Increase(8.50%)
Net pension liability - 2016 $ 541,091,150 $ 415,681,778 $ 309,269,186
The projection of cash flows used to determine the discount rate assumed that Systemcontributions will continue to follow the current funding policy. Based on thoseassumptions, the System's fiduciary net position was projected to be insufficient to makeall projected future benefit payments of current plan members.
Under GASB Statement No. 68, employers participating in the plan could recognize aproportionate share of total pension expense of $193,026,507 and $78,088,817 for theirfiscal years beginning after June 15, 2017 and 2016, respectively.
6. Actuarial Methods and Assumptions
The information presented in the aforementioned schedules was determined as part ofthe 2017 and 2016 actuarial valuation prepared by Conduent at June 8, 2018 and June5, 2017, respectively.
Additional information related to the above actuarial valuation, as applicable for bothyears presented, is as follows:
2017 2016Actuarial cost method Frozen entry age Frozen entry ageRate of investment return 4.78%, net of expenses 7.50%, net of expensesParticipant account interest
crediting rate 5.00% 5.00%Turnover or withdrawal rates Various by age and
year of membershipbased on actual
Various by age andyear of membershipbased on actual
Page 15
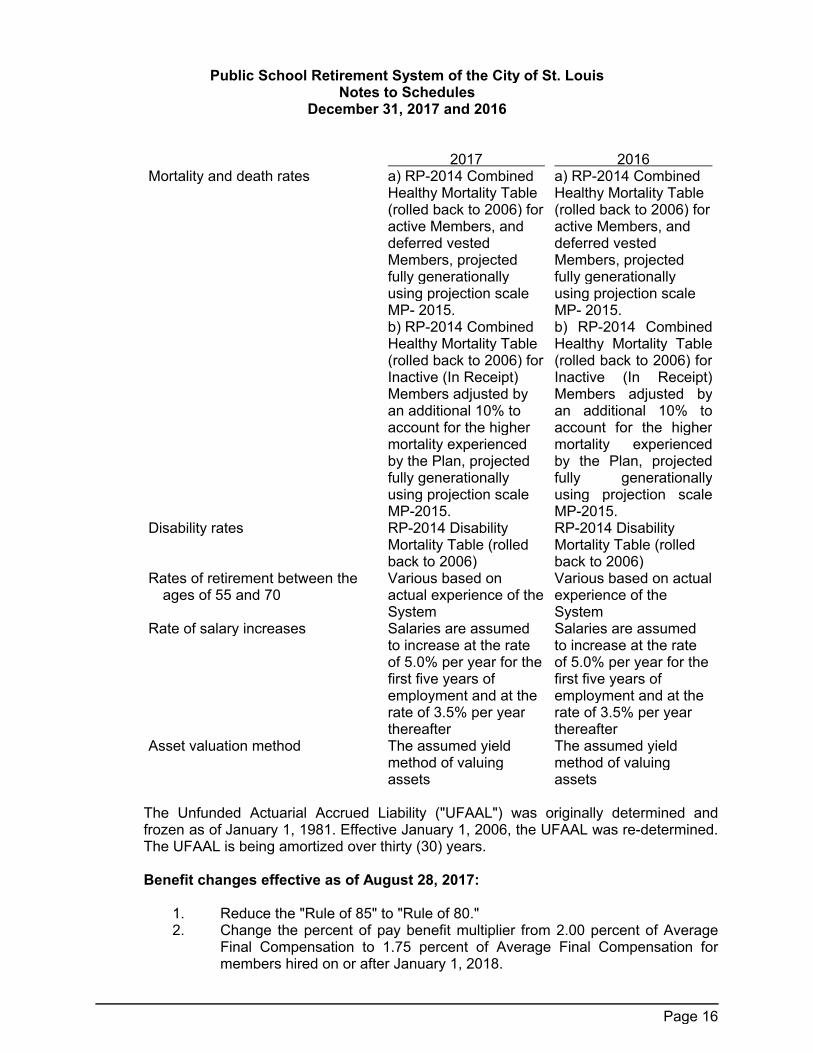
Public School Retirement System of the City of St. LouisNotes to Schedules
December 31, 2017 and 2016
2017 2016Mortality and death rates a) RP-2014 Combined
Healthy Mortality Table(rolled back to 2006) foractive Members, anddeferred vestedMembers, projectedfully generationallyusing projection scaleMP- 2015.b) RP-2014 CombinedHealthy Mortality Table(rolled back to 2006) forInactive (In Receipt)Members adjusted byan additional 10% toaccount for the highermortality experiencedby the Plan, projectedfully generationallyusing projection scaleMP-2015.
a) RP-2014 CombinedHealthy Mortality Table(rolled back to 2006) foractive Members, anddeferred vestedMembers, projectedfully generationallyusing projection scaleMP- 2015.b) RP-2014 CombinedHealthy Mortality Table(rolled back to 2006) forInactive (In Receipt)Members adjusted byan additional 10% toaccount for the highermortality experiencedby the Plan, projectedfully generationallyusing projection scaleMP-2015.
Disability rates RP-2014 DisabilityMortality Table (rolledback to 2006)
RP-2014 DisabilityMortality Table (rolledback to 2006)
Rates of retirement between theages of 55 and 70
Various based onactual experience of theSystem
Various based on actualexperience of theSystem
Rate of salary increases Salaries are assumedto increase at the rateof 5.0% per year for thefirst five years ofemployment and at therate of 3.5% per yearthereafter
Salaries are assumedto increase at the rateof 5.0% per year for thefirst five years ofemployment and at therate of 3.5% per yearthereafter
Asset valuation method The assumed yieldmethod of valuingassets
The assumed yieldmethod of valuingassets
The Unfunded Actuarial Accrued Liability ("UFAAL") was originally determined andfrozen as of January 1, 1981. Effective January 1, 2006, the UFAAL was re-determined.The UFAAL is being amortized over thirty (30) years.
Benefit changes effective as of August 28, 2017:
1. Reduce the "Rule of 85" to "Rule of 80."2. Change the percent of pay benefit multiplier from 2.00 percent of Average
Final Compensation to 1.75 percent of Average Final Compensation formembers hired on or after January 1, 2018.
Page 16
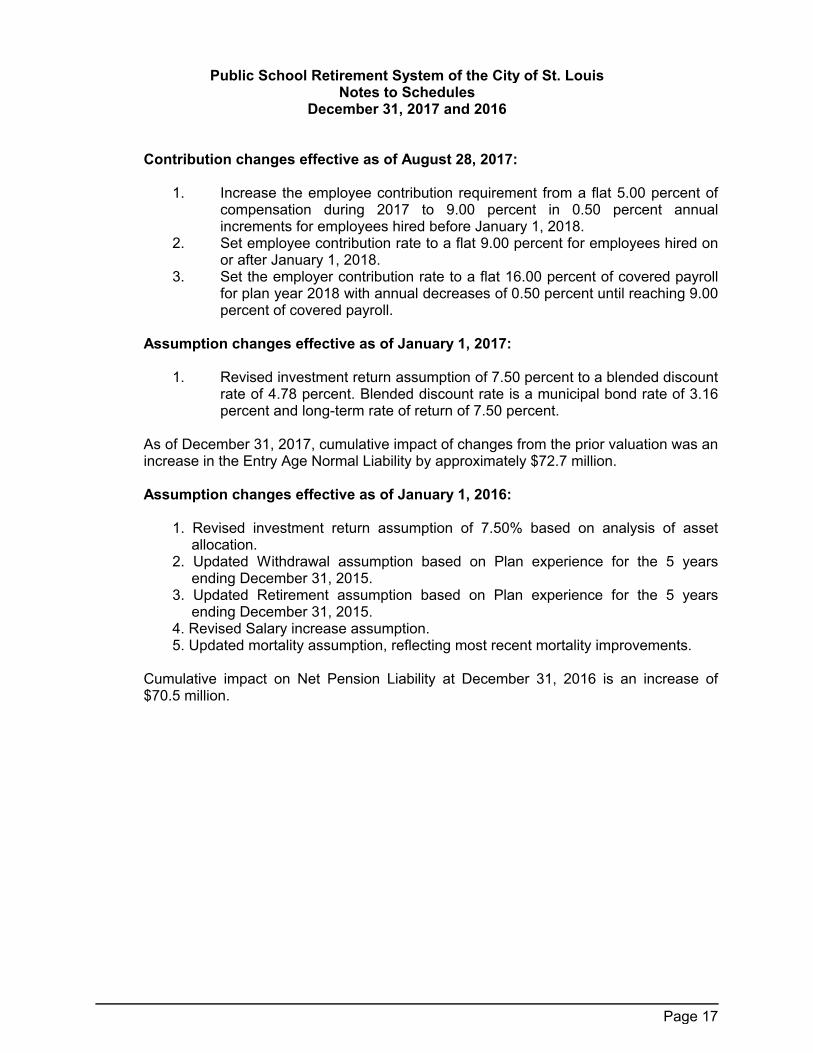
Public School Retirement System of the City of St. LouisNotes to Schedules
December 31, 2017 and 2016
Contribution changes effective as of August 28, 2017:
1. Increase the employee contribution requirement from a flat 5.00 percent ofcompensation during 2017 to 9.00 percent in 0.50 percent annualincrements for employees hired before January 1, 2018.
2. Set employee contribution rate to a flat 9.00 percent for employees hired onor after January 1, 2018.
3. Set the employer contribution rate to a flat 16.00 percent of covered payrollfor plan year 2018 with annual decreases of 0.50 percent until reaching 9.00percent of covered payroll.
Assumption changes effective as of January 1, 2017:
1. Revised investment return assumption of 7.50 percent to a blended discountrate of 4.78 percent. Blended discount rate is a municipal bond rate of 3.16percent and long-term rate of return of 7.50 percent.
As of December 31, 2017, cumulative impact of changes from the prior valuation was anincrease in the Entry Age Normal Liability by approximately $72.7 million.
Assumption changes effective as of January 1, 2016:
1. Revised investment return assumption of 7.50% based on analysis of assetallocation.
2. Updated Withdrawal assumption based on Plan experience for the 5 yearsending December 31, 2015.
3. Updated Retirement assumption based on Plan experience for the 5 yearsending December 31, 2015.
4. Revised Salary increase assumption.5. Updated mortality assumption, reflecting most recent mortality improvements.
Cumulative impact on Net Pension Liability at December 31, 2016 is an increase of$70.5 million.
Page 17
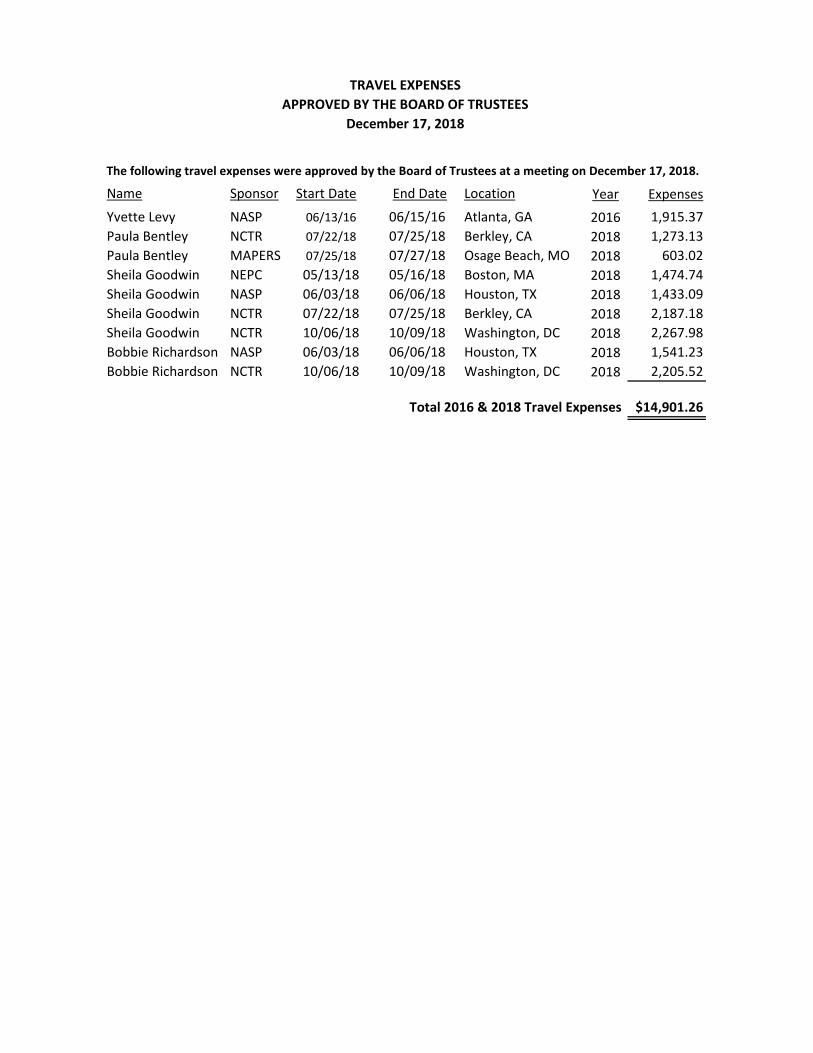
Year ExpensesYvette Levy NASP 06/13/16 06/15/16 Atlanta, GA 2016 1,915.37Paula Bentley NCTR 07/22/18 07/25/18 Berkley, CA 2018 1,273.13Paula Bentley MAPERS 07/25/18 07/27/18 Osage Beach, MO 2018 603.02Sheila Goodwin NEPC 05/13/18 05/16/18 Boston, MA 2018 1,474.74Sheila Goodwin NASP 06/03/18 06/06/18 Houston, TX 2018 1,433.09Sheila Goodwin NCTR 07/22/18 07/25/18 Berkley, CA 2018 2,187.18Sheila Goodwin NCTR 10/06/18 10/09/18 Washington, DC 2018 2,267.98Bobbie Richardson NASP 06/03/18 06/06/18 Houston, TX 2018 1,541.23Bobbie Richardson NCTR 10/06/18 10/09/18 Washington, DC 2018 2,205.52
$14,901.26
The following travel expenses were approved by the Board of Trustees at a meeting on December 17, 2018.
TRAVEL EXPENSESAPPROVED BY THE BOARD OF TRUSTEES
December 17, 2018
Name Sponsor Start Date End Date Location
Total 2016 & 2018 Travel Expenses

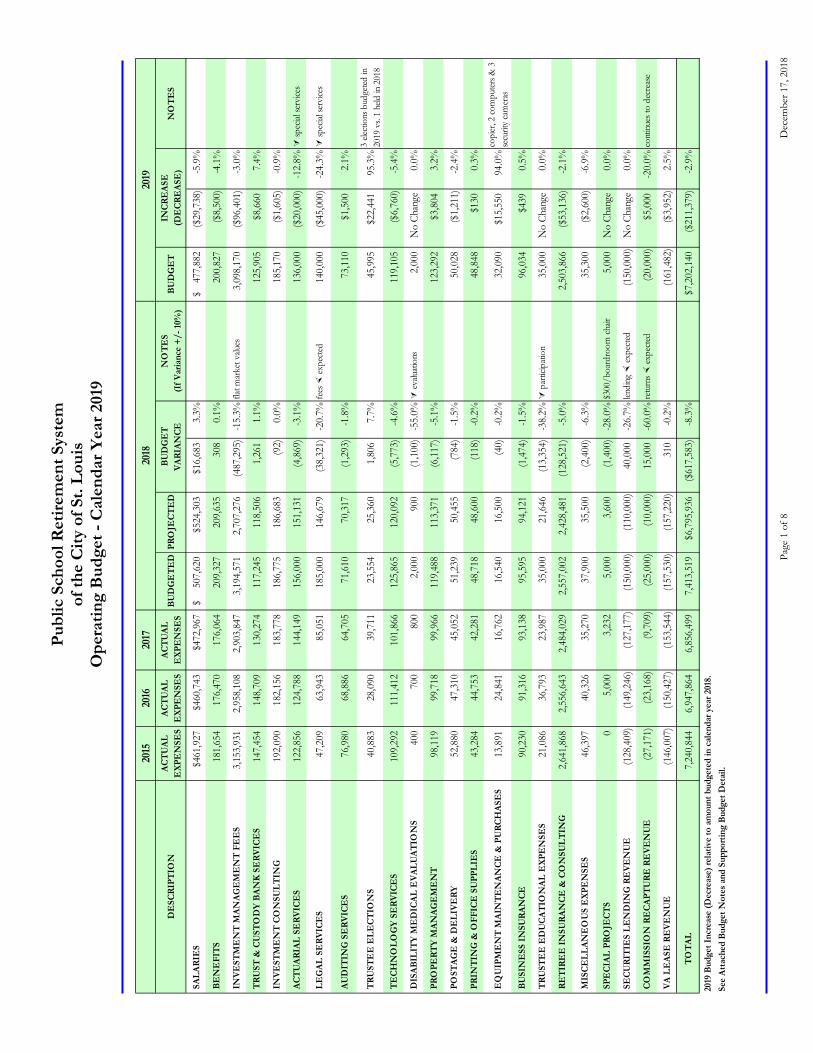
Publ
ic S
choo
l Ret
irem
ent S
yste
m
of th
e C
ity o
f St.
Loui
s O
pera
ting
Bud
get -
Cal
enda
r Yea
r 201
9
Page
1 o
f 8
Dec
embe
r 17,
201
8
2015
2016
2017
DE
SCRI
PTIO
NAC
TUAL
EXP
EN
SES
ACTU
ALE
XPE
NSE
SAC
TUAL
EXP
EN
SES
BUD
GE
TED
PRO
JECT
ED
NO
TES
(If V
aria
nce
+/- 1
0%)
BUD
GE
TN
OTE
S
SAL
ARIE
S$4
61,9
27$4
60,7
43$4
72,9
6750
7,62
0$
$524
,303
$16,
683
3.3%
477,
882
$
($29
,738
)-5
.9%
BE
NE
FITS
181,
654
176,
470
176,
064
209,
327
20
9,63
530
80.
1%20
0,82
7
($
8,50
0)-4
.1%
INVE
STM
EN
T M
ANAG
EM
EN
T FE
ES
3,15
3,93
12,
958,
108
2,90
3,84
73,
194,
571
2,70
7,27
6(4
87,2
95)
-15.
3%fla
t mar
ket v
alues
3,09
8,17
0
($96
,401
)-3
.0%
TRU
ST &
CU
STO
DY
BAN
K SE
RVIC
ES
147,
454
148,
709
130,
274
117,
245
11
8,50
61,
261
1.1%
125,
905
$8,6
607.
4%
INVE
STM
EN
T CO
NSU
LTIN
G19
2,09
018
2,15
618
3,77
818
6,77
5
186,
683
(92)
0.0%
185,
170
($1,
605)
-0.9
%
ACT
UAR
IAL
SERV
ICE
S12
2,85
612
4,78
814
4,14
915
6,00
0
151,
131
(4,8
69)
-3.1
%13
6,00
0
($
20,0
00)
-12.
8%
spec
ial se
rvice
s
LE
GAL
SE
RVIC
ES
47,2
0963
,943
85,0
5118
5,00
0
146,
679
(38,
321)
-20.
7%fe
es
expe
cted
140,
000
($45
,000
)-2
4.3%
sp
ecial
serv
ices
AU
DIT
ING
SE
RVIC
ES
76,9
8068
,886
64,7
0571
,610
70,3
17(1
,293
)-1
.8%
73,1
10
$1,5
002.
1%
TRU
STE
E E
LECT
ION
S40
,883
28,0
9039
,711
23,5
54
25
,360
1,80
67.
7%45
,995
$2
2,44
195
.3%
3 ele
ction
s bud
geted
in
2019
vs.
1 he
ld in
201
8
TE
CHN
OLO
GY
SERV
ICE
S10
9,29
211
1,41
210
1,86
612
5,86
5
120,
092
(5,7
73)
-4.6
%11
9,10
5
($
6,76
0)-5
.4%
DIS
ABIL
ITY
ME
DIC
AL E
VALU
ATIO
NS
400
700
800
2,00
0
90
0(1
,100
)-5
5.0%
ev
aluati
ons
2,00
0
N
o Ch
ange
0.
0%
PRO
PERT
Y M
ANAG
EM
EN
T98
,119
99,7
1899
,966
119,
488
11
3,37
1(6
,117
)-5
.1%
123,
292
$3,8
043.
2%
PO
STAG
E &
DE
LIVE
RY52
,880
47,3
1045
,052
51,2
39
50
,455
(784
)-1
.5%
50,0
28
($1,
211)
-2.4
%
PRI
NTI
NG
& O
FFIC
E S
UPP
LIE
S43
,284
44,7
5342
,281
48,7
18
48
,600
(118
)-0
.2%
48,8
48
$130
0.3%
EQ
UIP
ME
NT
MAI
NTE
NAN
CE &
PU
RCH
ASE
S13
,891
24,8
4116
,762
16,5
40
16
,500
(40)
-0.2
%32
,090
$1
5,55
094
.0%
copi
er, 2
com
puter
s & 3
se
curit
y cam
eras
BU
SIN
ESS
INSU
RAN
CE90
,230
91,3
1693
,138
95,5
95
94
,121
(1,4
74)
-1.5
%96
,034
$4
390.
5%
TRU
STE
E E
DU
CATI
ON
AL E
XPE
NSE
S21
,086
36,7
9323
,987
35,0
00
21
,646
(13,
354)
-38.
2%
par
ticip
ation
35,0
00
No
Chan
ge
0.0%
RE
TIRE
E IN
SURA
NCE
& C
ON
SULT
ING
2,64
1,86
82,
556,
643
2,48
4,02
92,
557,
002
2,42
8,48
1(1
28,5
21)
-5.0
%2,
503,
866
($
53,1
36)
-2.1
%
MIS
CELL
ANE
OU
S E
XPE
NSE
S46
,397
40,3
2635
,270
37,9
00
35
,500
(2,4
00)
-6.3
%35
,300
($
2,60
0)-6
.9%
SPE
CIAL
PRO
JECT
S0
5,00
03,
232
5,00
0
3,
600
(1,4
00)
-28.
0%$3
00/b
oard
room
chair
5,00
0
N
o Ch
ange
0.
0%
SE
CURI
TIE
S LE
ND
ING
RE
VEN
UE
(128
,409
)(1
49,2
46)
(127
,177
)(1
50,0
00)
(1
10,0
00)
40,0
00-2
6.7%
lendi
ng
expe
cted
(150
,000
)
N
o Ch
ange
0.
0%
CO
MM
ISSI
ON
RE
CAPT
URE
RE
VEN
UE
(27,
171)
(23,
168)
(9,7
09)
(25,
000)
(1
0,00
0)15
,000
-60.
0%re
turn
s ex
pecte
d(2
0,00
0)
$5,0
00-2
0.0%
cont
inues
to d
ecre
ase
VA
LEAS
E R
EVE
NU
E(1
46,0
07)
(150
,427
)(1
53,5
44)
(157
,530
)
(157
,220
)31
0-0
.2%
(161
,482
)
($
3,95
2)2.
5%
TOTA
L7,
240,
844
6,
947,
864
6,85
6,49
9
7,
413,
519
$6,7
95,9
36($
617,
583)
-8.3
%$7
,202
,140
($21
1,37
9)-2
.9%
See
Atta
ched
Bud
get N
otes
and
Sup
porti
ng B
udge
t Det
ail.
2018
2019
BUD
GE
TVA
RIAN
CEIN
CRE
ASE
(DE
CRE
ASE
)
2019
Bud
get I
ncre
ase
(Dec
reas
e) re
lativ
e to
am
ount
bud
gete
d in
cal
enda
r yea
r 201
8.
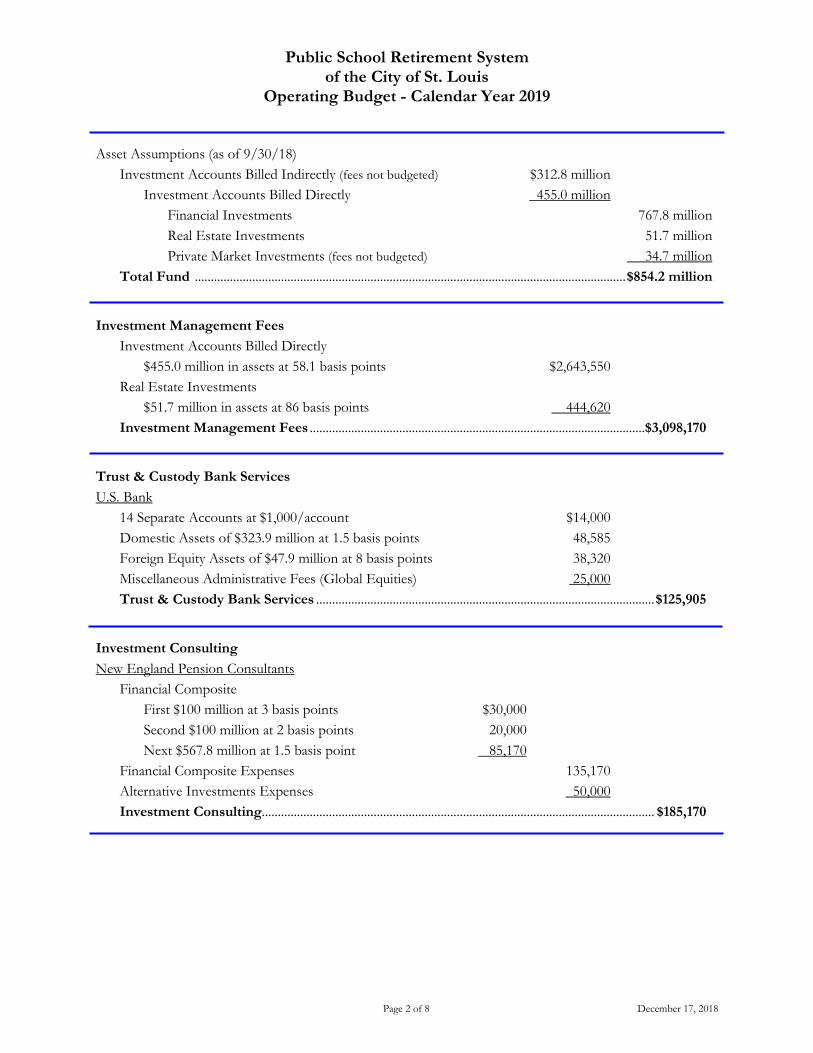
Public School Retirement System of the City of St. Louis
Operating Budget - Calendar Year 2019
Page 2 of 8 December 17, 2018
Asset Assumptions (as of 9/30/18) Investment Accounts Billed Indirectly (fees not budgeted) $312.8 million
Investment Accounts Billed Directly 455.0 million Financial Investments 767.8 million Real Estate Investments 51.7 million Private Market Investments (fees not budgeted) 34.7 million
Total Fund ....................................................................................................................................... $854.2 million
Investment Management Fees Investment Accounts Billed Directly
$455.0 million in assets at 58.1 basis points $2,643,550 Real Estate Investments
$51.7 million in assets at 86 basis points 444,620 Investment Management Fees .........................................................................................................$3,098,170
Trust & Custody Bank Services U.S. Bank
14 Separate Accounts at $1,000/account $14,000 Domestic Assets of $323.9 million at 1.5 basis points 48,585 Foreign Equity Assets of $47.9 million at 8 basis points 38,320 Miscellaneous Administrative Fees (Global Equities) 25,000 Trust & Custody Bank Services .......................................................................................................... $125,905
Investment Consulting New England Pension Consultants
Financial Composite First $100 million at 3 basis points $30,000 Second $100 million at 2 basis points 20,000 Next $567.8 million at 1.5 basis point 85,170
Financial Composite Expenses 135,170 Alternative Investments Expenses 50,000 Investment Consulting ........................................................................................................................... $185,170
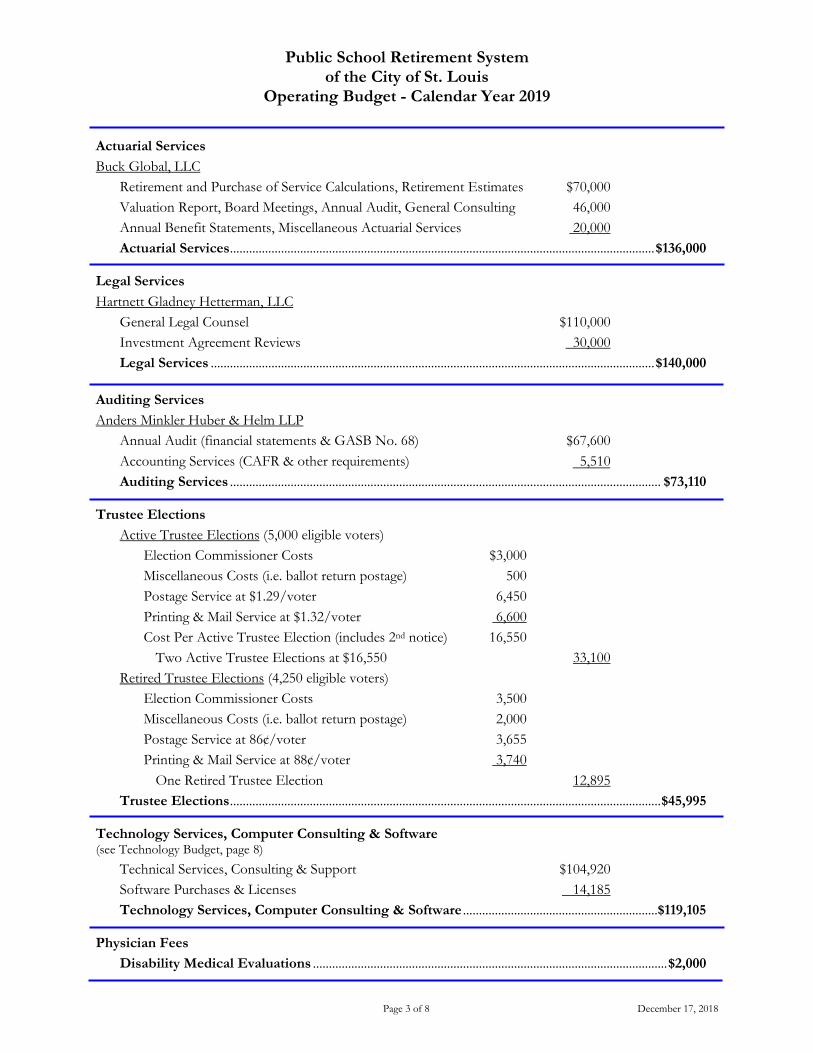
Public School Retirement System of the City of St. Louis
Operating Budget - Calendar Year 2019
Page 3 of 8 December 17, 2018
Actuarial Services Buck Global, LLC
Retirement and Purchase of Service Calculations, Retirement Estimates $70,000 Valuation Report, Board Meetings, Annual Audit, General Consulting 46,000 Annual Benefit Statements, Miscellaneous Actuarial Services 20,000 Actuarial Services ..................................................................................................................................... $136,000
Legal Services Hartnett Gladney Hetterman, LLC
General Legal Counsel $110,000 Investment Agreement Reviews 30,000 Legal Services ........................................................................................................................................... $140,000
Auditing Services Anders Minkler Huber & Helm LLP
Annual Audit (financial statements & GASB No. 68) $67,600 Accounting Services (CAFR & other requirements) 5,510 Auditing Services ....................................................................................................................................... $73,110
Trustee Elections Active Trustee Elections (5,000 eligible voters)
Election Commissioner Costs $3,000 Miscellaneous Costs (i.e. ballot return postage) 500 Postage Service at $1.29/voter 6,450 Printing & Mail Service at $1.32/voter 6,600 Cost Per Active Trustee Election (includes 2nd notice) 16,550 Two Active Trustee Elections at $16,550 33,100
Retired Trustee Elections (4,250 eligible voters) Election Commissioner Costs 3,500 Miscellaneous Costs (i.e. ballot return postage) 2,000 Postage Service at 86¢/voter 3,655 Printing & Mail Service at 88¢/voter 3,740
One Retired Trustee Election 12,895 Trustee Elections ....................................................................................................................................... $45,995
Technology Services, Computer Consulting & Software (see Technology Budget, page 8)
Technical Services, Consulting & Support $104,920 Software Purchases & Licenses 14,185 Technology Services, Computer Consulting & Software .............................................................$119,105
Physician Fees Disability Medical Evaluations ............................................................................................................... $2,000
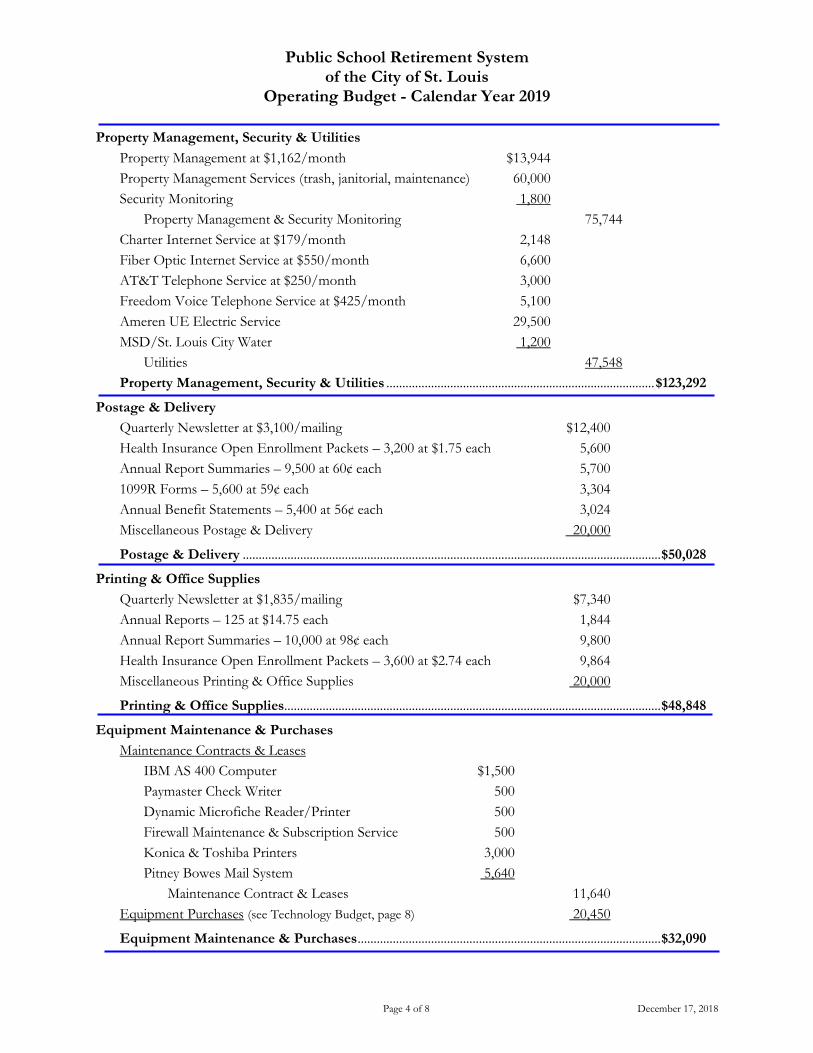
Public School Retirement System of the City of St. Louis
Operating Budget - Calendar Year 2019
Page 4 of 8 December 17, 2018
Property Management, Security & Utilities Property Management at $1,162/month $13,944 Property Management Services (trash, janitorial, maintenance) 60,000 Security Monitoring 1,800 Property Management & Security Monitoring 75,744 Charter Internet Service at $179/month 2,148 Fiber Optic Internet Service at $550/month 6,600 AT&T Telephone Service at $250/month 3,000 Freedom Voice Telephone Service at $425/month 5,100 Ameren UE Electric Service 29,500 MSD/St. Louis City Water 1,200 Utilities 47,548 Property Management, Security & Utilities .................................................................................... $123,292
Postage & Delivery Quarterly Newsletter at $3,100/mailing $12,400 Health Insurance Open Enrollment Packets – 3,200 at $1.75 each 5,600 Annual Report Summaries – 9,500 at 60¢ each 5,700 1099R Forms – 5,600 at 59¢ each 3,304 Annual Benefit Statements – 5,400 at 56¢ each 3,024 Miscellaneous Postage & Delivery 20,000
Postage & Delivery ................................................................................................................................... $50,028
Printing & Office Supplies Quarterly Newsletter at $1,835/mailing $7,340 Annual Reports – 125 at $14.75 each 1,844 Annual Report Summaries – 10,000 at 98¢ each 9,800 Health Insurance Open Enrollment Packets – 3,600 at $2.74 each 9,864 Miscellaneous Printing & Office Supplies 20,000
Printing & Office Supplies...................................................................................................................... $48,848
Equipment Maintenance & Purchases Maintenance Contracts & Leases
IBM AS 400 Computer $1,500 Paymaster Check Writer 500 Dynamic Microfiche Reader/Printer 500 Firewall Maintenance & Subscription Service 500 Konica & Toshiba Printers 3,000 Pitney Bowes Mail System 5,640 Maintenance Contract & Leases 11,640
Equipment Purchases (see Technology Budget, page 8) 20,450
Equipment Maintenance & Purchases ............................................................................................... $32,090

Public School Retirement System of the City of St. Louis
Operating Budget - Calendar Year 2019
Page 5 of 8 December 17, 2018
Business Insurance Fiduciary Coverage $60,179 Crime Coverage & Treasurer’s Bond 3,177 Property, Casualty & Workers’ Compensation Coverage 17,678 Insurance Brokerage Services 15,000
Business Insurance ................................................................................................................................... $96,034
Trustee Educational Expenses Projected for 2019 ...................................................................................................................................... $35,000
Retiree Insurance, Consulting & Open Enrollment (Based on October 2018 enrollment levels)
Retiree Health Care Insurance Subsidy Medical Insurance: 2,250 members @ $80.00/member/month $2,160,000 Dental Insurance: 2,850 members @ $5.95/member/month 203,490 Vision Insurance: 3,050 members @ $2.61/member/month 95,526 Health Insurance Consulting 39,850 Open Enrollment Assistance 5,000
Retiree Insurance, Consulting & Open Enrollment ................................................................. $2,503,866
Miscellaneous Expenses Bank Account Fees $28,800 Public Parking, Subscriptions & Meetings 4,000 Unforeseen Building Supplies & Equipment 2,500
Miscellaneous Expenses ......................................................................................................................... $35,300
Special Projects Planned for 2019 Boardroom Painting & Carpet, Building Signage $5,000
Special Projects Planned for 2019 ........................................................................................................... $5,000

PUB
LIC
SC
HO
OL
RE
TIR
EM
EN
T S
YST
EM
O
F T
HE
CIT
Y O
F ST
. LO
UIS
Page
6 o
f 8
Dec
embe
r 17,
201
8
2019
Org
aniz
atio
nal C
hart
B
oard
of
T
rust
ees
Exe
cutiv
e D
irec
tor
Tech
nolo
gy
Man
ager
In
sura
nce
Ben
efits
Sp
ecia
list
Acc
ount
ing
Spec
ialis
t M
embe
r Ser
vice
s Le
ad
Mem
ber S
ervi
ces
Cle
rical
Ass
ista
nt
Cus
tom
er S
ervi
ce
Rep
rese
ntat
ive
W
ork-
flow
supe
rvis
ion
only

PUB
LIC
SC
HO
OL
RE
TIR
EM
EN
T S
YST
EM
O
F T
HE
CIT
Y O
F ST
. LO
UIS
2018
IN
VE
STM
EN
T M
AN
AG
EM
EN
T F
EE
S
Page
7 o
f 8
Dec
embe
r 17,
201
8
M
ON
EY
MAN
AGE
R
1st
QU
ARTE
R
2nd
QU
ARTE
R3r
d Q
UAR
TER
Man
ager
Fee
s Bill
ed D
irect
ly F
ees
Mar
ket V
alue
Fee
Rat
e F
ees
Mar
ket V
alue
Fee
Rat
e F
ees
M
arke
t Val
ueFe
e R
ate
Caus
eway
Cap
ital M
anag
emen
t83
,724
49,98
3,793
0.670
%79
,293
47,25
7,291
0.671
%80
,315
47,88
6,228
0.671
%Ch
icago
Equ
ity P
artn
ers
41,84
547
,823,2
160.3
50%
42,22
248
,253,5
480.3
50%
43,19
749
,368,2
080.3
50%
EARN
EST
Partn
ers
7,616
12,18
5,755
0.250
%7,6
0912
,174,2
060.2
50%
7,597
12,15
5,304
0.250
%Ed
gar L
omax
Co.
43
,447
35,28
6,103
0.493
%43
,691
35,50
3,466
0.492
%44
,467
36,19
2,699
0.491
%Fi
delit
y In
stitu
tiona
l Ass
et M
gmt C
o.76
,474
51,96
5,724
0.589
%72
,890
48,31
2,092
0.603
%71
,147
46,91
7,400
0.607
%In
tech
33,87
227
,371,6
230.4
95%
34,18
827
,626,6
140.4
95%
34,29
227
,720,4
050.4
95%
Mel
lon
Capi
tal M
anag
emen
t93
07,1
20,36
60.0
52%
967
7,339
,803
0.053
%67
35,0
42,95
90.0
53%
Mel
lon
Glo
bal E
xpan
ded
Alph
a 165
,065
32,98
4,352
0.789
%67
,243
33,71
4,042
0.798
%65
,254
32,36
1,224
0.807
%M
anul
ife A
sset
Man
agem
ent U
.S. L
LC31
,910
42,54
6,087
0.300
%31
,935
42,57
9,981
0.300
%32
,042
42,72
2,283
0.300
%Pi
edm
ont I
nves
tmen
ts (N
CM C
apita
l)8,5
9311
,457,9
730.3
00%
8,591
11,45
4,229
0.300
%8,6
3211
,509,4
690.0
30%
Prog
ress
Inve
stmen
t Man
agem
ent
87,00
153
,539,0
300.6
50%
86,60
353
,294,4
040.6
50%
84,18
051
,803,3
690.6
50%
Syste
mati
c Fi
nanc
ial M
gmt.,
LP
74,49
431
,396,5
810.9
49%
77,13
032
,802,4
060.9
41%
77,14
632
,811,4
560.9
40%
TCW
Ass
et M
anag
emen
t Co.
54,31
236
,208,3
040.6
00%
55,92
737
,284,9
800.6
00%
53,93
235
,954,5
050.6
00%
Wes
tfiel
d Ca
pital
Mgm
t.67
,753
27,80
1,625
0.975
%69
,615
28,79
4,597
0.967
%72
,162
30,15
2,891
0.957
%TO
TAL
MAN
AGE
R F
EE
S BI
LLE
D D
IRE
CTLY
$677
,036
$467
,670
,534
0.57
9%$6
77,9
05$4
66,3
91,6
580.
581%
$675
,037
$462
,598
,399
0.58
4%M
anag
er F
ees B
illed
Indi
rect
lyD
FA52
,861
42,28
8,787
0.500
%47
,218
37,77
4,784
0.500
%50
,113
40,09
0,576
0.500
%EN
TRU
ST72
,592
21,56
6,832
1.346
%73
,646
21,89
1,012
1.346
%73
,522
21,85
3,076
1.346
%G
MO
Glo
bal B
alanc
ed49
,889
36,95
5,112
0.540
%46
,826
34,68
5,598
0.540
%48
,300
35,77
7,710
0.540
%G
rosv
enor
79,10
327
,514,1
331.1
50%
80,28
327
,924,3
521.1
50%
80,70
428
,070,9
811.1
50%
Laza
rd E
mer
ging
Mar
kets
Deb
t58
,603
27,57
7,765
0.850
%57
,800
27,19
9,934
0.850
%56
,018
26,36
1,539
0.850
%Lo
omis
Sayl
es (A
bsol
ute
Retu
rn F
ixed
Inco
me)
55,30
444
,857,9
990.4
93%
56,23
645
,112,4
150.4
99%
56,97
545
,208,2
260.5
04%
Neu
berg
er B
erm
an27
,011
36,01
5,000
0.300
%26
,644
35,52
5,000
0.300
%26
,933
35,91
0,000
0.300
%O
FI G
loba
l Ass
et M
anag
emen
t (Em
ergin
g M
arke
ts)62
,014
29,18
3,244
0.850
%59
,612
28,05
2,688
0.850
%57
,577
27,09
5,056
0.850
%PI
MCO
79,52
536
,774,5
230.8
65%
71,14
732
,900,5
410.8
65%
71,39
933
,016,6
680.8
65%
UBS
Tru
mbu
ll (R
eal E
state
Fun
ds)
122,9
8055
,726,2
210.8
83%
106,7
0950
,563,3
090.8
44%
109,3
0551
,281,3
060.8
53%
Whi
tebo
x69
,191
18,45
0,971
1.500
%69
,545
18,54
5,333
1.500
%71
,305
19,01
4,720
1.500
%TO
TAL
MAN
AGE
R F
EE
S BI
LLE
D IN
DIR
ECT
LY$7
29,0
74$3
76,9
10,5
860.
774%
$695
,666
$360
,174,
966
0.77
3%$7
02,15
0$3
63,6
79,8
570.
772%
TOTA
L AL
L FE
ES
$1,4
06,11
1$8
44,5
81,12
00.
666%
$1,3
73,5
71$8
26,5
66,6
240.
665%
$1,3
77,18
7$8
26,2
78,2
560.
667%
$2,0
29,9
78$2
,126,
891
$4,15
6,86
9
TOTA
L YE
AR-T
O-D
ATE
MAN
AGE
R F
EE
S BI
LLE
D D
IRE
CTLY
TOTA
L YE
AR-T
O-D
ATE
MAN
AGE
R F
EE
S BI
LLE
D IN
DIR
ECT
LY
TOTA
L YE
AR-T
O-D
ATE
MAN
AGE
R F
EE
S

PUB
LIC
SC
HO
OL
RE
TIR
EM
EN
T S
YST
EM
O
F T
HE
CIT
Y O
F ST
. LO
UIS
2019
TE
CH
NO
LOG
Y B
UD
GE
T
Pa
ge 8
of 8
D
ecem
ber 1
7, 2
018
T
YPE
DE
SCR
IPT
ION
HA
RD
WA
RE
SOFT
WA
RE
SER
VIC
ES
TO
TA
LH
ardw
are
Repl
ace
& U
pgra
de T
hree
Sec
urity
Cam
eras
$6,5
50Re
plac
e Co
py M
achi
ne10
,700
Repl
ace
1 La
ptop
, 1 D
esk
Top
and
4 M
onito
rs
3,20
0 T
otal
Har
dwar
e (s
ee p
age
4 - e
quip
men
t mai
nten
ance
& p
urch
ases
)$2
0,45
0 $2
0,45
0 So
ftwar
eA
dobe
PD
F Pr
ofes
siona
l Sof
twar
e Li
cens
es$4
80G
ener
al L
edge
r Sof
twar
e Re
plac
emen
t & U
pgra
de2,
500
Lene
l Bui
ldin
g Se
curit
y Sy
stem
275
SQL
Serv
er E
nter
prise
Lic
ense
s, Se
curit
y U
pgra
de7,
500
Qui
ckbo
oks
Prem
ier S
erve
r and
Lic
ense
400
Reliu
s G
over
nmen
t For
ms
1099
For
ms
and
Env
elop
es1,
000
Reliu
s G
over
nmen
t For
ms
Ann
ual L
icen
se40
0M
icro
soft
Off
ice3
65 (O
ffic
e 20
16)
250
PRIS
M S
canp
ath
Softw
are
for K
onic
a/M
inol
ta P
rinte
r18
0M
iscel
lane
ous
Softw
are
1,20
0T
otal
Sof
twar
e (s
ee p
age
3 - t
echn
olog
y se
rvic
es)
$14,
185
$14,
185
Serv
ices
Ann
ual M
embe
r Add
ress
Ver
ifica
tion
Serv
ice
$1,0
00
Mon
thly
Dea
thSc
an V
erifi
catio
n Se
rvic
e2,
000
Blad
e Te
chno
logy
Ser
vice
Plus
Rem
ote
Mon
itorin
g an
d M
ainte
nanc
e
16,
800
Blad
e Te
chno
logy
Sec
urity
Aud
it &
Disa
ster
Rec
over
y
6,
120
Blad
e Te
chno
logy
On-
Site
Main
tena
nce
(est
imat
ed 2
4 ho
urs)
3,36
0 Bl
ade
Tech
nolo
gy S
oftw
are
Upg
rade
s &
Con
vers
ions
5,
400
Doc
umen
t Im
agin
g Se
rvic
e &
Lic
ensin
g
7,
400
VE
EA
M O
ff-s
ite D
ata
Back
up4,
260
Gen
eral
Led
ger A
naly
sis &
Con
vers
ion
7,20
0 Ju
pite
r Con
sulti
ng S
ervi
ces
5
0,00
0 W
ebsit
e H
ostin
g
2
00
Web
site
Mod
ifica
tions
1,08
0 E
fax.
com
Inte
rnet
Ser
vice
100
T
otal
Ser
vice
s (s
ee p
age
3 - t
echn
olog
y se
rvic
es)
$104
,920
$1
04,9
20
TO
TA
L$2
0,45
0 $1
4,18
5 $1
04,9
20
$139
,555

TAB 2

To be Authorized and Approvedby the Board of Trustees
NAME \POSITION DATE
Pamela Braun 12/1/2018 Normal 13.9265 $31,421.51 $729.32Teacher Assistant
Nancy Briggs 12/1/2018 Normal 18.4444 $57,236.34 $1,759.49Teacher
Lillie Bryant-Simpson 12/1/2018 Normal 12.7222 $30,187.23 $400.05Teacher
Tyrone Van Buren 12/1/2018 Early 7.5122 $36,921.76 $418.61Custodian
RETIREMENT
APPLICATIONS FOR RETIREMENT
TYPE BENEFITMONTHLYFINAL AVG
SALARYCREDITEDSERVICE
Page 1 of 1 January 2019

To be Authorized and Approvedby the Board of Trustees
NAME \POSITION DATE
Shaun Albright 1/1/2019 Normal 12.1261 $26,029.04 $324.05Recruitment Office Assistant
Lee Brown 1/1/2019 Early 13.5278 $61,598.45 $1,265.36Teacher
Susan Fletcher 1/1/2019 Normal 9.9250 $25,566.69 $215.95Nurse
Janice Jackson 1/1/2019 Normal 17.7333 $37,138.30 $1,097.64Teacher
Joseph Jones 1/1/2019 Early 7.4087 $120,728.63 $1,149.95Coordinator VICC
Eleanor Patton 1/1/2019 Normal 30.0000 $62,184.17 $3,109.21Safety Officer
Kimberly Schilli 1/1/2019 Early 19.8222 $51,041.24 $1,371.05
Margaret Yehling 1/1/2019 Normal 27.0833 $67,421.29 $3,043.32Teacher
RETIREMENT
APPLICATIONS FOR RETIREMENT
TYPE BENEFITMONTHLYFINAL AVG
SALARYCREDITEDSERVICE
Page 1 of 1 February 2019
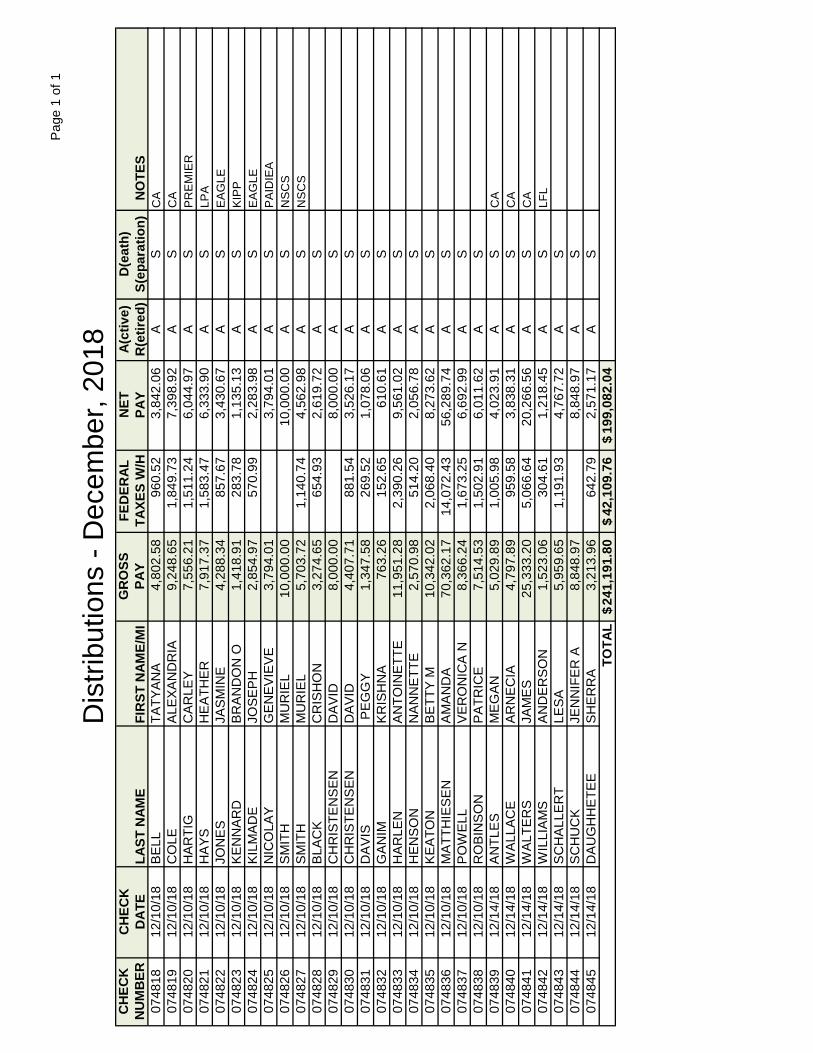
Pag
e 1
of 1
CH
ECK
CH
ECK
GR
OSS
FED
ERAL
NET
A(ct
ive)
D(e
ath)
NU
MB
ERD
ATE
LAST
NAM
EFI
RST
NAM
E/M
IPA
YTA
XES
W/H
PAY
R(e
tired
)S(
epar
atio
n) N
OTE
S07
4818
12/1
0/18
BE
LLTA
TYA
NA
4,80
2.58
960.
523,
842.
06A
SC
A07
4819
12/1
0/18
CO
LEA
LEXA
ND
RIA
9,24
8.65
1,84
9.73
7,39
8.92
AS
CA
0748
2012
/10/
18H
AR
TIG
CA
RLE
Y7,
556.
211,
511.
246,
044.
97A
SP
RE
MIE
R07
4821
12/1
0/18
HA
YSH
EA
THE
R7,
917.
371,
583.
476,
333.
90A
SLP
A07
4822
12/1
0/18
JON
ES
JA
SM
INE
4,
288.
3485
7.67
3,43
0.67
AS
EA
GLE
0748
2312
/10/
18K
EN
NA
RD
BR
AN
DO
N O
1,41
8.91
283.
781,
135.
13A
SK
IPP
0748
2412
/10/
18K
ILM
AD
EJO
SE
PH
2,
854.
9757
0.99
2,28
3.98
AS
EA
GLE
0748
2512
/10/
18N
ICO
LAY
GE
NE
VIE
VE
3,79
4.01
3,79
4.01
AS
PA
IDIE
A07
4826
12/1
0/18
SM
ITH
MU
RIE
L 10
,000
.00
10,0
00.0
0A
SN
SC
S07
4827
12/1
0/18
SM
ITH
MU
RIE
L 5,
703.
721,
140.
744,
562.
98A
SN
SC
S07
4828
12/1
0/18
BLA
CK
CR
ISH
ON
3,27
4.65
654.
932,
619.
72A
S07
4829
12/1
0/18
CH
RIS
TEN
SE
ND
AV
ID8,
000.
008,
000.
00A
S07
4830
12/1
0/18
CH
RIS
TEN
SE
ND
AV
ID4,
407.
7188
1.54
3,52
6.17
AS
0748
3112
/10/
18D
AV
IS
PE
GG
Y1,
347.
5826
9.52
1,07
8.06
AS
0748
3212
/10/
18G
AN
IMK
RIS
HN
A76
3.26
152.
6561
0.61
AS
0748
3312
/10/
18H
AR
LEN
AN
TOIN
ETT
E11
,951
.28
2,39
0.26
9,56
1.02
AS
0748
3412
/10/
18H
EN
SO
NN
AN
NE
TTE
2,57
0.98
514.
202,
056.
78A
S07
4835
12/1
0/18
KE
ATO
NB
ETT
Y M
10
,342
.02
2,06
8.40
8,27
3.62
AS
0748
3612
/10/
18M
ATT
HIE
SE
NA
MA
ND
A
70,3
62.1
714
,072
.43
56,2
89.7
4A
S07
4837
12/1
0/18
PO
WE
LLV
ER
ON
ICA
N8,
366.
241,
673.
256,
692.
99A
S07
4838
12/1
0/18
RO
BIN
SO
N
PA
TRIC
E7,
514.
531,
502.
916,
011.
62A
S07
4839
12/1
4/18
AN
TLE
SM
EG
AN
5,02
9.89
1,00
5.98
4,02
3.91
AS
CA
0748
4012
/14/
18W
ALL
AC
EA
RN
EC
IA4,
797.
8995
9.58
3,83
8.31
AS
CA
0748
4112
/14/
18W
ALT
ER
SJA
ME
S
25,3
33.2
05,
066.
6420
,266
.56
AS
CA
0748
4212
/14/
18W
ILLI
AM
S
AN
DE
RS
ON
1,
523.
0630
4.61
1,21
8.45
AS
LFL
0748
4312
/14/
18S
CH
ALL
ER
TLE
SA
5,95
9.65
1,19
1.93
4,76
7.72
AS
0748
4412
/14/
18S
CH
UC
KJE
NN
IFE
R A
8,
848.
978,
848.
97A
S07
4845
12/1
4/18
DA
UG
HH
ETE
ES
HE
RR
A3,
213.
9664
2.79
2,57
1.17
AS
241,
191.
80$
42,1
09.7
6$
199,
082.
04$
Dis
tribu
tions
- D
ecem
ber,
2018
TOTA
L

Page
1 o
f 2
CH
ECK
CH
ECK
GR
OSS
FED
ERAL
NET
A(ct
ive)
D(e
ath)
NU
MB
ERD
ATE
LAST
NAM
EFI
RST
NAM
E/M
IPA
YTA
XES
W/H
PAY
R(e
tired
)S(
epar
atio
n) N
OTE
S07
1925
07/2
7/16
BETT
S SY
MAN
THA
(20,
000.
00)
(20,
000.
00)
AS
VO
ID &
RE
ISS
UE
0748
9401
/14/
19BR
ELAN
D
RAC
HEL
2,40
2.11
480.
421,
921.
69A
SP
RE
M07
4896
01/1
4/19
DAV
IS
MAR
BLE
1,36
6.47
273.
291,
093.
18A
SK
IPP
0748
9701
/14/
19D
ON
ELSO
NM
ARLE
NE
947.
6818
9.54
758.
14A
SC
A07
4898
01/1
4/19
HAY
NES
BRAN
DO
N5,
045.
205,
045.
20A
SK
IPP
0748
9901
/14/
19M
CN
ERN
EYKE
LLY
2,36
1.64
2,36
1.64
AS
CG
MC
S S
CP
A07
4900
01/1
4/19
REH
BEIN
ELIZ
ABET
H2,
381.
912,
381.
91A
SK
IPP
0749
0101
/14/
19R
EYES
ALEJ
AND
RA
4,76
7.93
953.
593,
814.
34A
SK
IPP
0749
0201
/14/
19R
YAN
NEA
L 2,
142.
662,
142.
66A
SK
IPP
0749
0301
/14/
19TO
RR
INI
RU
DO
LPH
67
4.32
134.
8653
9.46
AS
PR
EM
0749
0401
/14/
19BU
CKL
EYJE
NN
IFER
G40
,637
.74
40,6
37.7
4A
S07
4905
01/1
4/19
HAR
RIS
TER
ESA
12,3
78.5
42,
475.
719,
902.
83A
S07
4906
01/1
4/19
JON
ESED
MU
ND
V2,
740.
272,
740.
27A
S07
4907
01/1
4/19
JON
ESTI
FFAN
Y7,
233.
431,
446.
695,
786.
74A
S07
4908
01/1
4/19
LAN
GN
ESS
BRIA
NN
A1,
383.
021,
383.
02A
S07
4909
01/1
4/19
LAW
REN
CE
CH
ARM
AIN
E29
,583
.96
5,91
6.79
23,6
67.1
7A
S07
4910
01/1
4/19
PRIC
E III
GEO
RG
E S
1,71
2.80
342.
561,
370.
24A
S07
4911
01/1
4/19
RAG
GET
TED
ENIS
E1,
108.
5822
1.72
886.
86A
S07
4912
01/1
4/19
SMIT
HC
ARLO
N
4,44
4.88
888.
983,
555.
90A
S07
4913
01/1
4/19
CH
INN
ISH
ANE
3,23
9.26
647.
852,
591.
41A
SK
IPP
0749
3201
/25/
19BR
OW
NFR
EDER
ICK
5,80
4.98
5,80
4.98
AS
CA
0749
3301
/25/
19BR
OW
NJE
SSIC
A M
3,35
4.05
3,35
4.05
AS
CA
KIP
P07
4934
01/2
5/19
CAV
DAR
ABD
ULL
AH S
13
,333
.24
2,66
6.65
10,6
66.5
9A
SG
SA
0749
3501
/25/
19C
LAR
K BR
OO
K R
639.
6912
7.94
511.
75A
SK
IPP
0749
3601
/25/
19D
AVIS
R
AMIA
4,
288.
0685
7.61
3,43
0.45
AS
KIP
P07
4937
01/2
5/19
DO
WN
SER
IN7,
134.
447,
134.
44A
SLF
L07
4938
01/2
5/19
ENG
LAN
DTA
M W
20,4
01.1
920
,401
.19
AS
AQ
S-G
C, G
CA
A, S
LPS
0749
3901
/25/
19G
RAM
KEER
ICA
1,02
4.15
204.
8381
9.32
AS
LSM
S07
4940
01/2
5/19
HAR
GIS
LILI
A K
17,1
31.6
417
,131
.64
AS
EA
GLE
SLP
S07
4941
01/2
5/19
MC
ELR
OY
CH
ERIE
4,68
3.64
936.
733,
746.
91A
SP
RE
M S
CP
A07
4942
01/2
5/19
PAST
OR
JOSE
PH2,
451.
272,
451.
27A
SP
RE
M07
4943
01/2
5/19
POW
ERS
STAC
Y4,
858.
8697
1.77
3,88
7.09
AS
CA
0749
4401
/25/
19VA
UG
HN
SAN
DR
A18
,283
.81
3,65
6.76
14,6
27.0
5A
SIE
SM
, HLS
G07
4945
01/2
5/19
WAN
GO
LIVI
A 9,
277.
861,
855.
577,
422.
29A
SS
LLIS
Dis
tribu
tions
- Ja
nuar
y, 2
019
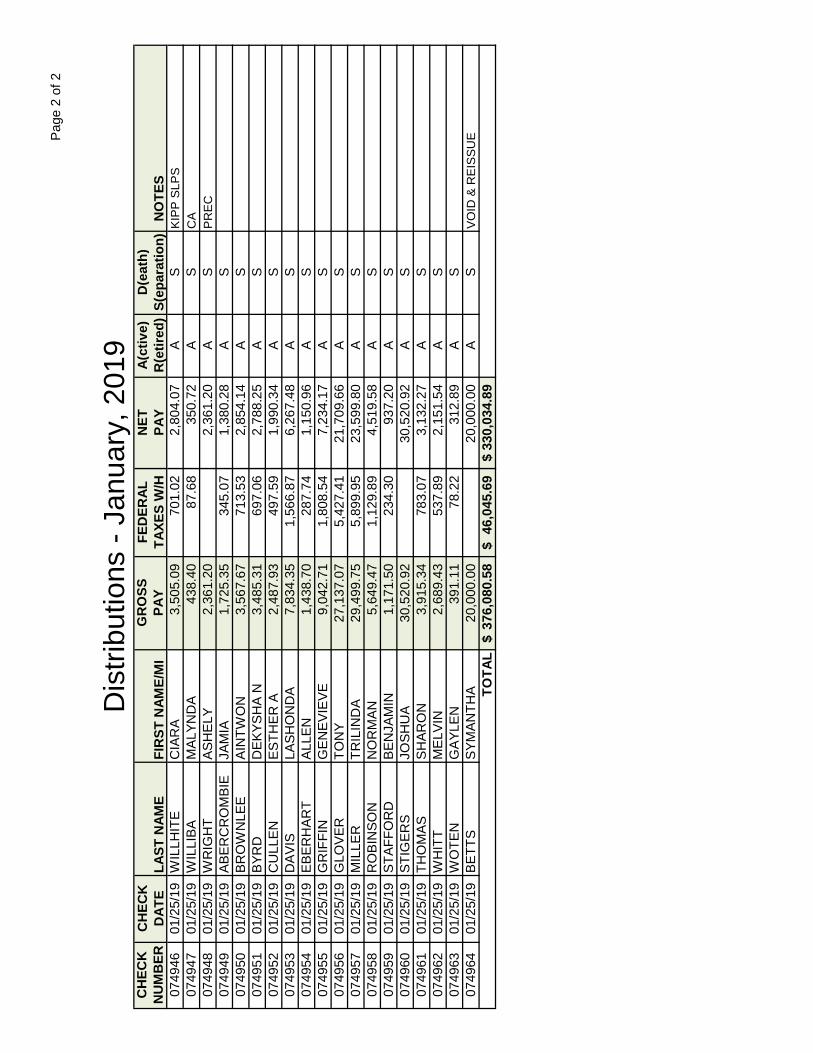
Page
2 o
f 2
CH
ECK
CH
ECK
GR
OSS
FED
ERAL
NET
A(ct
ive)
D(e
ath)
NU
MB
ERD
ATE
LAST
NAM
EFI
RST
NAM
E/M
IPA
YTA
XES
W/H
PAY
R(e
tired
)S(
epar
atio
n) N
OTE
S
Dis
tribu
tions
- Ja
nuar
y, 2
019
0749
4601
/25/
19W
ILLH
ITE
CIA
RA
3,50
5.09
701.
022,
804.
07A
SK
IPP
SLP
S07
4947
01/2
5/19
WIL
LIBA
MAL
YND
A43
8.40
87.6
835
0.72
AS
CA
0749
4801
/25/
19W
RIG
HT
ASH
ELY
2,36
1.20
2,36
1.20
AS
PR
EC
0749
4901
/25/
19AB
ERC
RO
MBI
EJA
MIA
1,
725.
3534
5.07
1,38
0.28
AS
0749
5001
/25/
19BR
OW
NLE
EAI
NTW
ON
3,56
7.67
713.
532,
854.
14A
S07
4951
01/2
5/19
BYR
DD
EKYS
HA
N3,
485.
3169
7.06
2,78
8.25
AS
0749
5201
/25/
19C
ULL
ENES
THER
A2,
487.
9349
7.59
1,99
0.34
AS
0749
5301
/25/
19D
AVIS
LA
SHO
ND
A7,
834.
351,
566.
876,
267.
48A
S07
4954
01/2
5/19
EBER
HAR
TAL
LEN
1,43
8.70
287.
741,
150.
96A
S07
4955
01/2
5/19
GR
IFFI
NG
ENEV
IEVE
9,04
2.71
1,80
8.54
7,23
4.17
AS
0749
5601
/25/
19G
LOVE
RTO
NY
27,1
37.0
75,
427.
4121
,709
.66
AS
0749
5701
/25/
19M
ILLE
RTR
ILIN
DA
29,4
99.7
55,
899.
9523
,599
.80
AS
0749
5801
/25/
19R
OBI
NSO
NN
OR
MAN
5,64
9.47
1,12
9.89
4,51
9.58
AS
0749
5901
/25/
19ST
AFFO
RD
BEN
JAM
IN1,
171.
5023
4.30
937.
20A
S07
4960
01/2
5/19
STIG
ERS
JOSH
UA
30,5
20.9
230
,520
.92
AS
0749
6101
/25/
19TH
OM
AS
SHAR
ON
3,
915.
3478
3.07
3,13
2.27
AS
0749
6201
/25/
19W
HIT
TM
ELVI
N2,
689.
4353
7.89
2,15
1.54
AS
0749
6301
/25/
19W
OTE
NG
AYLE
N39
1.11
78.2
231
2.89
AS
0749
6401
/25/
19BE
TTS
SYM
ANTH
A 20
,000
.00
20,0
00.0
0A
SV
OID
& R
EIS
SU
E37
6,08
0.58
$
46,0
45.6
9$
33
0,03
4.89
$
TOTA
L
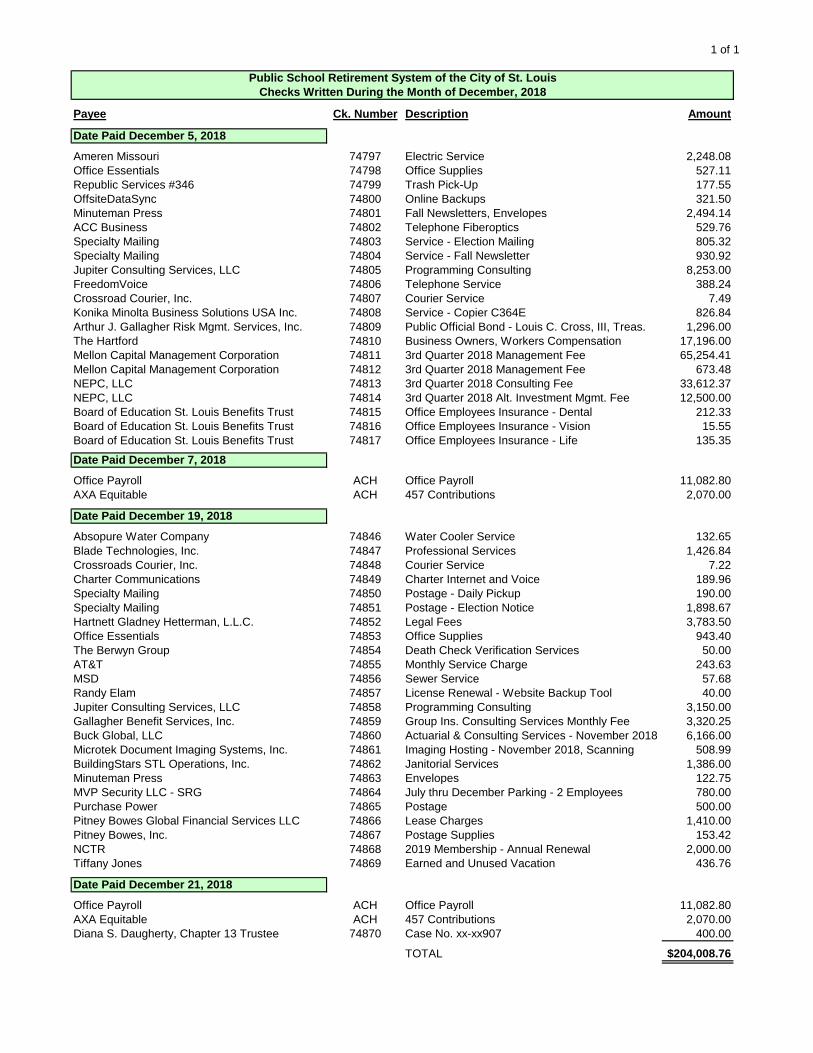
1 of 1
Payee Ck. Number Description Amount
Date Paid December 5, 2018
Ameren Missouri 74797 Electric Service 2,248.08Office Essentials 74798 Office Supplies 527.11Republic Services #346 74799 Trash Pick-Up 177.55OffsiteDataSync 74800 Online Backups 321.50Minuteman Press 74801 Fall Newsletters, Envelopes 2,494.14ACC Business 74802 Telephone Fiberoptics 529.76Specialty Mailing 74803 Service - Election Mailing 805.32Specialty Mailing 74804 Service - Fall Newsletter 930.92Jupiter Consulting Services, LLC 74805 Programming Consulting 8,253.00FreedomVoice 74806 Telephone Service 388.24Crossroad Courier, Inc. 74807 Courier Service 7.49Konika Minolta Business Solutions USA Inc. 74808 Service - Copier C364E 826.84Arthur J. Gallagher Risk Mgmt. Services, Inc. 74809 Public Official Bond - Louis C. Cross, III, Treas. 1,296.00The Hartford 74810 Business Owners, Workers Compensation 17,196.00Mellon Capital Management Corporation 74811 3rd Quarter 2018 Management Fee 65,254.41Mellon Capital Management Corporation 74812 3rd Quarter 2018 Management Fee 673.48NEPC, LLC 74813 3rd Quarter 2018 Consulting Fee 33,612.37NEPC, LLC 74814 3rd Quarter 2018 Alt. Investment Mgmt. Fee 12,500.00Board of Education St. Louis Benefits Trust 74815 Office Employees Insurance - Dental 212.33Board of Education St. Louis Benefits Trust 74816 Office Employees Insurance - Vision 15.55Board of Education St. Louis Benefits Trust 74817 Office Employees Insurance - Life 135.35
Date Paid December 7, 2018
Office Payroll ACH Office Payroll 11,082.80AXA Equitable ACH 457 Contributions 2,070.00
Date Paid December 19, 2018
Absopure Water Company 74846 Water Cooler Service 132.65Blade Technologies, Inc. 74847 Professional Services 1,426.84Crossroads Courier, Inc. 74848 Courier Service 7.22Charter Communications 74849 Charter Internet and Voice 189.96Specialty Mailing 74850 Postage - Daily Pickup 190.00Specialty Mailing 74851 Postage - Election Notice 1,898.67Hartnett Gladney Hetterman, L.L.C. 74852 Legal Fees 3,783.50Office Essentials 74853 Office Supplies 943.40The Berwyn Group 74854 Death Check Verification Services 50.00AT&T 74855 Monthly Service Charge 243.63MSD 74856 Sewer Service 57.68Randy Elam 74857 License Renewal - Website Backup Tool 40.00Jupiter Consulting Services, LLC 74858 Programming Consulting 3,150.00Gallagher Benefit Services, Inc. 74859 Group Ins. Consulting Services Monthly Fee 3,320.25Buck Global, LLC 74860 Actuarial & Consulting Services - November 2018 6,166.00Microtek Document Imaging Systems, Inc. 74861 Imaging Hosting - November 2018, Scanning 508.99BuildingStars STL Operations, Inc. 74862 Janitorial Services 1,386.00Minuteman Press 74863 Envelopes 122.75MVP Security LLC - SRG 74864 July thru December Parking - 2 Employees 780.00Purchase Power 74865 Postage 500.00Pitney Bowes Global Financial Services LLC 74866 Lease Charges 1,410.00Pitney Bowes, Inc. 74867 Postage Supplies 153.42NCTR 74868 2019 Membership - Annual Renewal 2,000.00Tiffany Jones 74869 Earned and Unused Vacation 436.76
Date Paid December 21, 2018
Office Payroll ACH Office Payroll 11,082.80AXA Equitable ACH 457 Contributions 2,070.00Diana S. Daugherty, Chapter 13 Trustee 74870 Case No. xx-xx907 400.00
TOTAL $204,008.76
Public School Retirement System of the City of St. LouisChecks Written During the Month of December, 2018
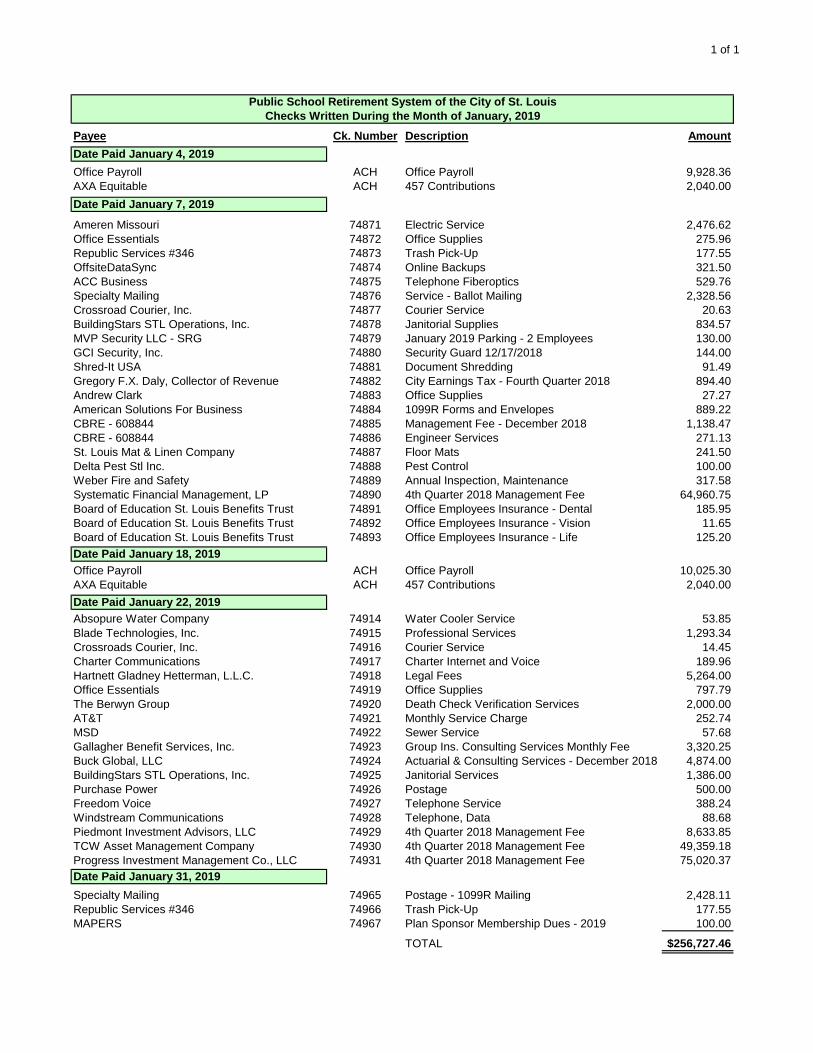
1 of 1
Payee Ck. Number Description AmountDate Paid January 4, 2019Office Payroll ACH Office Payroll 9,928.36AXA Equitable ACH 457 Contributions 2,040.00Date Paid January 7, 2019
Ameren Missouri 74871 Electric Service 2,476.62Office Essentials 74872 Office Supplies 275.96Republic Services #346 74873 Trash Pick-Up 177.55OffsiteDataSync 74874 Online Backups 321.50ACC Business 74875 Telephone Fiberoptics 529.76Specialty Mailing 74876 Service - Ballot Mailing 2,328.56Crossroad Courier, Inc. 74877 Courier Service 20.63BuildingStars STL Operations, Inc. 74878 Janitorial Supplies 834.57MVP Security LLC - SRG 74879 January 2019 Parking - 2 Employees 130.00GCI Security, Inc. 74880 Security Guard 12/17/2018 144.00Shred-It USA 74881 Document Shredding 91.49Gregory F.X. Daly, Collector of Revenue 74882 City Earnings Tax - Fourth Quarter 2018 894.40Andrew Clark 74883 Office Supplies 27.27American Solutions For Business 74884 1099R Forms and Envelopes 889.22CBRE - 608844 74885 Management Fee - December 2018 1,138.47CBRE - 608844 74886 Engineer Services 271.13St. Louis Mat & Linen Company 74887 Floor Mats 241.50Delta Pest Stl Inc. 74888 Pest Control 100.00Weber Fire and Safety 74889 Annual Inspection, Maintenance 317.58Systematic Financial Management, LP 74890 4th Quarter 2018 Management Fee 64,960.75Board of Education St. Louis Benefits Trust 74891 Office Employees Insurance - Dental 185.95Board of Education St. Louis Benefits Trust 74892 Office Employees Insurance - Vision 11.65Board of Education St. Louis Benefits Trust 74893 Office Employees Insurance - Life 125.20Date Paid January 18, 2019Office Payroll ACH Office Payroll 10,025.30AXA Equitable ACH 457 Contributions 2,040.00Date Paid January 22, 2019Absopure Water Company 74914 Water Cooler Service 53.85Blade Technologies, Inc. 74915 Professional Services 1,293.34Crossroads Courier, Inc. 74916 Courier Service 14.45Charter Communications 74917 Charter Internet and Voice 189.96Hartnett Gladney Hetterman, L.L.C. 74918 Legal Fees 5,264.00Office Essentials 74919 Office Supplies 797.79The Berwyn Group 74920 Death Check Verification Services 2,000.00AT&T 74921 Monthly Service Charge 252.74MSD 74922 Sewer Service 57.68Gallagher Benefit Services, Inc. 74923 Group Ins. Consulting Services Monthly Fee 3,320.25Buck Global, LLC 74924 Actuarial & Consulting Services - December 2018 4,874.00BuildingStars STL Operations, Inc. 74925 Janitorial Services 1,386.00Purchase Power 74926 Postage 500.00Freedom Voice 74927 Telephone Service 388.24Windstream Communications 74928 Telephone, Data 88.68Piedmont Investment Advisors, LLC 74929 4th Quarter 2018 Management Fee 8,633.85TCW Asset Management Company 74930 4th Quarter 2018 Management Fee 49,359.18Progress Investment Management Co., LLC 74931 4th Quarter 2018 Management Fee 75,020.37Date Paid January 31, 2019Specialty Mailing 74965 Postage - 1099R Mailing 2,428.11Republic Services #346 74966 Trash Pick-Up 177.55MAPERS 74967 Plan Sponsor Membership Dues - 2019 100.00
TOTAL $256,727.46
Public School Retirement System of the City of St. LouisChecks Written During the Month of January, 2019

TAB 3

No Meeting Minutes

TAB 4

January 18, 2019 Mr. Andrew Clark Executive Director PSRS of the City of St. Louis 3641 Olive Street, Suite 300 St. Louis, MO 63108-3601 RE: Public School Retirement System of the City of St. Louis - Section 105.665 Cost Statement – Updated from previous letter dated December 12, 2017 Dear Members of the Public School Retirement System of the City of St. Louis Board:
The purpose of this letter is to provide the Public School Retirement System of the City of St. Louis Board with an updated cost statement that may be required under the Missouri Revised Statute Section 105.665 in connection with the changes contained in CCS HCS SS SB 62 or other legislation containing the same provisions. This statement is updated for two reasons:
1. Reflect the census data and actuarial valuation results as of January 1, 2018
2. Reflect a comparison using the actuarial results as of January 1, 2018, but also using an estimated January 1, 2019 asset value reflecting assumed returns in 2018.
A summary of the changes in plan provisions contained in CCS HCS SS SB 62 that are subject to this statement are as follows:
1. Reduce the "Rule of 85" unreduced retirement from age plus service equal to 85 to 80 (i.e. change it to a "Rule of 80").
2. Change the percent of pay benefit multiplier from 2.00% of Average Final Compensation to 1.75% of Average Final Compensation for members hired on or after January 1, 2018.
3. For employees hired before January 1, 2018, change the employee contribution requirement from a flat 5.0% of compensation to 9.0% in 0.5% annual increments. For employees hired on or after January 1, 2018, the employee contribution requirement will be a flat 9.0% immediately upon entering the system.
4. The employer contribution rate will be set at a flat 16.0% of covered payroll for Plan Year 2018. This contribution rate shall be decreased by 0.5% in each subsequent Plan Year until reaching 9.0% of covered payroll. After this, the employer contribution rate will remain at 9.0% of covered payroll.
9401 James Avenue Suite 140 Bloomington, MN 55431

Public School Retirement System of the City of St. Louis Section 105.665 Cost Statement – Updated January 2019
2
Our updated cost statement, numbered to correspond with Section 105.665, follows below:
1. The level normal cost of plan benefits previously in effect would have been $26,057,446 or 9.80% of expected mid-year covered payroll, as presented in Exhibit 1.
2. The contribution amount for the Unfunded Actuarial Accrued Liability would have been $24,329,252 or 9.16% of expected mid-year covered payroll as presented in Exhibit 1. The amortization period used to determine this amount was 18 years.
3. The total required contribution amount from items one and two above is $50,386,698 or 18.96% of expected mid-year covered payroll.
4. The total contribution rate under the previous plan provisions as defined in item three above would have been paid by all of the employers in the Plan.
5. The plan's actuarial value of assets was $899,816,911 as of January 1, 2018, the market value of assets was $914,082,259, the actuarial accrued liability under the Entry Age Normal cost method would have been $1,249,241,347, and the funded ratio would have been 72.03%.
6. The total required pre-change contribution amount would have been $50,386,698, or 18.96% of expected mid-year covered payroll. This amount was determined assuming that the changes in the plan provisions were not effective with the January 1, 2018 actuarial valuation. The calculation of this amount is presented in Exhibit I. The total required post-change contribution amount, determined as of the January 1, 2018 valuation was $47,096,163, or 17.72% of expected mid-year covered payroll. This amount was determined assuming all applicable plan provisions and assumptions as indicated in the January 1, 2018 actuarial valuation.
7. A 15-year projection of annual plan costs and funded ratios is presented in Exhibit II. There are three different projection results shown: i) using the old plan provisions, ii) only reflecting changing the Rule of 85 to the Rule of 80, and iii) reflecting all plan changes contained in CCS HCS SS SB 62.
8. CCS HCS SS SB 62 mandates employer contributions as 16.0% in the first year of implementation, 15.5% in the second year, 15.0% in the third year, 14.5% in the fourth year, 14.0% in the fifth year, 13.5% in the sixth year, 13.0% in the seventh year, 12.5% in the eighth year, 12.0% in the ninth year, 11.5% in the tenth year, 11.0% in the eleventh year, 10.5% in the twelfth year, 10.0% in the thirteenth year, 9.5% in the fourteenth year, or 9.0% in the fifteenth year or any year thereafter.
9. The proposed plan changes will impair the ability of the plan to meet the obligations due to the employer contribution being lower than the actuarially determined contribution in years when the statutory employer contribution rate is lower than the actuarially determined contribution rate. The total amount of the shortfall of employer contributions through 2034 is projected to be $44,542,000.

Public School Retirement System of the City of St. Louis Section 105.665 Cost Statement – Updated January 2019
3
10. Exhibit III presents the three projections as above: i) using the old plan provisions, ii) only reflecting changing the Rule of 85 to the Rule of 80, and iii) reflecting all plan changes contained in CCS HCS SS SB 62, but with estimated January 1, 2019 asset values. The estimated asset value reflects actual market value as of November 30, 2018 and rolls forward to January 1, 2019 assuming a 0% return for December. Actual benefit payments and contributions in December were reflected in this calculation.
This exhibit displays the impact of a year with asset returns lower than the assumed 7.50% rate of return. For the projection period, we are now showing a shortfall of employer contributions through 2034 as $451,269,000 compared to the $44,542,000 above assuming a 7.50% return in 2018. In comparison, the projected funded ratio in 2034 under this scenario is 72.15% compared to the 92.05% assuming a 7.50% return in 2018.
11. The actuarial assumptions used in the January 1, 2018 actuarial valuation are presented in Exhibit IV. Any assumptions used for the projections that are not listed in Exhibit IV are included with the projection results in Exhibit II and Exhibit III.
12. The Actuary’s certification is below.
13. The actuarial funding method used in preparing the valuation along with the method applied in amortizing the Unfunded Actuarial Accrued Liability is described in Exhibit IV.
In preparing the actuarial valuation and this cost analysis, we have employed generally accepted actuarial methods and assumptions, in conjunction with employee data and financial information provided to us by the System, to determine a sound value for the System liability. The employee data has not been audited, but it has been reviewed and found to be consistent, both internally and with prior years' data. The validity of the cost analysis results is dependent upon the accuracy of the data and financial information provided.
In our opinion, the actuarial assumptions used are reasonable, taking into account the experience of the System and reasonable long-term expectations, and represent our best estimate of the anticipated long-term experience under the System. The actuary performs an analysis of System experience periodically and recommends changes if, in the opinion of the actuary, assumption changes are needed to more accurately reflect expected future experience. The Experience Study for the period January 1, 2011 to December 31, 2015 was prepared by Buck and approved by the Board for use beginning with the January 1, 2017 actuarial valuation and will remain in effect for valuation purposes until such time as the Board adopts revised assumptions. The next Experience Study will be based on the period from January 1, 2016 to December 31, 2020 and upon approval by the Board will be the basis of valuations performed from January 1, 2022 through January 1, 2026. A summary of all assumptions and methods used are as described in this report.
Where presented, references to “funded percent” and “unfunded accrued liability” typically are
measured on an actuarial value of assets basis. It should be noted that the same measurements using market value of assets would result in different funded ratios and unfunded accrued liabilities.

Public School Retirement System of the City of St. Louis Section 105.665 Cost Statement – Updated January 2019
4
Moreover, the funded ratio presented is appropriate for evaluating the need and level of future contributions but makes no assessment regarding the funded status of the plan if the plan were to settle (i.e. purchase annuities) for a portion or all of its liabilities.
Future contribution requirements may differ from those determined in the cost analysis because of:
(1) differences between actual experience and anticipated experience based on the assumptions;
(2) changes in actuarial assumptions or methods;
(3) changes in statutory provisions;
(4) differences between actuarially required contributions and actual contributions. Due to the limited scope of the assignment, we did not perform an analysis of the potential range of future contributions other than incorporating updated asset return information for 2018.
The undersigned meets the Qualification Standards of the American Academy of Actuaries to render the actuarial opinions contained herein, and is available to answer questions regarding this report.
I believe that the assumptions and methods used for these estimates are individually and in aggregate, reasonable and in combination represent a best estimate of anticipated experience under the plan. I believe that this report conforms with the requirements of the Missouri statutes, and where applicable, other federal and accounting laws, regulations and rules, as well as actuarial principles and practices in accordance with all Actuarial Standards of Practice (ASOPs).
Sincerely,
Troy Jaros, FSA, EA, MAAA, FCA Director, Retirement Actuary
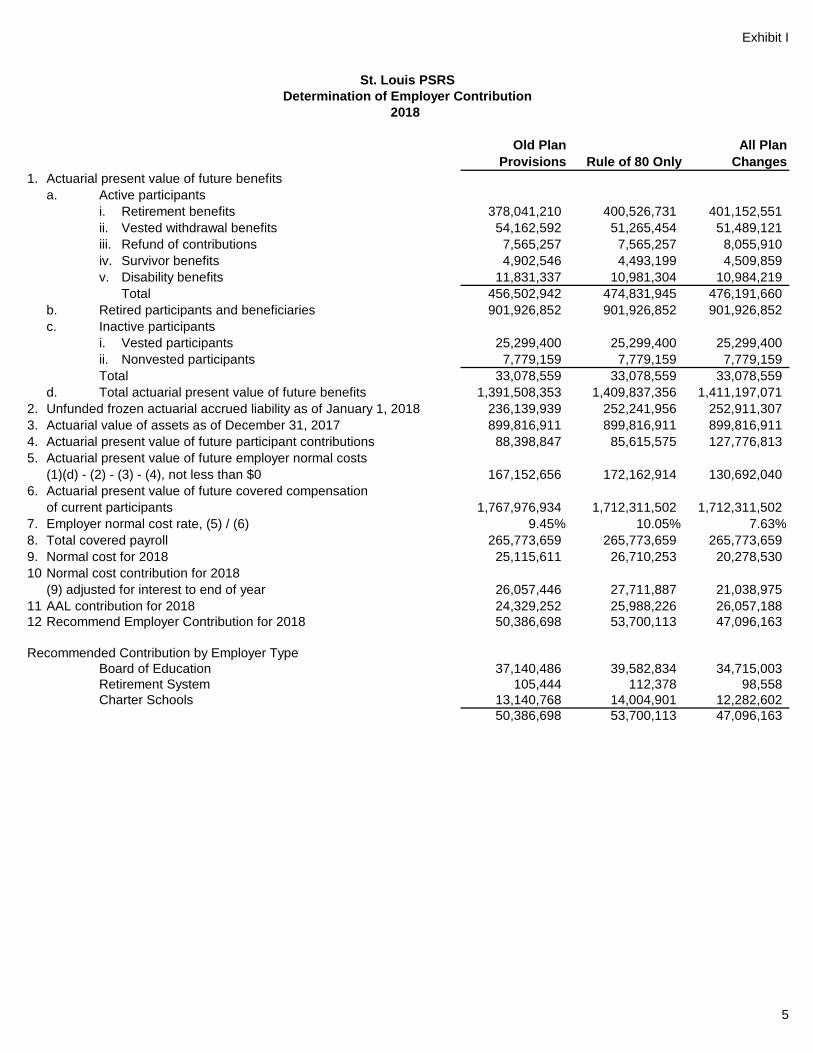
Exhibit I
Old Plan Provisions Rule of 80 Only
All Plan Changes
1. Actuarial present value of future benefitsa. Active participants
i. Retirement benefits 378,041,210 400,526,731 401,152,551 ii. Vested withdrawal benefits 54,162,592 51,265,454 51,489,121 iii. Refund of contributions 7,565,257 7,565,257 8,055,910 iv. Survivor benefits 4,902,546 4,493,199 4,509,859 v. Disability benefits 11,831,337 10,981,304 10,984,219
Total 456,502,942 474,831,945 476,191,660 b. Retired participants and beneficiaries 901,926,852 901,926,852 901,926,852 c. Inactive participants
i. Vested participants 25,299,400 25,299,400 25,299,400 ii. Nonvested participants 7,779,159 7,779,159 7,779,159 Total 33,078,559 33,078,559 33,078,559
d. Total actuarial present value of future benefits 1,391,508,353 1,409,837,356 1,411,197,071 2. Unfunded frozen actuarial accrued liability as of January 1, 2018 236,139,939 252,241,956 252,911,307 3. Actuarial value of assets as of December 31, 2017 899,816,911 899,816,911 899,816,911 4. Actuarial present value of future participant contributions 88,398,847 85,615,575 127,776,813 5. Actuarial present value of future employer normal costs
(1)(d) - (2) - (3) - (4), not less than $0 167,152,656 172,162,914 130,692,040 6. Actuarial present value of future covered compensation
of current participants 1,767,976,934 1,712,311,502 1,712,311,502 7. Employer normal cost rate, (5) / (6) 9.45% 10.05% 7.63%8. Total covered payroll 265,773,659 265,773,659 265,773,659 9. Normal cost for 2018 25,115,611 26,710,253 20,278,530 10.Normal cost contribution for 2018
(9) adjusted for interest to end of year 26,057,446 27,711,887 21,038,975 11.AAL contribution for 2018 24,329,252 25,988,226 26,057,188 12.Recommend Employer Contribution for 2018 50,386,698 53,700,113 47,096,163
Recommended Contribution by Employer TypeBoard of Education 37,140,486 39,582,834 34,715,003 Retirement System 105,444 112,378 98,558 Charter Schools 13,140,768 14,004,901 12,282,602
50,386,698 53,700,113 47,096,163
St. Louis PSRSDetermination of Employer Contribution
2018
5
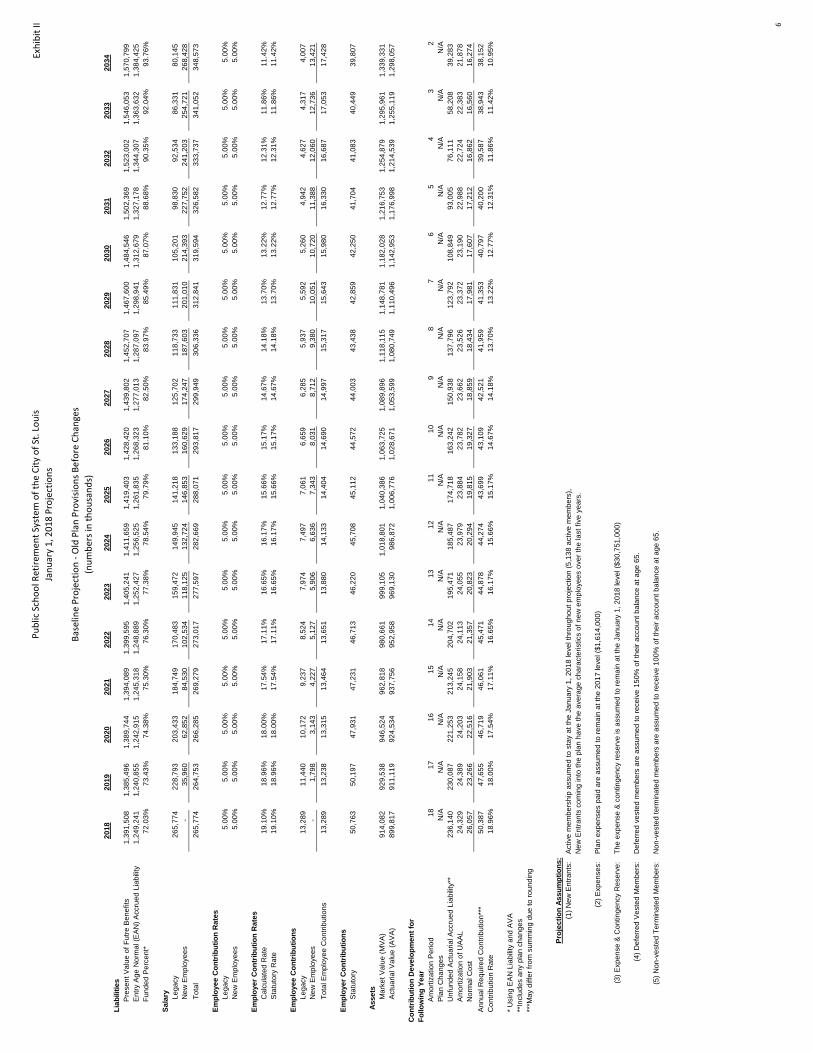
Pu
blic
Sch
oo
l Ret
irem
ent
Syst
em o
f th
e C
ity
of
St. L
ou
is
Jan
uar
y 1,
201
8 P
roje
ctio
ns
Bas
elin
e P
roje
ctio
n -
Old
Pla
n P
rovi
sio
ns
Be
fore
Ch
ange
s
(nu
mb
ers
in t
ho
usa
nd
s)
Exh
ibit
II
2018
2019
2020
2021
2022
2023
2024
2025
2026
2027
2028
2029
2030
2031
2032
2033
2034
Liab
ilitie
s
Pre
sent
Val
ue o
f Fut
re B
enef
its1,
391,
508
1,38
5,49
6
1,
389,
744
1,39
4,08
9
1,
399,
595
1,
405,
241
1,41
1,65
9
1,
419,
403
1,
428,
420
1,43
9,80
2
1,
452,
707
1,46
7,60
0
1,
484,
546
1,
502,
369
1,52
3,00
2
1,
546,
053
1,57
0,79
9
Ent
ry A
ge N
orm
al (E
AN
) Acc
rued
Lia
bilit
y1,
249,
241
1,24
0,85
5
1,
242,
915
1,24
5,31
8
1,
248,
889
1,
252,
427
1,25
6,52
5
1,
261,
835
1,
268,
323
1,27
7,01
3
1,
287,
097
1,29
8,94
1
1,
312,
679
1,
327,
178
1,34
4,30
7
1,
363,
632
1,38
4,42
5
Fun
ded
Per
cent
*72
.03%
73.4
3%74
.38%
75.3
0%76
.30%
77.3
8%78
.54%
79.7
9%81
.10%
82.5
0%83
.97%
85.4
9%87
.07%
88.6
8%90
.35%
92.0
4%93
.76%
Sala
ry
Leg
acy
265,
774
22
8,79
3
203,
433
18
4,74
9
170,
483
159,
472
14
9,94
5
141,
218
133,
188
12
5,70
2
118,
733
11
1,83
1
105,
201
98,8
30
92,5
34
86,3
31
80,1
45
N
ew E
mpl
oyee
s-
35
,960
62
,852
84
,530
10
2,53
4
11
8,12
5
132,
724
14
6,85
3
16
0,62
9
174,
247
18
7,60
3
201,
010
21
4,39
3
22
7,75
2
241,
203
25
4,72
1
268,
428
Tot
al26
5,77
4
264,
753
26
6,28
5
269,
279
27
3,01
7
27
7,59
7
282,
669
28
8,07
1
29
3,81
7
299,
949
30
6,33
6
312,
841
31
9,59
4
32
6,58
2
333,
737
34
1,05
2
348,
573
Empl
oyee
Con
trib
utio
n R
ates
L
egac
y5.
00%
5.00
%5.
00%
5.00
%5.
00%
5.00
%5.
00%
5.00
%5.
00%
5.00
%5.
00%
5.00
%5.
00%
5.00
%5.
00%
5.00
%5.
00%
N
ew E
mpl
oyee
s5.
00%
5.00
%5.
00%
5.00
%5.
00%
5.00
%5.
00%
5.00
%5.
00%
5.00
%5.
00%
5.00
%5.
00%
5.00
%5.
00%
5.00
%5.
00%
Empl
oyer
Con
trib
utio
n R
ates
C
alcu
late
d R
ate
19.1
0%18
.96%
18.0
0%17
.54%
17.1
1%16
.65%
16.1
7%15
.66%
15.1
7%14
.67%
14.1
8%13
.70%
13.2
2%12
.77%
12.3
1%11
.86%
11.4
2%
Sta
tuto
ry R
ate
19.1
0%18
.96%
18.0
0%17
.54%
17.1
1%16
.65%
16.1
7%15
.66%
15.1
7%14
.67%
14.1
8%13
.70%
13.2
2%12
.77%
12.3
1%11
.86%
11.4
2%
Empl
oyee
Con
trib
utio
ns
Leg
acy
13,2
89
11,4
40
10,1
72
9,23
7
8,
524
7,97
4
7,
497
7,06
1
6,
659
6,28
5
5,
937
5,59
2
5,
260
4,94
2
4,
627
4,31
7
4,
007
N
ew E
mpl
oyee
s-
1,
798
3,14
3
4,
227
5,12
7
5,
906
6,63
6
7,
343
8,03
1
8,
712
9,38
0
10
,051
10
,720
11
,388
12
,060
12
,736
13
,421
Tot
al E
mpl
oyee
Con
tribu
tions
13,2
89
13,2
38
13,3
15
13,4
64
13,6
51
13,8
80
14,1
33
14,4
04
14,6
90
14,9
97
15,3
17
15,6
43
15,9
80
16,3
30
16,6
87
17,0
53
17,4
28
Empl
oyer
Con
trib
utio
ns
Sta
tuto
ry50
,763
50
,197
47
,931
47
,231
46
,713
46
,220
45
,708
45
,112
44
,572
44
,003
43
,438
42
,859
42
,250
41
,704
41
,083
40
,449
39
,807
Asse
ts
Mar
ket V
alue
(MV
A)
914,
082
92
9,53
8
946,
524
96
2,81
8
980,
661
999,
105
1,
018,
801
1,04
0,38
6
1,06
3,72
5
1,
089,
896
1,11
8,11
5
1,
148,
781
1,18
2,02
8
1,21
6,75
3
1,
254,
879
1,29
5,96
1
1,
339,
331
A
ctua
rial V
alue
(AV
A)
899,
817
91
1,11
9
924,
534
93
7,75
6
952,
958
969,
130
98
6,87
2
1,00
6,77
6
1,02
8,67
1
1,
053,
599
1,08
0,74
9
1,
110,
496
1,14
2,95
3
1,17
6,99
8
1,
214,
539
1,25
5,11
9
1,
298,
057
A
mor
tizat
ion
Per
iod
1817
1615
1413
1211
109
87
65
43
2
Pla
n C
hang
esN
/AN
/AN
/AN
/AN
/AN
/AN
/AN
/AN
/AN
/AN
/AN
/AN
/AN
/AN
/AN
/AN
/A
Unf
unde
d A
ctua
rial A
ccru
ed L
iabi
lity*
*23
6,14
0
230,
087
22
1,25
3
213,
245
20
4,70
2
19
5,47
1
185,
487
17
4,71
8
16
3,24
2
150,
938
13
7,79
6
123,
792
10
8,84
9
93
,005
76
,111
58
,208
39
,283
Am
ortiz
atio
n of
UA
AL
24,3
29
24,3
89
24,2
03
24,1
58
24,1
13
24,0
55
23,9
79
23,8
84
23,7
82
23,6
62
23,5
26
23,3
72
23,1
90
22,9
88
22,7
24
22,3
83
21,8
78
N
orm
al C
ost
26,0
57
23,2
66
22,5
16
21,9
03
21,3
57
20,8
23
20,2
94
19,8
15
19,3
27
18,8
59
18,4
34
17,9
81
17,6
07
17,2
12
16,8
62
16,5
60
16,2
74
Ann
ual R
equi
red
Con
tribu
tion*
**50
,387
47
,655
46
,719
46
,061
45
,471
44
,878
44
,274
43
,699
43
,109
42
,521
41
,959
41
,353
40
,797
40
,200
39
,587
38
,943
38
,152
C
ontri
butio
n R
ate
18.9
6%18
.00%
17.5
4%17
.11%
16.6
5%16
.17%
15.6
6%15
.17%
14.6
7%14
.18%
13.7
0%13
.22%
12.7
7%12
.31%
11.8
6%11
.42%
10.9
5%
* U
sing
EA
N L
iabi
lity
and
AV
A**
Incl
udes
any
pla
n ch
ange
s**
*May
diff
er fr
om s
umm
ing
due
to ro
undi
ng
Proj
ectio
n As
sum
ptio
ns:
(1) N
ew E
ntra
nts:
A
ctiv
e m
embe
rshi
p as
sum
ed to
sta
y at
the
Janu
ary
1, 2
018
leve
l thr
ough
out p
roje
ctio
n (5
,138
act
ive
mem
bers
),N
ew E
ntra
nts
com
ing
into
the
plan
hav
e th
e av
erag
e ch
arac
teris
tics
of n
ew e
mpl
oyee
s ov
er th
e la
st fi
ve y
ears
.
(2) E
xpen
ses:
P
lan
expe
nses
pai
d ar
e as
sum
ed to
rem
ain
at th
e 20
17 le
vel (
$1,6
14,0
00)
(3) E
xpen
se &
Con
tinge
ncy
Res
erve
: Th
e ex
pens
e &
con
tinge
ncy
rese
rve
is a
ssum
ed to
rem
ain
at th
e Ja
nuar
y 1,
201
8 le
vel (
$30,
751,
000)
(4) D
efer
red
Ves
ted
Mem
bers
: D
efer
red
vest
ed m
embe
rs a
re a
ssum
ed to
rece
ive
150%
of t
heir
acco
unt b
alan
ce a
t age
65.
(5) N
on-v
este
d Te
rmin
ated
Mem
bers
: N
on-v
este
d te
rmin
ated
mem
bers
are
ass
umed
to re
ceiv
e 10
0% o
f the
ir ac
coun
t bal
ance
at a
ge 6
5.
Con
trib
utio
n D
evel
opm
ent f
or
Follo
win
g Ye
ar
6

Pu
blic
Sch
oo
l Ret
irem
en
t Sy
stem
of
the
Cit
y o
f St
. Lo
uis
Jan
uar
y 1,
201
8 P
roje
ctio
ns
Ru
le o
f 80
Pro
ject
ion
- R
ule
of
85 c
han
ged
to
Ru
le o
f 80
(nu
mb
ers
in t
ho
usa
nd
s)
Exh
ibit
II
2018
2019
2020
2021
2022
2023
2024
2025
2026
2027
2028
2029
2030
2031
2032
2033
2034
Liab
ilitie
s
Pre
sent
Val
ue o
f Fut
re B
enef
its1,
409,
837
1,40
5,70
7
1,
411,
498
1,41
7,19
9
1,
423,
870
1,
430,
512
1,43
7,76
7
1,
446,
258
1,
455,
919
1,46
7,74
9
1,
480,
814
1,49
5,69
6
1,
512,
468
1,
529,
987
1,55
0,21
8
1,
572,
773
1,59
7,03
9
Ent
ry A
ge N
orm
al (E
AN
) Acc
rued
Lia
bilit
y1,
265,
343
1,25
8,95
1
1,
262,
661
1,26
6,49
8
1,
271,
299
1,
275,
846
1,28
0,76
0
1,
286,
804
1,
293,
886
1,30
2,95
5
1,
313,
095
1,32
4,83
5
1,
338,
305
1,
352,
389
1,36
9,03
2
1,
387,
743
1,40
7,93
1
Fun
ded
Per
cent
*71
.11%
72.3
5%73
.40%
74.4
2%75
.52%
76.6
9%77
.94%
79.2
7%80
.67%
82.1
4%83
.67%
85.2
6%86
.90%
88.5
8%90
.31%
92.0
8%93
.88%
Sala
ry
Leg
acy
265,
774
22
7,84
1
201,
848
18
2,54
3
167,
773
156,
246
14
6,29
4
137,
238
128,
729
12
0,64
8
113,
059
10
5,74
8
98,7
79
92,0
45
85,5
73
79,1
53
72,8
36
N
ew E
mpl
oyee
s-
36,5
35
63,8
27
85,8
89
104,
194
120,
080
13
4,95
6
149,
314
163,
404
17
7,34
2
191,
037
20
4,66
6
218,
236
231,
792
24
5,34
0
259,
036
27
2,87
4
T
otal
265,
774
26
4,37
6
265,
675
26
8,43
2
271,
967
276,
326
28
1,25
0
286,
552
292,
133
29
7,99
0
304,
096
31
0,41
4
317,
015
323,
837
33
0,91
3
338,
189
34
5,71
0
Empl
oyee
Con
trib
utio
n R
ates
L
egac
y5.
00%
5.00
%5.
00%
5.00
%5.
00%
5.00
%5.
00%
5.00
%5.
00%
5.00
%5.
00%
5.00
%5.
00%
5.00
%5.
00%
5.00
%5.
00%
N
ew E
mpl
oyee
s5.
00%
5.00
%5.
00%
5.00
%5.
00%
5.00
%5.
00%
5.00
%5.
00%
5.00
%5.
00%
5.00
%5.
00%
5.00
%5.
00%
5.00
%5.
00%
Empl
oyer
Con
trib
utio
n R
ates
C
alcu
late
d R
ate
19.1
0%20
.21%
19.3
2%18
.84%
18.3
7%17
.87%
17.3
5%16
.82%
16.2
8%15
.75%
15.2
3%14
.72%
14.2
3%13
.75%
13.2
7%12
.80%
12.3
3%
Sta
tuto
ry R
ate
19.1
0%20
.21%
19.3
2%18
.84%
18.3
7%17
.87%
17.3
5%16
.82%
16.2
8%15
.75%
15.2
3%14
.72%
14.2
3%13
.75%
13.2
7%12
.80%
12.3
3%
Empl
oyee
Con
trib
utio
ns
Leg
acy
13,2
89
11
,392
10
,092
9,
127
8,38
9
7,
812
7,31
5
6,
862
6,43
6
6,
032
5,65
3
5,
287
4,93
9
4,
602
4,27
9
3,
958
3,64
2
New
Em
ploy
ees
-
1,
827
3,19
1
4,
294
5,21
0
6,
004
6,74
8
7,
466
8,17
0
8,
867
9,55
2
10
,233
10
,912
11
,590
12
,267
12
,952
13
,644
Tot
al E
mpl
oyee
Con
tribu
tions
13,2
89
13
,219
13
,283
13
,421
13
,599
13
,816
14
,063
14
,328
14
,606
14
,899
15
,205
15
,520
15
,851
16
,192
16
,546
16
,910
17
,286
Empl
oyer
Con
trib
utio
ns
Sta
tuto
ry50
,763
53,4
31
51,3
28
50,5
73
49,9
60
49,3
79
48,7
97
48,1
98
47,5
59
46,9
33
46,3
14
45,6
93
45,1
11
44,5
28
43,9
12
43,2
88
42,6
26
Asse
ts
Mar
ket V
alue
(MV
A)
914,
082
92
9,27
6
948,
775
96
7,61
3
987,
846
1,00
8,47
7
1,
030,
170
1,05
3,66
2
1,07
8,82
6
1,
106,
566
1,13
6,03
5
1,
167,
811
1,20
2,03
6
1,23
7,69
2
1,
276,
716
1,31
8,65
7
1,
363,
002
A
ctua
rial V
alue
(AV
A)
899,
817
91
0,85
8
926,
785
94
2,55
2
960,
143
978,
502
99
8,24
1
1,02
0,05
3
1,04
3,77
2
1,
070,
269
1,09
8,66
9
1,
129,
526
1,16
2,96
1
1,19
7,93
8
1,
236,
377
1,27
7,81
5
1,
321,
727
A
mor
tizat
ion
Per
iod
1817
1615
1413
1211
109
87
65
43
2
Pla
n C
hang
es16
,102
N/A
N/A
N/A
N/A
N/A
N/A
N/A
N/A
N/A
N/A
N/A
N/A
N/A
N/A
N/A
N/A
U
nfun
ded
Act
uaria
l Acc
rued
Lia
bilit
y**
252,
242
24
9,11
1
239,
914
23
1,25
5
221,
977
211,
937
20
1,11
8
189,
476
176,
990
16
3,65
2
149,
430
13
4,26
4
118,
129
100,
962
82
,666
63
,274
42
,727
Am
ortiz
atio
n of
UA
AL
25,9
88
26
,406
26
,244
26
,198
26
,148
26
,082
26
,000
25
,901
25
,785
25
,655
25
,512
25
,349
25
,167
24
,954
24
,681
24
,331
23
,796
Nor
mal
Cos
t27
,712
24,6
59
23,8
15
23,1
15
22,4
60
21,8
74
21,3
01
20,7
51
20,2
16
19,7
25
19,2
46
18,8
08
18,4
19
18,0
09
17,6
81
17,3
68
17,1
09
Ann
ual R
equi
red
Con
tribu
tion*
**53
,700
51,0
64
50,0
60
49,3
14
48,6
09
47,9
56
47,3
01
46,6
52
46,0
01
45,3
80
44,7
57
44,1
57
43,5
85
42,9
63
42,3
62
41,6
99
40,9
05
Con
tribu
tion
Rat
e20
.21%
19.3
2%18
.84%
18.3
7%17
.87%
17.3
5%16
.82%
16.2
8%15
.75%
15.2
3%14
.72%
14.2
3%13
.75%
13.2
7%12
.80%
12.3
3%11
.83%
* U
sing
EA
N L
iabi
lity
and
AV
A**
Incl
udes
any
pla
n ch
ange
s**
*May
diff
er fr
om s
umm
ing
due
to ro
undi
ng
Proj
ectio
n As
sum
ptio
ns:
(1) N
ew E
ntra
nts:
A
ctiv
e m
embe
rshi
p as
sum
ed to
sta
y at
the
Janu
ary
1, 2
018
leve
l thr
ough
out p
roje
ctio
n (5
,138
act
ive
mem
bers
),N
ew E
ntra
nts
com
ing
into
the
plan
hav
e th
e av
erag
e ch
arac
teris
tics
of n
ew e
mpl
oyee
s ov
er th
e la
st fi
ve y
ears
.
(2) E
xpen
ses:
P
lan
expe
nses
pai
d ar
e as
sum
ed to
rem
ain
at th
e 20
17 le
vel (
$1,6
14,0
00)
(3) E
xpen
se &
Con
tinge
ncy
Res
erve
: Th
e ex
pens
e &
con
tinge
ncy
rese
rve
is a
ssum
ed to
rem
ain
at th
e Ja
nuar
y 1,
201
8 le
vel (
$30,
751,
000)
(4) D
efer
red
Ves
ted
Mem
bers
: D
efer
red
vest
ed m
embe
rs a
re a
ssum
ed to
rece
ive
150%
of t
heir
acco
unt b
alan
ce a
t age
65.
(5) N
on-v
este
d Te
rmin
ated
Mem
bers
: N
on-v
este
d te
rmin
ated
mem
bers
are
ass
umed
to re
ceiv
e 10
0% o
f the
ir ac
coun
t bal
ance
at a
ge 6
5.
Con
trib
utio
n D
evel
opm
ent f
or
Follo
win
g Ye
ar
7

Pu
blic
Sch
oo
l Ret
irem
ent
Syst
em o
f th
e C
ity
of
St. L
ou
is
Jan
uar
y 1
, 20
18
Pro
ject
ion
s
Pro
po
sed
Pla
n P
roje
ctio
n -
All
Ch
ange
s R
efle
cted
(R
ule
of
80
, 1.7
5%
Mu
ltip
lier,
an
d E
mp
loye
e an
d E
mp
loye
r C
on
trib
uti
on
s)
(nu
mb
ers
in t
ho
usa
nd
s)
Exh
ibit
II
2018
2019
2020
2021
2022
2023
2024
2025
2026
2027
2028
2029
2030
2031
2032
2033
2034
Liab
ilitie
s
Pre
sent
Val
ue o
f Fut
re B
enef
its1,
411,
197
1,40
6,75
5
1,
412,
059
1,41
6,97
5
1,
422,
574
1,42
7,65
3
1,
433,
300
1,43
9,97
2
1,
447,
656
1,45
7,40
5
1,
468,
196
1,48
0,52
4
1,
494,
595
1,50
9,10
1
1,
526,
142
1,54
5,24
4
1,
565,
781
E
ntry
Age
Nor
mal
(EAN
) Acc
rued
Lia
bilit
y1,
266,
013
1,25
9,26
4
1,
262,
421
1,26
5,39
6
1,
268,
972
1,27
1,87
0
1,
275,
027
1,27
9,17
4
1,
284,
213
1,29
1,07
5
1,
298,
808
1,30
7,92
8
1,
318,
573
1,32
9,58
6
1,
342,
922
1,35
8,05
9
1,
374,
392
F
unde
d Pe
rcen
t*71
.07%
72.4
4%72
.93%
73.5
8%74
.38%
75.3
1%76
.39%
77.6
0%78
.95%
80.3
9%81
.89%
83.4
6%85
.08%
86.7
6%88
.48%
90.2
5%92
.05%
Sala
ry
Leg
acy
265,
774
22
7,84
1
201,
848
18
2,54
3
167,
773
15
6,24
6
146,
294
13
7,23
8
128,
729
12
0,64
8
113,
059
10
5,74
8
98,7
79
92,0
45
85,5
73
79,1
53
72,8
36
N
ew E
mpl
oyee
s-
36
,535
63
,827
85
,889
10
4,19
4
120,
080
13
4,95
6
149,
314
16
3,40
4
177,
342
19
1,03
7
204,
666
21
8,23
6
231,
792
24
5,34
0
259,
036
27
2,87
4
T
otal
265,
774
26
4,37
6
265,
675
26
8,43
2
271,
967
27
6,32
6
281,
250
28
6,55
2
292,
133
29
7,99
0
304,
096
31
0,41
4
317,
015
32
3,83
7
330,
913
33
8,18
9
345,
710
Empl
oyee
Con
trib
utio
n R
ates
L
egac
y5.
50%
6.00
%6.
50%
7.00
%7.
50%
8.00
%8.
50%
9.00
%9.
00%
9.00
%9.
00%
9.00
%9.
00%
9.00
%9.
00%
9.00
%9.
00%
N
ew E
mpl
oyee
s9.
00%
9.00
%9.
00%
9.00
%9.
00%
9.00
%9.
00%
9.00
%9.
00%
9.00
%9.
00%
9.00
%9.
00%
9.00
%9.
00%
9.00
%9.
00%
Empl
oyer
Con
trib
utio
n R
ates
C
alcu
late
d R
ate
19.1
0%17
.72%
16.3
6%15
.85%
15.3
2%14
.80%
14.2
6%13
.73%
13.2
1%12
.69%
12.2
1%11
.75%
11.3
1%10
.92%
10.5
9%10
.35%
10.2
8%
Sta
tuto
ry R
ate
19.1
0%16
.00%
15.5
0%15
.00%
14.5
0%14
.00%
13.5
0%13
.00%
12.5
0%12
.00%
11.5
0%11
.00%
10.5
0%10
.00%
9.50
%9.
00%
9.00
%
Sho
rtfal
l in
Stat
utor
y R
ate
0.00
%-1
.72%
-0.8
6%-0
.85%
-0.8
2%-0
.80%
-0.7
6%-0
.73%
-0.7
1%-0
.69%
-0.7
1%-0
.75%
-0.8
1%-0
.92%
-1.0
9%-1
.35%
-1.2
8%
Empl
oyee
Con
trib
utio
ns
Leg
acy
14,6
18
13
,670
13
,120
12
,778
12
,583
12
,500
12,4
35
12
,351
11
,586
10,8
58
10
,175
9,51
7
8,
890
8,28
4
7,
702
7,12
4
6,
555
N
ew E
mpl
oyee
s-
3,
288
5,74
4
7,
730
9,37
7
10
,807
12,1
46
13
,438
14
,706
15,9
61
17
,193
18,4
20
19,6
41
20,8
61
22,0
81
23,3
13
24,5
59
T
otal
Em
ploy
ee C
ontri
butio
ns14
,618
16,9
58
18,8
64
20,5
08
21,9
60
23,3
07
24
,581
25,7
89
26,2
92
26
,819
27,3
68
27
,937
28
,531
29
,145
29
,783
30
,437
31
,114
Empl
oyer
Con
trib
utio
ns
Cal
cula
ted
50,7
63
46
,847
43
,464
42
,546
41
,665
40
,896
40,1
06
39
,344
38
,591
37,8
15
37
,130
36,4
74
35,8
54
35,3
63
35,0
44
35,0
03
35,5
39
S
tatu
tory
50,7
63
42
,300
41
,180
40
,265
39
,435
38
,686
37,9
69
37
,252
36
,517
35,7
59
34
,971
34,1
46
33,2
87
32,3
84
31,4
37
30,4
37
31,1
14
S
hortf
all i
n St
atut
ory
Con
tribu
tion
-
(4,5
47)
(2,2
84)
(2,2
81)
(2,2
30)
(2
,210
)
(2
,137
)
(2
,092
)
(2,0
74)
(2,0
56)
(2,1
59)
(2,3
28)
(2,5
67)
(2
,979
)
(3
,607
)
(4
,566
)
(4
,425
)
Cum
ulat
ive
Shor
tfall
Amou
nt-
(4
,547
)
(6
,831
)
(9
,112
)
(1
1,34
2)
(13,
552)
(1
5,68
9)
(17,
781)
(1
9,85
5)
(21,
911)
(2
4,07
0)
(26,
398)
(2
8,96
5)
(31,
944)
(3
5,55
1)
(40,
117)
(4
4,54
2)
Ass
ets
M
arke
t Val
ue (M
VA)
914,
082
93
0,58
7
942,
656
95
6,09
5
971,
596
98
7,88
0
1,00
5,88
8
1,
026,
306
1,04
8,99
6
1,
074,
176
1,10
0,93
8
1,
129,
827
1,16
0,97
3
1,
193,
254
1,22
8,58
6
1,
266,
472
1,30
6,34
2
Act
uaria
l Val
ue (A
VA)
899,
817
91
2,16
9
920,
666
93
1,03
4
943,
892
95
7,90
5
973,
959
99
2,69
7
1,01
3,94
2
1,
037,
879
1,06
3,57
3
1,
091,
543
1,12
1,89
8
1,
153,
499
1,18
8,24
7
1,
225,
630
1,26
5,06
7
A
mor
tizat
ion
Perio
d18
1716
1514
1312
1110
98
76
54
32
P
lan
Cha
nges
16,7
71
N
/AN
/AN
/AN
/AN
/AN
/AN
/AN
/AN
/AN
/AN
/AN
/AN
/AN
/AN
/AN
/A
Unf
unde
d Ac
tuar
ial A
ccru
ed L
iabi
lity*
*25
2,91
1
242,
916
23
6,96
7
230,
325
22
2,91
7
214,
702
20
5,57
5
195,
511
18
4,44
3
172,
343
15
9,21
7
145,
046
12
9,78
7
113,
460
96
,061
77
,591
58
,063
Am
ortiz
atio
n of
UAA
L26
,057
25,7
49
25,9
22
26,0
93
26,2
59
26,4
22
26
,576
26,7
26
26,8
71
27
,018
27,1
83
27
,385
27
,651
28
,043
28
,681
29
,837
32
,337
Nor
mal
Cos
t21
,039
17,5
00
16,1
80
15,0
39
13,9
95
12,9
87
12
,051
11,1
19
10,2
14
9,
368
8,55
0
7,
729
6,97
3
6,
249
5,56
2
4,
912
4,26
8
An
nual
Req
uire
d C
ontri
butio
n***
47,0
96
43
,249
42
,102
41
,132
40
,254
39
,409
38,6
27
37
,845
37
,085
36,3
85
35
,733
35,1
14
34,6
23
34,2
92
34,2
42
34,7
49
36,6
05
Con
tribu
tion
Rat
e17
.72%
16.3
6%15
.85%
15.3
2%14
.80%
14.2
6%13
.73%
13.2
1%12
.69%
12.2
1%11
.75%
11.3
1%10
.92%
10.5
9%10
.35%
10.2
8%10
.59%
* Usi
ng E
AN L
iabi
lity
and
AVA
**In
clud
es a
ny p
lan
chan
ges
***M
ay d
iffer
from
sum
min
g du
e to
roun
ding
Proj
ectio
n A
ssum
ptio
ns:
(1) N
ew E
ntra
nts:
Ac
tive
mem
bers
hip
assu
med
to s
tay
at th
e Ja
nuar
y 1,
201
8 le
vel t
hrou
ghou
t pro
ject
ion
(5,1
38 a
ctiv
e m
embe
rs),
New
Ent
rant
s co
min
g in
to th
e pl
an h
ave
the
aver
age
char
acte
ristic
s of
new
em
ploy
ees
over
the
last
five
yea
rs.
(2) E
xpen
ses:
Pl
an e
xpen
ses
paid
are
ass
umed
to re
mai
n at
the
2017
leve
l ($1
,614
,000
)
(3) E
xpen
se &
Con
tinge
ncy
Res
erve
: Th
e ex
pens
e &
cont
inge
ncy
rese
rve
is a
ssum
ed to
rem
ain
at th
e Ja
nuar
y 1,
201
8 le
vel (
$30,
751,
000)
(4) D
efer
red
Vest
ed M
embe
rs:
Def
erre
d ve
sted
mem
bers
are
ass
umed
to re
ceiv
e 15
0% o
f the
ir ac
coun
t bal
ance
at a
ge 6
5.
(5) N
on-v
este
d Te
rmin
ated
Mem
bers
: N
on-v
este
d te
rmin
ated
mem
bers
are
ass
umed
to re
ceiv
e 10
0% o
f the
ir ac
coun
t bal
ance
at a
ge 6
5.
Con
trib
utio
n D
evel
opm
ent f
or
Follo
win
g Ye
ar
8
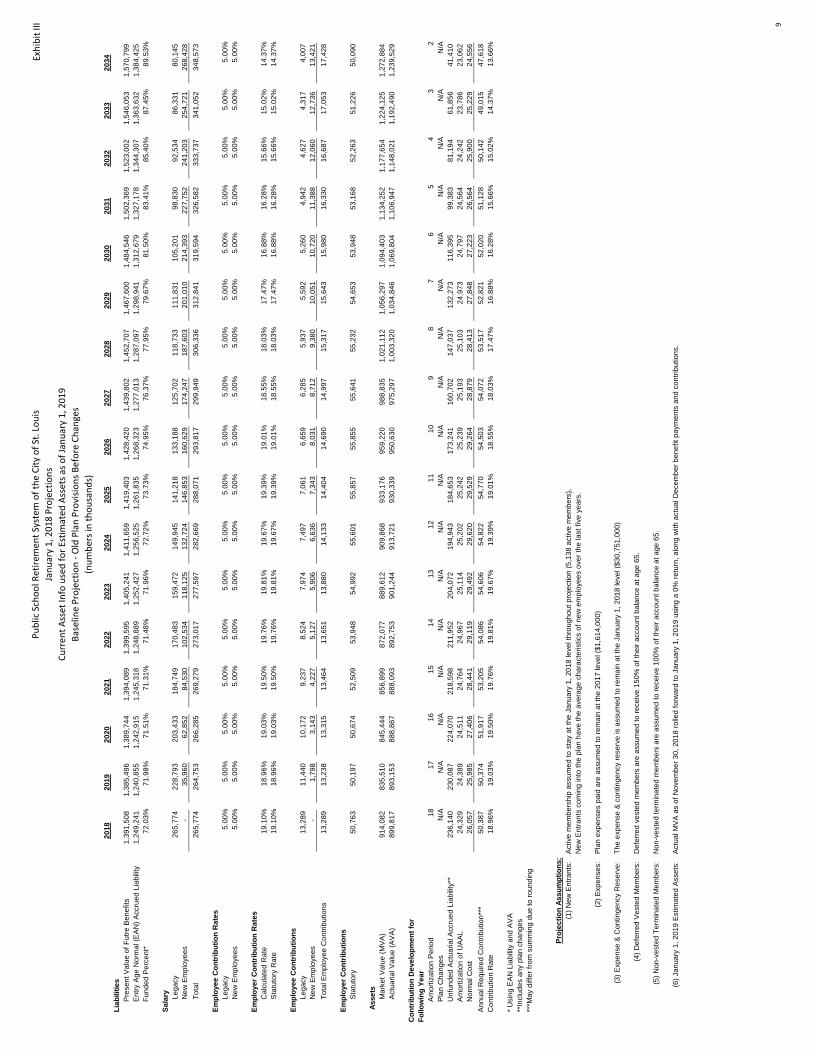
Pu
blic
Sch
oo
l Ret
irem
ent
Syst
em o
f th
e C
ity
of
St. L
ou
is
Jan
uar
y 1,
201
8 P
roje
ctio
ns
Cu
rren
t A
sset
Info
use
d f
or
Esti
mat
ed A
sset
s as
of
Jan
uar
y 1,
201
9
Bas
elin
e P
roje
ctio
n -
Old
Pla
n P
rovi
sio
ns
Be
fore
Ch
ange
s
(nu
mb
ers
in t
ho
usa
nd
s)
Exh
ibit
III
2018
2019
2020
2021
2022
2023
2024
2025
2026
2027
2028
2029
2030
2031
2032
2033
2034
Liab
ilitie
s
Pre
sent
Val
ue o
f Fut
re B
enef
its1,
391,
508
1,38
5,49
6
1,
389,
744
1,39
4,08
9
1,
399,
595
1,
405,
241
1,41
1,65
9
1,
419,
403
1,
428,
420
1,43
9,80
2
1,
452,
707
1,46
7,60
0
1,
484,
546
1,
502,
369
1,52
3,00
2
1,
546,
053
1,57
0,79
9
Ent
ry A
ge N
orm
al (E
AN
) Acc
rued
Lia
bilit
y1,
249,
241
1,24
0,85
5
1,
242,
915
1,24
5,31
8
1,
248,
889
1,
252,
427
1,25
6,52
5
1,
261,
835
1,
268,
323
1,27
7,01
3
1,
287,
097
1,29
8,94
1
1,
312,
679
1,
327,
178
1,34
4,30
7
1,
363,
632
1,38
4,42
5
Fun
ded
Per
cent
*72
.03%
71.9
8%71
.51%
71.3
1%71
.48%
71.9
6%72
.72%
73.7
3%74
.95%
76.3
7%77
.95%
79.6
7%81
.50%
83.4
1%85
.40%
87.4
5%89
.53%
Sala
ry
Leg
acy
265,
774
22
8,79
3
203,
433
18
4,74
9
170,
483
159,
472
14
9,94
5
141,
218
133,
188
12
5,70
2
118,
733
11
1,83
1
105,
201
98,8
30
92,5
34
86,3
31
80,1
45
N
ew E
mpl
oyee
s-
35
,960
62
,852
84
,530
10
2,53
4
11
8,12
5
132,
724
14
6,85
3
16
0,62
9
174,
247
18
7,60
3
201,
010
21
4,39
3
22
7,75
2
241,
203
25
4,72
1
268,
428
Tot
al26
5,77
4
264,
753
26
6,28
5
269,
279
27
3,01
7
27
7,59
7
282,
669
28
8,07
1
29
3,81
7
299,
949
30
6,33
6
312,
841
31
9,59
4
32
6,58
2
333,
737
34
1,05
2
348,
573
Empl
oyee
Con
trib
utio
n R
ates
L
egac
y5.
00%
5.00
%5.
00%
5.00
%5.
00%
5.00
%5.
00%
5.00
%5.
00%
5.00
%5.
00%
5.00
%5.
00%
5.00
%5.
00%
5.00
%5.
00%
N
ew E
mpl
oyee
s5.
00%
5.00
%5.
00%
5.00
%5.
00%
5.00
%5.
00%
5.00
%5.
00%
5.00
%5.
00%
5.00
%5.
00%
5.00
%5.
00%
5.00
%5.
00%
Empl
oyer
Con
trib
utio
n R
ates
C
alcu
late
d R
ate
19.1
0%18
.96%
19.0
3%19
.50%
19.7
6%19
.81%
19.6
7%19
.39%
19.0
1%18
.55%
18.0
3%17
.47%
16.8
8%16
.28%
15.6
6%15
.02%
14.3
7%
Sta
tuto
ry R
ate
19.1
0%18
.96%
19.0
3%19
.50%
19.7
6%19
.81%
19.6
7%19
.39%
19.0
1%18
.55%
18.0
3%17
.47%
16.8
8%16
.28%
15.6
6%15
.02%
14.3
7%
Empl
oyee
Con
trib
utio
ns
Leg
acy
13,2
89
11,4
40
10,1
72
9,23
7
8,
524
7,97
4
7,
497
7,06
1
6,
659
6,28
5
5,
937
5,59
2
5,
260
4,94
2
4,
627
4,31
7
4,
007
N
ew E
mpl
oyee
s-
1,
798
3,14
3
4,
227
5,12
7
5,
906
6,63
6
7,
343
8,03
1
8,
712
9,38
0
10
,051
10
,720
11
,388
12
,060
12
,736
13
,421
Tot
al E
mpl
oyee
Con
tribu
tions
13,2
89
13,2
38
13,3
15
13,4
64
13,6
51
13,8
80
14,1
33
14,4
04
14,6
90
14,9
97
15,3
17
15,6
43
15,9
80
16,3
30
16,6
87
17,0
53
17,4
28
Empl
oyer
Con
trib
utio
ns
Sta
tuto
ry50
,763
50
,197
50
,674
52
,509
53
,948
54
,992
55
,601
55
,857
55
,855
55
,641
55
,232
54
,653
53
,948
53
,168
52
,263
51
,226
50
,090
Asse
ts
Mar
ket V
alue
(MV
A)
914,
082
83
5,51
0
845,
444
85
6,89
9
872,
077
889,
612
90
9,86
8
933,
176
959,
220
98
8,83
5
1,02
1,11
2
1,
056,
297
1,09
4,40
3
1,13
4,25
2
1,
177,
654
1,22
4,12
5
1,
272,
884
A
ctua
rial V
alue
(AV
A)
899,
817
89
3,15
3
888,
867
88
8,09
3
892,
753
901,
244
91
3,72
1
930,
339
950,
630
97
5,29
7
1,00
3,32
0
1,
034,
846
1,06
9,80
4
1,10
6,94
7
1,
148,
021
1,19
2,49
0
1,
239,
529
A
mor
tizat
ion
Per
iod
1817
1615
1413
1211
109
87
65
43
2
Pla
n C
hang
esN
/AN
/AN
/AN
/AN
/AN
/AN
/AN
/AN
/AN
/AN
/AN
/AN
/AN
/AN
/AN
/AN
/A
Unf
unde
d A
ctua
rial A
ccru
ed L
iabi
lity*
*23
6,14
0
230,
087
22
4,07
0
218,
598
21
1,95
2
20
4,07
2
194,
943
18
4,65
3
17
3,24
1
160,
702
14
7,03
7
132,
273
11
6,39
5
99
,383
81
,194
61
,856
41
,410
Am
ortiz
atio
n of
UA
AL
24,3
29
24,3
89
24,5
11
24,7
64
24,9
67
25,1
14
25,2
02
25,2
42
25,2
39
25,1
93
25,1
03
24,9
73
24,7
97
24,5
64
24,2
42
23,7
86
23,0
62
N
orm
al C
ost
26,0
57
25,9
85
27,4
06
28,4
41
29,1
19
29,4
92
29,6
20
29,5
29
29,2
64
28,8
79
28,4
13
27,8
48
27,2
23
26,5
64
25,9
00
25,2
29
24,5
56
Ann
ual R
equi
red
Con
tribu
tion*
**50
,387
50
,374
51
,917
53
,205
54
,086
54
,606
54
,822
54
,770
54
,503
54
,072
53
,517
52
,821
52
,020
51
,128
50
,142
49
,015
47
,618
C
ontri
butio
n R
ate
18.9
6%19
.03%
19.5
0%19
.76%
19.8
1%19
.67%
19.3
9%19
.01%
18.5
5%18
.03%
17.4
7%16
.88%
16.2
8%15
.66%
15.0
2%14
.37%
13.6
6%
* U
sing
EA
N L
iabi
lity
and
AV
A**
Incl
udes
any
pla
n ch
ange
s**
*May
diff
er fr
om s
umm
ing
due
to ro
undi
ng
Proj
ectio
n As
sum
ptio
ns:
(1) N
ew E
ntra
nts:
A
ctiv
e m
embe
rshi
p as
sum
ed to
sta
y at
the
Janu
ary
1, 2
018
leve
l thr
ough
out p
roje
ctio
n (5
,138
act
ive
mem
bers
),N
ew E
ntra
nts
com
ing
into
the
plan
hav
e th
e av
erag
e ch
arac
teris
tics
of n
ew e
mpl
oyee
s ov
er th
e la
st fi
ve y
ears
.
(2) E
xpen
ses:
P
lan
expe
nses
pai
d ar
e as
sum
ed to
rem
ain
at th
e 20
17 le
vel (
$1,6
14,0
00)
(3) E
xpen
se &
Con
tinge
ncy
Res
erve
: Th
e ex
pens
e &
con
tinge
ncy
rese
rve
is a
ssum
ed to
rem
ain
at th
e Ja
nuar
y 1,
201
8 le
vel (
$30,
751,
000)
(4) D
efer
red
Ves
ted
Mem
bers
: D
efer
red
vest
ed m
embe
rs a
re a
ssum
ed to
rece
ive
150%
of t
heir
acco
unt b
alan
ce a
t age
65.
(5) N
on-v
este
d Te
rmin
ated
Mem
bers
: N
on-v
este
d te
rmin
ated
mem
bers
are
ass
umed
to re
ceiv
e 10
0% o
f the
ir ac
coun
t bal
ance
at a
ge 6
5.
(6) J
anua
ry 1
, 201
9 E
stim
ated
Ass
ets:
A
ctua
l MV
A a
s of
Nov
embe
r 30,
201
8 ro
lled
forw
ard
to J
anua
ry 1
, 201
9 us
ing
a 0%
retu
rn, a
long
with
act
ual D
ecem
ber b
enef
it pa
ymen
ts a
nd c
ontri
butio
ns.
Con
trib
utio
n D
evel
opm
ent f
or
Follo
win
g Ye
ar
9
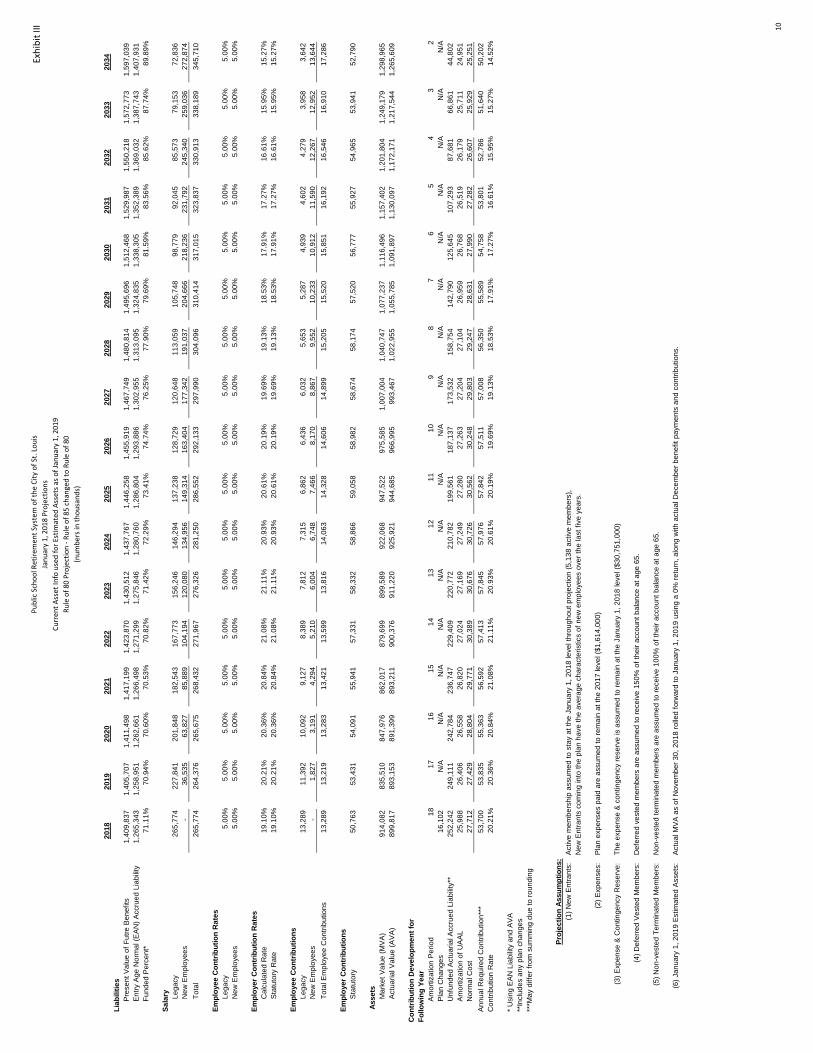
Pu
blic
Sch
oo
l Ret
irem
en
t Sy
stem
of
the
Cit
y o
f St
. Lo
uis
Jan
uar
y 1,
201
8 P
roje
ctio
ns
Cu
rren
t A
sset
Info
use
d f
or
Esti
mat
ed A
sset
s as
of
Jan
uar
y 1,
201
9
Ru
le o
f 80
Pro
ject
ion
- R
ule
of
85 c
han
ged
to
Ru
le o
f 80
(nu
mb
ers
in t
ho
usa
nd
s)
Exh
ibit
III
2018
2019
2020
2021
2022
2023
2024
2025
2026
2027
2028
2029
2030
2031
2032
2033
2034
Liab
ilitie
s
Pre
sent
Val
ue o
f Fut
re B
enef
its1,
409,
837
1,40
5,70
7
1,
411,
498
1,41
7,19
9
1,
423,
870
1,
430,
512
1,43
7,76
7
1,
446,
258
1,
455,
919
1,46
7,74
9
1,
480,
814
1,49
5,69
6
1,
512,
468
1,
529,
987
1,55
0,21
8
1,
572,
773
1,59
7,03
9
Ent
ry A
ge N
orm
al (E
AN
) Acc
rued
Lia
bilit
y1,
265,
343
1,25
8,95
1
1,
262,
661
1,26
6,49
8
1,
271,
299
1,
275,
846
1,28
0,76
0
1,
286,
804
1,
293,
886
1,30
2,95
5
1,
313,
095
1,32
4,83
5
1,
338,
305
1,
352,
389
1,36
9,03
2
1,
387,
743
1,40
7,93
1
Fun
ded
Per
cent
*71
.11%
70.9
4%70
.60%
70.5
3%70
.82%
71.4
2%72
.29%
73.4
1%74
.74%
76.2
5%77
.90%
79.6
9%81
.59%
83.5
6%85
.62%
87.7
4%89
.89%
Sala
ry
Leg
acy
265,
774
22
7,84
1
201,
848
18
2,54
3
167,
773
156,
246
14
6,29
4
137,
238
128,
729
12
0,64
8
113,
059
10
5,74
8
98,7
79
92,0
45
85,5
73
79,1
53
72,8
36
N
ew E
mpl
oyee
s-
36,5
35
63,8
27
85,8
89
104,
194
120,
080
13
4,95
6
149,
314
163,
404
17
7,34
2
191,
037
20
4,66
6
218,
236
231,
792
24
5,34
0
259,
036
27
2,87
4
T
otal
265,
774
26
4,37
6
265,
675
26
8,43
2
271,
967
276,
326
28
1,25
0
286,
552
292,
133
29
7,99
0
304,
096
31
0,41
4
317,
015
323,
837
33
0,91
3
338,
189
34
5,71
0
Empl
oyee
Con
trib
utio
n R
ates
L
egac
y5.
00%
5.00
%5.
00%
5.00
%5.
00%
5.00
%5.
00%
5.00
%5.
00%
5.00
%5.
00%
5.00
%5.
00%
5.00
%5.
00%
5.00
%5.
00%
N
ew E
mpl
oyee
s5.
00%
5.00
%5.
00%
5.00
%5.
00%
5.00
%5.
00%
5.00
%5.
00%
5.00
%5.
00%
5.00
%5.
00%
5.00
%5.
00%
5.00
%5.
00%
Empl
oyer
Con
trib
utio
n R
ates
C
alcu
late
d R
ate
19.1
0%20
.21%
20.3
6%20
.84%
21.0
8%21
.11%
20.9
3%20
.61%
20.1
9%19
.69%
19.1
3%18
.53%
17.9
1%17
.27%
16.6
1%15
.95%
15.2
7%
Sta
tuto
ry R
ate
19.1
0%20
.21%
20.3
6%20
.84%
21.0
8%21
.11%
20.9
3%20
.61%
20.1
9%19
.69%
19.1
3%18
.53%
17.9
1%17
.27%
16.6
1%15
.95%
15.2
7%
Empl
oyee
Con
trib
utio
ns
Leg
acy
13,2
89
11
,392
10
,092
9,
127
8,38
9
7,
812
7,31
5
6,
862
6,43
6
6,
032
5,65
3
5,
287
4,93
9
4,
602
4,27
9
3,
958
3,64
2
New
Em
ploy
ees
-
1,
827
3,19
1
4,
294
5,21
0
6,
004
6,74
8
7,
466
8,17
0
8,
867
9,55
2
10
,233
10
,912
11
,590
12
,267
12
,952
13
,644
Tot
al E
mpl
oyee
Con
tribu
tions
13,2
89
13
,219
13
,283
13
,421
13
,599
13
,816
14
,063
14
,328
14
,606
14
,899
15
,205
15
,520
15
,851
16
,192
16
,546
16
,910
17
,286
Empl
oyer
Con
trib
utio
ns
Sta
tuto
ry50
,763
53,4
31
54,0
91
55,9
41
57,3
31
58,3
32
58,8
66
59,0
58
58,9
82
58,6
74
58,1
74
57,5
20
56,7
77
55,9
27
54,9
65
53,9
41
52,7
90
Asse
ts
Mar
ket V
alue
(MV
A)
914,
082
83
5,51
0
847,
976
86
2,01
7
879,
699
899,
589
92
2,06
8
947,
522
975,
585
1,
007,
004
1,04
0,74
7
1,
077,
237
1,11
6,49
6
1,15
7,40
2
1,
201,
804
1,24
9,17
9
1,
298,
965
A
ctua
rial V
alue
(AV
A)
899,
817
89
3,15
3
891,
399
89
3,21
1
900,
376
911,
220
92
5,92
1
944,
685
966,
995
99
3,46
7
1,02
2,95
5
1,
055,
785
1,09
1,89
7
1,13
0,09
7
1,
172,
171
1,21
7,54
4
1,
265,
609
A
mor
tizat
ion
Per
iod
1817
1615
1413
1211
109
87
65
43
2
Pla
n C
hang
es16
,102
N/A
N/A
N/A
N/A
N/A
N/A
N/A
N/A
N/A
N/A
N/A
N/A
N/A
N/A
N/A
N/A
U
nfun
ded
Act
uaria
l Acc
rued
Lia
bilit
y**
252,
242
24
9,11
1
242,
784
23
6,74
7
229,
409
220,
772
21
0,78
2
199,
561
187,
137
17
3,53
2
158,
754
14
2,79
0
125,
645
107,
293
87
,681
66
,861
44
,802
Am
ortiz
atio
n of
UA
AL
25,9
88
26
,406
26
,558
26
,820
27
,024
27
,169
27
,249
27
,280
27
,263
27
,204
27
,104
26
,959
26
,768
26
,519
26
,179
25
,711
24
,951
Nor
mal
Cos
t27
,712
27,4
29
28,8
04
29,7
71
30,3
89
30,6
76
30,7
26
30,5
62
30,2
48
29,8
03
29,2
47
28,6
31
27,9
90
27,2
82
26,6
07
25,9
29
25,2
51
Ann
ual R
equi
red
Con
tribu
tion*
**53
,700
53,8
35
55,3
63
56,5
92
57,4
13
57,8
45
57,9
76
57,8
42
57,5
11
57,0
08
56,3
50
55,5
89
54,7
58
53,8
01
52,7
86
51,6
40
50,2
02
Con
tribu
tion
Rat
e20
.21%
20.3
6%20
.84%
21.0
8%21
.11%
20.9
3%20
.61%
20.1
9%19
.69%
19.1
3%18
.53%
17.9
1%17
.27%
16.6
1%15
.95%
15.2
7%14
.52%
* U
sing
EA
N L
iabi
lity
and
AV
A**
Incl
udes
any
pla
n ch
ange
s**
*May
diff
er fr
om s
umm
ing
due
to ro
undi
ng
Proj
ectio
n As
sum
ptio
ns:
(1) N
ew E
ntra
nts:
A
ctiv
e m
embe
rshi
p as
sum
ed to
sta
y at
the
Janu
ary
1, 2
018
leve
l thr
ough
out p
roje
ctio
n (5
,138
act
ive
mem
bers
),N
ew E
ntra
nts
com
ing
into
the
plan
hav
e th
e av
erag
e ch
arac
teris
tics
of n
ew e
mpl
oyee
s ov
er th
e la
st fi
ve y
ears
.
(2) E
xpen
ses:
P
lan
expe
nses
pai
d ar
e as
sum
ed to
rem
ain
at th
e 20
17 le
vel (
$1,6
14,0
00)
(3) E
xpen
se &
Con
tinge
ncy
Res
erve
: Th
e ex
pens
e &
con
tinge
ncy
rese
rve
is a
ssum
ed to
rem
ain
at th
e Ja
nuar
y 1,
201
8 le
vel (
$30,
751,
000)
(4) D
efer
red
Ves
ted
Mem
bers
: D
efer
red
vest
ed m
embe
rs a
re a
ssum
ed to
rece
ive
150%
of t
heir
acco
unt b
alan
ce a
t age
65.
(5) N
on-v
este
d Te
rmin
ated
Mem
bers
: N
on-v
este
d te
rmin
ated
mem
bers
are
ass
umed
to re
ceiv
e 10
0% o
f the
ir ac
coun
t bal
ance
at a
ge 6
5.
(6) J
anua
ry 1
, 201
9 E
stim
ated
Ass
ets:
A
ctua
l MV
A a
s of
Nov
embe
r 30,
201
8 ro
lled
forw
ard
to J
anua
ry 1
, 201
9 us
ing
a 0%
retu
rn, a
long
with
act
ual D
ecem
ber b
enef
it pa
ymen
ts a
nd c
ontri
butio
ns.
Con
trib
utio
n D
evel
opm
ent f
or
Follo
win
g Ye
ar
10

Pu
blic
Sch
oo
l Ret
irem
ent
Syst
em o
f th
e C
ity
of
St. L
ou
is
Jan
uar
y 1
, 20
18
Pro
ject
ion
s
Cu
rren
t A
sset
Info
use
d f
or
Esti
mat
ed A
sset
s as
of
Jan
uar
y 1
, 20
19
Pro
po
sed
Pla
n P
roje
ctio
n -
All
Ch
ange
s R
efle
cted
(nu
mb
ers
in t
ho
usa
nd
s)
Exh
ibit
III
2018
2019
2020
2021
2022
2023
2024
2025
2026
2027
2028
2029
2030
2031
2032
2033
2034
Liab
ilitie
s
Pre
sent
Val
ue o
f Fut
re B
enef
its1,
411,
197
1,40
6,75
5
1,
412,
059
1,41
6,97
5
1,
422,
574
1,42
7,65
3
1,
433,
300
1,43
9,97
2
1,
447,
656
1,45
7,40
5
1,
468,
196
1,48
0,52
4
1,
494,
595
1,50
9,10
1
1,
526,
142
1,54
5,24
4
1,
565,
781
E
ntry
Age
Nor
mal
(EAN
) Acc
rued
Lia
bilit
y1,
266,
013
1,25
9,26
4
1,
262,
421
1,26
5,39
6
1,
268,
972
1,27
1,87
0
1,
275,
027
1,27
9,17
4
1,
284,
213
1,29
1,07
5
1,
298,
808
1,30
7,92
8
1,
318,
573
1,32
9,58
6
1,
342,
922
1,35
8,05
9
1,
374,
392
F
unde
d Pe
rcen
t*71
.07%
70.9
3%70
.01%
69.3
4%68
.89%
68.6
0%68
.49%
68.5
4%68
.73%
69.0
2%69
.36%
69.7
6%70
.21%
70.6
6%71
.15%
71.6
6%72
.15%
Sala
ry
Leg
acy
265,
774
22
7,84
1
201,
848
18
2,54
3
167,
773
15
6,24
6
146,
294
13
7,23
8
128,
729
12
0,64
8
113,
059
10
5,74
8
98,7
79
92,0
45
85,5
73
79,1
53
72,8
36
N
ew E
mpl
oyee
s-
36
,535
63
,827
85
,889
10
4,19
4
120,
080
13
4,95
6
149,
314
16
3,40
4
177,
342
19
1,03
7
204,
666
21
8,23
6
231,
792
24
5,34
0
259,
036
27
2,87
4
T
otal
265,
774
26
4,37
6
265,
675
26
8,43
2
271,
967
27
6,32
6
281,
250
28
6,55
2
292,
133
29
7,99
0
304,
096
31
0,41
4
317,
015
32
3,83
7
330,
913
33
8,18
9
345,
710
Empl
oyee
Con
trib
utio
n R
ates
L
egac
y5.
50%
6.00
%6.
50%
7.00
%7.
50%
8.00
%8.
50%
9.00
%9.
00%
9.00
%9.
00%
9.00
%9.
00%
9.00
%9.
00%
9.00
%9.
00%
N
ew E
mpl
oyee
s9.
00%
9.00
%9.
00%
9.00
%9.
00%
9.00
%9.
00%
9.00
%9.
00%
9.00
%9.
00%
9.00
%9.
00%
9.00
%9.
00%
9.00
%9.
00%
Empl
oyer
Con
trib
utio
n R
ates
C
alcu
late
d R
ate
19.1
0%17
.72%
17.4
8%17
.91%
18.2
3%18
.48%
18.6
6%18
.84%
19.0
5%19
.36%
19.7
9%20
.44%
21.4
0%22
.85%
25.0
8%28
.68%
35.0
4%
Sta
tuto
ry R
ate
19.1
0%16
.00%
15.5
0%15
.00%
14.5
0%14
.00%
13.5
0%13
.00%
12.5
0%12
.00%
11.5
0%11
.00%
10.5
0%10
.00%
9.50
%9.
00%
9.00
%
Sho
rtfal
l in
Stat
utor
y R
ate
0.00
%-1
.72%
-1.9
8%-2
.91%
-3.7
3%-4
.48%
-5.1
6%-5
.84%
-6.5
5%-7
.36%
-8.2
9%-9
.44%
-10.
90%
-12.
85%
-15.
58%
-19.
68%
-26.
04%
Empl
oyee
Con
trib
utio
ns
Leg
acy
14,6
18
13
,670
13
,120
12
,778
12
,583
12
,500
12,4
35
12
,351
11
,586
10,8
58
10
,175
9,51
7
8,
890
8,28
4
7,
702
7,12
4
6,
555
N
ew E
mpl
oyee
s-
3,
288
5,74
4
7,
730
9,37
7
10
,807
12,1
46
13
,438
14
,706
15,9
61
17
,193
18,4
20
19,6
41
20,8
61
22,0
81
23,3
13
24,5
59
T
otal
Em
ploy
ee C
ontri
butio
ns14
,618
16,9
58
18,8
64
20,5
08
21,9
60
23,3
07
24
,581
25,7
89
26,2
92
26
,819
27,3
68
27
,937
28
,531
29
,145
29
,783
30
,437
31
,114
Empl
oyer
Con
trib
utio
ns
Cal
cula
ted
50,7
63
46
,847
46
,440
48
,076
49
,580
51
,065
52,4
81
53
,986
55
,651
57,6
91
60
,181
63,4
49
67,8
41
73,9
97
82,9
93
96,9
93
121,
137
Sta
tuto
ry50
,763
42,3
00
41,1
80
40,2
65
39,4
35
38,6
86
37
,969
37,2
52
36,5
17
35
,759
34,9
71
34
,146
33
,287
32
,384
31
,437
30
,437
31
,114
Sho
rtfal
l in
Stat
utor
y C
ontri
butio
n-
(4
,547
)
(5
,260
)
(7
,811
)
(1
0,14
5)
(12,
379)
(1
4,51
2)
(16,
734)
(1
9,13
4)
(21,
932)
(2
5,21
0)
(29,
303)
(3
4,55
4)
(41,
613)
(5
1,55
6)
(66,
556)
(9
0,02
3)
C
umul
ativ
e Sh
ortfa
ll Am
ount
-
(4,5
47)
(9,8
07)
(17,
618)
(2
7,76
3)
(40,
142)
(5
4,65
4)
(71,
388)
(9
0,52
2)
(112
,454
)
(1
37,6
64)
(166
,967
)
(2
01,5
21)
(243
,134
)
(2
94,6
90)
(361
,246
)
(4
51,2
69)
Ass
ets
M
arke
t Val
ue (M
VA)
914,
082
83
5,51
0
840,
448
84
6,22
1
853,
481
86
0,90
7
869,
392
87
9,57
2
891,
258
90
4,60
7
918,
652
93
3,87
0
950,
319
96
6,80
0
985,
148
1,
004,
777
1,02
5,01
9
Act
uaria
l Val
ue (A
VA)
899,
817
89
3,15
3
883,
871
87
7,41
5
874,
158
87
2,53
9
873,
245
87
6,73
6
882,
668
89
1,07
0
900,
859
91
2,41
8
925,
720
93
9,49
5
955,
516
97
3,14
2
991,
663
A
mor
tizat
ion
Perio
d18
1716
1514
1312
1110
98
76
54
32
P
lan
Cha
nges
16,7
71
N
/AN
/AN
/AN
/AN
/AN
/AN
/AN
/AN
/AN
/AN
/AN
/AN
/AN
/AN
/AN
/A
Unf
unde
d Ac
tuar
ial A
ccru
ed L
iabi
lity*
*25
2,91
1
242,
916
24
0,03
6
238,
965
23
9,27
5
240,
648
24
2,76
5
245,
377
24
8,33
8
251,
551
25
4,90
4
258,
370
26
1,88
9
265,
488
26
9,16
9
273,
003
27
7,03
8
A
mor
tizat
ion
of U
AAL
26,0
57
25
,749
26
,258
27
,072
28
,186
29
,615
31,3
84
33
,542
36
,179
39,4
35
43
,519
48,7
80
55,7
94
65,6
19
80,3
65
104,
980
15
4,29
0
N
orm
al C
ost
21,0
39
20
,462
21
,334
21
,862
22
,065
21
,960
21,5
93
21
,049
20
,368
19,5
39
18
,646
17,6
49
16,6
43
15,5
90
14,5
57
13,5
09
12,4
82
Annu
al R
equi
red
Con
tribu
tion*
**47
,096
46,2
11
47,5
92
48,9
34
50,2
51
51,5
76
52
,977
54,5
91
56,5
47
58
,974
62,1
65
66
,429
72
,437
81
,209
94
,922
11
8,48
9
166,
772
C
ontri
butio
n R
ate
17.7
2%17
.48%
17.9
1%18
.23%
18.4
8%18
.66%
18.8
4%19
.05%
19.3
6%19
.79%
20.4
4%21
.40%
22.8
5%25
.08%
28.6
8%35
.04%
48.2
4%
* Usi
ng E
AN L
iabi
lity
and
AVA
**In
clud
es a
ny p
lan
chan
ges
***M
ay d
iffer
from
sum
min
g du
e to
roun
ding
Proj
ectio
n A
ssum
ptio
ns:
(1) N
ew E
ntra
nts:
Ac
tive
mem
bers
hip
assu
med
to s
tay
at th
e Ja
nuar
y 1,
201
8 le
vel t
hrou
ghou
t pro
ject
ion
(5,1
38 a
ctiv
e m
embe
rs),
New
Ent
rant
s co
min
g in
to th
e pl
an h
ave
the
aver
age
char
acte
ristic
s of
new
em
ploy
ees
over
the
last
five
yea
rs.
(2) E
xpen
ses:
Pl
an e
xpen
ses
paid
are
ass
umed
to re
mai
n at
the
2017
leve
l ($1
,614
,000
)
(3) E
xpen
se &
Con
tinge
ncy
Res
erve
: Th
e ex
pens
e &
cont
inge
ncy
rese
rve
is a
ssum
ed to
rem
ain
at th
e Ja
nuar
y 1,
201
8 le
vel (
$30,
751,
000)
(4) D
efer
red
Vest
ed M
embe
rs:
Def
erre
d ve
sted
mem
bers
are
ass
umed
to re
ceiv
e 15
0% o
f the
ir ac
coun
t bal
ance
at a
ge 6
5.
(5) N
on-v
este
d Te
rmin
ated
Mem
bers
: N
on-v
este
d te
rmin
ated
mem
bers
are
ass
umed
to re
ceiv
e 10
0% o
f the
ir ac
coun
t bal
ance
at a
ge 6
5.
(6) J
anua
ry 1
, 201
9 Es
timat
ed A
sset
s:
Actu
al M
VA a
s of
Nov
embe
r 30,
201
8 ro
lled
forw
ard
to J
anua
ry 1
, 201
9 us
ing
a 0%
retu
rn, a
long
with
act
ual D
ecem
ber b
enef
it pa
ymen
ts a
nd c
ontri
butio
ns.
Con
trib
utio
n D
evel
opm
ent f
or
Follo
win
g Ye
ar
11
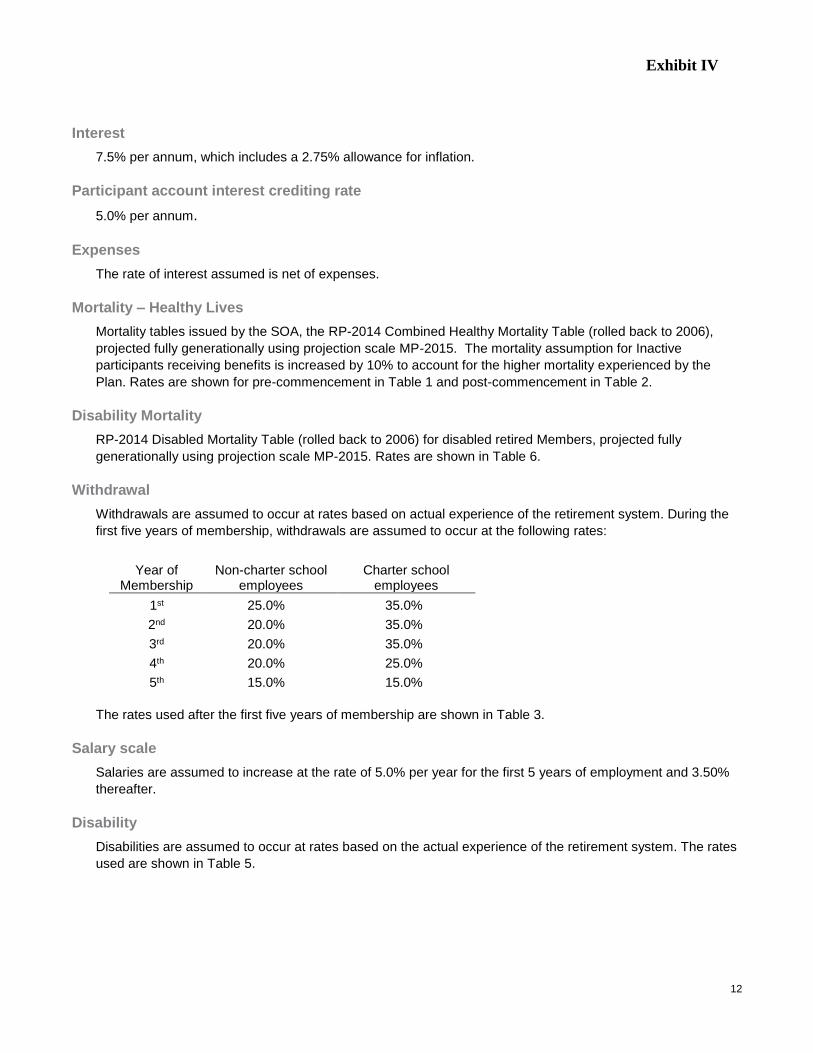
Exhibit IV
Interest 7.5% per annum, which includes a 2.75% allowance for inflation.
Participant account interest crediting rate 5.0% per annum.
Expenses The rate of interest assumed is net of expenses.
Mortality – Healthy Lives Mortality tables issued by the SOA, the RP-2014 Combined Healthy Mortality Table (rolled back to 2006), projected fully generationally using projection scale MP-2015. The mortality assumption for Inactive participants receiving benefits is increased by 10% to account for the higher mortality experienced by the Plan. Rates are shown for pre-commencement in Table 1 and post-commencement in Table 2.
Disability Mortality RP-2014 Disabled Mortality Table (rolled back to 2006) for disabled retired Members, projected fully generationally using projection scale MP-2015. Rates are shown in Table 6.
Withdrawal Withdrawals are assumed to occur at rates based on actual experience of the retirement system. During the first five years of membership, withdrawals are assumed to occur at the following rates:
Year of Membership
Non-charter school employees
Charter school employees
1st 25.0% 35.0% 2nd 20.0% 35.0% 3rd 20.0% 35.0% 4th 20.0% 25.0% 5th 15.0% 15.0%
The rates used after the first five years of membership are shown in Table 3.
Salary scale Salaries are assumed to increase at the rate of 5.0% per year for the first 5 years of employment and 3.50% thereafter.
Disability Disabilities are assumed to occur at rates based on the actual experience of the retirement system. The rates used are shown in Table 5.
12
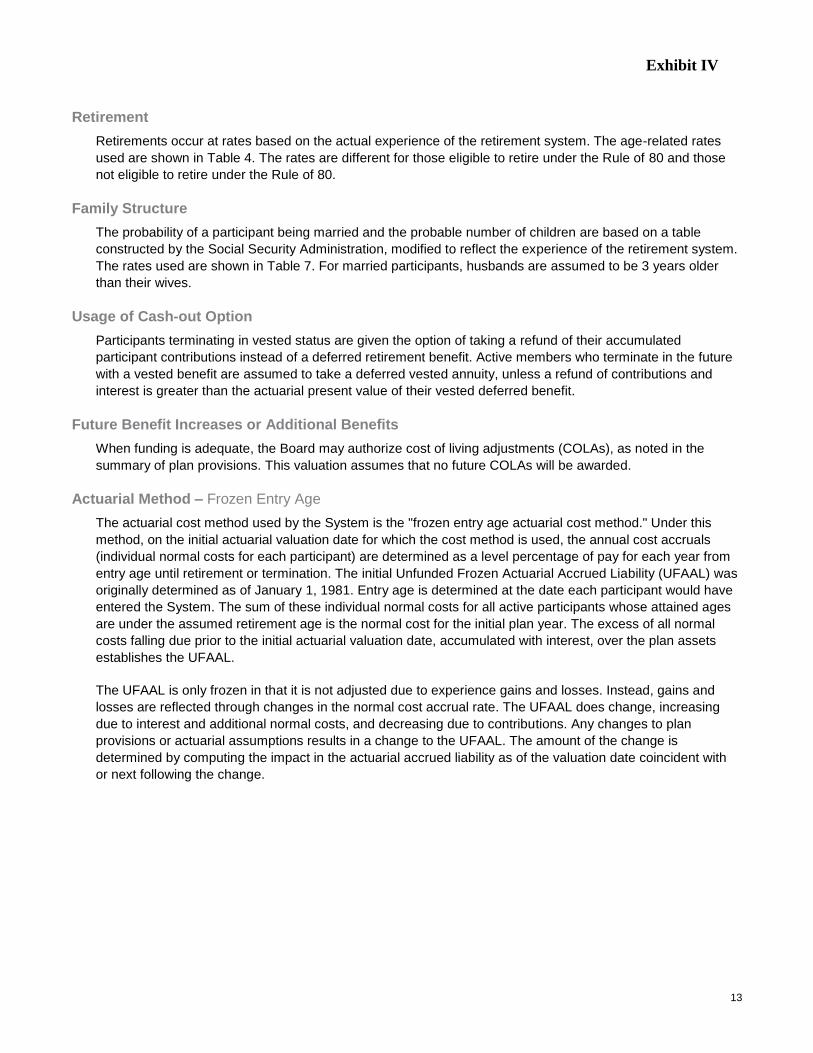
Exhibit IV
Retirement Retirements occur at rates based on the actual experience of the retirement system. The age-related rates used are shown in Table 4. The rates are different for those eligible to retire under the Rule of 80 and those not eligible to retire under the Rule of 80.
Family Structure The probability of a participant being married and the probable number of children are based on a table constructed by the Social Security Administration, modified to reflect the experience of the retirement system. The rates used are shown in Table 7. For married participants, husbands are assumed to be 3 years older than their wives.
Usage of Cash-out Option Participants terminating in vested status are given the option of taking a refund of their accumulated participant contributions instead of a deferred retirement benefit. Active members who terminate in the future with a vested benefit are assumed to take a deferred vested annuity, unless a refund of contributions and interest is greater than the actuarial present value of their vested deferred benefit.
Future Benefit Increases or Additional Benefits When funding is adequate, the Board may authorize cost of living adjustments (COLAs), as noted in the summary of plan provisions. This valuation assumes that no future COLAs will be awarded.
Actuarial Method – Frozen Entry Age The actuarial cost method used by the System is the "frozen entry age actuarial cost method." Under this method, on the initial actuarial valuation date for which the cost method is used, the annual cost accruals (individual normal costs for each participant) are determined as a level percentage of pay for each year from entry age until retirement or termination. The initial Unfunded Frozen Actuarial Accrued Liability (UFAAL) was originally determined as of January 1, 1981. Entry age is determined at the date each participant would have entered the System. The sum of these individual normal costs for all active participants whose attained ages are under the assumed retirement age is the normal cost for the initial plan year. The excess of all normal costs falling due prior to the initial actuarial valuation date, accumulated with interest, over the plan assets establishes the UFAAL.
The UFAAL is only frozen in that it is not adjusted due to experience gains and losses. Instead, gains and losses are reflected through changes in the normal cost accrual rate. The UFAAL does change, increasing due to interest and additional normal costs, and decreasing due to contributions. Any changes to plan provisions or actuarial assumptions results in a change to the UFAAL. The amount of the change is determined by computing the impact in the actuarial accrued liability as of the valuation date coincident with or next following the change.
13

Exhibit IV
Normal costs are calculated as the level percentage of pay required to fund the excess of the actuarial present value of future benefits over the sum of the actuarial value of current assets and the remaining UFAAL.
Effective January 1, 2006, UFAAL was reestablished to better reflect an appropriate relationship between the normal cost and the actuarial accrued liability.
The funding requirement for each plan year is the sum of the "normal cost contribution" (equal to the normal cost for that year), plus the "actuarial accrued liability contribution." The "actuarial accrued liability contribution" is the payment required to amortize the UFAAL over 30 years, from January 1, 2006, the date that it was reestablished.
Valuation of Assets The actuarial value of assets is determined using the assumed yield method of valuing assets. Under the assumed yield asset valuation method, the prior year’s actuarial value is increased at the assumed rate of
return with appropriate adjustments for contributions and disbursements to produce an expected actuarial value of assets at the end of the year. The expected actuarial value is compared to the market value of assets less the expense and contingency reserve, and 20% of the difference is added to the expected actuarial value. The actuarial value of assets was “fresh-started” as of January 1, 2006 and set equal to the market value of assets as of that date.
14
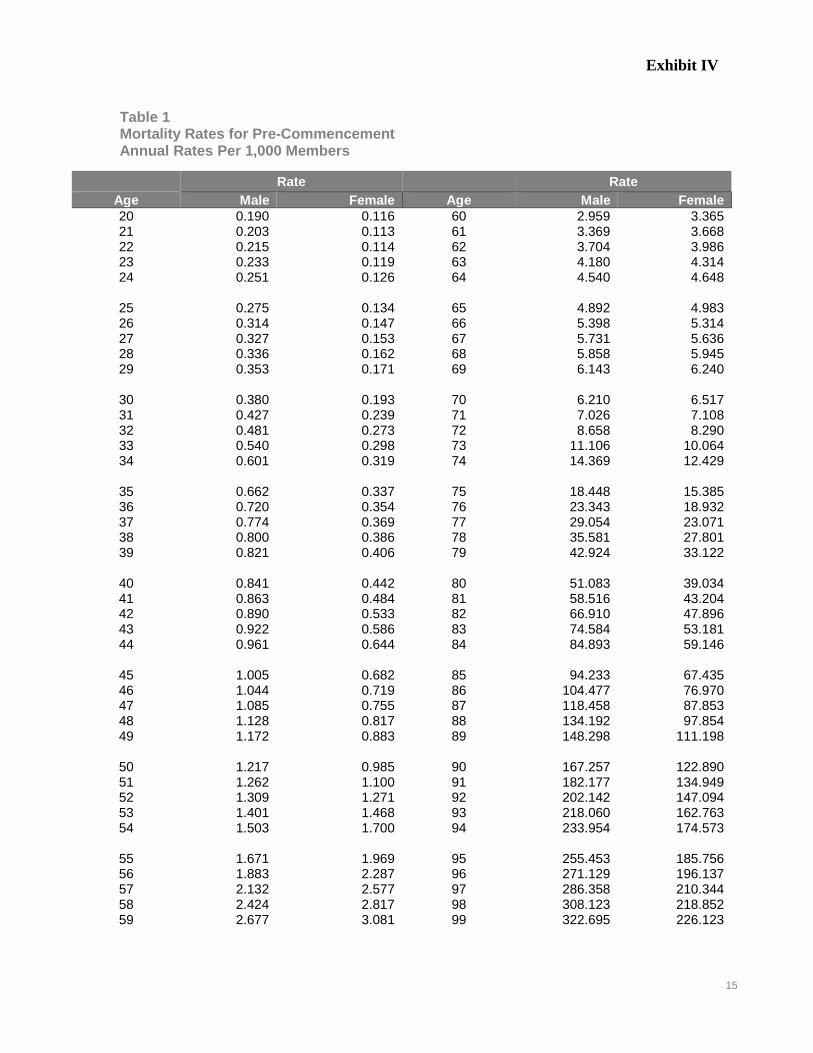
Exhibit IV
Table 1 Mortality Rates for Pre-Commencement Annual Rates Per 1,000 Members
Rate Rate
Age Male Female Age Male Female 20 0.190 0.116 60 2.959 3.365 21 0.203 0.113 61 3.369 3.668 22 0.215 0.114 62 3.704 3.986 23 0.233 0.119 63 4.180 4.314 24 0.251 0.126 64 4.540 4.648
25 0.275 0.134 65 4.892 4.983 26 0.314 0.147 66 5.398 5.314 27 0.327 0.153 67 5.731 5.636 28 0.336 0.162 68 5.858 5.945 29 0.353 0.171 69 6.143 6.240
30 0.380 0.193 70 6.210 6.517 31 0.427 0.239 71 7.026 7.108 32 0.481 0.273 72 8.658 8.290 33 0.540 0.298 73 11.106 10.064 34 0.601 0.319 74 14.369 12.429
35 0.662 0.337 75 18.448 15.385 36 0.720 0.354 76 23.343 18.932 37 0.774 0.369 77 29.054 23.071 38 0.800 0.386 78 35.581 27.801 39 0.821 0.406 79 42.924 33.122
40 0.841 0.442 80 51.083 39.034 41 0.863 0.484 81 58.516 43.204 42 0.890 0.533 82 66.910 47.896 43 0.922 0.586 83 74.584 53.181 44 0.961 0.644 84 84.893 59.146
45 1.005 0.682 85 94.233 67.435 46 1.044 0.719 86 104.477 76.970 47 1.085 0.755 87 118.458 87.853 48 1.128 0.817 88 134.192 97.854 49 1.172 0.883 89 148.298 111.198
50 1.217 0.985 90 167.257 122.890 51 1.262 1.100 91 182.177 134.949 52 1.309 1.271 92 202.142 147.094 53 1.401 1.468 93 218.060 162.763 54 1.503 1.700 94 233.954 174.573
55 1.671 1.969 95 255.453 185.756 56 1.883 2.287 96 271.129 196.137 57 2.132 2.577 97 286.358 210.344 58 2.424 2.817 98 308.123 218.852 59 2.677 3.081 99 322.695 226.123
15
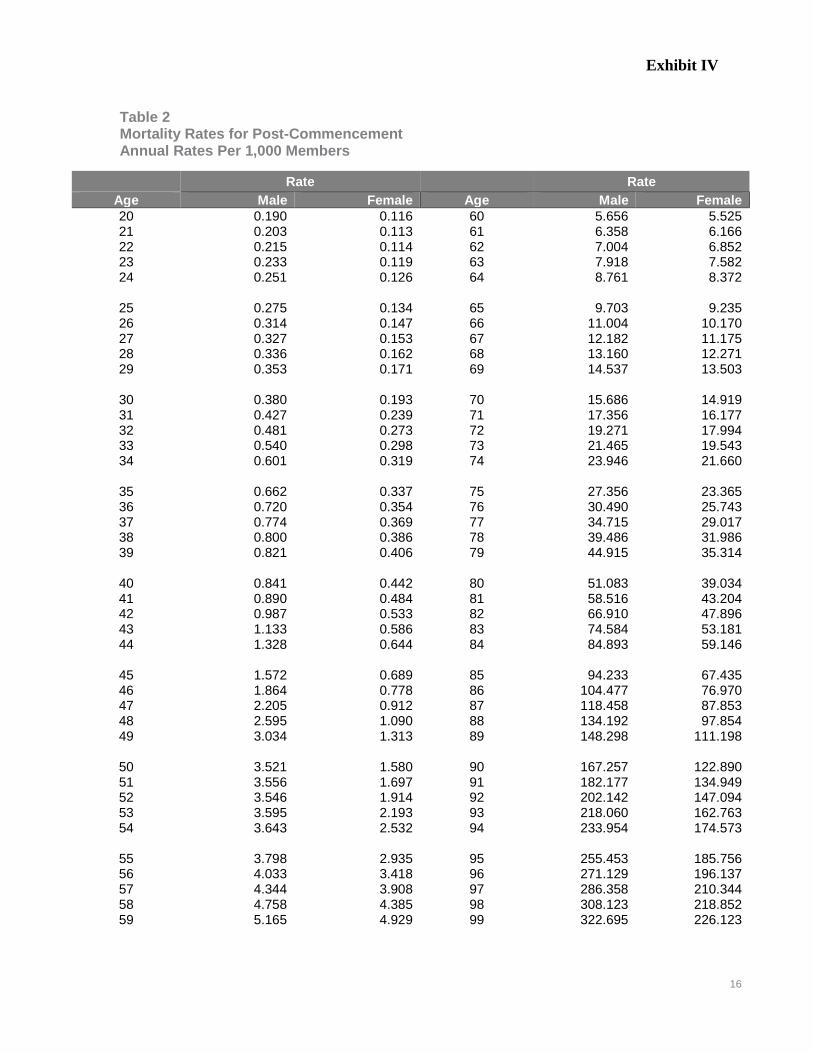
Exhibit IV
Table 2 Mortality Rates for Post-Commencement Annual Rates Per 1,000 Members
Rate Rate
Age Male Female Age Male Female 20 0.190 0.116 60 5.656 5.525 21 0.203 0.113 61 6.358 6.166 22 0.215 0.114 62 7.004 6.852 23 0.233 0.119 63 7.918 7.582 24 0.251 0.126 64 8.761 8.372
25 0.275 0.134 65 9.703 9.235 26 0.314 0.147 66 11.004 10.170 27 0.327 0.153 67 12.182 11.175 28 0.336 0.162 68 13.160 12.271 29 0.353 0.171 69 14.537 13.503
30 0.380 0.193 70 15.686 14.919 31 0.427 0.239 71 17.356 16.177 32 0.481 0.273 72 19.271 17.994 33 0.540 0.298 73 21.465 19.543 34 0.601 0.319 74 23.946 21.660
35 0.662 0.337 75 27.356 23.365 36 0.720 0.354 76 30.490 25.743 37 0.774 0.369 77 34.715 29.017 38 0.800 0.386 78 39.486 31.986 39 0.821 0.406 79 44.915 35.314
40 0.841 0.442 80 51.083 39.034 41 0.890 0.484 81 58.516 43.204 42 0.987 0.533 82 66.910 47.896 43 1.133 0.586 83 74.584 53.181 44 1.328 0.644 84 84.893 59.146
45 1.572 0.689 85 94.233 67.435 46 1.864 0.778 86 104.477 76.970 47 2.205 0.912 87 118.458 87.853 48 2.595 1.090 88 134.192 97.854 49 3.034 1.313 89 148.298 111.198
50 3.521 1.580 90 167.257 122.890 51 3.556 1.697 91 182.177 134.949 52 3.546 1.914 92 202.142 147.094 53 3.595 2.193 93 218.060 162.763 54 3.643 2.532 94 233.954 174.573
55 3.798 2.935 95 255.453 185.756 56 4.033 3.418 96 271.129 196.137 57 4.344 3.908 97 286.358 210.344 58 4.758 4.385 98 308.123 218.852 59 5.165 4.929 99 322.695 226.123 16
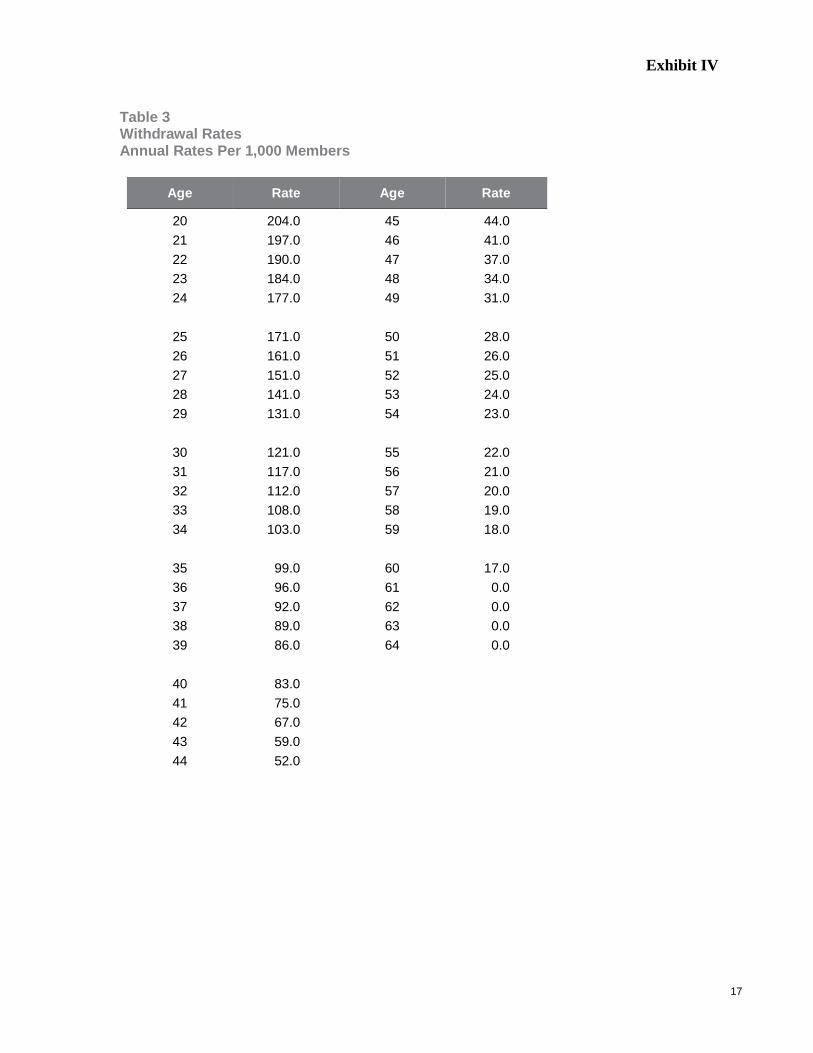
Exhibit IV
Table 3 Withdrawal Rates Annual Rates Per 1,000 Members
Age Rate Age Rate
20 204.0 45 44.0 21 197.0 46 41.0 22 190.0 47 37.0 23 184.0 48 34.0 24 177.0 49 31.0
25 171.0 50 28.0 26 161.0 51 26.0 27 151.0 52 25.0 28 141.0 53 24.0 29 131.0 54 23.0
30 121.0 55 22.0 31 117.0 56 21.0 32 112.0 57 20.0 33 108.0 58 19.0 34 103.0 59 18.0
35 99.0 60 17.0 36 96.0 61 0.0 37 92.0 62 0.0 38 89.0 63 0.0 39 86.0 64 0.0
40 83.0 41 75.0 42 67.0 43 59.0 44 52.0
17

Exhibit IV
Table 4 Retirement Rates Annual Rates Per 1,000 Members
Age Rule of 80
Rate Not Rule of 80
Rate
50-51 200.0 N/A 52-59 150.0 N/A
60 200.0 100.0 61 200.0 100.0 62 250.0 150.0 63 250.0 150.0 64 250.0 200.0 65 300.0 350.0 66 300.0 200.0 67 300.0 200.0 68 300.0 200.0 69 300.0 200.0
70 - 71 300.0 300.0 72 1,000.0 1,000.0
18

Exhibit IV
Table 5 Disability Rates Annual Rates Per 1,000 Members
Rate Rate
Age Males Females Age Males Females 20 0.00 0.00 45 1.50 1.00 21 0.00 0.00 46 1.60 1.10 22 0.00 0.00 47 1.70 1.20 23 0.00 0.00 48 1.80 1.30 24 0.00 0.00 49 1.90 1.40
25 0.00 0.00 50 2.00 1.50 26 0.00 0.00 51 2.50 1.70 27 0.00 0.00 52 3.00 1.90 28 0.00 0.00 53 3.50 2.10 29 0.00 0.00 54 4.00 2.30
30 0.40 0.40 55 4.50 2.50 31 0.40 0.40 56 4.70 2.60 32 0.40 0.40 57 4.90 2.75 33 0.40 0.40 58 5.10 2.85 34 0.40 0.40 59 5.30 3.00
35 0.40 0.40 60 5.50 3.25 36 0.45 0.45 61 6.00 3.50 37 0.50 0.50 62 6.50 3.50 38 0.60 0.60 63 7.00 3.50 39 0.70 0.70 64 7.50 3.50
40 0.80 0.75 65 0.00 0.00 41 0.95 0.80 42 1.10 0.85 43 1.25 0.90 44 1.40 0.95
19

Exhibit IV
Table 6 Post-Disability Mortality Rates Annual Rates Per 1,000 Members
Rate Rate
Age Male Female Age Male Female 20 0.000 0.000 60 42.042 21.839 21 22.571 7.450 61 43.474 22.936 22 22.571 7.450 62 44.981 24.080 23 22.571 7.450 63 46.584 25.293 24 22.571 7.450 64 48.307 26.600
25 22.571 7.450 65 50.174 28.026 26 22.571 7.450 66 52.213 29.594 27 22.571 7.450 67 54.450 31.325 28 22.571 7.450 68 56.909 33.234 29 22.571 7.450 69 59.613 35.335
30 22.571 7.450 70 62.583 37.635 31 22.571 7.450 71 65.841 40.140 32 22.571 7.450 72 69.405 42.851 33 22.571 7.450 73 73.292 45.769 34 22.571 7.450 74 77.512 48.895
35 22.571 7.450 75 82.067 52.230 36 22.571 7.450 76 86.951 55.777 37 22.571 7.450 77 92.149 59.545 38 22.571 7.450 78 97.640 63.545 39 22.571 7.450 79 103.392 67.793
40 22.571 7.450 80 109.372 72.312 41 22.571 7.450 81 115.544 77.135 42 22.571 7.450 82 121.877 82.298 43 22.571 7.450 83 128.343 87.838 44 22.571 7.450 84 134.923 93.794
45 22.571 7.450 85 141.603 100.203 46 23.847 8.184 86 148.374 107.099 47 25.124 8.959 87 155.235 114.512 48 26.404 9.775 88 162.186 122.464 49 27.687 10.634 89 169.233 130.972
50 28.975 11.535 90 183.408 140.049 51 30.268 12.477 91 199.769 149.698 52 31.563 13.456 92 216.605 159.924 53 32.859 14.465 93 233.662 170.433 54 34.152 15.497 94 250.693 182.799
55 35.442 16.544 95 267.491 194.509 56 36.732 17.598 96 283.905 205.379 57 38.026 18.654 97 299.852 215.240 58 39.334 19.710 98 315.296 223.941 59 40.668 20.768 99 330.207 231.387
20

Exhibit IV
Table 7 Family Structure
Age Age of youngest
child
Average number
of children
Probability of being married
Probability of children if married Male Female
20 17 2 .90 .30 .50 21 18 2 .90 .35 .50 22 19 2 .98 .40 .50 23 20 2 .98 .46 .53 24 21 3 1.05 .53 .56 25 22 3 1.13 .60 .59 26 23 4 1.20 .67 .62 27 24 4 1.28 .74 .65 28 25 4 1.35 .76 .67 29 26 5 1.43 .78 .69 30 27 5 1.50 .80 .71 31 28 6 1.58 .82 .73 32 29 6 1.65 .84 .75 33 30 7 1.80 .85 .76 34 31 7 1.95 .86 .77 35 32 8 2.10 .87 .78 36 33 8 2.10 .87 .79 37 34 9 2.10 .87 .80 38 35 9 2.30 .87 .79 39 36 10 1.95 .87 .78 40 37 10 1.88 .87 .77 41 38 11 1.80 .87 .76 42 39 11 1.73 .87 .75 43 40 11 1.73 .87 .72 44 41 12 1.65 .87 .69 45 42 12 1.65 .86 .66 46 43 12 1.58 .86 .63 47 44 12 1.58 .86 .60 48 45 12 1.50 .85 .56 49 46 12 1.43 .85 .52 50 47 13 1.43 .85 .48 51 48 13 1.35 .85 .44 52 49 13 1.35 .85 .40 53 50 13 1.35 .85 .37 54 51 13 1.35 .84 .34
21
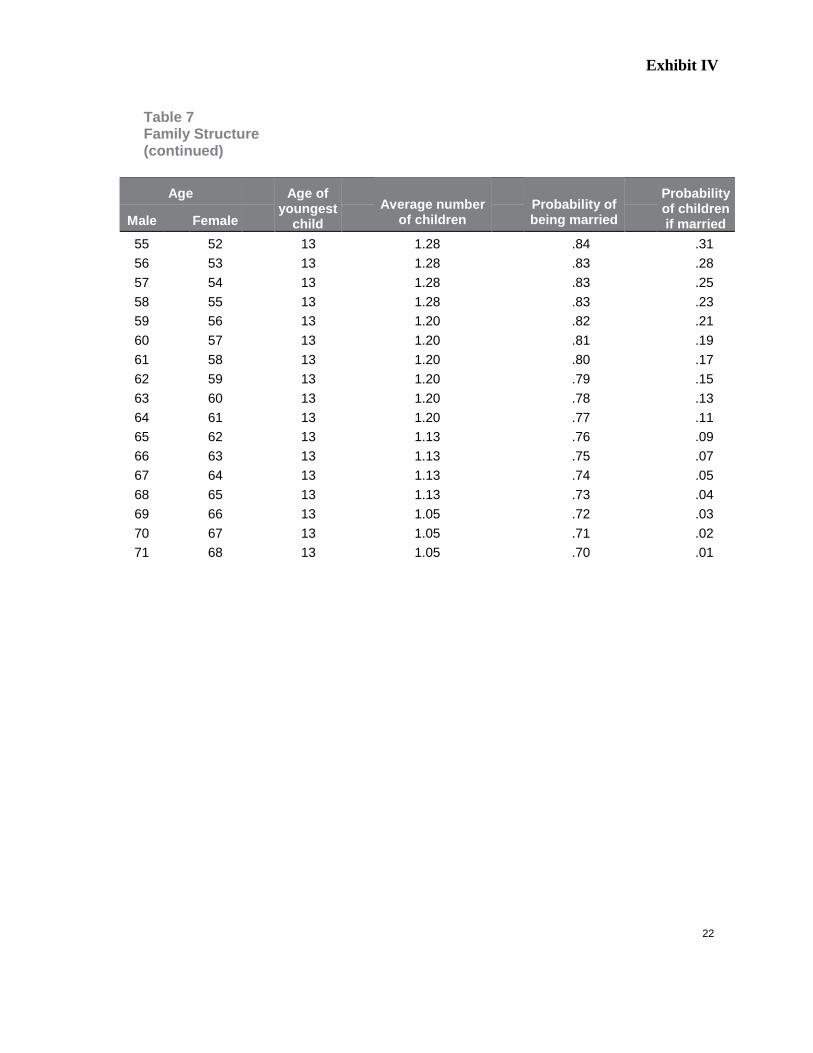
Exhibit IV
Table 7 Family Structure (continued)
Age Age of youngest
child
Average number
of children
Probability of being married
Probability of children if married Male Female
55 52 13 1.28 .84 .31 56 53 13 1.28 .83 .28 57 54 13 1.28 .83 .25 58 55 13 1.28 .83 .23 59 56 13 1.20 .82 .21 60 57 13 1.20 .81 .19 61 58 13 1.20 .80 .17 62 59 13 1.20 .79 .15 63 60 13 1.20 .78 .13 64 61 13 1.20 .77 .11 65 62 13 1.13 .76 .09 66 63 13 1.13 .75 .07 67 64 13 1.13 .74 .05 68 65 13 1.13 .73 .04 69 66 13 1.05 .72 .03 70 67 13 1.05 .71 .02 71 68 13 1.05 .70 .01
22
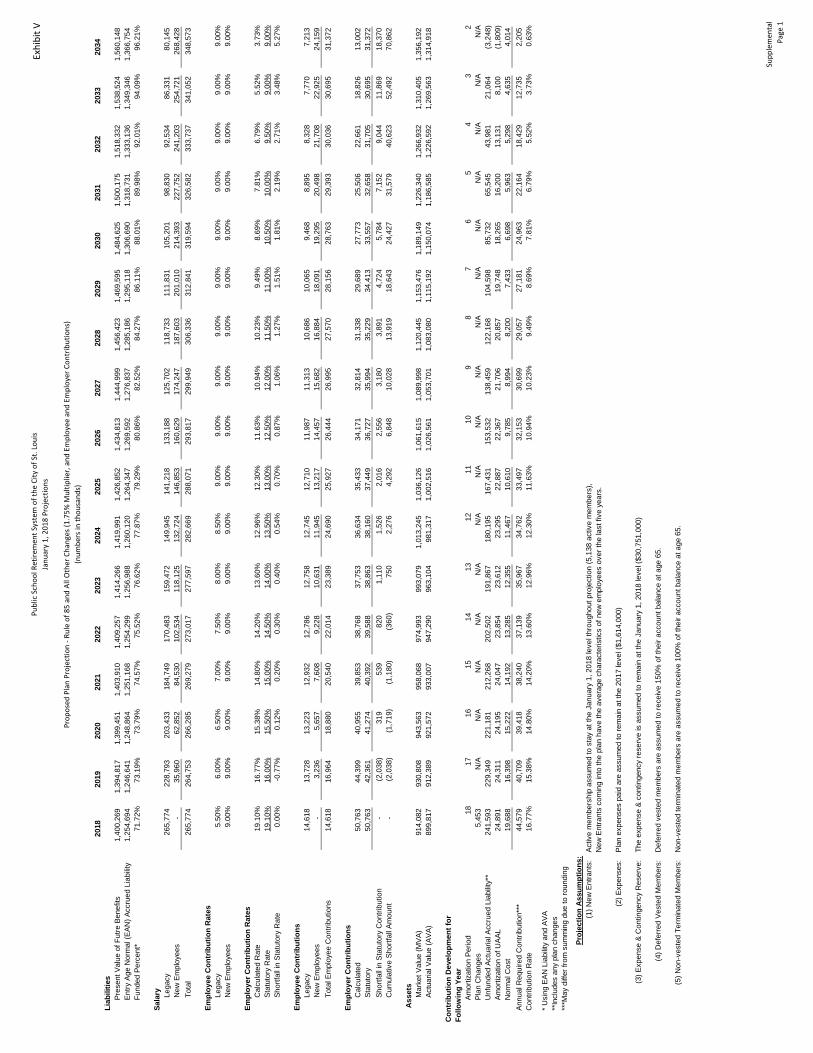
Pu
blic
Sch
oo
l Ret
irem
ent
Syst
em o
f th
e C
ity
of
St. L
ou
is
Jan
uar
y 1
, 20
18
Pro
ject
ion
s
Pro
po
sed
Pla
n P
roje
ctio
n -
Ru
le o
f 8
5 a
nd
All
Oth
er C
han
ges
(1.7
5%
Mu
ltip
lier,
an
d E
mp
loye
e an
d E
mp
loye
r C
on
trib
uti
on
s)
(nu
mb
ers
in t
ho
usa
nd
s)
Exh
ibit
V
2018
2019
2020
2021
2022
2023
2024
2025
2026
2027
2028
2029
2030
2031
2032
2033
2034
Liab
ilitie
s
Pre
sent
Val
ue o
f Fut
re B
enef
its1,
400,
269
1,39
4,81
7
1,
399,
451
1,40
3,91
0
1,
409,
257
1,41
4,26
6
1,
419,
991
1,42
6,85
2
1,
434,
813
1,44
4,99
9
1,
456,
423
1,46
9,59
5
1,
484,
625
1,50
0,17
5
1,
518,
332
1,53
8,52
4
1,
560,
148
E
ntry
Age
Nor
mal
(EAN
) Acc
rued
Lia
bilit
y1,
254,
694
1,24
6,64
1
1,
248,
864
1,25
1,16
8
1,
254,
299
1,25
6,98
8
1,
260,
120
1,26
4,34
7
1,
269,
592
1,27
6,83
7
1,
285,
186
1,29
5,11
8
1,
306,
690
1,31
8,73
1
1,
333,
136
1,34
9,34
6
1,
366,
754
F
unde
d Pe
rcen
t*71
.72%
73.1
9%73
.79%
74.5
7%75
.52%
76.6
2%77
.87%
79.2
9%80
.86%
82.5
2%84
.27%
86.1
1%88
.01%
89.9
8%92
.01%
94.0
9%96
.21%
Sala
ry
Leg
acy
265,
774
22
8,79
3
203,
433
18
4,74
9
170,
483
15
9,47
2
149,
945
14
1,21
8
133,
188
12
5,70
2
118,
733
11
1,83
1
105,
201
98
,830
92
,534
86
,331
80
,145
New
Em
ploy
ees
-
35,9
60
62,8
52
84,5
30
102,
534
11
8,12
5
132,
724
14
6,85
3
160,
629
17
4,24
7
187,
603
20
1,01
0
214,
393
22
7,75
2
241,
203
25
4,72
1
268,
428
Tot
al26
5,77
4
264,
753
26
6,28
5
269,
279
27
3,01
7
277,
597
28
2,66
9
288,
071
29
3,81
7
299,
949
30
6,33
6
312,
841
31
9,59
4
326,
582
33
3,73
7
341,
052
34
8,57
3
Empl
oyee
Con
trib
utio
n R
ates
L
egac
y5.
50%
6.00
%6.
50%
7.00
%7.
50%
8.00
%8.
50%
9.00
%9.
00%
9.00
%9.
00%
9.00
%9.
00%
9.00
%9.
00%
9.00
%9.
00%
N
ew E
mpl
oyee
s9.
00%
9.00
%9.
00%
9.00
%9.
00%
9.00
%9.
00%
9.00
%9.
00%
9.00
%9.
00%
9.00
%9.
00%
9.00
%9.
00%
9.00
%9.
00%
Empl
oyer
Con
trib
utio
n R
ates
C
alcu
late
d R
ate
19.1
0%16
.77%
15.3
8%14
.80%
14.2
0%13
.60%
12.9
6%12
.30%
11.6
3%10
.94%
10.2
3%9.
49%
8.69
%7.
81%
6.79
%5.
52%
3.73
%
Sta
tuto
ry R
ate
19.1
0%16
.00%
15.5
0%15
.00%
14.5
0%14
.00%
13.5
0%13
.00%
12.5
0%12
.00%
11.5
0%11
.00%
10.5
0%10
.00%
9.50
%9.
00%
9.00
%
Sho
rtfal
l in
Stat
utor
y R
ate
0.00
%-0
.77%
0.12
%0.
20%
0.30
%0.
40%
0.54
%0.
70%
0.87
%1.
06%
1.27
%1.
51%
1.81
%2.
19%
2.71
%3.
48%
5.27
%
Empl
oyee
Con
trib
utio
ns
Leg
acy
14,6
18
13
,728
13
,223
12
,932
12
,786
12
,758
12,7
45
12
,710
11
,987
11,3
13
10
,686
10,0
65
9,46
8
8,
895
8,32
8
7,
770
7,21
3
New
Em
ploy
ees
-
3,23
6
5,
657
7,60
8
9,
228
10,6
31
11
,945
13,2
17
14,4
57
15
,682
16,8
84
18
,091
19
,295
20
,498
21
,708
22
,925
24
,159
Tot
al E
mpl
oyee
Con
tribu
tions
14,6
18
16
,964
18
,880
20
,540
22
,014
23
,389
24,6
90
25
,927
26
,444
26,9
95
27
,570
28,1
56
28,7
63
29,3
93
30,0
36
30,6
95
31,3
72
Empl
oyer
Con
trib
utio
ns
Cal
cula
ted
50,7
63
44
,399
40
,955
39
,853
38
,768
37
,753
36,6
34
35
,433
34
,171
32,8
14
31
,338
29,6
89
27,7
73
25,5
06
22,6
61
18,8
26
13,0
02
S
tatu
tory
50,7
63
42
,361
41
,274
40
,392
39
,588
38
,863
38,1
60
37
,449
36
,727
35,9
94
35
,229
34,4
13
33,5
57
32,6
58
31,7
05
30,6
95
31,3
72
S
hortf
all i
n St
atut
ory
Con
tribu
tion
-
(2,0
38)
319
53
9
820
1,
110
1,52
6
2,
016
2,55
6
3,
180
3,89
1
4,
724
5,78
4
7,
152
9,04
4
11
,869
18
,370
Cum
ulat
ive
Shor
tfall
Amou
nt-
(2
,038
)
(1
,719
)
(1
,180
)
(3
60)
750
2,
276
4,29
2
6,
848
10,0
28
13
,919
18,6
43
24,4
27
31,5
79
40,6
23
52,4
92
70,8
62
Ass
ets
M
arke
t Val
ue (M
VA)
914,
082
93
0,80
8
943,
563
95
8,06
8
974,
993
99
3,07
9
1,01
3,24
5
1,
036,
126
1,06
1,61
5
1,
089,
998
1,12
0,44
5
1,
153,
476
1,18
9,14
9
1,
226,
340
1,26
6,93
2
1,
310,
405
1,35
6,19
2
Act
uaria
l Val
ue (A
VA)
899,
817
91
2,38
9
921,
572
93
3,00
7
947,
290
96
3,10
4
981,
317
1,
002,
516
1,02
6,56
1
1,
053,
701
1,08
3,08
0
1,
115,
192
1,15
0,07
4
1,
186,
585
1,22
6,59
2
1,
269,
563
1,31
4,91
8
A
mor
tizat
ion
Perio
d18
1716
1514
1312
1110
98
76
54
32
P
lan
Cha
nges
5,45
3
N
/AN
/AN
/AN
/AN
/AN
/AN
/AN
/AN
/AN
/AN
/AN
/AN
/AN
/AN
/AN
/A
Unf
unde
d Ac
tuar
ial A
ccru
ed L
iabi
lity*
*24
1,59
3
229,
349
22
1,18
1
212,
268
20
2,50
2
191,
867
18
0,19
5
167,
431
15
3,53
2
138,
459
12
2,16
8
104,
598
85
,732
65
,545
43
,981
21
,064
(3
,248
)
Am
ortiz
atio
n of
UAA
L24
,891
24,3
11
24,1
95
24,0
47
23,8
54
23,6
12
23
,295
22,8
87
22,3
67
21
,706
20,8
57
19
,748
18
,265
16
,200
13
,131
8,
100
(1,8
09)
N
orm
al C
ost
19,6
88
16
,398
15
,222
14
,192
13
,285
12
,355
11,4
67
10
,610
9,
785
8,99
4
8,
200
7,43
3
6,
698
5,96
3
5,
298
4,63
5
4,
014
Annu
al R
equi
red
Con
tribu
tion*
**44
,579
40,7
09
39,4
18
38,2
40
37,1
39
35,9
67
34
,762
33,4
97
32,1
53
30
,699
29,0
57
27
,181
24
,963
22
,164
18
,429
12
,735
2,
205
Con
tribu
tion
Rat
e16
.77%
15.3
8%14
.80%
14.2
0%13
.60%
12.9
6%12
.30%
11.6
3%10
.94%
10.2
3%9.
49%
8.69
%7.
81%
6.79
%5.
52%
3.73
%0.
63%
* Usi
ng E
AN L
iabi
lity
and
AVA
**In
clud
es a
ny p
lan
chan
ges
***M
ay d
iffer
from
sum
min
g du
e to
roun
ding
Proj
ectio
n A
ssum
ptio
ns:
(1) N
ew E
ntra
nts:
Ac
tive
mem
bers
hip
assu
med
to s
tay
at th
e Ja
nuar
y 1,
201
8 le
vel t
hrou
ghou
t pro
ject
ion
(5,1
38 a
ctiv
e m
embe
rs),
New
Ent
rant
s co
min
g in
to th
e pl
an h
ave
the
aver
age
char
acte
ristic
s of
new
em
ploy
ees
over
the
last
five
yea
rs.
(2) E
xpen
ses:
Pl
an e
xpen
ses
paid
are
ass
umed
to re
mai
n at
the
2017
leve
l ($1
,614
,000
)
(3) E
xpen
se &
Con
tinge
ncy
Res
erve
: Th
e ex
pens
e &
cont
inge
ncy
rese
rve
is a
ssum
ed to
rem
ain
at th
e Ja
nuar
y 1,
201
8 le
vel (
$30,
751,
000)
(4) D
efer
red
Vest
ed M
embe
rs:
Def
erre
d ve
sted
mem
bers
are
ass
umed
to re
ceiv
e 15
0% o
f the
ir ac
coun
t bal
ance
at a
ge 6
5.
(5) N
on-v
este
d Te
rmin
ated
Mem
bers
: N
on-v
este
d te
rmin
ated
mem
bers
are
ass
umed
to re
ceiv
e 10
0% o
f the
ir ac
coun
t bal
ance
at a
ge 6
5.
Con
trib
utio
n D
evel
opm
ent f
or
Follo
win
g Ye
ar
Sup
ple
men
tal
Pag
e 1
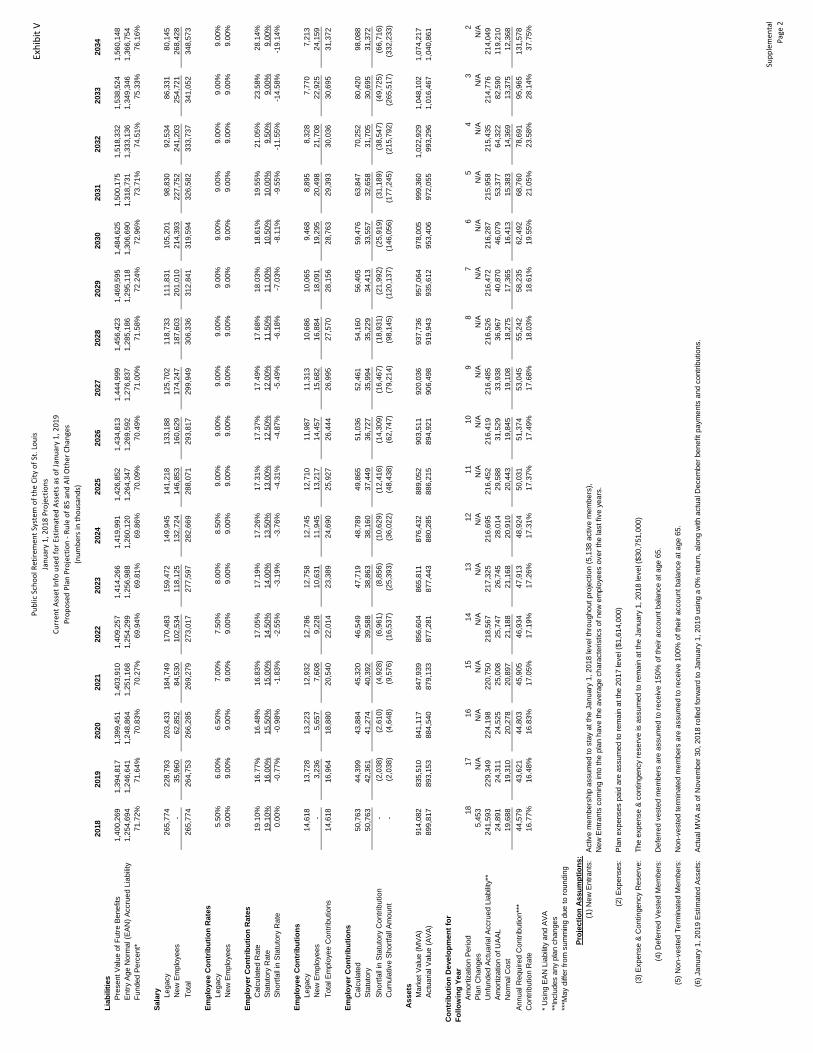
Pu
blic
Sch
oo
l Ret
irem
ent
Syst
em o
f th
e C
ity
of
St. L
ou
is
Jan
uar
y 1
, 20
18
Pro
ject
ion
s
Cu
rren
t A
sset
Info
use
d f
or
Esti
mat
ed A
sset
s as
of
Jan
uar
y 1
, 20
19
Pro
po
sed
Pla
n P
roje
ctio
n -
Ru
le o
f 8
5 a
nd
All
Oth
er C
han
ges
(nu
mb
ers
in t
ho
usa
nd
s)
Exh
ibit
V
2018
2019
2020
2021
2022
2023
2024
2025
2026
2027
2028
2029
2030
2031
2032
2033
2034
Liab
ilitie
s
Pre
sent
Val
ue o
f Fut
re B
enef
its1,
400,
269
1,39
4,81
7
1,
399,
451
1,40
3,91
0
1,
409,
257
1,41
4,26
6
1,
419,
991
1,42
6,85
2
1,
434,
813
1,44
4,99
9
1,
456,
423
1,46
9,59
5
1,
484,
625
1,50
0,17
5
1,
518,
332
1,53
8,52
4
1,
560,
148
E
ntry
Age
Nor
mal
(EAN
) Acc
rued
Lia
bilit
y1,
254,
694
1,24
6,64
1
1,
248,
864
1,25
1,16
8
1,
254,
299
1,25
6,98
8
1,
260,
120
1,26
4,34
7
1,
269,
592
1,27
6,83
7
1,
285,
186
1,29
5,11
8
1,
306,
690
1,31
8,73
1
1,
333,
136
1,34
9,34
6
1,
366,
754
F
unde
d Pe
rcen
t*71
.72%
71.6
4%70
.83%
70.2
7%69
.94%
69.8
1%69
.86%
70.0
9%70
.49%
71.0
0%71
.58%
72.2
4%72
.96%
73.7
1%74
.51%
75.3
3%76
.16%
Sala
ry
Leg
acy
265,
774
22
8,79
3
203,
433
18
4,74
9
170,
483
15
9,47
2
149,
945
14
1,21
8
133,
188
12
5,70
2
118,
733
11
1,83
1
105,
201
98
,830
92
,534
86
,331
80
,145
New
Em
ploy
ees
-
35,9
60
62,8
52
84,5
30
102,
534
11
8,12
5
132,
724
14
6,85
3
160,
629
17
4,24
7
187,
603
20
1,01
0
214,
393
22
7,75
2
241,
203
25
4,72
1
268,
428
Tot
al26
5,77
4
264,
753
26
6,28
5
269,
279
27
3,01
7
277,
597
28
2,66
9
288,
071
29
3,81
7
299,
949
30
6,33
6
312,
841
31
9,59
4
326,
582
33
3,73
7
341,
052
34
8,57
3
Empl
oyee
Con
trib
utio
n R
ates
L
egac
y5.
50%
6.00
%6.
50%
7.00
%7.
50%
8.00
%8.
50%
9.00
%9.
00%
9.00
%9.
00%
9.00
%9.
00%
9.00
%9.
00%
9.00
%9.
00%
N
ew E
mpl
oyee
s9.
00%
9.00
%9.
00%
9.00
%9.
00%
9.00
%9.
00%
9.00
%9.
00%
9.00
%9.
00%
9.00
%9.
00%
9.00
%9.
00%
9.00
%9.
00%
Empl
oyer
Con
trib
utio
n R
ates
C
alcu
late
d R
ate
19.1
0%16
.77%
16.4
8%16
.83%
17.0
5%17
.19%
17.2
6%17
.31%
17.3
7%17
.49%
17.6
8%18
.03%
18.6
1%19
.55%
21.0
5%23
.58%
28.1
4%
Sta
tuto
ry R
ate
19.1
0%16
.00%
15.5
0%15
.00%
14.5
0%14
.00%
13.5
0%13
.00%
12.5
0%12
.00%
11.5
0%11
.00%
10.5
0%10
.00%
9.50
%9.
00%
9.00
%
Sho
rtfal
l in
Stat
utor
y R
ate
0.00
%-0
.77%
-0.9
8%-1
.83%
-2.5
5%-3
.19%
-3.7
6%-4
.31%
-4.8
7%-5
.49%
-6.1
8%-7
.03%
-8.1
1%-9
.55%
-11.
55%
-14.
58%
-19.
14%
Empl
oyee
Con
trib
utio
ns
Leg
acy
14,6
18
13
,728
13
,223
12
,932
12
,786
12
,758
12,7
45
12
,710
11
,987
11,3
13
10
,686
10,0
65
9,46
8
8,
895
8,32
8
7,
770
7,21
3
New
Em
ploy
ees
-
3,23
6
5,
657
7,60
8
9,
228
10,6
31
11
,945
13,2
17
14,4
57
15
,682
16,8
84
18
,091
19
,295
20
,498
21
,708
22
,925
24
,159
Tot
al E
mpl
oyee
Con
tribu
tions
14,6
18
16
,964
18
,880
20
,540
22
,014
23
,389
24,6
90
25
,927
26
,444
26,9
95
27
,570
28,1
56
28,7
63
29,3
93
30,0
36
30,6
95
31,3
72
Empl
oyer
Con
trib
utio
ns
Cal
cula
ted
50,7
63
44
,399
43
,884
45
,320
46
,549
47
,719
48,7
89
49
,865
51
,036
52,4
61
54
,160
56,4
05
59,4
76
63,8
47
70,2
52
80,4
20
98,0
88
S
tatu
tory
50,7
63
42
,361
41
,274
40
,392
39
,588
38
,863
38,1
60
37
,449
36
,727
35,9
94
35
,229
34,4
13
33,5
57
32,6
58
31,7
05
30,6
95
31,3
72
S
hortf
all i
n St
atut
ory
Con
tribu
tion
-
(2,0
38)
(2,6
10)
(4,9
28)
(6,9
61)
(8
,856
)
(1
0,62
9)
(12,
416)
(1
4,30
9)
(16,
467)
(1
8,93
1)
(21,
992)
(2
5,91
9)
(31,
189)
(3
8,54
7)
(49,
725)
(6
6,71
6)
C
umul
ativ
e Sh
ortfa
ll Am
ount
-
(2,0
38)
(4,6
48)
(9,5
76)
(16,
537)
(2
5,39
3)
(36,
022)
(4
8,43
8)
(62,
747)
(7
9,21
4)
(98,
145)
(1
20,1
37)
(146
,056
)
(1
77,2
45)
(215
,792
)
(2
65,5
17)
(332
,233
)
Ass
ets
M
arke
t Val
ue (M
VA)
914,
082
83
5,51
0
841,
117
84
7,93
9
856,
604
86
5,81
1
876,
432
88
9,05
2
903,
511
92
0,03
6
937,
736
95
7,06
4
978,
005
99
9,36
0
1,02
2,92
9
1,
048,
102
1,07
4,21
7
Act
uaria
l Val
ue (A
VA)
899,
817
89
3,15
3
884,
540
87
9,13
3
877,
281
87
7,44
3
880,
285
88
6,21
5
894,
921
90
6,49
8
919,
943
93
5,61
2
953,
406
97
2,05
5
993,
296
1,
016,
467
1,04
0,86
1
A
mor
tizat
ion
Perio
d18
1716
1514
1312
1110
98
76
54
32
P
lan
Cha
nges
5,45
3
N
/AN
/AN
/AN
/AN
/AN
/AN
/AN
/AN
/AN
/AN
/AN
/AN
/AN
/AN
/AN
/A
Unf
unde
d Ac
tuar
ial A
ccru
ed L
iabi
lity*
*24
1,59
3
229,
349
22
4,19
8
220,
750
21
8,56
7
217,
325
21
6,69
5
216,
452
21
6,41
9
216,
485
21
6,52
6
216,
472
21
6,28
7
215,
958
21
5,43
5
214,
776
21
4,04
9
A
mor
tizat
ion
of U
AAL
24,8
91
24
,311
24
,525
25
,008
25
,747
26
,745
28,0
14
29
,588
31
,529
33,9
38
36
,967
40,8
70
46,0
79
53,3
77
64,3
22
82,5
90
119,
210
Nor
mal
Cos
t19
,688
19,3
10
20,2
78
20,8
97
21,1
88
21,1
68
20
,910
20,4
43
19,8
45
19
,108
18,2
75
17
,365
16
,413
15
,383
14
,369
13
,375
12
,368
An
nual
Req
uire
d C
ontri
butio
n***
44,5
79
43
,621
44
,803
45
,905
46
,934
47
,913
48,9
24
50
,031
51
,374
53,0
45
55
,242
58,2
35
62,4
92
68,7
60
78,6
91
95,9
65
131,
578
C
ontri
butio
n R
ate
16.7
7%16
.48%
16.8
3%17
.05%
17.1
9%17
.26%
17.3
1%17
.37%
17.4
9%17
.68%
18.0
3%18
.61%
19.5
5%21
.05%
23.5
8%28
.14%
37.7
5%
* Usi
ng E
AN L
iabi
lity
and
AVA
**In
clud
es a
ny p
lan
chan
ges
***M
ay d
iffer
from
sum
min
g du
e to
roun
ding
Proj
ectio
n A
ssum
ptio
ns:
(1) N
ew E
ntra
nts:
Ac
tive
mem
bers
hip
assu
med
to s
tay
at th
e Ja
nuar
y 1,
201
8 le
vel t
hrou
ghou
t pro
ject
ion
(5,1
38 a
ctiv
e m
embe
rs),
New
Ent
rant
s co
min
g in
to th
e pl
an h
ave
the
aver
age
char
acte
ristic
s of
new
em
ploy
ees
over
the
last
five
yea
rs.
(2) E
xpen
ses:
Pl
an e
xpen
ses
paid
are
ass
umed
to re
mai
n at
the
2017
leve
l ($1
,614
,000
)
(3) E
xpen
se &
Con
tinge
ncy
Res
erve
: Th
e ex
pens
e &
cont
inge
ncy
rese
rve
is a
ssum
ed to
rem
ain
at th
e Ja
nuar
y 1,
201
8 le
vel (
$30,
751,
000)
(4) D
efer
red
Vest
ed M
embe
rs:
Def
erre
d ve
sted
mem
bers
are
ass
umed
to re
ceiv
e 15
0% o
f the
ir ac
coun
t bal
ance
at a
ge 6
5.
(5) N
on-v
este
d Te
rmin
ated
Mem
bers
: N
on-v
este
d te
rmin
ated
mem
bers
are
ass
umed
to re
ceiv
e 10
0% o
f the
ir ac
coun
t bal
ance
at a
ge 6
5.
(6) J
anua
ry 1
, 201
9 Es
timat
ed A
sset
s:
Actu
al M
VA a
s of
Nov
embe
r 30,
201
8 ro
lled
forw
ard
to J
anua
ry 1
, 201
9 us
ing
a 0%
retu
rn, a
long
with
act
ual D
ecem
ber b
enef
it pa
ymen
ts a
nd c
ontri
butio
ns.
Con
trib
utio
n D
evel
opm
ent f
or
Follo
win
g Ye
ar
Sup
ple
men
tal
Pag
e 2

TAB 5
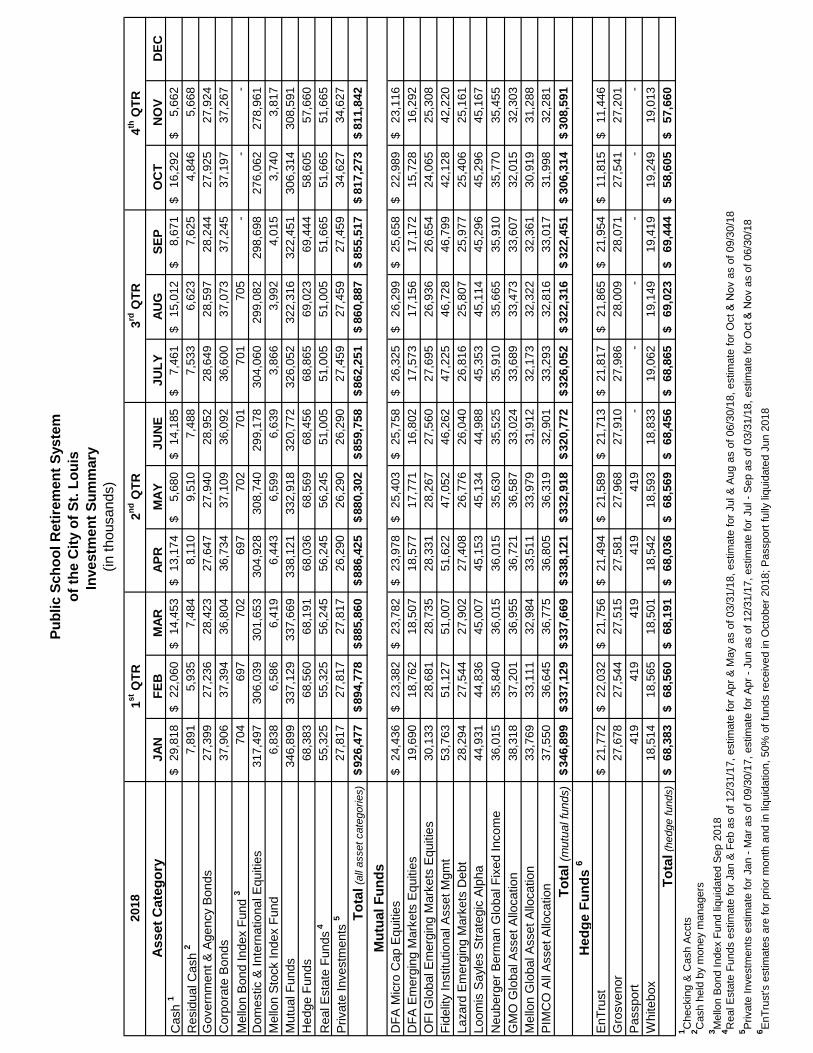
Publ
ic S
choo
l Ret
irem
ent S
yste
mof
the
City
of S
t. Lo
uis
In
vest
men
t Sum
mar
y(in
thou
sand
s)
2018
Asse
t Cat
egor
yJA
NFE
BM
ARAP
RM
AYJU
NE
JULY
AUG
SEP
OC
TN
OV
DEC
Cas
h 1
29,8
18$
22
,060
$
14,4
53$
13
,174
$
5,68
0$
14,1
85$
7,
461
$
15
,012
$
8,67
1$
16,2
92$
5,
662
$
R
esid
ual C
ash
27,
891
5,
935
7,
484
8,
110
9,
510
7,
488
7,
533
6,
623
7,
625
4,
846
5,
668
G
over
nmen
t & A
genc
y B
onds
27,3
99
27
,236
28,4
23
27
,647
27,9
40
28
,952
28,6
49
28
,597
28,2
44
27
,925
27,9
24
C
orpo
rate
Bon
ds37
,906
37,3
94
36
,804
36,7
34
37
,109
36,0
92
36
,600
37,0
73
37
,245
37,1
97
37
,267
Mel
lon
Bon
d In
dex
Fund
370
4
69
7
70
2
69
7
70
2
70
1
70
1
70
5
-
- -
Dom
estic
& In
tern
atio
nal E
quiti
es31
7,49
7
306,
039
30
1,65
3
304,
928
30
8,74
0
299,
178
30
4,06
0
299,
082
29
8,69
8
276,
062
27
8,96
1
Mel
lon
Sto
ck In
dex
Fund
6,83
8
6,58
6
6,41
9
6,44
3
6,59
9
6,63
9
3,86
6
3,99
2
4,01
5
3,74
0
3,81
7
Mut
ual F
unds
34
6,89
9
337,
129
33
7,66
9
338,
121
33
2,91
8
320,
772
32
6,05
2
322,
316
32
2,45
1
306,
314
30
8,59
1
-
Hed
ge F
unds
68,3
83
68
,560
68,1
91
68
,036
68,5
69
68
,456
68,8
65
69
,023
69,4
44
58
,605
57,6
60
-
R
eal E
stat
e Fu
nds 4
55,3
25
55
,325
56,2
45
56
,245
56,2
45
51
,005
51,0
05
51
,005
51,6
65
51
,665
51,6
65
P
rivat
e In
vest
men
ts 5
27,8
17
27
,817
27,8
17
26
,290
26,2
90
26
,290
27,4
59
27
,459
27,4
59
34
,627
34,6
27
To
tal (
all a
sset
cat
egor
ies)
926,
477
$ 89
4,77
8$
885,
860
$ 88
6,42
5$
880,
302
$ 85
9,75
8$
862,
251
$ 86
0,88
7$
855,
517
$ 81
7,27
3$
811,
842
$ -
$
Mut
ual F
unds
DFA
Mic
ro C
ap E
quiti
es24
,436
$
23,3
82$
23
,782
$
23,9
78$
25
,403
$
25,7
58$
26
,325
$
26,2
99$
25
,658
$
22,9
89$
23
,116
$
DFA
Em
ergi
ng M
arke
ts E
quiti
es19
,690
18,7
62
18
,507
18,5
77
17
,771
16,8
02
17
,573
17,1
56
17
,172
15,7
28
16
,292
OFI
Glo
bal E
mer
ging
Mar
kets
Equ
ities
30,1
33
28
,681
28,7
35
28
,331
28,2
67
27
,560
27,6
95
26
,936
26,6
54
24
,065
25,3
08
Fi
delit
y In
stitu
tiona
l Ass
et M
gmt
53,7
63
51
,127
51,0
07
51
,622
47,0
52
46
,262
47,2
25
46
,728
46,7
99
42
,128
42,2
20
La
zard
Em
ergi
ng M
arke
ts D
ebt
28,2
94
27
,544
27,9
02
27
,408
26,7
76
26
,040
26,8
16
25
,807
25,9
77
25
,406
25,1
61
Lo
omis
Say
les
Stra
tegi
c A
lpha
44,9
31
44
,836
45,0
07
45
,153
45,1
34
44
,988
45,3
53
45
,114
45,2
96
45
,296
45,1
67
N
eube
rger
Ber
man
Glo
bal F
ixed
Inco
me
36,0
15
35
,840
36,0
15
36
,015
35,6
30
35
,525
35,9
10
35
,665
35,9
10
35
,770
35,4
55
G
MO
Glo
bal A
sset
Allo
catio
n38
,318
37,2
01
36
,955
36,7
21
36
,587
33,0
24
33
,689
33,4
73
33
,607
32,0
15
32
,303
Mel
lon
Glo
bal A
sset
Allo
catio
n33
,769
33,1
11
32
,984
33,5
11
33
,979
31,9
12
32
,173
32,3
22
32
,361
30,9
19
31
,288
PIM
CO
All
Ass
et A
lloca
tion
37,5
50
36
,645
36,7
75
36
,805
36,3
19
32
,901
33,2
93
32
,816
33,0
17
31
,998
32,2
81
To
tal (
mut
ual f
unds
)34
6,89
9$
337,
129
$ 33
7,66
9$
338,
121
$ 33
2,91
8$
320,
772
$ 32
6,05
2$
322,
316
$ 32
2,45
1$
306,
314
$ 30
8,59
1$
-$
Hed
ge F
unds
6
EnT
rust
21,7
72$
22
,032
$
21,7
56$
21
,494
$
21,5
89$
21
,713
$
21,8
17$
21
,865
$
21,9
54$
11
,815
$
11,4
46$
G
rosv
enor
27,6
78
27
,544
27,5
15
27
,581
27,9
68
27
,910
27,9
86
28
,009
28,0
71
27
,541
27,2
01
P
assp
ort
419
419
419
419
419
-
-
- -
- -
Whi
tebo
x18
,514
18,5
65
18
,501
18,5
42
18
,593
18,8
33
19
,062
19,1
49
19
,419
19,2
49
19
,013
Tota
l (he
dge
fund
s)68
,383
$
68,5
60$
68
,191
$
68,0
36$
68
,569
$
68,4
56$
68
,865
$
69,0
23$
69
,444
$
58,6
05$
57
,660
$
-$
1 Che
ckin
g &
Cas
h A
ccts
498,
424
53
9,82
4
2 Cas
h he
ld b
y m
oney
man
ager
s3 M
ello
n Bo
nd In
dex
Fund
liqu
idat
ed S
ep 2
018
4 Rea
l Est
ate
Fund
s es
timat
e fo
r Jan
& F
eb a
s of
12/
31/1
7, e
stim
ate
for A
pr &
May
as
of 0
3/31
/18,
est
imat
e fo
r Jul
& A
ug a
s of
06/
30/1
8, e
stim
ate
for O
ct &
Nov
as
of 0
9/30
/18
5 Priv
ate
Inve
stm
ents
est
imat
e fo
r Jan
- M
ar a
s of
09/
30/1
7, e
stim
ate
for A
pr -
Jun
as o
f 12/
31/1
7, e
stim
ate
for J
ul -
Sep
as o
f 03/
31/1
8, e
stim
ate
for O
ct &
Nov
as
of 0
6/30
/18
6 EnTr
ust's
est
imat
es a
re fo
r prio
r mon
th a
nd in
liqu
idat
ion,
50%
of f
unds
rece
ived
in O
ctob
er 2
018;
Pas
spor
t ful
ly li
quid
ated
Jun
201
8
1st Q
TR2nd
QTR
3rd Q
TR4th
QTR
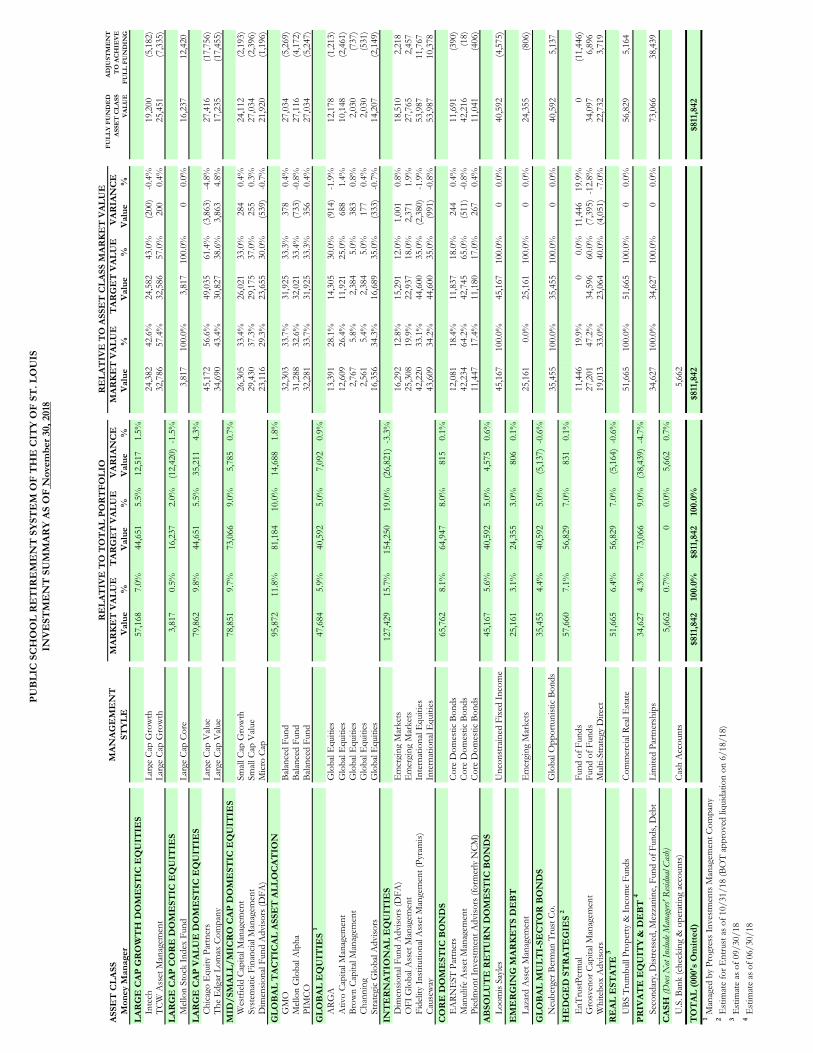
PUB
LIC
SC
HO
OL
RE
TIR
EM
EN
T S
YST
EM
OF
TH
E C
ITY
OF
ST. L
OU
ISIN
VE
STM
EN
T S
UM
MA
RY
AS
OF
Nov
embe
r 30,
201
8
Mon
ey M
anag
erV
alue
%
Val
ue
%V
alue
%
Val
ue
%V
alue
%
Val
ue
%LA
RG
E C
AP
GR
OW
TH
DO
ME
STIC
EQ
UIT
IES
57,1
687.
0%44
,651
5.5%
12,5
171.
5%In
tech
Larg
e C
ap G
row
th24
,382
42.6
%24
,582
43.0
%(2
00)
-0.4
%19
,200
(5,1
82)
TCW
Ass
et M
anag
emen
tLa
rge
Cap
Gro
wth
32,7
8657
.4%
32,5
8657
.0%
200
0.4%
25,4
51(7
,335
)LA
RG
E C
AP
CO
RE
DO
ME
STIC
EQ
UIT
IES
3,81
70.
5%16
,237
2.0%
(12,
420)
-1.5
%M
ello
n St
ock
Inde
x Fu
ndLa
rge
Cap
Cor
e3,
817
100.
0%3,
817
100.
0%0
0.0%
16,2
3712
,420
LAR
GE
CA
P V
ALU
E D
OM
EST
IC E
QU
ITIE
S79
,862
9.8%
44,6
515.
5%35
,211
4.3%
Chi
cago
Equ
ity P
artn
ers
Larg
e C
ap V
alue
45,1
7256
.6%
49,0
3561
.4%
(3,8
63)
-4.8
%27
,416
(17,
756)
The
Edg
ar L
omax
Com
pany
Larg
e C
ap V
alue
34,6
9043
.4%
30,8
2738
.6%
3,86
34.
8%17
,235
(17,
455)
MID
/SM
ALL
/MIC
RO
CA
P D
OM
EST
IC E
QU
ITIE
S78
,851
9.7%
73,0
669.
0%5,
785
0.7%
Wes
tfiel
d C
apita
l Man
agem
ent
Smal
l Cap
Gro
wth
26,3
0533
.4%
26,0
2133
.0%
284
0.4%
24,1
12(2
,193
)Sy
stem
atic
Fin
anci
al M
anag
emen
tSm
all C
ap V
alue
29,4
3037
.3%
29,1
7537
.0%
255
0.3%
27,0
34(2
,396
)D
imen
siona
l Fun
d A
dviso
rs (D
FA)
Mic
ro C
ap23
,116
29.3
%23
,655
30.0
%(5
39)
-0.7
%21
,920
(1,1
96)
GLO
BA
L T
AC
TIC
AL
ASS
ET
ALL
OC
AT
ION
95,8
7211
.8%
81,1
8410
.0%
14,6
881.
8%G
MO
Bala
nced
Fun
d32
,303
33.7
%31
,925
33.3
%37
80.
4%27
,034
(5,2
69)
Mel
lon
Glo
bal A
lpha
Bala
nced
Fun
d31
,288
32.6
%32
,021
33.4
%(7
33)
-0.8
%27
,116
(4,1
72)
PIM
CO
Bala
nced
Fun
d32
,281
33.7
%31
,925
33.3
%35
60.
4%27
,034
(5,2
47)
GLO
BA
L E
QU
ITIE
S 1
47,6
845.
9%40
,592
5.0%
7,09
20.
9%A
RG
AG
loba
l Equ
ities
13,3
9128
.1%
14,3
0530
.0%
(914
)-1
.9%
12,1
78(1
,213
)A
tivo
Cap
ital M
anag
emen
tG
loba
l Equ
ities
12,6
0926
.4%
11,9
2125
.0%
688
1.4%
10,1
48(2
,461
)Br
own
Cap
ital M
anag
emen
tG
loba
l Equ
ities
2,76
75.
8%2,
384
5.0%
383
0.8%
2,03
0(7
37)
Cha
nnin
gG
loba
l Equ
ities
2,56
15.
4%2,
384
5.0%
177
0.4%
2,03
0(5
31)
Stra
tegi
c G
loba
l Adv
isors
Glo
bal E
quiti
es16
,356
34.3
%16
,689
35.0
%(3
33)
-0.7
%14
,207
(2,1
49)
INT
ER
NA
TIO
NA
L E
QU
ITIE
S12
7,42
915
.7%
154,
250
19.0
%(2
6,82
1)-3
.3%
Dim
ensio
nal F
und
Adv
isors
(DFA
)E
mer
ging
Mar
kets
16,2
9212
.8%
15,2
9112
.0%
1,00
10.
8%18
,510
2,21
8O
FI G
loba
l Ass
et M
anag
emen
tE
mer
ging
Mar
kets
25,3
0819
.9%
22,9
3718
.0%
2,37
11.
9%27
,765
2,45
7Fi
delit
y In
stitu
tiona
l Ass
et M
ange
men
t (Py
ram
is)In
tern
atio
nal E
quiti
es42
,220
33.1
%44
,600
35.0
%(2
,380
)-1
.9%
53,9
8711
,767
Cau
sew
ayIn
tern
atio
nal E
quiti
es43
,609
34.2
%44
,600
35.0
%(9
91)
-0.8
%53
,987
10,3
78C
OR
E D
OM
EST
IC B
ON
DS
65,7
628.
1%64
,947
8.0%
815
0.1%
EA
RN
EST
Par
tner
sC
ore
Dom
estic
Bon
ds12
,081
18.4
%11
,837
18.0
%24
40.
4%11
,691
(390
)M
anul
ife A
sset
Man
agem
ent
Cor
e D
omes
tic B
onds
42,2
3464
.2%
42,7
4565
.0%
(511
)-0
.8%
42,2
16(1
8)Pi
edm
ont I
nves
tmen
t Adv
isors
(for
mer
ly N
CM
)C
ore
Dom
estic
Bon
ds11
,447
17.4
%11
,180
17.0
%26
70.
4%11
,041
(406
)A
BSO
LUT
E R
ET
UR
N D
OM
EST
IC B
ON
DS
45,1
675.
6%40
,592
5.0%
4,57
50.
6%Lo
omis
Sayl
esU
ncon
stra
ined
Fix
ed In
com
e45
,167
100.
0%45
,167
100.
0%0
0.0%
40,5
92(4
,575
)E
ME
RG
ING
MA
RK
ET
S D
EB
T25
,161
3.1%
24,3
553.
0%80
60.
1%La
zard
Ass
et M
anag
emen
tE
mer
ging
Mar
kets
25,1
610.
0%25
,161
100.
0%0
0.0%
24,3
55(8
06)
GLO
BA
L M
ULT
I-SE
CT
OR
BO
ND
S35
,455
4.4%
40,5
925.
0%(5
,137
)-0
.6%
Neu
berg
er B
erm
an T
rust
Co.
Glo
bal O
ppor
tuni
stic
Bon
ds35
,455
100.
0%35
,455
100.
0%0
0.0%
40,5
925,
137
HE
DG
ED
ST
RA
TE
GIE
S 2
57,6
607.
1%56
,829
7.0%
831
0.1%
EnT
rust
Perm
alFu
nd o
f Fun
ds11
,446
19.9
%0
0.0%
11,4
4619
.9%
0(1
1,44
6)G
rosv
enor
Cap
ital M
anag
emen
tFu
nd o
f Fun
ds27
,201
47
.2%
34,5
9660
.0%
(7,3
95)
-12.
8%34
,097
6,89
6W
hite
box
Adv
isors
Mul
ti-St
rate
gy D
irect
19,0
1333
.0%
23,0
6440
.0%
(4,0
51)
-7.0
%22
,732
3,71
9R
EA
L E
STA
TE
3 51
,665
6.4%
56,8
297.
0%(5
,164
)-0
.6%
UBS
Tru
mbu
ll Pr
oper
ty &
Inco
me
Fund
sC
omm
erci
al R
eal E
stat
e51
,665
100.
0%51
,665
100.
0%0
0.0%
56,8
295,
164
PRIV
AT
E E
QU
ITY
& D
EB
T 4
34,6
274.
3%73
,066
9.0%
(38,
439)
-4.7
%Se
cond
ary,
Dist
ress
ed, M
ezza
nine
, Fun
d of
Fun
ds, D
ebt
Lim
ited
Partn
ersh
ips
34,6
2710
0.0%
34,6
2710
0.0%
00.
0%73
,066
38,4
39C
ASH
(Does
Not
Inclu
de M
anag
ers' R
esidu
al Ca
sh)
5,66
20.
7%0
0.0%
5,66
20.
7%U
.S. B
ank
(che
ckin
g &
ope
ratin
g ac
coun
ts)
Cas
h A
ccou
nts
5,66
2T
OT
AL
(000
's O
mitt
ed)
$811
,842
100.
0%$8
11,8
4210
0.0%
$811
,842
$811
,842
1M
anag
ed b
y Pr
ogre
ss In
vest
men
ts M
anag
emen
t Com
pany
2E
stim
ate
for E
ntru
st a
s of 1
0/31
/18
(BO
T ap
prov
ed li
quid
atio
n on
6/1
8/18
)3
Est
imat
e as
of 0
9/30
/18
4E
stim
ate
as o
f 06/
30/1
8
ASS
ET
CLA
SSA
DJU
STM
EN
TT
O A
CH
IEV
EFU
LL
FU
ND
ING
TA
RG
ET
VA
LUE
V
AR
IAN
CE
RE
LAT
IVE
TO
TO
TA
L PO
RT
FOLI
OR
ELA
TIV
E T
O A
SSE
T C
LASS
MA
RK
ET
VA
LUE
MA
RK
ET
VA
LUE
TA
RG
ET
VA
LUE
VA
RIA
NC
EM
AR
KE
T V
ALU
E
MA
NA
GE
ME
NT
STY
LE
FUL
LY
FU
ND
ED
ASS
ET
CL
ASS
VA
LU
E

Publ
ic S
choo
l Ret
irem
ent S
yste
mof
the
City
of S
t. Lo
uis
In
vest
men
t Sum
mar
y(in
thou
sand
s)
2018
Ass
et C
ateg
ory
JAN
FEB
MAR
APR
MAY
JUN
EJU
LYAU
GSE
PO
CT
NO
VD
ECC
ash
129
,818
$
22,0
60$
14
,453
$
13,1
74$
5,
680
$
14
,185
$
7,46
1$
15,0
12$
8,
671
$
16,2
92$
5,
662
$
34
,414
$
Res
idua
l Cas
h 2
7,89
1
5,93
5
7,48
4
8,11
0
9,51
0
7,48
8
7,53
3
6,62
3
7,62
5
4,
846
5,
668
4,
952
G
over
nmen
t & A
genc
y Bo
nds
27,3
99
27
,236
28,4
23
27
,647
27,9
40
28
,952
28,6
49
28
,597
28,2
44
27,9
25
27
,924
28,9
99
C
orpo
rate
Bon
ds37
,906
37,3
94
36
,804
36,7
34
37
,109
36,0
92
36
,600
37,0
73
37
,245
37
,197
37,2
67
37
,356
Mel
lon
Bond
Inde
x Fu
nd 3
704
697
702
697
702
701
701
705
-
-
-
-
D
omes
tic &
Inte
rnat
iona
l Equ
ities
317,
497
30
6,03
9
301,
653
30
4,92
8
308,
740
29
9,17
8
304,
060
29
9,08
2
298,
698
276,
062
27
8,96
1
254,
343
M
ello
n St
ock
Inde
x Fu
nd6,
838
6,
586
6,
419
6,
443
6,
599
6,
639
3,
866
3,
992
4,
015
3,74
0
3,81
7
3,47
2
Mut
ual F
unds
34
6,89
9
337,
129
33
7,66
9
338,
121
33
2,91
8
320,
772
32
6,05
2
322,
316
32
2,45
1
30
6,31
4
308,
591
30
0,19
2
Hed
ge F
unds
68,3
83
68
,560
68,1
91
68
,036
68,5
69
68
,456
68,8
65
69
,023
69,4
44
58,6
05
57
,660
56,7
77
R
eal E
stat
e Fu
nds 4
55,3
25
55
,325
56,2
45
56
,245
56,2
45
51
,005
51,0
05
51
,005
51,6
65
51,6
65
51
,665
48,4
72
Pr
ivat
e In
vest
men
ts 5
27,8
17
27
,817
27,8
17
26
,290
26,2
90
26
,290
27,4
59
27
,459
27,4
59
34,6
27
34
,627
38,4
51
To
tal (
all a
sset
cat
egor
ies)
926,
477
$ 89
4,77
8$
885,
860
$ 88
6,42
5$
880,
302
$ 85
9,75
8$
862,
251
$ 86
0,88
7$
855,
517
$
817,
273
$ 81
1,84
2$
807,
428
$
Mut
ual F
unds
DFA
Mic
ro C
ap E
quiti
es24
,436
$
23,3
82$
23
,782
$
23,9
78$
25
,403
$
25,7
58$
26
,325
$
26,2
99$
25
,658
$
22
,989
$
23,1
16$
20
,382
$
DFA
Em
ergi
ng M
arke
ts E
quiti
es19
,690
18,7
62
18
,507
18,5
77
17
,771
16,8
02
17
,573
17,1
56
17
,172
15
,728
16,2
92
15
,941
OFI
Glo
bal E
mer
ging
Mar
kets
Equ
ities
30,1
33
28
,681
28,7
35
28
,331
28,2
67
27
,560
27,6
95
26
,936
26,6
54
24,0
65
25
,308
24,5
31
Fi
delit
y In
stitu
tiona
l Ass
et M
gmt
53,7
63
51
,127
51,0
07
51
,622
47,0
52
46
,262
47,2
25
46
,728
46,7
99
42,1
28
42
,220
40,1
02
La
zard
Em
ergi
ng M
arke
ts D
ebt
28,2
94
27
,544
27,9
02
27
,408
26,7
76
26
,040
26,8
16
25
,807
25,9
77
25,4
06
25
,161
25,2
78
Lo
omis
Say
les
Stra
tegi
c Al
pha
44,9
31
44
,836
45,0
07
45
,153
45,1
34
44
,988
45,3
53
45
,114
45,2
96
45,2
96
45
,167
44,8
03
N
eube
rger
Ber
man
Glo
bal F
ixed
Inco
me
36,0
15
35
,840
36,0
15
36
,015
35,6
30
35
,525
35,9
10
35
,665
35,9
10
35,7
70
35
,455
35,6
30
G
MO
Glo
bal A
sset
Allo
catio
n38
,318
37,2
01
36
,955
36,7
21
36
,587
33,0
24
33
,689
33,4
73
33
,607
32
,015
32,3
03
31
,442
Mel
lon
Glo
bal A
sset
Allo
catio
n33
,769
33,1
11
32
,984
33,5
11
33
,979
31,9
12
32
,173
32,3
22
32
,361
30
,919
31,2
88
30
,148
PIM
CO
All
Asse
t Allo
catio
n 37
,550
36,6
45
36
,775
36,8
05
36
,319
32,9
01
33
,293
32,8
16
33
,017
31
,998
32,2
81
31
,935
Tota
l (m
utua
l fun
ds)
346,
899
$ 33
7,12
9$
337,
669
$ 33
8,12
1$
332,
918
$ 32
0,77
2$
326,
052
$ 32
2,31
6$
322,
451
$
306,
314
$ 30
8,59
1$
300,
192
$
Hed
ge F
unds
6
EnTr
ust
21,7
72$
22
,032
$
21,7
56$
21
,494
$
21,5
89$
21
,713
$
21,8
17$
21
,865
$
21,9
54$
11,8
15$
11
,446
$
11,3
50$
G
rosv
enor
27,6
78
27
,544
27,5
15
27
,581
27,9
68
27
,910
27,9
86
28
,009
28,0
71
27,5
41
27
,201
26,6
67
Pa
sspo
rt41
9
41
9
41
9
41
9
41
9
-
-
-
-
-
-
-
W
hite
box
18,5
14
18
,565
18,5
01
18
,542
18,5
93
18
,833
19,0
62
19
,149
19,4
19
19,2
49
19
,013
18,7
60
To
tal (
hedg
e fu
nds)
68,3
83$
68
,560
$
68,1
91$
68
,036
$
68,5
69$
68
,456
$
68,8
65$
69
,023
$
69,4
44$
58,6
05$
57
,660
$
56,7
77$
1 C
heck
ing
& C
ash
Acc
ts49
8,42
4
539,
824
3 Mel
lon
Bon
d In
dex
Fund
liqu
idat
ed S
ep 2
018
5 Priv
ate
Inve
stm
ents
est
imat
e fo
r Jan
- M
ar a
s of
09/
30/1
7, e
stim
ate
for A
pr -
Jun
as o
f 12/
31/1
7, e
stim
ate
for J
ul -
Sep
as
of 0
3/31
/18,
est
imat
e fo
r Oct
& N
ov a
s of
06/
30/1
8, e
stim
ate
for D
ec a
s of
09/
30/1
8
4 Rea
l Est
ate
Fund
s es
timat
e fo
r Jan
& F
eb a
s of
12/
31/1
7, e
stim
ate
for A
pr &
May
as
of 0
3/31
/18,
est
imat
e fo
r Jul
& A
ug a
s of
06/
30/1
8, e
stim
ate
for O
ct &
Nov
as
of 0
9/30
/18
2 Cas
h he
ld b
y m
oney
man
ager
s
6 EnT
rust
's e
stim
ates
are
for p
rior m
onth
and
in li
quid
atio
n, 5
0% o
f fun
ds re
ceiv
ed in
Oct
ober
201
8; P
assp
ort f
ully
liqu
idat
ed J
un 2
018
1st Q
TR2nd
QTR
3rd Q
TR4th
QTR
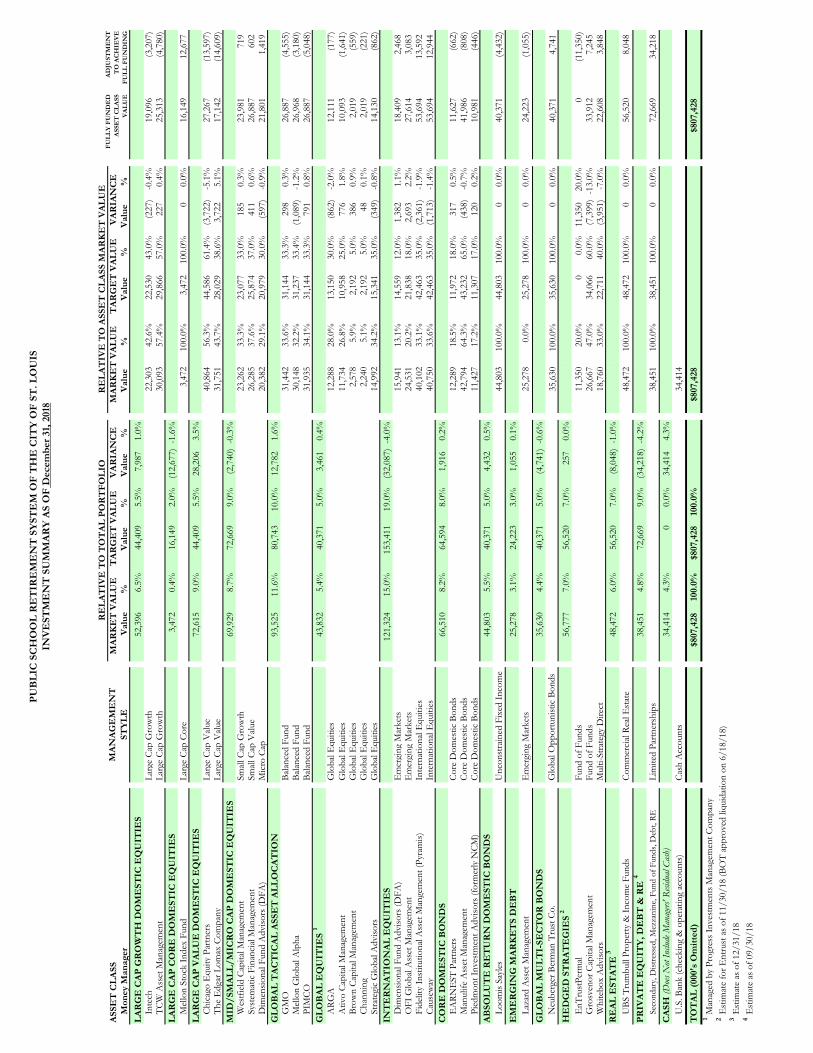
PUB
LIC
SC
HO
OL
RE
TIR
EM
EN
T S
YST
EM
OF
TH
E C
ITY
OF
ST. L
OU
ISIN
VE
STM
EN
T S
UM
MA
RY
AS
OF
Dec
embe
r 31,
201
8
Mon
ey M
anag
erV
alue
%
Val
ue
%V
alue
%
Val
ue
%V
alue
%
Val
ue
%LA
RG
E C
AP
GR
OW
TH
DO
ME
STIC
EQ
UIT
IES
52,3
966.
5%44
,409
5.5%
7,98
71.
0%In
tech
Larg
e C
ap G
row
th22
,303
42.6
%22
,530
43.0
%(2
27)
-0.4
%19
,096
(3,2
07)
TCW
Ass
et M
anag
emen
tLa
rge
Cap
Gro
wth
30,0
9357
.4%
29,8
6657
.0%
227
0.4%
25,3
13(4
,780
)LA
RG
E C
AP
CO
RE
DO
ME
STIC
EQ
UIT
IES
3,47
20.
4%16
,149
2.0%
(12,
677)
-1.6
%M
ello
n St
ock
Inde
x Fu
ndLa
rge
Cap
Cor
e3,
472
100.
0%3,
472
100.
0%0
0.0%
16,1
4912
,677
LAR
GE
CA
P V
ALU
E D
OM
EST
IC E
QU
ITIE
S72
,615
9.0%
44,4
095.
5%28
,206
3.5%
Chi
cago
Equ
ity P
artn
ers
Larg
e C
ap V
alue
40,8
6456
.3%
44,5
8661
.4%
(3,7
22)
-5.1
%27
,267
(13,
597)
The
Edg
ar L
omax
Com
pany
Larg
e C
ap V
alue
31,7
5143
.7%
28,0
2938
.6%
3,72
25.
1%17
,142
(14,
609)
MID
/SM
ALL
/MIC
RO
CA
P D
OM
EST
IC E
QU
ITIE
S69
,929
8.7%
72,6
699.
0%(2
,740
)-0
.3%
Wes
tfiel
d C
apita
l Man
agem
ent
Smal
l Cap
Gro
wth
23,2
6233
.3%
23,0
7733
.0%
185
0.3%
23,9
8171
9Sy
stem
atic
Fin
anci
al M
anag
emen
tSm
all C
ap V
alue
26,2
8537
.6%
25,8
7437
.0%
411
0.6%
26,8
8760
2D
imen
siona
l Fun
d A
dviso
rs (D
FA)
Mic
ro C
ap20
,382
29.1
%20
,979
30.0
%(5
97)
-0.9
%21
,801
1,41
9G
LOB
AL
TA
CT
ICA
L A
SSE
T A
LLO
CA
TIO
N93
,525
11.6
%80
,743
10.0
%12
,782
1.6%
GM
OBa
lanc
ed F
und
31,4
4233
.6%
31,1
4433
.3%
298
0.3%
26,8
87(4
,555
)M
ello
n G
loba
l Alp
haBa
lanc
ed F
und
30,1
4832
.2%
31,2
3733
.4%
(1,0
89)
-1.2
%26
,968
(3,1
80)
PIM
CO
Bala
nced
Fun
d31
,935
34.1
%31
,144
33.3
%79
10.
8%26
,887
(5,0
48)
GLO
BA
L E
QU
ITIE
S 1
43,8
325.
4%40
,371
5.0%
3,46
10.
4%A
RG
AG
loba
l Equ
ities
12,2
8828
.0%
13,1
5030
.0%
(862
)-2
.0%
12,1
11(1
77)
Ativ
o C
apita
l Man
agem
ent
Glo
bal E
quiti
es11
,734
26.8
%10
,958
25.0
%77
61.
8%10
,093
(1,6
41)
Brow
n C
apita
l Man
agem
ent
Glo
bal E
quiti
es2,
578
5.9%
2,19
25.
0%38
60.
9%2,
019
(559
)C
hann
ing
Glo
bal E
quiti
es2,
240
5.1%
2,19
25.
0%48
0.1%
2,01
9(2
21)
Stra
tegi
c G
loba
l Adv
isors
Glo
bal E
quiti
es14
,992
34.2
%15
,341
35.0
%(3
49)
-0.8
%14
,130
(862
)IN
TE
RN
AT
ION
AL
EQ
UIT
IES
121,
324
15.0
%15
3,41
119
.0%
(32,
087)
-4.0
%D
imen
siona
l Fun
d A
dviso
rs (D
FA)
Em
ergi
ng M
arke
ts15
,941
13.1
%14
,559
12.0
%1,
382
1.1%
18,4
092,
468
OFI
Glo
bal A
sset
Man
agem
ent
Em
ergi
ng M
arke
ts24
,531
20.2
%21
,838
18.0
%2,
693
2.2%
27,6
143,
083
Fide
lity
Inst
itutio
nal A
sset
Man
gem
ent (
Pyra
mis)
Inte
rnat
iona
l Equ
ities
40,1
0233
.1%
42,4
6335
.0%
(2,3
61)
-1.9
%53
,694
13,5
92C
ause
way
Inte
rnat
iona
l Equ
ities
40,7
5033
.6%
42,4
6335
.0%
(1,7
13)
-1.4
%53
,694
12,9
44C
OR
E D
OM
EST
IC B
ON
DS
66,5
108.
2%64
,594
8.0%
1,91
60.
2%E
AR
NE
ST P
artn
ers
Cor
e D
omes
tic B
onds
12,2
8918
.5%
11,9
7218
.0%
317
0.5%
11,6
27(6
62)
Man
ulife
Ass
et M
anag
emen
tC
ore
Dom
estic
Bon
ds42
,794
64.3
%43
,232
65.0
%(4
38)
-0.7
%41
,986
(808
)Pi
edm
ont I
nves
tmen
t Adv
isors
(for
mer
ly N
CM
)C
ore
Dom
estic
Bon
ds11
,427
17.2
%11
,307
17.0
%12
00.
2%10
,981
(446
)A
BSO
LUT
E R
ET
UR
N D
OM
EST
IC B
ON
DS
44,8
035.
5%40
,371
5.0%
4,43
20.
5%Lo
omis
Sayl
esU
ncon
stra
ined
Fix
ed In
com
e44
,803
100.
0%44
,803
100.
0%0
0.0%
40,3
71(4
,432
)E
ME
RG
ING
MA
RK
ET
S D
EB
T25
,278
3.1%
24,2
233.
0%1,
055
0.1%
Laza
rd A
sset
Man
agem
ent
Em
ergi
ng M
arke
ts25
,278
0.0%
25,2
7810
0.0%
00.
0%24
,223
(1,0
55)
GLO
BA
L M
ULT
I-SE
CT
OR
BO
ND
S35
,630
4.4%
40,3
715.
0%(4
,741
)-0
.6%
Neu
berg
er B
erm
an T
rust
Co.
Glo
bal O
ppor
tuni
stic
Bon
ds35
,630
100.
0%35
,630
100.
0%0
0.0%
40,3
714,
741
HE
DG
ED
ST
RA
TE
GIE
S 2
56,7
777.
0%56
,520
7.0%
257
0.0%
EnT
rust
Perm
alFu
nd o
f Fun
ds11
,350
20.0
%0
0.0%
11,3
5020
.0%
0(1
1,35
0)G
rosv
enor
Cap
ital M
anag
emen
tFu
nd o
f Fun
ds26
,667
47
.0%
34,0
6660
.0%
(7,3
99)
-13.
0%33
,912
7,24
5W
hite
box
Adv
isors
Mul
ti-St
rate
gy D
irect
18,7
6033
.0%
22,7
1140
.0%
(3,9
51)
-7.0
%22
,608
3,84
8R
EA
L E
STA
TE
3 48
,472
6.0%
56,5
207.
0%(8
,048
)-1
.0%
UBS
Tru
mbu
ll Pr
oper
ty &
Inco
me
Fund
sC
omm
erci
al R
eal E
stat
e48
,472
100.
0%48
,472
100.
0%0
0.0%
56,5
208,
048
PRIV
AT
E E
QU
ITY
, DE
BT
& R
E 4
38,4
514.
8%72
,669
9.0%
(34,
218)
-4.2
%Se
cond
ary,
Dist
ress
ed, M
ezza
nine
, Fun
d of
Fun
ds, D
ebt,
RE
Lim
ited
Partn
ersh
ips
38,4
5110
0.0%
38,4
5110
0.0%
00.
0%72
,669
34,2
18C
ASH
(Does
Not
Inclu
de M
anag
ers' R
esidu
al Ca
sh)
34,4
144.
3%0
0.0%
34,4
144.
3%U
.S. B
ank
(che
ckin
g &
ope
ratin
g ac
coun
ts)
Cas
h A
ccou
nts
34,4
14T
OT
AL
(000
's O
mitt
ed)
$807
,428
100.
0%$8
07,4
2810
0.0%
$807
,428
$807
,428
1M
anag
ed b
y Pr
ogre
ss In
vest
men
ts M
anag
emen
t Com
pany
2E
stim
ate
for E
ntru
st a
s of 1
1/30
/18
(BO
T ap
prov
ed li
quid
atio
n on
6/1
8/18
)3
Est
imat
e as
of 1
2/31
/18
4E
stim
ate
as o
f 09/
30/1
8
VA
RIA
NC
EM
AR
KE
T V
ALU
E
MA
NA
GE
ME
NT
STY
LE
FUL
LY
FU
ND
ED
ASS
ET
CL
ASS
VA
LU
E
ASS
ET
CLA
SSA
DJU
STM
EN
TT
O A
CH
IEV
EFU
LL
FU
ND
ING
TA
RG
ET
VA
LUE
V
AR
IAN
CE
RE
LAT
IVE
TO
TO
TA
L PO
RT
FOLI
OR
ELA
TIV
E T
O A
SSE
T C
LASS
MA
RK
ET
VA
LUE
MA
RK
ET
VA
LUE
TA
RG
ET
VA
LUE

Annual Year- RemainingExpense Or Budget To-Date Budget(Revenue) Category Amount Expenses Amount
Salaries 507,620$ 524,826$ (17,206)$ Employee Benefits 209,327 210,456 (1,129)Investment Management Fees 3,194,571 2,736,400 458,171Trust & Custody Bank Services 117,245 118,506 (1,261)Investment Consultant 186,775 186,683 92Actuarial Services 156,000 139,075 16,925Legal Services 185,000 128,598 56,402Auditing Services 71,610 66,317 5,294Technology Services 125,865 112,831 13,034Disability Medical Evaluations 2,000 700 1,300Property Management 119,488 108,482 11,006Postage & Delivery Services 51,239 41,935 9,304Printing & Office Supplies 48,718 48,766 (48)Equipment Maintenance & Purchases 16,540 12,339 4,201Business Insurance 95,595 93,517 2,078Trustee Education 35,000 21,646 13,354Trustee Elections 23,554 23,404 150Retiree Insurance & Consulting 2,557,002 2,421,780 135,222Miscellaneous - Includes Bank Acct Fees 37,900 29,906 7,994Special Projects 5,000 3,444 1,556(Securities Lending Revenue) (150,000) (99,874) (50,126)(Commission Recapture Revenue) (25,000) (8,935) (16,065)(VA Lease Revenue) (157,530) (157,219) (311)
7,413,519$ 6,763,582$ 649,937$
Public School Retirement System of the City of St. LouisYear-To-Date Budget Analysis as of December 31, 2018
Total

Annual Year- RemainingExpense Or Budget To-Date Budget(Revenue) Category Amount Expenses Amount
Salaries 477,882$ 33,826$ 444,056$ Employee Benefits 200,827 7,912 192,915Investment Management Fees 3,098,170 197,974 2,900,196Trust & Custody Bank Services 125,905 - 125,905Investment Consultant 185,170 - 185,170Actuarial Services 136,000 4,874 131,126Legal Services 140,000 5,264 134,736Auditing Services 73,110 - 73,110Technology Services 119,105 3,615 115,490Disability Medical Evaluations 2,000 - 2,000Property Management 123,292 5,974 117,318Postage & Delivery Services 50,028 2,963 47,065Printing & Office Supplies 48,848 2,136 46,712Equipment Maintenance & Purchases 32,090 - 32,090Business Insurance 96,034 - 96,034Trustee Education 35,000 - 35,000Trustee Elections 45,995 2,329 43,666Retiree Insurance & Consulting 2,503,866 194,404 2,309,462Miscellaneous - Includes Bank Acct Fees 35,300 1,943 33,357Special Projects 5,000 - 5,000(Securities Lending Revenue) (150,000) (6,767) (143,233)(Commission Recapture Revenue) (20,000) (429) (19,571)(VA Lease Revenue) (161,482) (13,324) (148,158)
7,202,140$ 442,692$ 6,759,448$
Public School Retirement System of the City of St. LouisYear-To-Date Budget Analysis as of January 31, 2019
Total
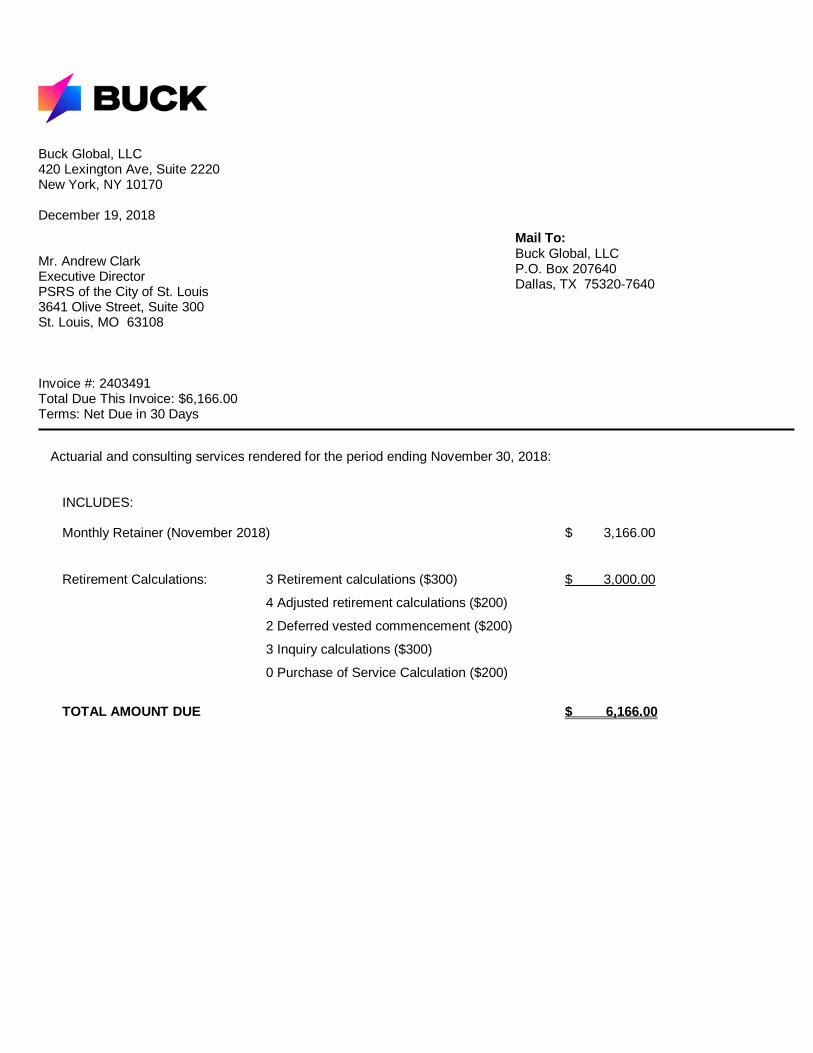
Buck Global, LLC 420 Lexington Ave, Suite 2220 New York, NY 10170
December 19, 2018
Mr. Andrew ClarkExecutive Director PSRS of the City of St. Louis 3641 Olive Street, Suite 300 St. Louis, MO 63108
Mail To: Buck Global, LLC P.O. Box 207640 Dallas, TX 75320-7640
Invoice #: 2403491 Total Due This Invoice: $6,166.00 Terms: Net Due in 30 Days
Actuarial and consulting services rendered for the period ending November 30, 2018:
INCLUDES:
Monthly Retainer (November 2018) $ 3,166.00
Retirement Calculations: 3 Retirement calculations ($300) $ 3,000.00
4 Adjusted retirement calculations ($200)
2 Deferred vested commencement ($200)
3 Inquiry calculations ($300)
0 Purchase of Service Calculation ($200)
TOTAL AMOUNT DUE $ 6,166.00

Buck Global, LLC 420 Lexington Ave, Suite 2220 New York, NY 10170
January 11, 2019
Mr. Andrew ClarkExecutive Director PSRS of the City of St. Louis 3641 Olive Street, Suite 300 St. Louis, MO 63108-3601
Mail To: Buck Global, LLC P.O. Box 207640 Dallas, TX 75320-7640
Invoice #: 2405589 Total Due This Invoice: $4,874.00 Terms: Net Due in 30 Days
Actuarial and consulting services rendered for the period ending December, 2018:
INCLUDES:
Monthly Retainer (December 2018) $ 3,174.00
Retirement Calculations: 3 Retirement calculations ($300) $ 1,700.00
0 Adjusted retirement calculations ($200)
1 Deferred vested commencement ($200)
2 Inquiry calculations ($300)
0 Purchase of Service Calculation ($200)
TOTAL AMOUNT DUE $ 4,874.00