board of directors the state of the monadnock...
TRANSCRIPT

“…to raise new ideas and improve policy debates throu gh quality information and analysis on issues shaping New Hamp shire’s future.”
The State of the Monadnock Region
Dennis Delay toGreater Keene Chamber of Commerce
Tuesday, September 15, 2015
Board of DirectorsJames Putnam, Chair
David Alukonis
Eric Herr
Dianne Mercier
Catherine A. Provencher
Todd I. Selig
Michael Whitney
Daniel Wolf
Martin L. Gross, Chair Emeritus
Directors Emeritus
William H. Dunlap
Sheila T. Francoeur
Stuart V. Smith, Jr.
Donna Sytek
Brian F. Walsh
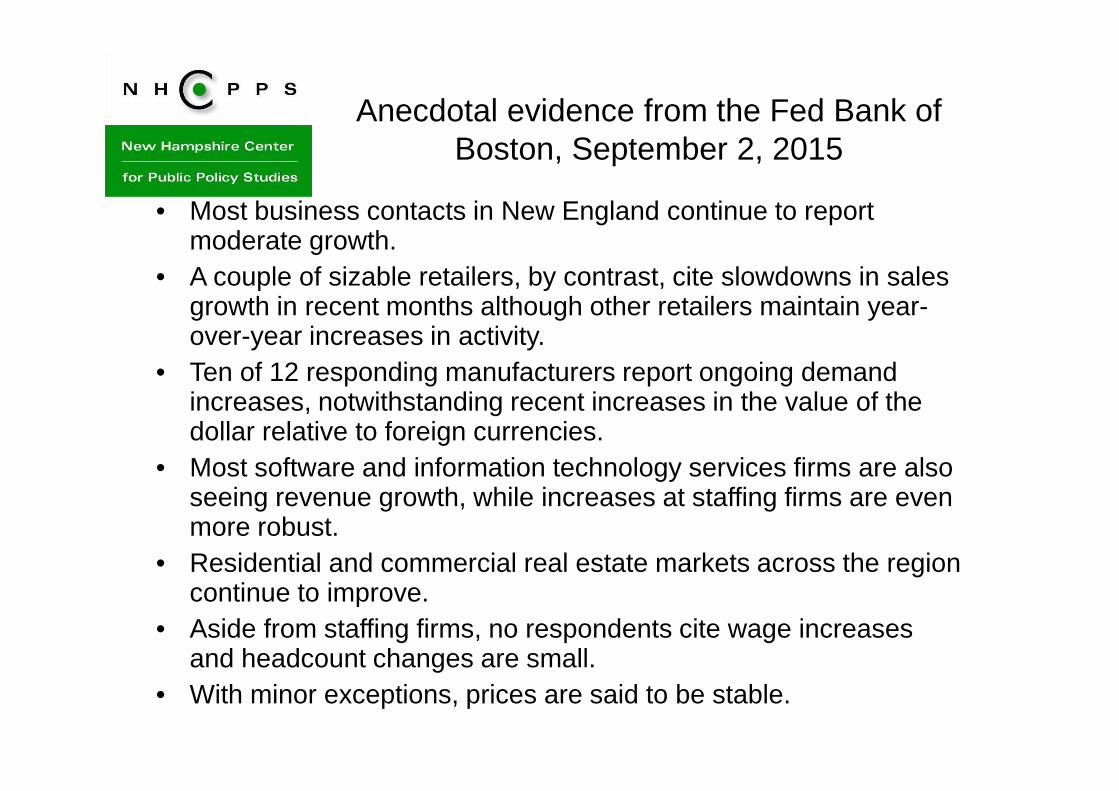
Anecdotal evidence from the Fed Bank of Boston, September 2, 2015
• Most business contacts in New England continue to report moderate growth.
• A couple of sizable retailers, by contrast, cite slowdowns in sales growth in recent months although other retailers maintain year-over-year increases in activity.
• Ten of 12 responding manufacturers report ongoing demand increases, notwithstanding recent increases in the value of the dollar relative to foreign currencies.
• Most software and information technology services firms are also seeing revenue growth, while increases at staffing firms are even more robust.
• Residential and commercial real estate markets across the region continue to improve.
• Aside from staffing firms, no respondents cite wage increases and headcount changes are small.
• With minor exceptions, prices are said to be stable.

NH
–Less of a decline than U
S,
but a slower recovery
92.0
94.0
96.0
98.0
100.0
102.0
104.0
106.0
Jan-07May-07Sep-07Jan-08May-08Sep-08Jan-09May-09Sep-09Jan-10May-10Sep-10Jan-11May-11Sep-11Jan-12May-12Sep-12Jan-13May-13Sep-13Jan-14May-14Sep-14Jan-15May-15
Dec 2007 =100Index of Total N
onFarm
Em
ployment
US
NH
MA
New
Ham
pshire
United S
tates
Massachusetts

Manufacturing, construction and financial activities have not
recovered, government shrinks
Source: NH Economic and Labor Market Information Bureau
-7,400
-2,100 -2,700-3,500
3,100 3,700
1,200
-4,600
6001,500
3,900
1,500
5,700
3,100 2,600
-1,500
-10,000
-8,000
-6,000
-4,000
-2,000
0
2,000
4,000
6,000
8,000
Change in New Hampshire Jobs
Dec 08 to Dec 11
Dec 11 to Dec 14
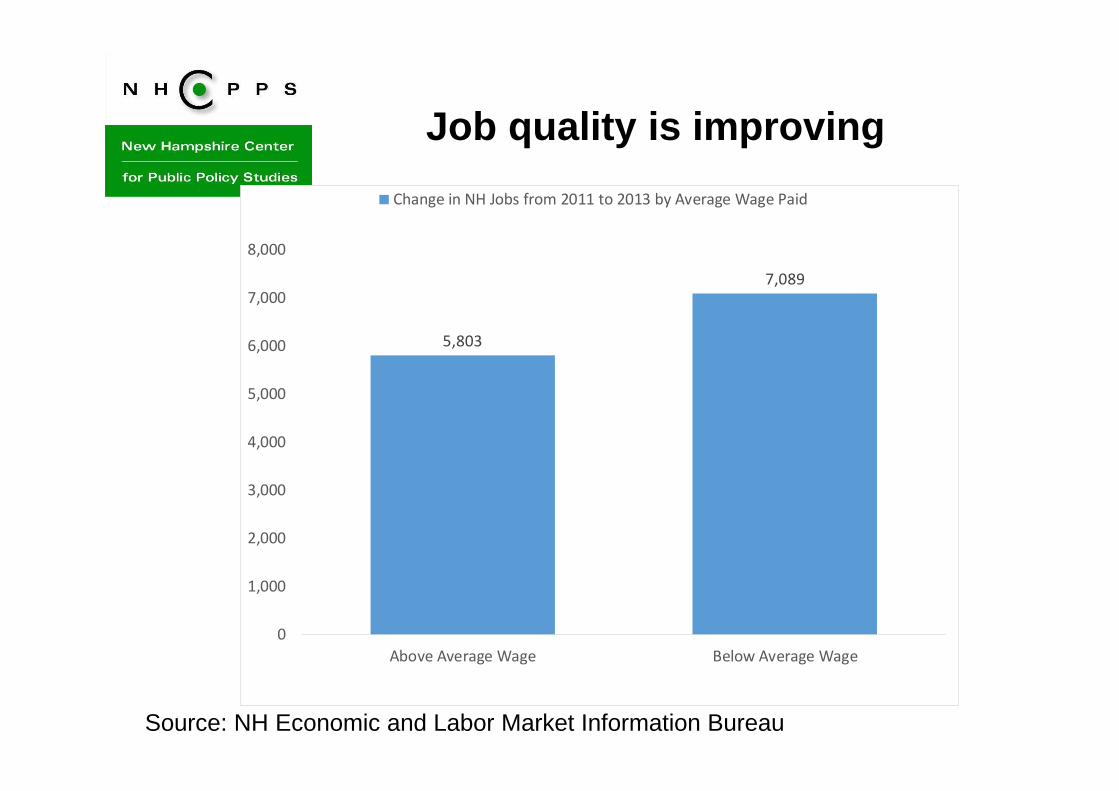
Job quality is improving
Source: NH Economic and Labor Market Information Bureau
5,803
7,089
0
1,000
2,000
3,000
4,000
5,000
6,000
7,000
8,000
Above Average Wage Below Average Wage
Change in NH Jobs from 2011 to 2013 by Average Wage Paid

Unemployment Rate Declining
Source: NH Economic and Labor Market Information Bureau

Monadnock Job Profile
Source: NH Economic and Labor Market Information Bureau

Where people work in Cheshire County
Source: On the Map, US Census Bureau

Where people live in Cheshire County
Source: On the Map, US Census Bureau

NH Residential Real Estate Sales Up
$0
$50,000
$100,000
$150,000
$200,000
$250,000
$300,000
0
5,000
10,000
15,000
20,000
25,000
19981999 2000 2001 2002 200320042005 2006 2007 2008 200920102011 2012 2013 2014 2015
NH Single-Family Residential Home Sales and Price (MLS)Source: NH Association of REALTORS
Units sold Median Price
Median Home Price
Number of Units Sold
Decline from the Peak:Sales -40% from 2004Price -25% from 2005
2015 YTD thru May.

Recovery in Cheshire County mirrors state real estate recovery

New
Ham
pshire Hom
e Building
0
5,000
10,000
15,000
20,000
25,00001/6901/7001/7101/7201/7301/7401/7501/7601/7701/7801/7901/8001/8101/8201/8301/8401/8501/8601/8701/8801/8901/9001/9101/9201/9301/9401/9501/9601/9701/9801/9901/0001/0101/0201/0301/0401/0501/0601/0701/0801/0901/1001/1101/1201/1301/1401/15
Twelve Month Average At Annual RatesM
onthly Housing P
ermits in N
ew H
ampshire January 19
70 to July 2015G
rey boxes represent recessionary periods

NH Foreclosures – Worst is Over?
0
100
200
300
400
500
600
Jan-
05
Jul-0
5
Jan-
06
Jul-0
6
Jan-
07
Jul-0
7
Jan-
08
Jul-0
8
Jan-
09
Jul-0
9
Jan-
10
Jul-1
0
Jan-
11
Jul-1
1
Jan-
12
Jul-1
2
Jan-
13
Jul-1
3
Jan-
14
Jul-1
4
Jan-
15
Jul-1
5
Source: Real Data Corp. compiled by NH Housing
NH Monthly Foreclosure Deeds
Actual Trend

1414
Rental Prices Have Continued to Rise
New Hampshire Rents – NHHFA Surveys

Declines in Prices and Interest Rates Affect Affordability

But…….
• NH’s Young households are burdened by highest level of student debt in the Nation;
• Lending standards are more rigorous—Qualifying Mortgage, 43% debt to income limit, etc.;
• With rents rising and mediocre job quality, more difficult to save and qualify;
• Nearly 20,000 foreclosed units in past several years in the state—some will not qualify;
• Lack of liquidity is keeping boomers in larger houses than they need;
• Prices and interest rates are rising in past several months, blunting recent affordability improvements.

As Elder population rises
17
178,166
144,472
179,178
225,961
178,243
96,762
56,745
24,761
160,495 160,633177,249
159,044
201,565
184,617
102,676
35,808
0
50,000
100,000
150,000
200,000
250,000
15 to 24 25 to 34 35 to 44 45 to 54 55 to 64 65 to 74 75 to 84 85 & older
Population by Age GroupHistory 2010 Base Year
2025New Hampshire
First Time Home Buyers EldersFamilies

1818
Will mean an increase in older home owners
Owner Households
21,243
7,457
19,582
11,888
0
5,000
10,000
15,000
20,000
25,000
Under Age 65 65 & Older
History 2010 Base Year2025
Southwest Region Planning Commission

Migration stopped in last decade
Source: Internal Revenue Service migration files
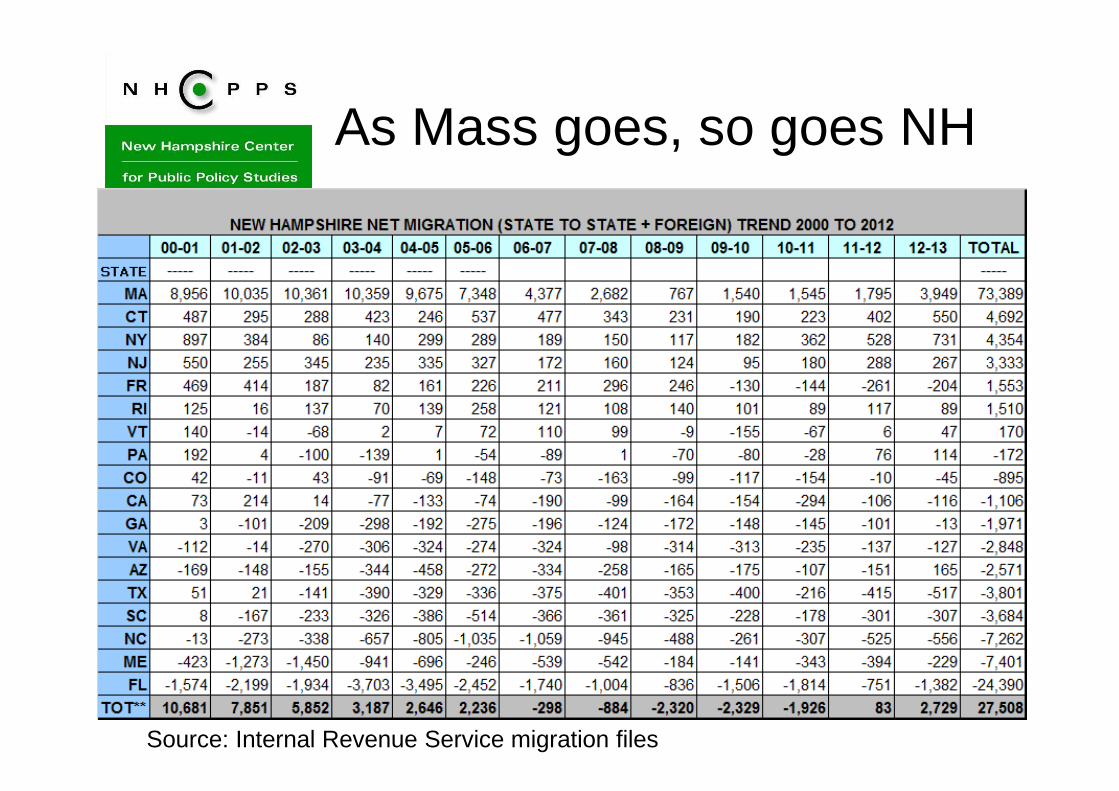
As Mass goes, so goes NH
Source: Internal Revenue Service migration files

Same trends in Cheshire County
121 49 74
(111) (116) (98)(40)
(182) (154)
46
67
(81)
(79)
(232)(189)
(215)
(29) (110)
(400)
(300)
(200)
(100)
-
100
200
2005 2006 2007 2008 2009 2010 2011 2012 2013
Net
Num
ber
of E
xem
ptio
ns
From Previous Year
Net Migration Cheshire County (IRS)
Cheshire County Tot Mig-Diff St
Cheshire County Tot Mig-Same St

NH Population growth anticipated to be slower
Ten Year Percent Change in New Hampshire Population by Decade End
8.5%
13.8%
21.5%
24.8%
20.5%
11.4%
6.5%
3.3% 3.8%
1.1%
1950 1960 1970 1980 1990 2000 2010 2020 2030 2040
ActualForecast

2323
While NH Dept of Employment expects increasing jobs
2012 to 2022
Change in Employment (ELMI Projection) PctChange
Central NH Planning Commission 9.2%
Lakes Region Planning Commission 6.3%
Nashua Regional Planning Commission 9.5%
North Country Council 4.8%
Rockingham Planning Commission 14.7%
Southern NH Planning Commission 14.1%
Southwest Region Planning Commission 4.8%
Strafford Regional Planning Commission 9.5%
Upper Valley / Lake Sunapee Regional Planning 10.2%
New Hampshire 10.5%

2424
Working Age Population Will Decline in Every Region
2010 to 2025
Working Age Population (age 25 to 64) PctChange
Central NH Planning Commission -6.8%Lakes Region Planning Commission -9.2%Nashua Regional Planning Commission -3.0%North Country Council -12.9%Rockingham Planning Commission -1.2%Southern NH Planning Commission -1.5%Southwest Region Planning Commission -4.1%Strafford Regional Planning Commission -0.5%Upper Valley / Lake Sunapee Regional Planning -6.8%New Hampshire -4.0%

Combined with labor force participation reality (declines by age)
25
0.0
10.0
20.0
30.0
40.0
50.0
60.0
70.0
80.0
90.0
100.0
Ra
tio
Em
plo
ym
en
t to
Po
pu
lati
on
New Hampshire Employment to Population by Age Group
16 to 19 years
20 to 24 years
25 to 34 years
35 to 44 years
45 to 54 years
55 to 64 years
65 years and over
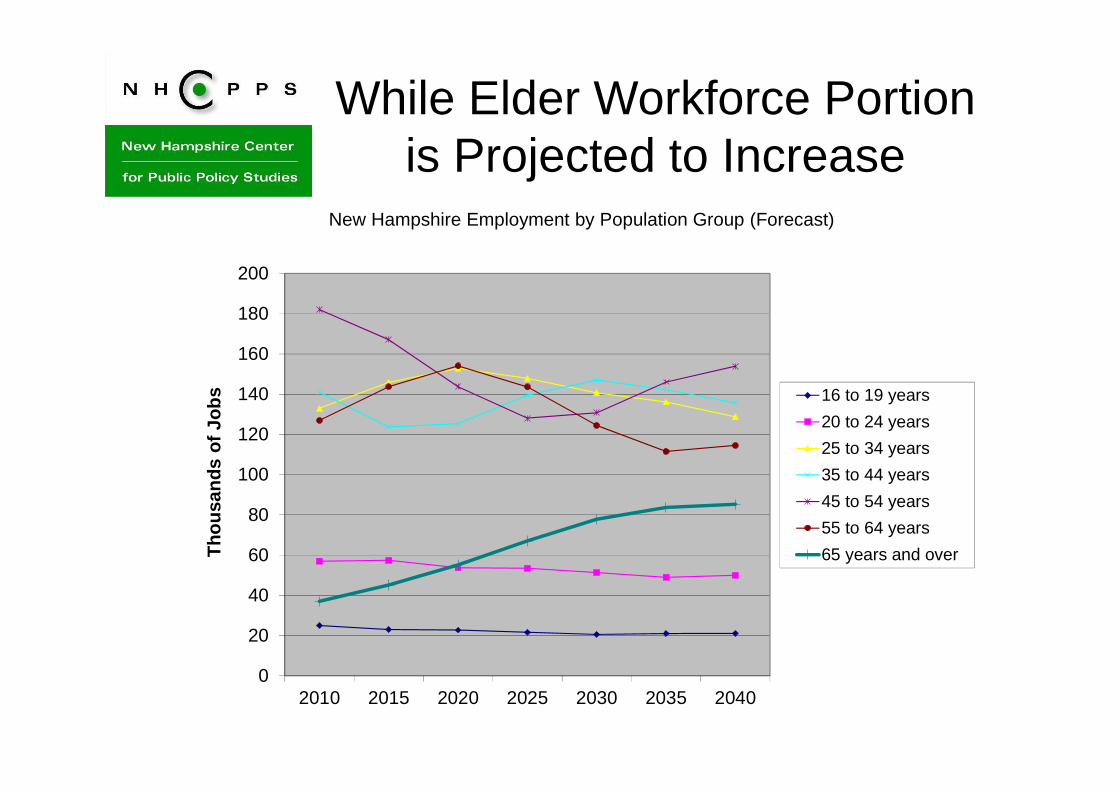
While Elder Workforce Portion is Projected to Increase
0
20
40
60
80
100
120
140
160
180
200
2010 2015 2020 2025 2030 2035 2040
Tho
usan
ds o
f Job
sNew Hampshire Employment by Population Group (Forecast)
16 to 19 years
20 to 24 years
25 to 34 years
35 to 44 years
45 to 54 years
55 to 64 years
65 years and over
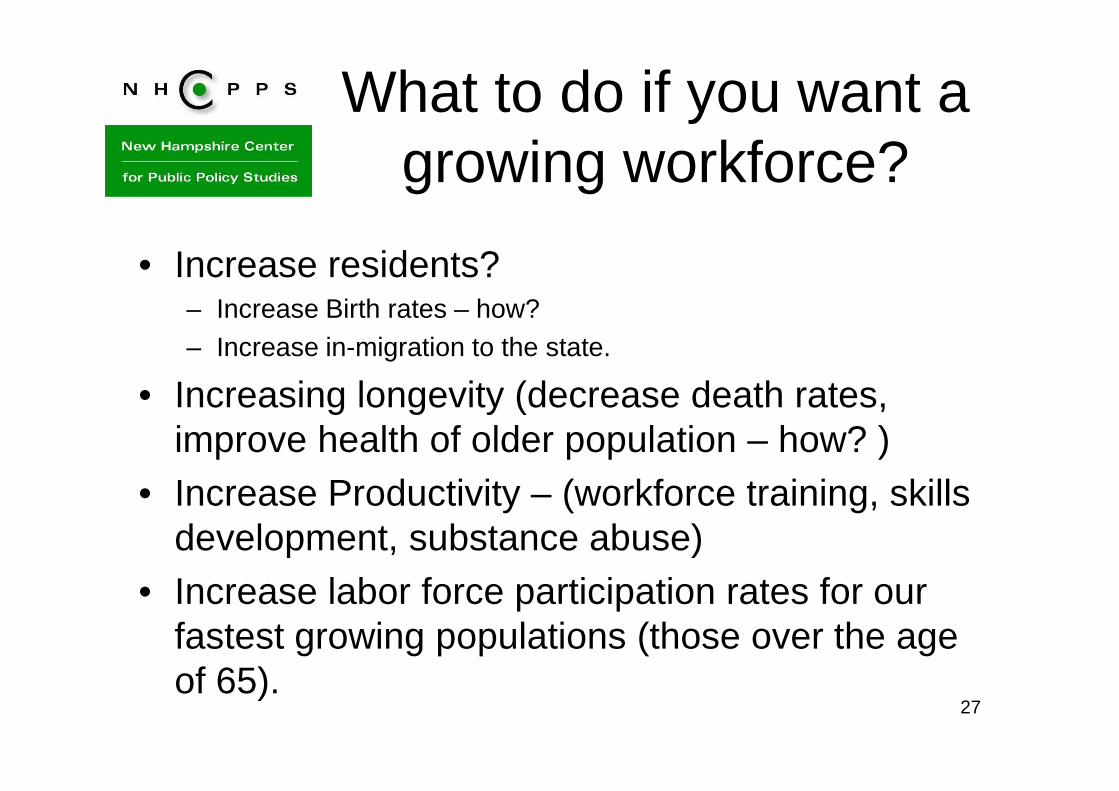
What to do if you want a growing workforce?
• Increase residents?– Increase Birth rates – how? – Increase in-migration to the state.
• Increasing longevity (decrease death rates, improve health of older population – how? )
• Increase Productivity – (workforce training, skills development, substance abuse)
• Increase labor force participation rates for our fastest growing populations (those over the age of 65).
27

Workforce quality by region

Cheshire County Largest Employers
29
30
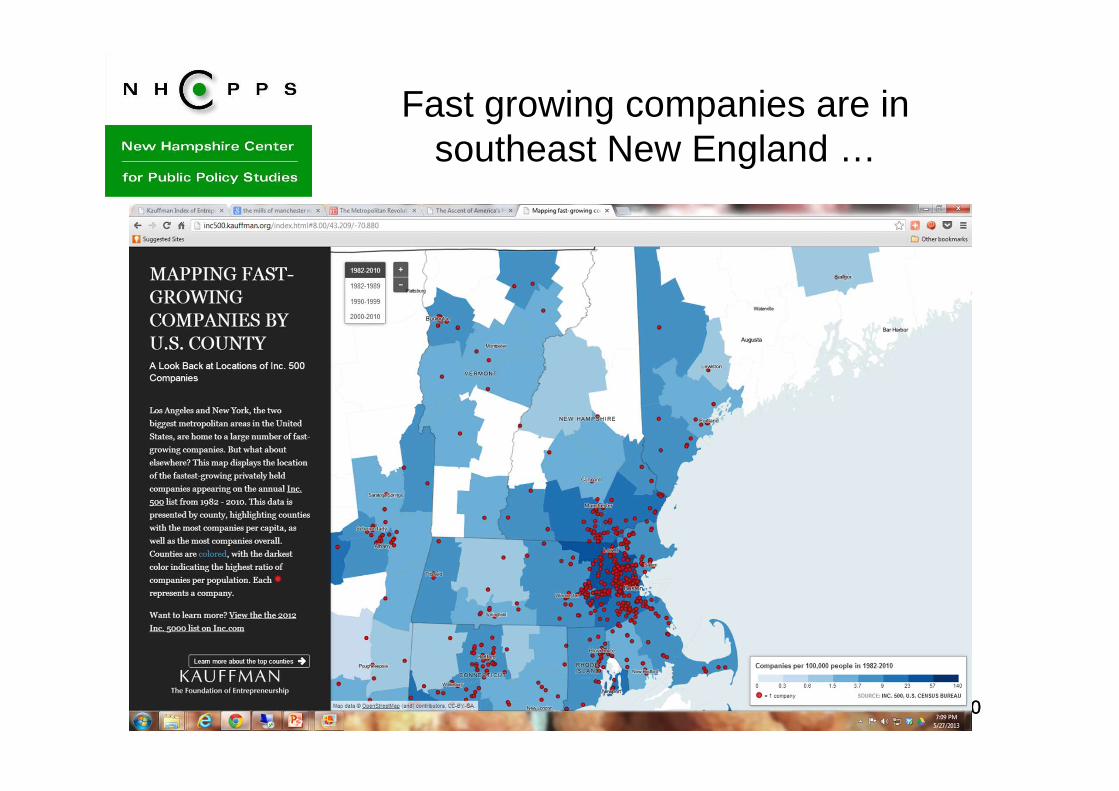
Fast growing companies are in southeast New England …
30

Broadband availability in NH

Property Value by Region
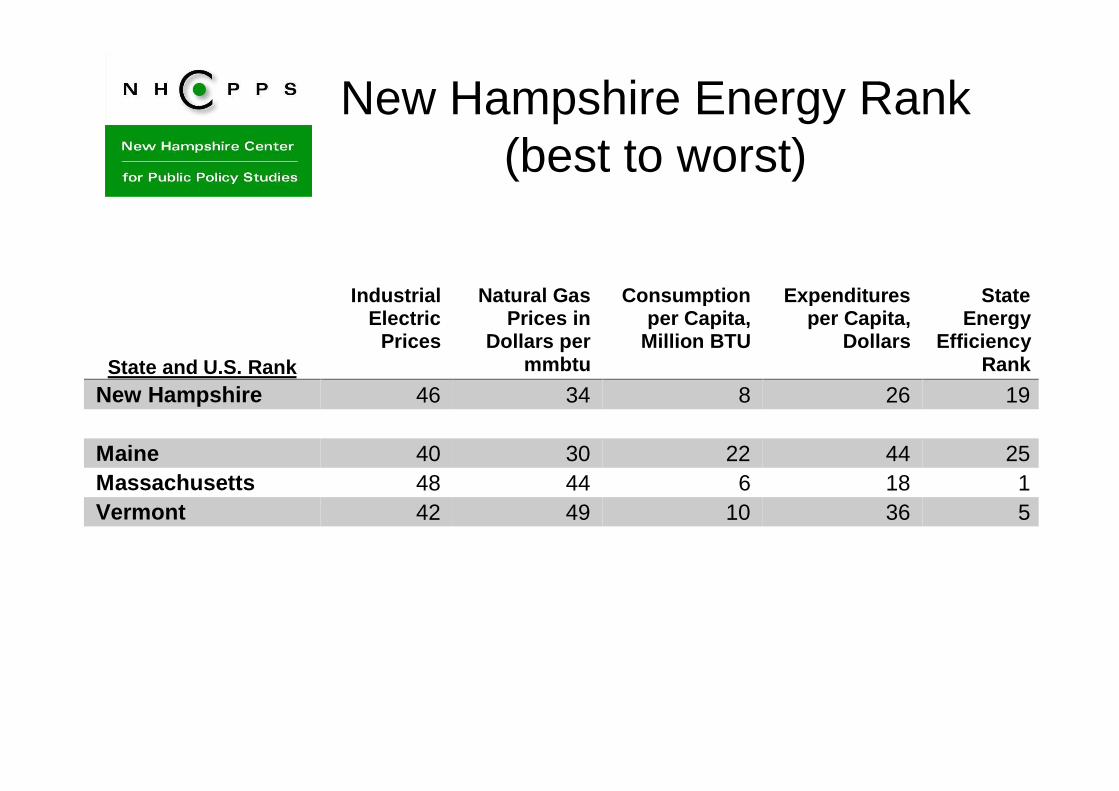
New Hampshire Energy Rank (best to worst)
State and U.S. Rank
Industrial Electric
Prices
Natural Gas Prices in
Dollars per mmbtu
Consumption per Capita,
Million BTU
Expenditures per Capita,
Dollars
State Energy
Efficiency Rank
New Hampshire 46 34 8 26 19 Maine 40 30 22 44 25 Massachusetts 48 44 6 18 1 Vermont 42 49 10 36 5

34
What policies would encourage our energy ‘competitiveness’
• Expanding natural gas capacity?• Northern Pass?• Divestiture of PSNH’s generation capacity?• Encouraging Energy Efficiency?• Encouraging renewables?• Use RGGI funds to solve energy problems?• Understanding the system’s reliability?

NH excels on “current climate” indicators
Area Indicator NH RankWFHousing Homeownership rates 2Regulatory Pollution Abatement / $ Value Added 3EdWorkFrc High School grad rate 4Cultural Voter turnout rate 4EdWorkFrc Pct of pop in Science & Engineering workforce 5EdWorkFrc Pct w/Associates+ 6EdWorkFrc Percent of children aged 3-4 in preschool 6Fiscal State Business Tax Climate Index 7Fiscal Public health/welfare spending per person in poverty 7GrowthReten Manufacturing Supercluster Concentration (LQ) 7

But NH lags on “future climate” indicators
Area Indicator NH RankFiscal Top marginal corporate tax rate 38Infrastructure Percent of bridges deficient or obsolete 39WFHousing Owner costs more than 30% of Income 43Health Health Care Expenditures per Capita by State of Residence, 2009 43Fiscal State debt per $ Personal Income 45Energy Industrial Electric Prices 46GrowthReten Capital Investment Projects per 100,000 pop 46Regulatory Land Use Restriction 47EdWorkFrc Change in 35-44 y.o share of population, 2000 to 2010 48EdWorkFrc Average student debt 50

37
Looking forward: The ecology of
a successful economy
There’s this …• Human Capital• Financial Capital• Economic Creativity• Business Base• Costs of Business• Infrastructure
• Quality of Life
And then … Brad Feld
� A Strong Pool of Tech Founders� Local Capital� Killer Events� Access to Great Universities� Motivated ‘Champions’� Local Press, Organizational Tools� Alumni Outreach� Wins� Recycled Capital� Second-Time Entrepreneurs� Attractive to Engineers� Tent-pole local tech companies 37

NEEP Forecast for New Hampshire October 2014
• The Granite State will add only a few hundred manufacturing jobs over the next five years. However, it is expected that Granite State manufacturing output will continue to increase in the forecast period as it has in the past five years.
• In the private services sector employment will increase by about 2.0 percent annually in the forecast period. The fastest rate of growth will occur in Professional and Business Services, followed by Leisure & Hospitality, and Education and Health Services employment.
• The New Hampshire real estate market has finally seen a return to normal (pre housing bubble) price appreciation and sales growth, according to state realtors. Foreclosure recordings declined steadily over the past year. The state rental market remains strong with rental costs leveling and vacancies remaining below 5 percent in most areas.

Look to an Improving National Economy, Pushed by Housing
and Low Energy Prices
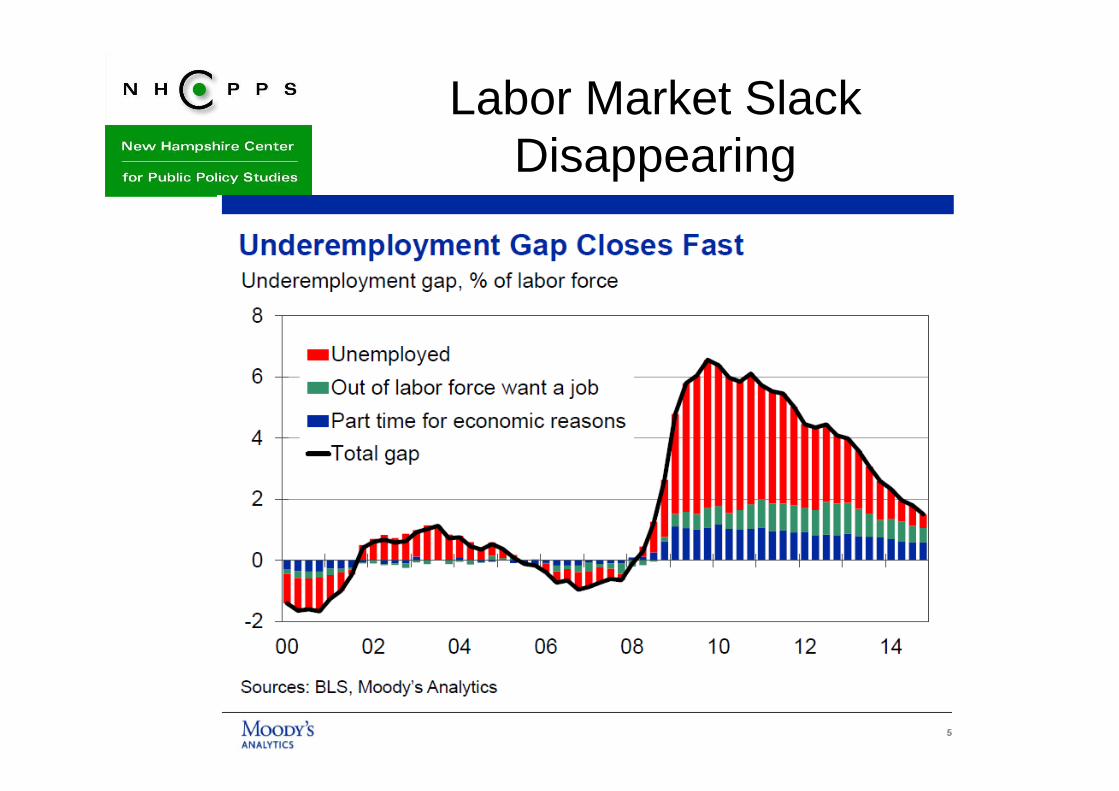
Labor Market Slack Disappearing
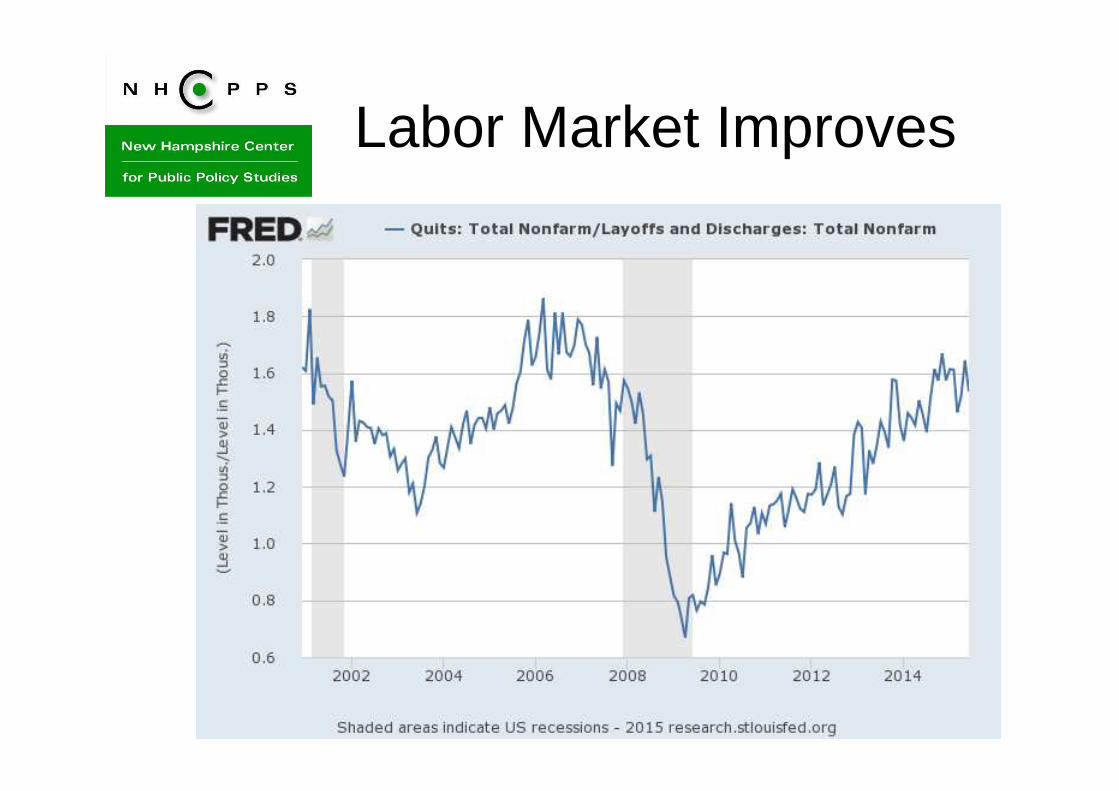
Labor Market Improves

Employers Facing Increasing Labor Cost
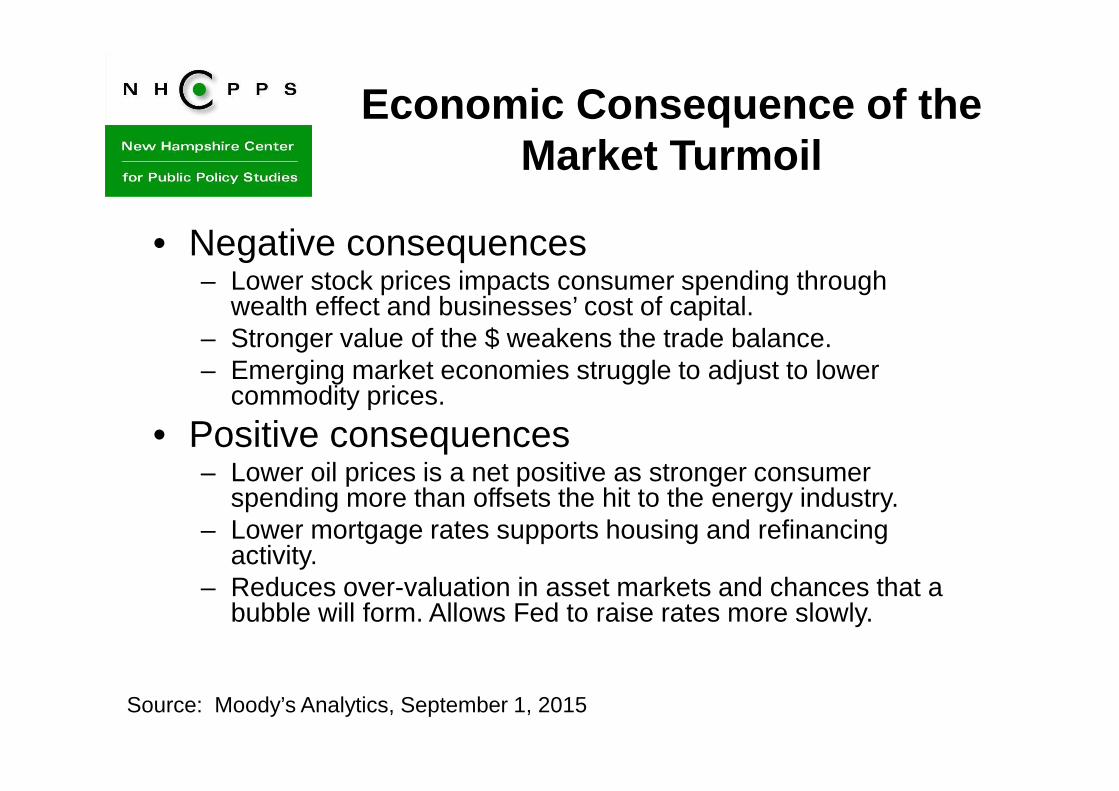
Economic Consequence of the Market Turmoil
• Negative consequences– Lower stock prices impacts consumer spending through
wealth effect and businesses’ cost of capital.– Stronger value of the $ weakens the trade balance.– Emerging market economies struggle to adjust to lower
commodity prices.
• Positive consequences– Lower oil prices is a net positive as stronger consumer
spending more than offsets the hit to the energy industry.– Lower mortgage rates supports housing and refinancing
activity.– Reduces over-valuation in asset markets and chances that a
bubble will form. Allows Fed to raise rates more slowly.
Source: Moody’s Analytics, September 1, 2015

Economic cross currents net out
Source: Moody’s Analytics

Overall Risk IndexWealth Effect 40%, trade 40%,
energy 20%
Sources: BLS, Moody’s Analytics

New Hampshire Center for Public Policy Studies
Want to learn more?• Online: nhpolicy.org• Facebook: facebook.com/nhpolicy• Twitter: @nhpublicpolicy• Our blog: policyblognh.org• (603) 226-2500
“…to raise new ideas and improve policy debates throu gh quality information and analysis on issues shaping New Hamp shire’s future.”
46
Board of DirectorsJames Putnam, Chair
David Alukonis
Eric Herr
Dianne Mercier
Catherine A. Provencher
Todd I. Selig
Michael Whitney
Daniel Wolf
Martin L. Gross, Chair Emeritus
Directors Emeritus
William H. Dunlap
Sheila T. Francoeur
Stuart V. Smith, Jr.
Donna Sytek
Brian F. Walsh

47
The Aging Bubble …

48
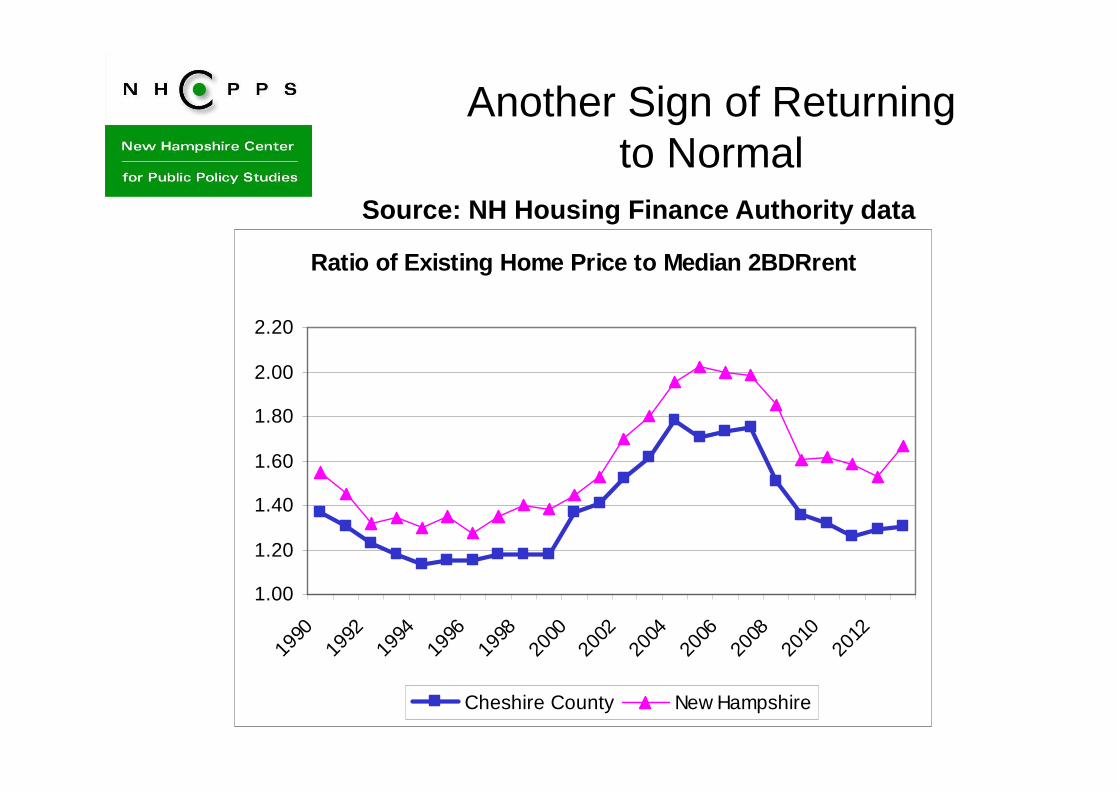
Another Sign of Returning to Normal
Source: NH Housing Finance Authority data
Ratio of Existing Home Price to Median 2BDRrent
1.00
1.20
1.40
1.60
1.80
2.00
2.20
1990
1992
1994
1996
1998
2000
2002
2004
2006
2008
2010
2012
Cheshire County New Hampshire

Assisted Living Demand Increases with Age
50Source: Centers for Medicare and Medicaid Services, Medicare Beneficiary Survey, 2007. Cited in ULI, Housing In America: The Baby Boomers Turn 65. 2012. Page 38
Living Arrangements of US Medicare
Recipients, 2007
98%
93%
78%
1%3%
7%
1%4%
15%
0%
20%
40%
60%
80%
100%
120%
65-74 75-84 85+
Traditional Communities
Assisted Living
Long Term Care

Assisted Living Demand is years away
510
50,000
100,000
150,000
200,000
250,000
2000 2010 2015 2020 2025 2030 2035 2040
New Hampshire Elder Population
65 to 74
75 to 84
85 and Older