board of county commissioners office of the commission … · board of county commissioners office...
TRANSCRIPT

Board of County Commissioners Office of the Commission Auditor
Zero-Based Budget Pilot
Fleet Management Program
March 30, 2009
Prepared by

Zero-Based Budget Pilot Fleet Management Program
Table of Contents EXECUTIVE SUMMARY ...................................................................................................... i OBJECTIVE..................................................................................................................... 1 BACKGROUND ................................................................................................................ 2 ACTIVITY-BASED BUDGETING ........................................................................................ 11 Activity-Based Costing........................................................................................ 13 Unit Cost Analysis .............................................................................................. 16 Activity-Based Program Budget.......................................................................... 17 PROGRAM JUSTIFICATION.............................................................................................. 19 Program Necessity ............................................................................................. 19 Program Placement and Organization................................................................ 23 Program Accountability....................................................................................... 25 Program Justification Summary.......................................................................... 32 PRIORITY RANKINGS ..................................................................................................... 33 DECISION PACKAGES .................................................................................................... 34 Fleet Size and Composition................................................................................ 37 Vehicle and Equipment Replacement Planning.................................................. 39 Cost Competitiveness of Fleet Operations ......................................................... 40 Measures and Indicators of Cost and Service .................................................... 41 Decision Package Summary............................................................................... 44 NEXT STEPS................................................................................................................. 45 EXHIBITS 1 through 8 - Activity-Based Budget APPENDICES
1- Program Costs by Object Code FY 2005/06 – FY 2008/09 2- Fleet Count and % by Department 3- Estimated Percentage of Staff Time Devoted to Each Activity 4- Priority Rankings by Activity

Zero-Based Budget Pilot Fleet Management Program
i
EXECUTIVE SUMMARY Sharpton, Brunson and Company, P.A. (SBC) was engaged to assist the Office of the Commission Auditor (OCA) in executing its strategic and operational work plans. Specifically, SBC was asked to create and execute a zero-based budget pilot (Pilot) for the Fiscal Year 2009 operating budgets of Team Metro and General Services Administration (GSA) – Fleet Management. This report presents the results of the zero-based budget pilot for Fleet Management. Introduction Zero-based budgeting (ZBB) is a form of program budgeting used to analyze programs to determine their value to the government and its citizens. In its purest form, ZBB assumes departments do not exist and builds its programs from zero resources to its optimum level. The process requires a reevaluation of programs from a zero base each budget cycle by requiring justification of all proposed expenditures. This approach is in direct contrast to traditional incremental budgeting, which assumes there is a guaranteed base budget and that incremental increases and decreases will be the focus of budgetary decisions. ZBB assists with the allocation of resources based on best value by questioning assumptions, providing tools to review, reprioritize, and potentially recommend elimination of activities, services, or programs that no longer align with organizational objectives. Initially, ZBB appears to be a labor intensive and time-consuming approach that is only applicable to programs that are discretionary. However, when the principles of ZBB are applied practically, it can be used as an effective means to: provide comprehensive reviews and evaluations of budgets to provide justification and support of each program; present budget options at various funding levels and/or service levels; and ultimately, identify what the government is “buying” with taxpayer and other resources at the program level.
To be most effective, ZBB must also include meaningful performance measurements that are relevant to the program or activity being measured with an emphasis on outputs (quantity of units produced) and outcomes (qualitative results). Benefits of ZBB with performance measurement include the following:
Evaluates program purpose and costs Reviews service delivery benefits, alternatives, and consequences of
discontinuance Promotes transparency and identifies hidden costs Identifies potential redundancies Presents activity based information for improved decision making Useful when overall spending must be reduced

Zero-Based Budget Pilot Fleet Management Program
ii
Structures budgets towards objectives and outputs rather than the common classification of functions and inputs
Allows for calculations of unit costs Enables performance audits to determine whether program activities have
performed as efficiently as planned This Pilot was created using zero-based budgeting principles and performance measurement concepts. The Pilot involves the creation of activity-based program budgets that are justified based on program necessity; program placement and organization; and program accountability. Program budget and justification results are used to force the prioritization of activities and present potential budget options. Methodology and Process In order to accomplish our objective SBC’s work plan included the following three phases: familiarization; justification; and ranking & decision. Part I – Familiarization Prepare an inventory of programs, services and activities; and the associated cost and performance data available for each County Department/Program selected for participation in the Pilot.
Obtain and document understanding of programs, services and activities by reviewing mission, goals, objectives, organizational structure, and other information as deemed necessary.
Review financial framework including:
• Source(s) of funding; • Level of detail used to track, monitor, and report budgets and financial
results; and • Types of revenue generated by fees and user charges including rate
calculations and allocation methodologies, if any. Review or prepare historical financial information. Review current performance measures and related benchmarks.
Part II – Justification Perform justification review of programs, activities and expenditures identified in Part I.
Confirm activities represent discrete units that are appropriate for justification. (Discrete units, commonly referred to as decision units, are activities that can be performed without materially affecting the deliverability of another activity).
Identify input resources (personnel, equipment, office space, etc.) required to perform each activity.

Zero-Based Budget Pilot Fleet Management Program
iii
Determine whether input resources represent fixed or variable costs. Collect and utilize necessary data regarding workload and/or other analyses to
determine how efforts are allocated among activities. Calculate cost of each activity. Determine the appropriate output measure to calculate unit costs (efficiency
measure) for each activity. Recommend enhanced performance measures and potential benchmarks using
other County departments, other governments and private industries providing similar services, as appropriate.
Part III – Ranking & Decision Prepare potential budget options “decision packages” to present the department or program budget based on varying service levels and/or funding levels.
Develop a proposed ranking process to be used by the department to perform priority rankings for each activity.
Review department priority rankings. Prepare activity budgets in order of priority rankings. Determine appropriate decision package service levels (i.e. basic level, current
level, and enhanced level) or funding levels (i.e. 50%, 80% 90% of current level). Prepare decision packages at agreed upon levels of service or funding levels, if
applicable. Note: SBC’s observations and findings are limited by the reliability of the information provided to SBC by Miami-Dade County. Key Results and Observations
The Pilot was created using practical applications of the following zero-based budgeting principles:
• Activity-Based Budgeting • Program Justification • Activity Rankings • Decision Packages
The current program/activity structure utilized by the County in its program budgeting system was reconfigured using a program/service/activity structure. As a result, GSA’s Fleet Management Program was divided into five (5) services and sixteen (16) activities, which formed the basis of the activity-based budget, program justification and activity rankings contained in this analysis.

Zero-Based Budget Pilot Fleet Management Program
iv
The activity-based budget presented below was prepared using activity-based costing and presents the FY 2008/09 adopted program budget by service and activity with associated unit costs.
Fleet Management Program Activity-Based Budget and Unit Costs
Service/Activity Unit of Measure Number of
Units Unit Cost FY 2008/09 Allocated1
Vehicle and Equipment Acquisition Vehicle Specification Preparation Number of Specifications Prepared 20 $ 7,892.14 $ 157,843
Fleet Assessment Number of Vehicles and Equipment
Tracked 11,321 5.88 66,580
Vehicle Licensing and Title Coordination Number of Licenses and Titles
Maintained 2032 210.63 42,757
Vehicle Acquisition and Preparation Number of Vehicles and Equipment
Purchases 500 1,665.88 832,939 Vehicle Lease and Rental Management Number of Vehicles Leased/Rented 222 1,061.00 23,342 Total Operation and Maintenance 1,123,461 Total Capital Outlays 22,573,825 Service Subtotal 23,697,286 Vehicle and Equipment Maintenance and Repair Light Equipment Maintenance and Repair Number of Vehicles Maintained 7,336 2,404.48 17,639,271 Heavy Equipment Maintenance and Repair
Number of Vehicles and Equipment Maintained 2,162 12,610.70 27,264,327
Equipment Pool and Loaner Operation Number of Pool and Loaner Vehicles 571 490.71 280,195 Total Operation and Maintenance 45,183,792 Total Capital Outlays 5,565,643 Service Subtotal 50,749,435 Fuel Environmental Operations Gallons of Fuel Dispensed 12,700,000 0.02 233,628 Fuel Operations Gallons of Fuel Dispensed 12,700,000 3.40 43,184,586 Total Operation and Maintenance 43,418,214 Total Capital Outlays 1,095,559 Service Subtotal 44,513,773 Vehicle and Equipment Disposal
Equipment Disposal Number of Vehicles and Equipment
to be Disposed of 8002 340.75 272,602 Total Operation and Maintenance 272,602 Total Capital Outlays 17,973 Service Subtotal 290,575 TOTAL BUDGET $119,251,069 1 Includes prorata allocation of general overhead, which is comprised of administration and support activities and the
indirect cost pool. 2 Projected number of units based on FY 2007/08 actual results.

Zero-Based Budget Pilot Fleet Management Program
v
Program and activities were justified using the following three (3) criteria: • Program necessity • Program placement and organization • Program accountability
The following tables highlight key results from the program justification phase of the Pilot.
Program Justification Summary
Program Necessity Legal Mandate Yes Links to Approved Priorities • Ordinance 08-08 annual budget
priorities and policy objectives • Ordinance 05-136 (resource
allocation based on Strategic Plan Priority Outcomes)
No
Yes
• Demand for Service Varies by activity • Duplication of Services Yes – The Aviation, Fire, Parks, Police, Water & Sewer and Transit
departments each perform some of their own acquisition and/or maintenance and repair services.
• Impact if Not Funded Elimination of the Program would result in reassignment of fleet activities to user departments who would then take on responsibility for requisitioning, assigning, maintaining, disposing, tracking and reporting on department-level fleets. The complete decentralization of the County’s fleet would lead to significant increases in fleet costs, further duplication of services and a lack of department focus on core program missions.
Program Placement and Organization
Program rests with department most appropriate to perform service
Yes
Program as currently organized lends itself to successful execution of goals and objectives
Yes
Program Accountability
Program Performance Performance measures should be expanded to include information on fleet size and composition, vehicle and equipment utilization and fleet ownership costs to provide policy and program decision-makers with a fleet profile that gives context to the budget and establishes baselines for future initiatives to improve program effectiveness and efficiency.
Program and Performance Reviews Yes Percent of Costs Covered by Proprietary Fees
FY 2008/09 revenues from user fees and charges, sale of retired vehicles and interest income total approximately $119.2 million or 99.99% of total allocated program costs.
Current Initiatives to Increase Efficiency or Effectiveness
Current initiatives include implementation of new fleet management software, updating fuel procedures and security measures and developing a new fuel purchasing contract.

Zero-Based Budget Pilot Fleet Management Program
vi
The results from the activity-based budget, program justification and activity rankings were utilized to prepare decision packages (budget options) that focus on fleet management practices to promote cost savings and enhanced cost control. The following table provides a listing of fleet management practices outlined in each decision package and whether they are currently utilized to manage the Program. Any items marked with a “ ” in the “no” column represents an opportunity to increase the cost effectiveness of fleet operations.
Decision Package Summary1
Current Practice
DECISION PACKAGE/Fleet Management Practice Yes No DECISION PACKAGE ONE – FLEET SIZE AND COMPOSITION Right-sizing
Right-sizing study performed Vehicle Allocation Table maintained
Vehicle assignment and utilization Vehicle assignments justified Utilization guidelines established Utilization reviews performed
DECISION PACKAGE TWO – VEHICLE AND EQUIPMENT REPLACEMENT PLANNING Replacement guidelines established Long-term replacement plan prepared Reserve funds maintained for all vehicle and equipment replacements DECISION PACKAGE THREE – COST COMPETITIVENESS Effective communication of chargeback rate methodology to customers Chargeback rates recover all costs Chargeback rates are serviced based Transaction-based billing provided to customers Chargeback rates externally benchmarked Chargeback rates internally benchmarked DECISION PACKAGE FOUR – MEASURES OF COST AND SERVICE Fleet Operations
Measures for cost of service reported Measures for cost competitiveness reported Measures for service levels reported Measures for service quality reported Measures for productivity reported
Replacement Planning Measures for cost reported Measures for adherence to replacement guidelines reported
Fleet Asset Management Measures for fleet size reported Measures for fleet age reported Measures for fleet utilization reported
1 Some of the fleet management practices included in this analysis are heavily influenced by fleet customers and policy and
program decision makers; and therefore, are not the sole responsibility of the Fleet Management Program.


Zero-Based Budget Pilot Fleet Management Program
viii

Zero-Based Budget Pilot Fleet Management Program
1
OBJECTIVE Create and execute a zero-based budget pilot for the FY 2008/09 operating budget of the Fleet Management Program utilizing zero-based budgeting principles and performance measurement concepts by:
Developing activity-based program budget, Justifying program, Prioritizing program activities, and Presenting potential budget options.

Zero-Based Budget Pilot Fleet Management Program
2
BACKGROUND The County has utilized program budgeting since the enactment of the Citizen’s Bill of Rights of the Miami-Dade County Home Rule Amendment and Charter (Home Rule) which stipulates that a program level budget must be presented in conjunction with the budget required by state statute (F.S. Chapter 129). In 2005, the Miami-Dade County Board of County Commissioners (BCC) approved Ordinance 05-136, Governing for Results, which further refined the program level budget requirement of the Home Rule by requiring that County resource allocation (budgeting) be based on the planning, measuring and monitoring of program performance in relation to the County’s Strategic Plan. Under the current program budgeting structure, each department is comprised of programs and activities. The following table presents activities maintained in the financial systems for the General Services Administration Department’s Fleet Management Program.
Current Fleet Management Program and Activities
Program Activity
Director’s Office Light Equipment Maintenance
Heavy Equipment Maintenance Vehicle Replacement Program
Environmental Operations
Fleet Management
Building Program Source: RFRO
Financial Systems There are four (4) primary systems used to develop, track, monitor and report budget and financial information: Financial Accounting Management Information System (FAMIS), Automated Budget Development System (ABDS), Resourcing for Results Online (RFRO), and Capital Development Program (CDPWeb). FAMIS is the general ledger system that officially tracks and records the County’s financial activities. ABDS is the system utilized for the creation and modification of the budget. FAMIS and ABDS are traditional accounting and budgeting systems that utilize the same general structure of accounts: Department, Fund, Division, Section, and Index Code. At least twice a year FAMIS and ABDS are linked so that the prior year’s financial results from FAMIS can be downloaded into ABDS (December) and ABDS budget amounts can be uploaded into FAMIS (October). RFRO and CDPWeb are stand alone systems that utilize summarized information that has been manually entered by each County department to create the Proposed Resource Allocation and Multi-Year Capital Plan. RFRO is designed to link higher level financial information with text, performance measures, and statistics for the operating budget approval process. CDPWeb is utilized to display relevant information by project for the capital budget and multi-year capital plan.

Zero-Based Budget Pilot Fleet Management Program
3
In order to obtain the level of detail required to perform our analysis we utilized data contained in FAMIS for actual results and ABDS for budgets and projections, as available. These systems provide detailed financial information and reports by organizational structure and by program. Any differences noted between FAMIS/ABDS and RFRO have been noted in our analysis. Program Overview The Fleet Management Program is operated as one of eight divisions of the General Services Administration Department and is responsible for the acquisition, maintenance, fueling and disposal of the County’s fleet (light and heavy mobile equipment), subject to certain exclusions. In addition, the Program provides maintenance and fueling to approximately 22 non-county jurisdictions and administers the Vehicle Replacement Trust Fund (a voluntary light equipment reserve fund for future replacements). The following tables provide a summary of service exclusions and non-county jurisdictions served.
Summary of County Departments Excluded, Non-County Jurisdictions Serviced and Outsourced Services
SERVICE/Activity County Departments
Excluded Non-County Jurisdictions
Serviced Outsourced Services ACQUISITION Vehicle Acquisition • Transit
• Aviation • Police • Fire • Water and Sewer
• Jackson Memorial Hospital² • State Attorneys Office • State County Health Dept. • South Florida Education and
Training Council
Vehicle Lease and rental Management
• Police
MAINTENANCE Light Equipment Maintenance and Repair
• Aviation
• Jackson Memorial Hospital² • State Attorneys Office • State County Health Dept. • South Florida Education and
Training Council • City of Doral
• All Body work and Glass work
• Some major engine repairs, air conditioning, transmission and other repairs as needed
Heavy Equipment Maintenance and Repair
• Aviation • Parks and Recreation1 • Fire (Fire Suppression
Apparatus) • Water and Sewer • Transit (Buses)
• Jackson Memorial Hospital² • State County Health Dept.
• All Body work and Glass work
• Some major engine repairs, air conditioning, transmission and other repairs as needed
Equipment Pool and Loaner Operation
Loaners are limited to participants of the Vehicle Replacement Program for light equipment. Departments that do not participate include: • Transit • Aviation • Water and Sewer
• Jackson Memorial Hospital² • State Attorneys Office • State County Health Dept. • South Florida Education and
Training Council

Zero-Based Budget Pilot Fleet Management Program
4
FUELING Fuel • City of Miami
• Florida Highway Patrol • City of Miami Springs • Sunny Isles Beach • City of Sweetwater • Miami-Dade County Public
Schools • Federal Bureau of
Investigations • Indian Creek Village • Miami Parking System • North Bay Village • Office of the Attorney General • Town of Cutler Bay • US Marshalls • Village of El Portal • Village of Key Biscayne • Village of Virginia Gardens • State Attorney’s Office • SFETC • Jackson Memorial Hospital² • State Department of Children
and Families • City of Doral • State County Health Dept.
DISPOSAL Equipment Disposal Departments that own
vehicles outside of GSA Fleet Management including but not limited to: • Aviation • Seaport • Parks and Recreation • Water and Sewer • Solid Waste • Public Works
• Jackson Memorial Hospital² • State Attorneys Office • State County Health Dept. • South Florida Education and
Training Council
1 Parks and Recreation Department heavy equipment maintenance and repair is in the process of being transferred to Fleet
Management. 2 Jackson Memorial Hospital planned to discontinue use of Fleet Management fuel as of Oct. 1, 2008; however, the transition
has not been finalized. Program services are provided through a central office, a vehicle processing facility, 19 shop locations (12 light equipment and 7 heavy equipment) and 28 fuel sites located throughout the County.

Zero-Based Budget Pilot Fleet Management Program
5
Program Cost and Funding
Program Costs and Funding FY 2005/06 – 2008/09
Description 2005/06 Actual
2006/07 Actual
2007/08 Actual1
2008/09 Budget $ Change % Change
Program Expenditures2, 3
Personnel (Salaries & Fringe Benefits) $ 19,537,772 $ 20,279,751
$ 21,144,404 $ 21,971,237 $ 826,833 3.9%
Other Operating 56,089,407 56,725,740 72,027,906 75,670,832 3,642,926 5.1% Capital 21,422,487 36,140,290 13,626,007 21,609,000 7,982,993 58.6%
Total Operating Expenditures $ 97,049,666 $ 113,145,781 $106,798,317 $ 119,251,069 $ 12,452,752 11.7%
Program Revenues Physical Environment $ 974,229 $ 974,850 $ 1,089,218 $ 1,192,000 $ 102,782 9.4% Other Charges for 95,883,067 104,376,809 104,930,469 110,144,000 5,213,531 5.0% Interest Earnings 396,351 370,395 81,616 300,000 218,384 267.6% Fixed Assets 1,365,376 1,153,942 1,185,650 1,500,000 314,350 26.5% Other Miscellaneous - 299,775 155,669 - (155,669) -100.0% Interfund Transfer 1,000,000 3,100,000 2,100,000 2,100,000 - 0.0% Non operating Source - - - 4,009,000 4,009,000
Total Operating Revenues $ 99,619,023 $ 110,275,771 $109,542,622 $ 119,245,000 $ 9,702,378 8.9%
Supplemental Information Budget Full Time Equivalent (FTE) 257 272 273 274 1 .4% Actual FTE 239 258 263 Number of Vehicles – Light4 7,882 7,697 7,929 7,3365 -593 -7.5% Number of Vehicles and Equip – Heavy4 1,822 2,152 2,137 2,1625 25 1.2%
Source: FAMIS, ABDS, and Departmental Records 1 FY 2007/08 actual amounts are preliminary and may be subject to adjustment based on completion of the closing
process and the independent audit. 2 Program expenditures presented in this table may differ significantly from those presented under the activity-based
costing approach used in this analysis. 3 See Appendix 1 for detailed program costs by object code 4 Amounts represent the number of units maintained by the Program according to inventory reports dated October
2005, 2006, 2007 and 2008. 5 See Appendix 2 for Vehicle and Equipment Count by Department
Zero-Based Budget Pilot Fleet Management Program
6
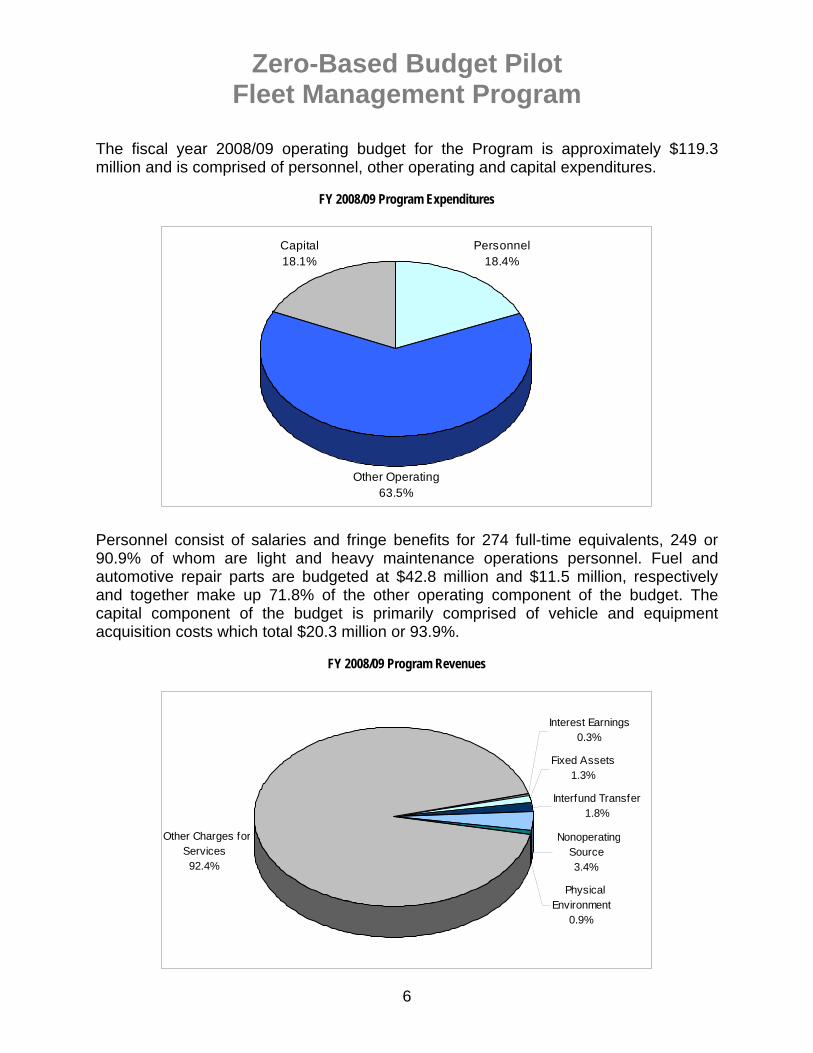
The fiscal year 2008/09 operating budget for the Program is approximately $119.3 million and is comprised of personnel, other operating and capital expenditures.
FY 2008/09 Program Expenditures
Personnel 18.4%
Other Operating63.5%
Capital18.1%
Personnel consist of salaries and fringe benefits for 274 full-time equivalents, 249 or 90.9% of whom are light and heavy maintenance operations personnel. Fuel and automotive repair parts are budgeted at $42.8 million and $11.5 million, respectively and together make up 71.8% of the other operating component of the budget. The capital component of the budget is primarily comprised of vehicle and equipment acquisition costs which total $20.3 million or 93.9%.
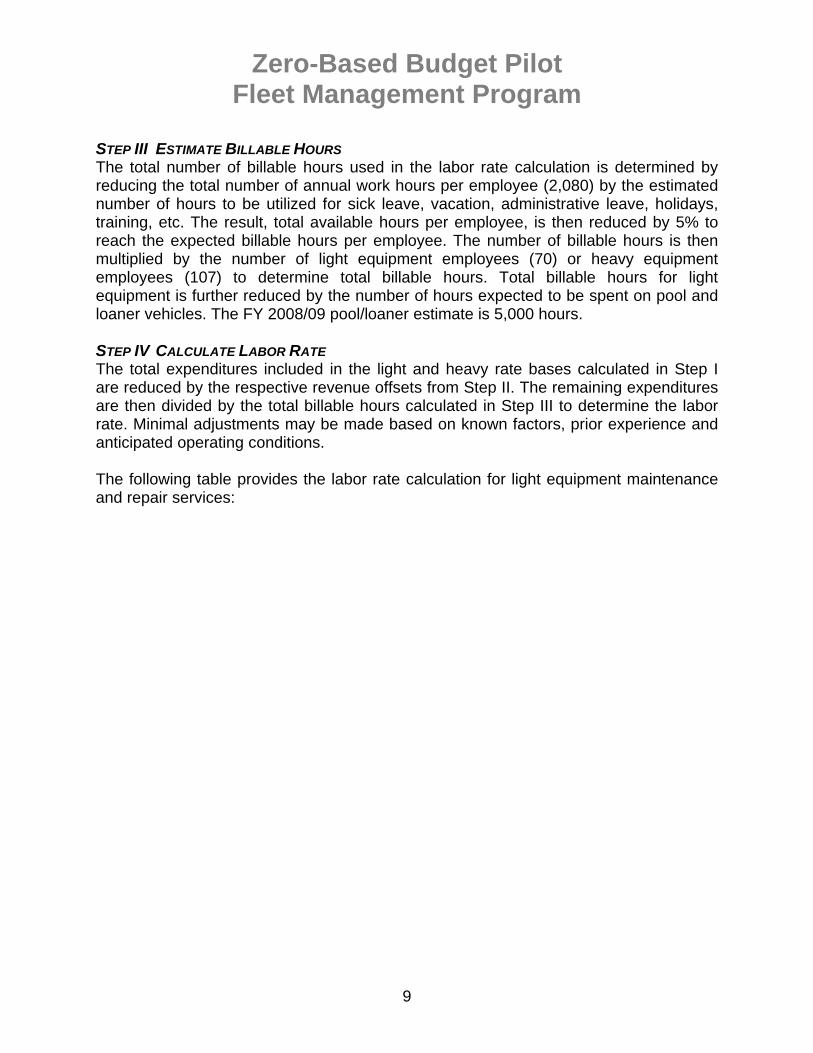
FY 2008/09 Program Revenues
PhysicalEnvironment
0.9%
Other Charges forServices92.4%
Interest Earnings0.3%
Fixed Assets1.3%
Interfund Transfer1.8%
NonoperatingSource3.4%

Zero-Based Budget Pilot Fleet Management Program
7
Funding for the Program is primarily derived from other charges for services (internal service charges) which make up 92.4% of budgeted operating revenues for fiscal year 2008/09. Internal service charges consist of amounts recovered for internal support services provided by the Program for the continued operation of the County government and include charges for maintenance and repairs (light and heavy); fueling; and the use of pool and loaner vehicles. Maintenance and repairs costs are recovered through a labor rate for in-house personnel and markups on invoices for outsourced services (commercial repairs) and parts. Fuel costs are recovered through a surcharge added to the cost per gallon of fuel dispensed. Pool vehicle costs are recovered through a cost per mile plus and hourly rate. Loaner vehicle costs are recovered through a cost per mile. The following table summarizes the various rates and charges established for FY 2008/09:
FY 2008/09 Rates and Charges
Service Description Rate/Charge Hourly Labor Rate - Light $71.00 Hourly Labor Rate - Heavy $71.00 Parts Invoice Markup – Light 25% Parts Invoice Markup – Heavy 20% Outsourced Repairs Invoice Markup – Light 12% Outsourced Repairs Invoice Markup - Heavy 12%
Maintenance and Repairs
Hourly Maintenance and Repairs Labor Surcharge
$2.00 per hour for all departments that do not participate in the vehicle replacement fund $.05 for internal customers $.10 for external customers
Fuel Fuel surcharge per gallon of fuel dispensed
$.08 all customers (internal and external) for mandated environmental/fueling projects
Per Mile Usage Rate $.27 Motor Pool Hourly Usage Rate $1.75 to $4.50 for replacement of
pool vehicles Loaner Per Mile Usage Rate $.30
Additional revenue sources for the program totaling $9.1 million in FY 2008/09 include:
Physical environment – Per gallon fuel charge for environmental/fueling projects Interest earning – Interest earned on Vehicle Replacement Trust Fund balance Fixed assets – Salvage value of retired vehicles and equipment including
proceeds from actions sales and amounts recovered from scrap Interfund transfer – Transfer of amount recovered from user departments to
building fund for facility improvements Non operating sources – Carryover from the capital program

Zero-Based Budget Pilot Fleet Management Program
8
Rates and Charges Program rates and charges are structured to recover program and allocated department-level direct and indirect costs associated with the delivery of Fleet services. Each year, labor rates are established based on budget projections for the ensuing year. The following four (4) steps outline the general process and methodology for establishing the light equipment maintenance and repair labor rate (light rate) and the heavy equipment maintenance and repair labor rate (heavy rate): STEP I DETERMINE EXPENDITURE BASE The first step in this process determines which Program costs will be recovered from user departments through the light rate and which costs will be recovered through the heavy rate. The light rate base is comprised of 100% of the light equipment and repair base budget (Fund 050 section GS0202) plus 50% of the administrative services budget (Fund 050 section GS0201). The other 50% of the administrative services budget is added to the base budget for heavy equipment and repairs (Fund 050 section GS 0204) expenditures to reach the heavy rate base. STEP II IDENTIFY REVENUE OFFSETS Step II involves determining which program revenues can be used to offset expenditures included in the light and heavy rate bases identified in Step I. The offsets for the light and heavy rate bases are derived from the following five (5) sources:
1. Fuel Revenues – Cost plus per gallon fee of $0.05 for internal customers and $0.10 for external customers to cover the cost of facilities and administrative fees. (Fuel revenues exclude $0.08 per gallon charge for environmental and fueling projects.)
2. Commercial Repair Revenues – Cost plus 12% of all invoices for outsourced services.
3. Parts Revenues – Cost plus 25% for light repairs and 20% for heavy repairs. 4. Shop Expendables Revenues – Fixed amount added to each repair order to
cover the total cost of supplies and incidental small parts used throughout the year.
5. Warranty Recovery Revenues – Amounts recovered through outside contractor for warranty claims.
In addition to the above named revenue offsets, the light rate includes revenue from mileage charges for pool and loaner vehicles of $0.27 and $.030, respectively. (Revenues from the hourly charge for pool vehicles are excluded, as these funds are utilized for vehicle replacements.)
Zero-Based Budget Pilot Fleet Management Program
9
STEP III ESTIMATE BILLABLE HOURS The total number of billable hours used in the labor rate calculation is determined by reducing the total number of annual work hours per employee (2,080) by the estimated number of hours to be utilized for sick leave, vacation, administrative leave, holidays, training, etc. The result, total available hours per employee, is then reduced by 5% to reach the expected billable hours per employee. The number of billable hours is then multiplied by the number of light equipment employees (70) or heavy equipment employees (107) to determine total billable hours. Total billable hours for light equipment is further reduced by the number of hours expected to be spent on pool and loaner vehicles. The FY 2008/09 pool/loaner estimate is 5,000 hours. STEP IV CALCULATE LABOR RATE The total expenditures included in the light and heavy rate bases calculated in Step I are reduced by the respective revenue offsets from Step II. The remaining expenditures are then divided by the total billable hours calculated in Step III to determine the labor rate. Minimal adjustments may be made based on known factors, prior experience and anticipated operating conditions. The following table provides the labor rate calculation for light equipment maintenance and repair services:

Zero-Based Budget Pilot Fleet Management Program
10
Labor Rate Calculation – Light Equipment Maintenance and Repair Services
Step I ExpendituresBase Budget 38,373,000$ 1/2 of Administration 1,709,000
Total Step I 40,082,000$
Step II RevenuesFuel 21,830,000$ Commercial Repair 4,144,000 Parts 4,625,000 Shop Expendables 300,000 Pool/Loaner Mileage 1,000,000 W arranty Recovery 80,000
Total Step II 31,979,000$
Step III Billable HoursAvailable Hours 2,080$ Less Avg Sick, Training, Etc (300) Net Available Hours 1,780$ Multiplied by % on Clock 95%Billable Hours Per Employee 1,691$ Multiplied by Number of Employees 70 Light Equipment Billable Hours 118,370$ Less: Time Spent on Pool/Loaners (5,000)
Total Step III 113,370$
Step IVTotal Step I 40,082,000$ Less: Total Step II (31,979,000) Remainder 8,103,000$ Div ided by Total Step III 113,370
Labor Rate 71.47$ Final Labor Rate 71.00$

Zero-Based Budget Pilot Fleet Management Program
11
ACTIVITY-BASED BUDGETING The results presented in this analysis are based on practical applications of the following four zero-based budgeting principles: (1) activity-based budgeting; (2) program justification; (3) priority rankings; and (4) decision packages. The foundation of this analysis is activity-based budgeting which is utilized to present program budgets at the activity level based on the types of service provided. In order to achieve this, we reviewed programs in relation to the services provided and activities performed by reviewing responses to the following:
What does the program do? What services are performed? Who are the program’s customers (internal and external)? What do customers receive as an end output? and What groups of activities form the services performed?
Based on the results of this exercise, we defined the Program’s services and activities by dividing the program into services, which define the product or benefit to the County and subdividing services into specific activities performed to deliver services. As a result of this definition process, the Fleet Management Program includes five (5) services and sixteen (16) activities as listed in the following table. These services and activities, as defined, formed the basis for the development of activity-based budgets using activity-based costing.

Zero-Based Budget Pilot Fleet Management Program
12
Fleet Management Service and Activity Definition
Program1 Service2 Activity3
Executive Direction and Control - includes program management, executive leadership and policy oversight. Personnel, Finance, and Accounting – includes all program personnel, finance and accounting tasks as well as managing the vehicle replacement and building funds. IT and Systems Maintenance – includes infrastructure support and maintenance of the following program computer networks and database applications: Equipment management system, EJ Ward automated fueling system, Reporting server and Fleet web applications. Contracts Management – includes negotiating and monitoring major contracts for the purchase of goods and services required to acquire, maintain and operate vehicles and equipment. Also includes maintenance and monitoring of service contracts with non-county departments.
Administration and Support
Asset Management and Tracking - includes managing and tracking fleet from acquisition through disposal. Fleet Assessment – includes monitoring vehicle utilization and mileage to project the number and type of vehicles that may replaced in the ensuing year as well as the number and type of vehicles that may be under utilized. Vehicle Specification Preparation - includes determining the types of vehicles required to fulfill specific requirements and ensures that vehicles purchased meet all regulatory requirements for use. Vehicle Acquisition and Preparation - includes procurement of heavy and light equipment for various County departments. Vehicle Lease and Rental Management - includes management of lease and rental agreements.
Vehicle and Equipment Acquisition
Vehicle Licensing and Title Coordination - includes coordinating the registration and licensing of all vehicles acquired through the Program. Light Equipment Maintenance and Repair - includes preventive maintenance, repairs, repair order and vehicle history administration, and stockroom operations. Heavy Equipment Maintenance and Repair - includes preventive maintenance, repairs, repair order and vehicle history administration, and stockroom operations.
Vehicle and Equipment
Maintenance and Repair
Equipment Pool and Loaner Operation - includes fleet motor pool vehicles available for rent and temporary vehicle Loaners to be used while vehicles are being maintained or repaired. Fuel Operations - includes maintaining and operating 28 fueling sites throughout the county, supporting all County departments, as well as other non-county entities.
Fuel
Environmental Operations - includes coordinating the execution of infrastructure improvements to meet EPA mandates at the 28 fueling sites and 19 repair shops.
Fleet Management
Vehicle and Equipment Disposal
Equipment Disposal - includes reviewing vehicles and equipment to ensure that they are eligible for disposal and coordinating auctions for asset disposal.
1 Program – Separately identifiable and managerially discrete function within a County department that is designed to
meet a mandate or defined citizen need. 2 Service – Group of related activities that produces a department’s main products or services. 3 Activity – Work units (business processes) designed to meet program objectives that are clearly defined with specific
timeframes and measurable output.
Zero-Based Budget Pilot Fleet Management Program
13
Activity-Based Costing Activity-based costing (ABC) is a cost accounting tool that is used to identify the costs of producing products or providing services by assigning direct and indirect costs to activities based on its consumption of resources. The advantage of ABC over traditional cost accounting is that it generally allows for estimates of total costs that are more accurate by replacing a single indirect cost pool with activities. The use of activities converts costs that would otherwise be considered indirect costs into costs that can be directly assigned to activities as direct costs. The remaining indirect costs are allocated to activities using a resource driver (a variable that affects the cost of the activity); and finally, activities are directly assigned to cost objects or allocated using an activity cost driver (variable that affects the cost of the service). In government, ABC is generally used for one or more of the following five (5) purposes:
1. Rate setting 2. Managed competition 3. Service redesign 4. Activity based budgeting 5. Process Improvement
The sophistication of the methodology used is dictated by the purpose of ABC. For example, full costing should be used for rate setting and managed competition while a more simple method may be used for service redesign, activity based budgeting and process improvement. For the purpose of this analysis, we utilized a more simplified approach than would be required under full costing. The steps we utilized to develop the activity-based budget were as follows: STEP I We obtained a schedule of resources required to execute the Program at the staffing and service levels currently budgeted in the FY 2008/09 Proposed Budget and Multi-Year Capital plan, as adopted (see Exhibit 1).

Zero-Based Budget Pilot Fleet Management Program
14
STEP II Resources were categorized as follows: direct costs, program specific overhead and general overhead at the object level (see Exhibit 2). Direct costs are personnel and other costs that have a directly traceable relationship with direct service activities. Program specific overhead are costs that are essential to performing direct service activities, but are not directly associated with producing a unit of output or outcome (i.e. fuel tank replacements to meet EPA mandates); and general overhead are costs that provide support, but cannot be readily associated with direct service activities (i.e. executive direction and administrative support). STEP III Direct costs, program specific overhead and general overhead were assigned to activities at the object code level using one of the following three methods: direct tracing; cause-and-effect basis; or prorata basis using a threshold of $1 million. Resources that have a directly traceable relationship to activities were assigned using direct tracing; resources that were assigned based on the extent to which they are caused by and contribute to an activity were assigned on a cause-and-effect basis. The remaining costs that met our threshold were allocated on a prorata basis utilizing selected methodologies, as appropriate. All remaining resources (resources below our threshold) were allocated to the indirect cost pool. Amounts included in the indirect cost pool represent resources that have a general relationship to activities or the effort required to perform allocations is greater than the benefits to be derived (see Exhibit 3). The following table presents descriptions and allocation methods used to assign costs for all object codes meeting our threshold.

Zero-Based Budget Pilot Fleet Management Program
15
Allocation Methods by Object Code
Object Code Description Allocation Methodology1
1-100 Personnel Costs: • Salaries and Fringe Benefits for 274 budgeted
full-time equivalent positions
• Direct Tracing - Estimated % of
Staff Time Devoted to Each Activity (see Appendix 3)
240 Outside Contractual Services: • Outsourced heavy and light maintenance and
repairs • Installation and removal of decals and police
cages
Direct Tracing • Direct Tracing - Allocated to
Vehicle Acquisition and Preparation and Vehicle Disposal Based on Estimated % of Staff Time Devoted to Each Activity
260 GSA Charges: • Building repairs to fleet facilities • Construction projects for fleet facilities
• Indirect Cost Pool • Cause and Effect - Allocated to
Activity based on project location 261 ITD:
• ETSD • Fleet Management Software
• Direct Tracing • Direct Tracing
410 Fuel & Lubricants: • Unleaded and diesel fuel • Chicago Climate Exchange Program penalty
• Direct Tracing • Cause and Effect
430 Automotive Repair: • Parts for in-house repairs • Parts for EJ Ward fueling terminals
• Direct Tracing • Direct Tracing
432 Equipment & Non-Capital: • Shop supplies (i.e. nuts, bolts)
• Direct Tracing
501 General Fund Transfer-Out: • Internal transfer from Vehicle Replacement
Program to Fleet Capital Program for Fleet Facilities
• Cause and Effect – Allocated to
Activity based on project location
570 Interfund Transfer: • GSA Department –level overhead • Potential 4th Quarter COLA
• Indirect Cost Pool • Indirect Cost Pool
951 Automobiles and Vehicles: • New and replacement vehicles and equipment
• Direct Tracing
990 Infrastructure: • Three EPA mandated double walled fuel tanks
• Cause and Effect
1 Includes allocation methodologies that are based on Department estimates of the amount of staff time devoted to
each activity. Estimates of time do not represent actual usage and therefore do not highlight used and unused resources; as a consequence, information cannot be utilized to identify whether excess capacity exists. Budgets based on actual workload analysis such as time in motion studies would provide a more accurate reflection of resource utilization.

Zero-Based Budget Pilot Fleet Management Program
16
STEP IV Total program costs for each direct service activity was calculated by allocating general overhead costs (including department-level overhead) to direct activities based on total direct labor (see Exhibits 4 through 6). STEP V Total program costs for each direct service activity were separated into the following two categories: operating and maintenance costs and capital outlays (see Exhibit 7). The following expenditures were considered capital outlays:
Object code 261 - Acquisition of fleet management software ($2,000,000) Object code 501 - Internal transfer from vehicle replacement fund to capital
program for fleet facilities ($3,805,000) Object code 951 - Acquisition/replacement of vehicles and equipment
($20,298,000) Object code 990 - Installation of three EPA mandated double walled fuel tanks
($1,050,000) STEP VI The results of Steps 4 and 5 were used to calculate activity unit costs where appropriate by reviewing major outputs for each Program activity and selecting the output that most accurately reflects the cost driver for the activity. Total activity costs were divided by the selected output to calculate the activity cost per output (see Exhibit 8). Unit Cost Analysis One result of activity-based budgets is the production of unit costs. Unit cost, an efficiency indicator, measures the cost of producing an output or outcome. Maintaining unit costs at the activity level assists management and decision makers by: 1. predicting how changes in demand for products and services affect budgets; 2. determining whether changes in program budgets are due to changes in service levels or changes in cost per unit; 3. evaluating whether efficiencies are improving over a period of time; and 4. establishing baselines for benchmarking against internal or external sources such as other County departments, other governments and private industries providing similar services. (Care should be taken when unit costs are utilized to compare similar activities within and outside of the government as there may be significant variations in the method and approach to performing cost allocations and unit cost calculations.)

Zero-Based Budget Pilot Fleet Management Program
17
Unit costs are comprised of direct costs and indirect costs (program specific overhead and general overhead). The direct cost portion of unit costs are generally the costs that vary with the volume of output produced; while program specific overhead and general overhead unit costs generally represent the fixed costs that are likely to remain if the activity is reduced or eliminated. Consequently, unit costs that primarily consist of variable costs promote a simplified approach for comparing the total costs at various output levels and clearly highlight changes in unit costs resulting from increased/decreased efficiencies. The opposite is true for units that contain significant fixed costs as it is more difficult to determine whether changes in unit costs are due to changes in efficiency or quantity. We calculated and included the direct and indirect components of unit costs to enhance the usefulness of unit cost information in this and future analyses. Activity-Based Program Budget The following table presents results of the activity-based program budget for the Fleet Management Program.
Service/Activity
Operation and
Maintenance1 Capital
Outlays1
Total FY 2008/09
Allocated FTE2
Vehicle and Equipment Acquisition Fleet Assessment $ 66,580 $ 5,223 $ 71,802 0.3 Vehicle Specification Preparation 157,843 800,374 958,217 1.0 Vehicle Acquisition and Preparation 832,939 21,763,044 22,595,983 4.8 Vehicle Lease and Rental Management 23,342 1,831 25,173 0.2 Vehicle Licensing and Title Coordination 42,757 3,354 46,111 0.4 Total $1,123,461 $22,573,825 $ 23,697,286 6.6 Vehicle and Equipment Maintenance and Repair Light Equipment Maintenance and Repair $17,639,271 $ 3,161,579 $ 20,800,849 107.1 Heavy Equipment Maintenance and Repair 27,264,327 2,382,085 29,646,412 149.3 Equipment Pool and Loaner Operation 280,195 21,978 302,173 3.2 Total $45,183,792 $ 5,565,643 $ 50,749,435 259.6 Fuel Fuel Operations $43,184,586 $ 39,548 $ 43,224,134 4.6 Environmental Operations 233,628 1,056,011 1,289,639 0.5 Total $43,418,214 $ 1,095,559 $ 44,513,773 5.2 Vehicle and Equipment Disposal Equipment Disposal $ 272,602 $ 17,973 $ 290,575 2.6 Total $ 272,602 $ 17,973 $ 290,575 2.6 TOTAL $89,998,069 $29,253,000 $119,251,069 274.0
1 Includes prorata allocation of general overhead, which is comprised of administration and support activities and the indirect cost
pool. 2 Includes prorata allocation of 10.7 full time equivalent positions included in administration and support activities.

Zero-Based Budget Pilot Fleet Management Program
18
Operating Expenditures by Service (Allocated)
Equipment Acquisition23,697,286
19.87%
Maintenance and Repair
50,749,435 42.56%
Fuel44,513,773
37.33%
Equipment Disposal 290,575 0.24%
Operation and Maintenance Costs and Capital Outlays by Service (Allocated)
-
10,000,000
20,000,000
30,000,000
40,000,000
50,000,000
60,000,000
Operation and Maintenance 1,123,461 45,183,792 43,418,214 272,602
Capital Outlays 22,573,825 5,565,643 1,095,559 17,973
Total Budget 23,697,286 50,749,435 44,513,773 290,575
Equipment Acquisition
Maintenance and Repair
Fuel Equipment Disposal

Zero-Based Budget Pilot Fleet Management Program
19
PROGRAM JUSTIFICATION Program justification involves reviewing program services, activities and budgets to provide information to assist decision makers with their determination as to whether the government should continue providing programs, services and activities at the current level of funding and performance. This analysis utilizes the following three (3) criteria to evaluate programs:
1. Program necessity 2. Program placement and organization 3. Program accountability
Program Necessity Program necessity reviews the program’s purpose and the public benefit derived giving consideration to local, state and federal legal requirements; program and activity links to approved priorities; demand for service; duplication of services within the County; and potential adverse impacts of not funding the program. Local, State, and Federal Mandates This element of program necessity considers the existence of legal mandates to determine whether programs contain non-discretionary services and activities that are required to meet local, state and federal mandates. The Program is responsible for overseeing continued compliance with all fleet related legal mandates relating to vehicle specifications, safety standards, environmental protection and licensing. Following is a list of federal, state and local entities and the primary areas of enforcement related to fleet management.
Federal, State and Local Mandates
Regulating Entity Subject Federal Federal Department of Transportation Vehicle Specifications
Environmental Protection Agency Vehicle Specifications, Fuel, Environmental cleanup
American National Standards Institute Safety Standards State Florida Department of Transportation Vehicle Specifications Florida Department of Highway Safety and Motor Vehicles Vehicle Licensing and Titles
Local Miami-Dade County Equipment Disposal, Surplus
Vehicles

Zero-Based Budget Pilot Fleet Management Program
20
Program and Activity Links to Approved Priorities This element of program necessity considers whether programs address or contribute to addressing at least one of the following resource allocation priorities established by the Miami-Dade County Board of County Commissioners (BCC):
Ordinance 08-08, which requires the annual adoption of budget priorities and policy objectives; and/or
Ordinance 05-136, Governing for Results, which establishes the strategic plan as the framework for the allocation of resources.
The following table provides a summary of department’s views of its contribution to the achievement of results related to the BCC 2008/09 budget priorities and policy objectives adopted in accordance with Ordinance 08-08; and the resource allocation priorities as established by Ordinance 05-133 related to strategic plan priority outcomes for the enabling strategies service area.
Fleet Management Program Links to Approved Priorities
Approved Priority Program and Activity Links1
Countywide Budget Priorities: Board of County Commission 2008/09 Budget Priorities and Policy Objectives
No
Enabling Strategies Strategic Plan Priority Outcomes: Clearly-defined performance expectations and standards
Program activities influence the achievement of desired results by developing, tracking and monitoring performance measures that report cost, utilization, productivity and quality of fleet services.
Easily accessible information regarding County services and programs
Program activities influence the achievement of desired results by providing user departments with automated information regarding the availability and status of fleet services (i.e. fuel site locations, appointment scheduling, ready line).
Streamlined and responsive procurement process
Program activities influence the achievement of desired results by facilitating timely acquisition of vehicles, equipment and related supplies to maximize user department access to safe, reliable transportation and equipment for the provision of County services.
"Best-value" goods and services (price, quality, terms and conditions)
Program activities influence the achievement of desired results by managing contracts and developing vehicle and equipment specifications based on criteria and terms that promote acquisition of fleet related goods and services at the best value.
User friendly e-government sharing information and providing expanded hours and services
No
County processes improved through information technology
No
Motivated, dedicated workforce team aligned with organizational priorities Workforce skills to support County priorities (e.g. leadership, customer service, fiscal problem solving, technology, etc.)
Program activities influence the achievement of desired results by providing fleet operations personnel with tools (training, technology and other support) and recognition to positively impact overall motivation, morale and preparation.

Zero-Based Budget Pilot Fleet Management Program
21
Approved Priority Program and Activity Links1
Safe, convenient and accessible facilities planned and built ready to meet needs
Program activities influence the achievement of desired results by promoting safety of fuel site facilities through training and other safety practices.
Safe and reliable vehicles ready to meet needs
Program activities play a critical role in the achievement of desired results by providing comprehensive fleet management services to meet the transportation needs of user departments.
Sound asset management and financial investment strategies
No
Planned necessary resources to meet current and future operating and capital needs
Program activities influence the achievement of desired results by maintaining necessary data and performing analysis and advise regarding resources needed to maintain efficient fleet operations.
Cohesive, standardized countywide financial systems and processes
Program activities influence the achievement of desired results by utilizing financial and contract development practices that promote uniform accounting and procurement practices.
Alignment of services provided with community's needs and desires
Program activities influence the achievement of desired results by: • providing user departments with specific vehicle and equipment
specifications to meet department missions; and • assisting with responsibilities regarding environmental safety.
Achievement of performance targets Program activities influence the achievement of desired results by developing, tracking, monitoring and supporting performance measures of cost, utilization, productivity and quality of fleet services.
Accountability to the public at every level of the organization Continuously improving government
Program activities influence the achievement of desired results by utilizing internal processes that promote: • safeguarding of fleet assets; • cost control; fleet data integrity; • compliance with federal, state and local mandates; and • ensuring safety and reliability of vehicles and equipment.
Opportunities for every registered voter to conveniently cast a vote
Program activities influence the achievement of desired results by supporting most user department missions including those involved with the voting process.
1 Activity links to strategic plan vary by priority outcome. Specific activities involved and the degree to which they influence the achievement of desired results are included in the department’s priority rankings by activity (see Appendix 4).

Zero-Based Budget Pilot Fleet Management Program
22
Demand for Service This element of program necessity considers whether the demand for program services are increasing or decreasing. The following table describes the demand for program services by activity.
Demand for Service by Activity
Activity Demand for Service Comments
Executive Direction and Control Increasing Increased attention to fleet management issues
Personnel, Finance and Administration
Increasing Increased attention to fleet management issues
IT and Systems Maintenance Increasing Increased attention to fleet management issues
Contracts Management Increasing Increased need to oversee procurement process
Asset Management and Tracking Increasing Increased demand for accountability and ongoing need to meet state requirement for annual inventory
Fleet Assessment Increasing Increase in attention of fleet management issues and County Executive Office (CEO) mandated vehicle reduction program
Vehicle Specification Preparation Increasing Increased requests for specialized vehicles
Vehicle Acquisition and Preparation Decreasing CEO mandated vehicle reduction program
Vehicle Lease and Rental Management
Decreasing CEO mandated vehicle reduction program
Vehicle Licensing and Title Coordination
Decreasing CEO mandated vehicle reduction program
Light Equipment Operations Increasing Extension of vehicle life cycle from 80K to 100k miles
Heavy Equipment Operations Increasing Increasing complexity of equipment (i.e. solid waste conversion from rear loaders to side arm loaders)
Equipment Pool and Loaner Increasing Reduction in number of Departmental assigned vehicles
Fuel Operations Increasing Despite consumption remaining level, the demand for fuel operations has increased with the implementation of vehicle implementation technology system (VIT) and other fuel management administrative initiatives such as alternative fuel, security, crew cared controls, etc.
Environmental Operations Increasing EPA mandates
Equipment Disposal Increasing CEO mandated vehicle reduction program
Zero-Based Budget Pilot Fleet Management Program
23
Duplication of Services This element of program necessity considers whether similar services are provided within the County that may be appropriate for consolidation of like services. Although the Program is the designated central fleet management organization, it does not provide comprehensive fleet management services for the entire County fleet. The Aviation, Fire, Parks, Police, Water & Sewer, and Transit departments each perform their own acquisition and/or maintenance and repair services (see Program Overview section above). While there are benefits to allowing selected departments to manage all aspects of their own vehicles and equipment, the potential drawbacks include:
lack of standard decision making, policies and procedures and cost analysis; increased risk of non-compliance with regulations; administrative duplication of effort; and decreased economies of scale.
Impact if Program is Not Funded This element of program necessity includes whether there are potential adverse impacts of eliminating the program. The Program exists to provide fleet management and related support services to its internal customers, user departments. Since motor vehicles and equipment are vital tools for the delivery of County services, the services provided by the Program would still have to be performed if the Program were eliminated. Elimination of the program would likely result in the reassignment of program services and activities to user departments requiring them to perform their missions while burdened with additional responsibilities for requisitioning, assigning, maintaining, disposing, tracking and reporting on department-level fleets. The decentralization of the County’s fleet would lead to significant increases in fleet costs, further duplication of services and a lack of department focus on core program missions. Program Placement and Organization Program placement and organization focuses on two factors: 1. whether the program rests with the County department most appropriate to perform the service; and 2. whether the program as currently organized lends itself to successful execution of its goals and objectives. Our observations related to this criterion are based on information obtained throughout the Pilot process. Performing an organizational review or comparative analysis may yield different results.
Zero-Based Budget Pilot Fleet Management Program
24
Program Placement The Program is operated as a division of the General Services Administration Department. Centralizing the County’s fleet resources and expertise within GSA promotes cost control, accountability and transparency by providing:
County-wide repository for and reporting of information on vehicle and equipment deployment, use and cost
Uniform enforcement of federal, state and local requirements regarding vehicle and equipment specifications, safety, fueling, environmental cleanup, licensing and titles, surplus property, and disposal
Systems and processes to promote efficient and cost effective maintenance and fueling of vehicles and equipment
Management and oversight of decentralized maintenance model designed to provide users with access to fleet facilities throughout the County (see Program Organization below)
Program Organization The Fleet Management Program is administered by staff located in a central office, vehicle processing facility and decentralized repair shops. Program staff is divided into four sections: Administrative Services; Vehicle and Contract Services; Light Equipment Maintenance; and Heavy Equipment Maintenance. Each section is headed by a service manager who reports to the Fleet Management Division Director. The division director reports to the Director of GSA. The following table of organization provides a breakdown of budgeted Program staff and primary areas of responsibility.

Zero-Based Budget Pilot Fleet Management Program
25
Fleet Management Table of Organization
1 Includes one cross divisional FTE from GSA MIS for technical support 2 Finance and accounting conducted at both the department and program level. Overlap in functions may result in duplication
of efforts within the Department.
Program Accountability Program accountability is considered by reviewing: program performance; results of recent program and performance audits and reviews; the degree to which user fees and charges cover the cost of services; and current initiatives to increase program efficiency or effectiveness.
Fleet Management Division Director
2 FTE • Executive Direction
and Control • Fleet Assessment
Administrative Services 13 FTE1
• Personnel, Finance and Accounting2
• IT and Systems Maintenance
• Contracts Management • Asset Management and
Tracking • Fuel Operations (28 Fuel
Sites) • Environmental Operations • Equipment Disposal
Vehicle and Contract Services 11 FTE
• Vehicle Specification Preparation
• Vehicle Acquisition and Preparation
• Vehicle Lease and Rental Management
• Vehicle Licensing and Title Coordination
Light Equipment Maintenance
106 FTE • 12 Light Equipment
Maintenance and Repair Shops (7 shops are dedicated to Police),
• Equipment Pool and Loaner Operation
Heavy Equipment Maintenance
142 FTE • 7 Heavy Equipment
Maintenance and Repair (3 shops primarily service Solid Waste, 1 shop dedicated to tire repair/replacement, 1 shop dedicated to welding and off road equipment)
Zero-Based Budget Pilot Fleet Management Program
26
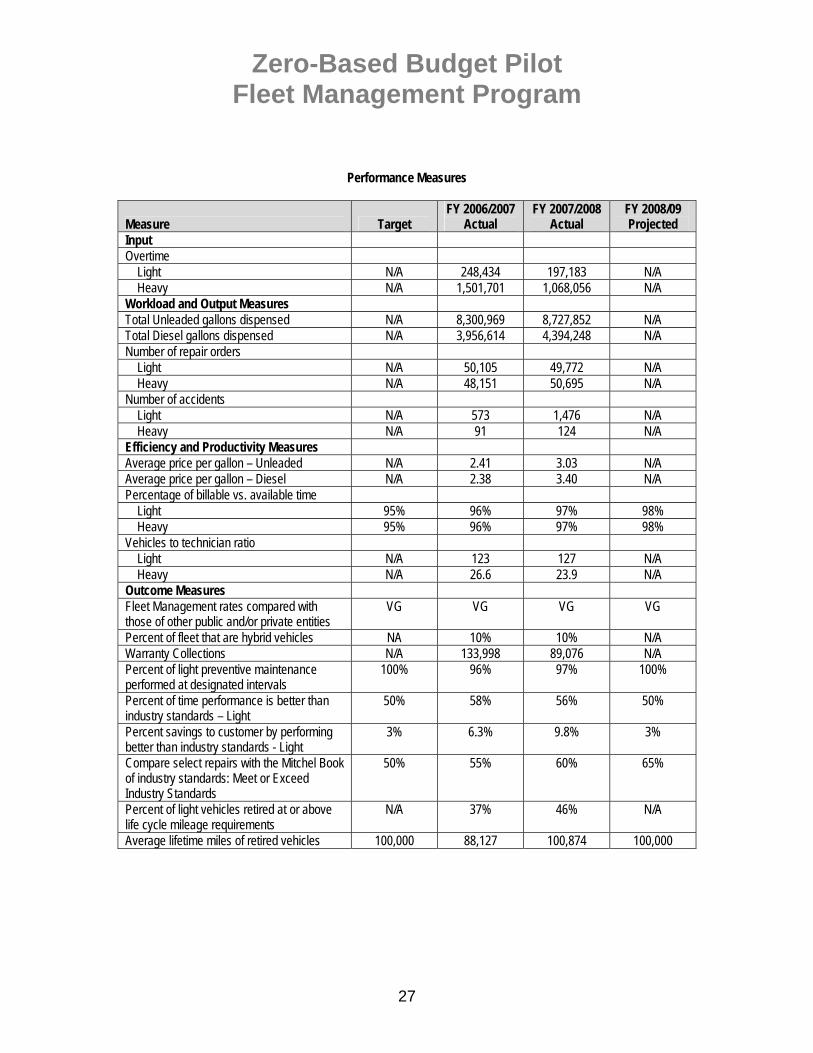
Program Performance Program performance highlights links between resources and anticipated results by reviewing performance measures utilized to track demand for service, resources used, work produced and whether specific outcomes were achieved. Performance measures generally fall into one of the following categories:
Workload – service demand (amount of work to be performed in a specified period of time)
Input measures – resources used to produce an output Output measures – quantity of units produced Efficiency measures – ratio of inputs used per unit of output Productivity measures – ratio of outputs per input Outcome (effectiveness) measures – degree to which desired result is achieved
includes service quality (satisfaction, timeliness and/or accuracy) and qualitative consequences associated with a program or service
Fleet Management utilizes several systems to monitor, evaluate and report the Program’s performance. The Active Strategy Enterprise (ASE) system is the countywide system used to report departmental Scorecard information. Scorecard details as well as additional performance information not reported in ASE are maintained in the Equipment Management System (EMS), which is the primary system, used to track acquisition, maintenance and fuel data. The Program also utilizes a mix of various electronic and manual systems to track performance including contracts and warranties. The performance measures listed on the table below provides a summary of measures currently used to provide indicators of fleet services, service levels, service quality and cost. These measures provide useful information regarding fleet operations; however, consideration should be given to expanding the breadth of measures to include fleet size and composition, vehicle and equipment utilization and fleet ownership costs. This additional information would provide policy and program decision-makers with a fleet profile that gives context to the operating budget and establish baselines for future initiatives to improve program effectiveness and efficiency.
Zero-Based Budget Pilot Fleet Management Program
27
Performance Measures
Measure Target FY 2006/2007
Actual FY 2007/2008
Actual FY 2008/09 Projected
Input Overtime
Light N/A 248,434 197,183 N/A Heavy N/A 1,501,701 1,068,056 N/A
Workload and Output Measures Total Unleaded gallons dispensed N/A 8,300,969 8,727,852 N/A Total Diesel gallons dispensed N/A 3,956,614 4,394,248 N/A Number of repair orders
Light N/A 50,105 49,772 N/A Heavy N/A 48,151 50,695 N/A
Number of accidents Light N/A 573 1,476 N/A Heavy N/A 91 124 N/A
Efficiency and Productivity Measures Average price per gallon – Unleaded N/A 2.41 3.03 N/A Average price per gallon – Diesel N/A 2.38 3.40 N/A Percentage of billable vs. available time
Light 95% 96% 97% 98% Heavy 95% 96% 97% 98%
Vehicles to technician ratio Light N/A 123 127 N/A Heavy N/A 26.6 23.9 N/A
Outcome Measures Fleet Management rates compared with those of other public and/or private entities
VG VG VG VG
Percent of fleet that are hybrid vehicles NA 10% 10% N/A Warranty Collections N/A 133,998 89,076 N/A Percent of light preventive maintenance performed at designated intervals
100% 96% 97% 100%
Percent of time performance is better than industry standards – Light
50% 58% 56% 50%
Percent savings to customer by performing better than industry standards - Light
3% 6.3% 9.8% 3%
Compare select repairs with the Mitchel Book of industry standards: Meet or Exceed Industry Standards
50% 55% 60% 65%
Percent of light vehicles retired at or above life cycle mileage requirements
N/A 37% 46% N/A
Average lifetime miles of retired vehicles 100,000 88,127 100,874 100,000

Zero-Based Budget Pilot Fleet Management Program
28
Program and Performance Reviews Program and performance review results provide historical perspective on various issues and considerations relating to performance, controls, and structure and organization. We requested and reviewed the results of program and performance related audits and other reviews and analysis conducted by the OCA, Department of Audit Management Services (AMS), Office of Strategic Business Management (OSBM) and Inspector General following is a summary of the items reviewed and the key observations noted.
Program and Performance Review Results
Performed
By Date Title/Purpose Key Observations OSBM 5/2000 Summary of Fleet
Management Activities in Selected Jurisdictions
• A 1997 report by the Allegheny Institute for Public Policy, a conservative think tank, found over 50 jurisdictions that had privatized which on average achieved a 30-40% cost savings.
• Managed competition has lead to savings in certain circumstances. • Fleet services usually manage:
- Fuel purchase and storage - Vehicle acquisition and disposal - External service contracts.
• The types of services outsourced vary significantly between jurisdictions.
OSBM 5/14/2002 Vehicle Maintenance Outside Entities
• Due to fleet’s infrastructure limitations, facilities and number of qualified technicians, any increase in non-County agencies would have a negative impact on Fleet’s ability to effectively and efficiently support County agencies.
• Fleet is experiencing a technician shortage due to a lack of qualified candidates. To cope with the shortage Fleet has had to increase overtime and contract out additional work.
OSBM 6/15/2004 GSA Comprehensive Review – Fleet Management Services and Charging Model
• All six of the jurisdictions surveyed provide the following core services - Purchasing & replacement; - Maintenance & repair; - Vehicle resale; - Loaner pool; and - Fueling.
• Miami-Dade had the second fewest mechanics per shop. • There was a significant disparity in the number of maintenance shops
between respondents. - Four jurisdictions had four or fewer shops - Two jurisdictions had seven shops - Miami-Dade had 18 shops.
• Miami-Dade County had the fewest mechanics per vehicle. • Charging model is inline with other jurisdictions.

Zero-Based Budget Pilot Fleet Management Program
29
Performed By Date Title/Purpose Key Observations
OSBM 1/2005 Miami-Dade Fire & Rescue – Heavy Fleet Maintenance Close-out & Review of Light/Medium Fleet Proposal
• A recommendation was made for heavy vehicle maintenance to remain in MDFR.
• Potential reoccurring savings of $302,000. • Savings based on a reduction in the use of outside contractors as a
result of mechanics receiving additional training and certifications. • Transitioning light fleet maintenance to MDFR would likely not lead to
any cost savings and should remain under Fleet’s purview. Note: No follow up analysis has been performed to measure actual recurring savings.
AMS 2/16/2005 Fleet Management Physical Inventory Observations: February 16, 2005
• Inventory is being tracked in a satisfactory manner. • Only minor adjustments were made to inventory values as a result of
the inventory. • Additional controls would be beneficial in limiting access to certain
high dollar value items. Note: Additional controls have been implemented.
AMS 5/15/2006 Audit Report – Tire Contract
• Most invoices had the correct pricing and were properly approved and supported.
• Discrepancies were noted in the number of tires issued per inventory records vs. work orders.
• Certain tires were not being recorded in inventory. • A number of tires were being replaced after only a fraction of their
expected useful life. • Payments were made for disposal of used tires when Fleet’s contract
states that a vendor will pick up the used tires free of charge. Note: Fleet Management has implemented audit recommendations and continues to monitor data entry and tire replacements.

Zero-Based Budget Pilot Fleet Management Program
30
Ability to Cover Cost of Services The ability to cover cost of services through fees and charges evaluates the degree to which user fees and charges (proprietary fees) support services. The Program is an internal service that recovers its costs through charges to its customers. The following table highlights the relationship between program costs and funding at the service and activity levels.
Proprietary Revenue by Service
Revenues as a % of
Operating
Expenditures Allocated
Operating Revenues Allocated Activity Cost
Program Cost
Acquisition Fleet Assessment 71,802 236 0.33% 0.00% Vehicle Specification Preparation 958,217 788,552 82.29% 0.66% Vehicle Acquisition and Preparation 22,595,983 25,683,452 113.66% 21.54% Vehicle Lease and Rental Management 25,173 83 0.33% 0.00% Vehicle Licensing and Title Coordination 46,111 152 0.33% 0.00% Total 23,697,286 26,472,475 111.71% 22.20% Maintenance and Repair Light Equipment Maintenance and Repair 20,800,849 19,669,183 94.56% 16.49% Heavy Equipment Maintenance and Repair 29,646,412 27,222,477 91.82% 22.83% Equipment Pool and Loaner Operation 302,173 1,000,993 331.26% 0.84% Total 50,749,435 47,892,653 94.37% 40.16% Fuel Fuel Operations 43,224,134 42,982,788 99.44% 36.04% Environmental Operations 1,289,639 1,896,272 147.04% 1.59% Total 44,513,773 44,879,059 100.82% 37.63% Disposal Equipment Disposal 290,575 812 0.28% 0.00% Total 290,575 812 0.28% 0.00% TOTAL 119,251,069 119,245,000 99.99%

Zero-Based Budget Pilot Fleet Management Program
31
Current Initiatives Current initiatives to increase efficiency or effectiveness outline initiatives that have been designed to increase program efficiency or effectiveness. Following is a summary of current and recently completed initiatives undertaken by the Program: Current Initiatives
Procure and implement new fleet management software that will replace the current mainframe Equipment Management System (EMS). The new software will be a web based system that will have improved functionality including motor pool and vehicle replacement modules and a user-friendly reporting tool to allow for better monitoring of vehicle usage and improved customer satisfaction.
Update and implement new fuel procedures and fuel security measures for increased accountability and control.
Develop new fuel bid with a committed allocation of fuel to meet the County’s needs during emergencies.
Continue to monitor the performance of light equipment production employees for certain repairs times against industry standards.
Recently Completed Initiatives Developed an online customer web-reporting portal that will allow customers to
access important fleet usage reports related to billing, vehicle inventory, vehicle maintenance and fueling, miles traveled, etc.
Developed a capital program several years ago to fund improvements to service facilities. Facility repairs, renovations and new construction will provide safer and more functional work areas resulting in enhanced employee productivity and morale.
Developed performance standards for certain heavy equipment repairs and are monitoring technician performance.
Extended the operating lifecycle for light vehicles to 100,000 miles thereby reducing the County’s capital outlay for replacements.

Zero-Based Budget Pilot Fleet Management Program
32
Program Justification Summary The following tables highlight key results from the program justification phase of the Pilot.
Program Justification Summary
Program Necessity Legal Mandate Yes Links to Approved Priorities • Ordinance 08-08 annual budget
priorities and policy objectives • Ordinance 05-136 (resource
allocation based on Strategic Plan Priority Outcomes)
No
Yes
• Demand for Service Varies by activity • Duplication of Services Yes – The Aviation, Fire, Parks, Police, Water & Sewer and Transit
departments each perform some of their own acquisition and/or maintenance and repair services.
• Impact if Not Funded Elimination of the Program would result in reassignment of fleet activities to user departments who would then take on responsibility for requisitioning, assigning, maintaining, disposing, tracking and reporting on department-level fleets. The complete decentralization of the County’s fleet would lead to significant increases in fleet costs, further duplication of services and a lack of department focus on core program missions.
Program Placement and Organization
Program rests with department most appropriate to perform service
Yes
Program as currently organized lends itself to successful execution of goals and objectives
Yes
Program Accountability
Program Performance Performance measures should be expanded to include information on fleet size and composition, vehicle and equipment utilization and fleet ownership costs to provide policy and program decision-makers with a fleet profile that gives context to the budget and establishes baselines for future initiatives to improve program effectiveness and efficiency.
Program and Performance Reviews Yes Percent of Costs Covered by Proprietary Fees
FY 2008/09 revenues from user fees and charges, sale of retired vehicles and interest income total approximately $119.2 million or 99.99% of total allocated program costs.
Current Initiatives to Increase Efficiency or Effectiveness
Current initiatives include implementation of new fleet management software, updating fuel procedures and security measures and developing a new fuel purchasing contract.

Zero-Based Budget Pilot Fleet Management Program
33
PRIORITY RANKINGS Key results from the program justification process formed the basis for the ranking process utilized by the Department to rank each activity according to the service it supports (see Appendix 5). The following table outlines the results of the Department’s priority rankings.
Department Priority Rankings by Program Service
Priority Ranking Service/Activity
Administration and Support 1 Executive Direction and Control 2 Personnel, Finance and Administration 3 Contracts Management 4 IT and Systems Maintenance 5 Asset Management and Tracking
Vehicle and Equipment Acquisition 1 Vehicle Specification Preparation 2 Fleet Assessment 3 Vehicle Licensing and Title Coordination 4 Vehicle Acquisition and Preparation 5 Vehicle Lease and Rental Management
Vehicle and Equipment Maintenance and Repair 1 Light Equipment Maintenance and Repair Operations
2 Heavy Equipment Maintenance and Repair Operations
3 Equipment Pool and Loaner Operation Fuel
1 Environmental Operations 2 Fuel Operations
Vehicle and Equipment Disposal 1 Equipment Disposal

Zero-Based Budget Pilot Fleet Management Program
34
DECISION PACKAGES A basic tenet of ZBB is the use of Decision Packages to present potential budget options. Decision Packages are groups of activities that are aggregated at varying budget levels to form budget alternatives. The budget levels are generally prepared based on levels of service such as minimum level (amount required by federal, state and local mandates), current level (amount required to continue the program without considering increases in demand) and enhanced level (amount required for increased demand, additional services and program enhancements). Budget levels can also be prepared based on funding levels such as a percentage reduction in the current level. This analysis does not include the preparation of decision packages in the traditional sense. To do so would require qualitative and/or quantitative reductions in service levels and as a consequence, fleet customers would be forced to self-perform services and/or obtain services from the private sector. Either of which would likely result in a net increase in the County’s operating budget. Instead, we have focused on providing selected options for cost savings and enhanced cost control that do not impact current service levels. The options, some of which are heavily influenced by fleet customers (user departments) and policy and program decision-makers, are presented in the form of fleet management practices. The fleet management practices are based on industry information and have been grouped into four decision packages. The first two decision packages relate to the two super variables impacting fleet costs:
Decision Package One: Fleet Size and Composition; and Decision Package Two: Vehicle and Equipment Replacement Planning.
The last two decision packages relate specifically to how the Program can promote cost effective operations:
Decision Package Three: Cost Competitiveness of Fleet Operations; and Decision Package Four: Measures and Indicators of Cost and Service.
The tables and charts that follow provide a financial summary of the FY 2008/09 activity-based budget for the Program as well as supplemental fleet information to provide context to the discussion.

Zero-Based Budget Pilot Fleet Management Program
35
Fleet Management Program Activity-Based Budget and Unit Costs
Service/Activity Unit of Measure Number of
Units Unit Cost FY 2008/09 Allocated1
Vehicle and Equipment Acquisition Vehicle Specification Preparation Number of Specifications Prepared 20 $7,892.14 $ 157,843
Fleet Assessment Number of Vehicles and Equipment
Tracked 11,321 5.88 66,580
Vehicle Licensing and Title Coordination Number of Licenses and Titles
Maintained 2032 210.63 42,757
Vehicle Acquisition and Preparation Number of Vehicles and Equipment
Purchases 500 1,665.88 832,939 Vehicle Lease and Rental Management Number of Vehicles Leased/Rented 222 1,061.00 23,342 Total Operation and Maintenance 1,123,461 Total Capital Outlays 22,573,825 Service Subtotal 23,697,286 Vehicle and Equipment Maintenance and Repair Light Equipment Maintenance and Repair Number of Vehicles Maintained 7,336 2,404.48 17,639,271 Heavy Equipment Maintenance and Repair
Number of Vehicles and Equipment Maintained 2,162 12,610.70 27,264,327
Equipment Pool and Loaner Operation Number of Pool and Loaner Vehicles 571 490.71 280,195 Total Operation and Maintenance 45,183,792 Total Capital Outlays 5,565,643 Service Subtotal 50,749,435 Fuel Environmental Operations Gallons of Fuel Dispensed 12,700,000 0.02 233,628 Fuel Operations Gallons of Fuel Dispensed 12,700,000 3.40 43,184,586 Total Operation and Maintenance 43,418,214 Total Capital Outlays 1,095,559 Service Subtotal 44,513,773 Vehicle and Equipment Disposal
Equipment Disposal Number of Vehicles and Equipment
to be Disposed of 8002 340.75 272,602 Total Operation and Maintenance 272,602 Total Capital Outlays 17,973 Service Subtotal 290,575 TOTAL BUDGET $119,251,069 1 Includes prorata allocation of general overhead (administration and support activities and the indirect cost pool). 2 Projected number of units based on FY 2007/08 actual results.

Zero-Based Budget Pilot Fleet Management Program
36
Fleet Maintained Equipment by Type
Equipment Category Count Light Equipment On Road Light 7,336 Total Light Equipment 7,336 Heavy Equipment On Road Heavy 1,692 Off Road/Construction 251 Auxiliary 219 Total Heavy Equipment 2,162 Total Heavy and Light Equipment as of October 2008
9,498
Fleet Maintained Light Equipment by Department
GSA (Fleet and Non Fleet) 739
Police 2,961
Fire Rescue 406
Corrections 253
Public Works 283
Transit 214 Housing Agency
214 Parks and
Recreation 443 Water and Sew er
722
All Other Departments 1,101
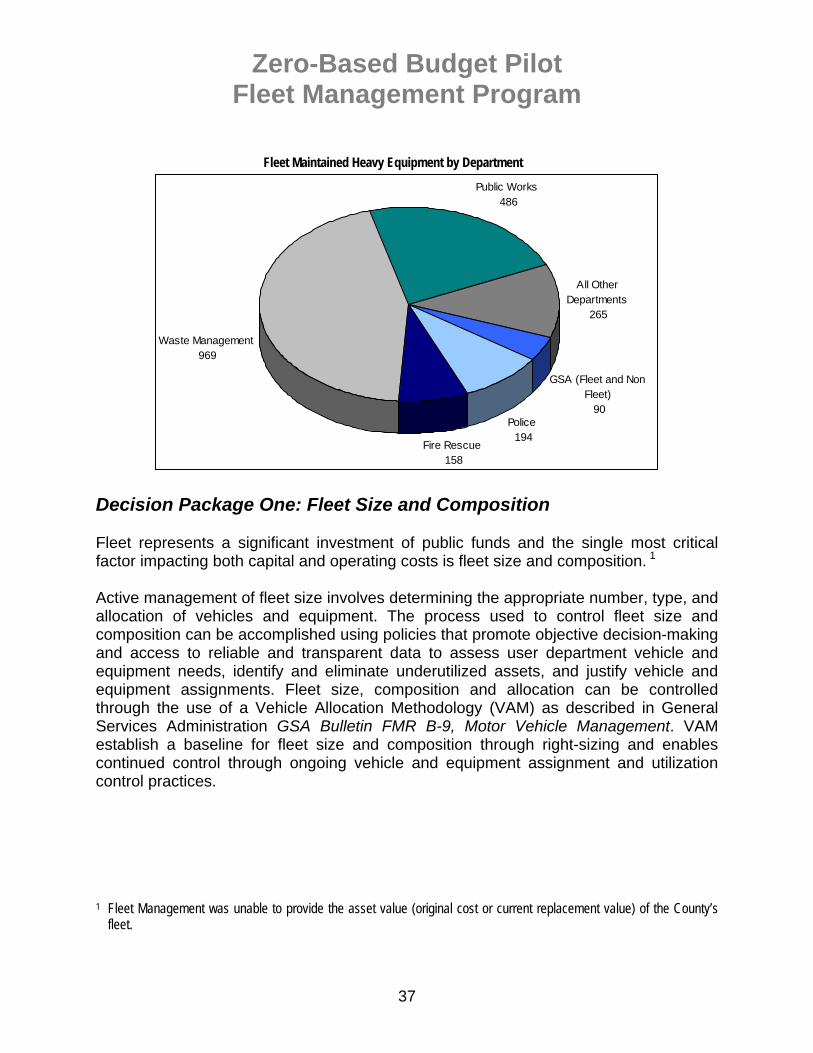
Zero-Based Budget Pilot Fleet Management Program
37
Fleet Maintained Heavy Equipment by Department
GSA (Fleet and Non Fleet) 90
Police 194
Fire Rescue 158
Waste Management 969
Public Works 486
All Other Departments
265
Decision Package One: Fleet Size and Composition Fleet represents a significant investment of public funds and the single most critical factor impacting both capital and operating costs is fleet size and composition. 1 Active management of fleet size involves determining the appropriate number, type, and allocation of vehicles and equipment. The process used to control fleet size and composition can be accomplished using policies that promote objective decision-making and access to reliable and transparent data to assess user department vehicle and equipment needs, identify and eliminate underutilized assets, and justify vehicle and equipment assignments. Fleet size, composition and allocation can be controlled through the use of a Vehicle Allocation Methodology (VAM) as described in General Services Administration GSA Bulletin FMR B-9, Motor Vehicle Management. VAM establish a baseline for fleet size and composition through right-sizing and enables continued control through ongoing vehicle and equipment assignment and utilization control practices. 1 Fleet Management was unable to provide the asset value (original cost or current replacement value) of the County’s
fleet.

Zero-Based Budget Pilot Fleet Management Program
38
Right-sizing Fleet right sizing is used periodically to reduce the size, and ultimately the cost of fleets by identifying specific vehicles and equipment that are no longer needed and disposing of them. Right-sizing generally involves the following five steps:
Compile detailed inventory and usage data to create fleet profile net of any excluded vehicles (i.e. marked law enforcement, fire apparatus).
Review prior year usage data and identify candidates for elimination. Candidates for elimination include all assets that fall below usage thresholds (i.e. 80% of established minimum annual usage and 50% of the average annual utilization level by type).
Administer vehicle utilization questionnaires to obtain additional information needed to narrow candidates for elimination. Questionnaires should gather information on how, where and when assets are used including:
• How do assets meet the mission, goals and objectives of the department and its programs?
• What services are provided by use of assets? • How many users require use of assets? • What vehicle requirements must be met to provide services (i.e. must
carry equipment or passengers, vehicle response time, etc.) • What times of the day are assets used? • What is the number of trips per day? • Where are assets housed? • What transportation alternatives have previously been considered?
Determine whether candidates should be eliminated. Establish a table of allocation outlining vehicle and equipment information by
user department and type including number of assets needed; number of assets to be eliminated; recommendations to use pool vehicles; and budgets for reimbursement for use of privately owned vehicles.
The reduction of fleet size from right-sizing will generally produce immediate cost savings through proceeds from salvage values; however, the savings that are more substantial are longer-term through decreased need for future replacement vehicles and equipment. The transportation needs of fleet customers are dynamic and right-sizing can be an important tool to be used periodically to ensure that the fleet size is appropriate given changing priorities and needs. However, once the baseline for the fleet size and composition has been established, effective and efficient utilization of vehicles and equipment should be made on a continual basis through vehicle and equipment assignment and utilization reviews.

Zero-Based Budget Pilot Fleet Management Program
39
Vehicle and Equipment Assignment and Utilization Vehicle and equipment assignments should be justified periodically to reestablish a continued need; and prior to the replacement of assets scheduled to be retired. The assignment process should require user departments to justify each asset under their control by clearly defining need in relation to department/program mission with consideration given to the timing, frequency and duration of demand, number of personnel, as well as evidence that alternative sources of transportation were contemplated. Utilization guidelines should also be established for each asset type to set the minimum level at which assets should be assigned to a user department. The guidelines should incorporate mileage levels and daily use indicators. Alternate measures of utilization should be used in place of mileage where appropriate (i.e. engine hours). Once established, utilizations reviews (annual comparisons of actual utilization by asset type) should be conducted to identify underutilized assets. Once systems and processes are in place to determine and maintain the appropriate fleet size and composition it is important to utilize a long term approach to replacement planning to ensure the availability of safe and reliable vehicles and equipment and control fleet life cycle costs. Decision Package Two: Vehicle and Equipment Replacement Planning The life expectancy of vehicles and equipment varies by asset type and the nature and intensity of its use. As a result, the timing and funding requirements for replacements can fluctuate significantly from year to year. Replacement planning can be used as a tool to facilitate replacement decisions by incorporating analysis of age, usage and life cycle costs (acquisition, depreciation, maintenance, fueling and estimated salvage values) to identify assets to be considered for replacement; project future costs; determine funding availability and evaluate financing options; and ultimately utilize objective criteria to justify replacement decisions. Replacement planning can be described using a three step process, as described below, aimed at minimizing life cycle cost by balancing the capital and operating cost components of fleet ownership. STEP I The process begins with the use of established replacement guidelines to develop a mapped out projection of replacement dates and future costs for each asset. Replacement guidelines are generally expressed as a minimum age and/or usage and may be based on analysis of life cycle costs to determine the period of time where the asset has sufficiently depreciated and has not yet begun to experience escalating maintenance costs.

Zero-Based Budget Pilot Fleet Management Program
40
STEP II Next, a funding analysis is conducted to evaluate options to finance projected costs. The funding analysis considers alternatives to cash such as reserve funds. Using reserve funds to spread capital costs over the expected useful life makes funding requirements for replacements more predictable; thereby reducing the risk that needed replacements will be deferred due to lack of funding. STEP III Finally, a short-term decision making process is utilized to identify and prioritize the timing for specific assets using criteria that has been expanded beyond the criteria used in the replacement guidelines described in step one such as type of use and historical repair costs. Timely replacement of assets impacts the availability, safety, reliability and cost effectiveness of fleets. Replacing assets too quickly is wasteful and deferring replacements increases fleet age and operating costs since it is more costly to maintain a vehicle in need of replacement. To promote cost effective fleet management, replacement reserve funds should be established and maintained using chargeback rates that have been established based on long term replacement planning. Decision Package Three: Cost Competitiveness of Fleet Operations The foundation for the assessment of cost competitiveness is the establishment of financial practices that promote understanding and awareness of all costs, capital and operating, associated with owning and operating a fleet from acquisition through disposal. The goal of achieving cost recognition and control can be attained through the use of a cost chargeback system. Under a cost chargeback system, user departments budget and pay for the operating cost of vehicles and equipment that are available to them and under their control. This allows user departments to correlate their decisions regarding assets used in the provision of program services to the costs incurred for consuming resources. Similarly, capital costs can be amortized over the life of vehicles to smooth out the cost replacement requirements. Properly designed cost chargeback systems provide an equitable treatment of users as they only pay for what they use while promoting accountability by fleet management for the cost and quality of services they receive. Characteristics of effective cost chargeback systems include the following:
All costs (direct and indirect) are recovered All users are billed the same rate for similar services Rates are based on type of service consumed (i.e. asset acquisition and
disposal, maintenance and repairs, fuel) rather than usage (mileage) or time (monthly charge)
Zero-Based Budget Pilot Fleet Management Program
41
Transaction specific costs of services are included in billing Adjustments are made for over/under recovery Operates on a break-even basis Accumulates replacement costs in a reserve fund Revenues from one service are not used to supplement the costs of another
Chargeback systems that have clearly defined rate methodologies, service-based rates and transaction-based billing encourages cost control by allowing user departments to clearly see the relationship between their decisions regarding number or vehicles, maintenance practices and overall care for vehicles and equipment. Effective chargeback systems also provide a mechanism to establish competitiveness with the private sector (cost of outsourcing) and making comparisons internally (cost of decentralized services) through benchmarking. When determining the cost competitiveness of fleet operations it is important to consider the rate, calculations and measurement techniques used to ensure comparability. It is also important to review cost of service in relation to service levels and service quality, which can be facilitated by tracking, monitoring and reporting performance measures that include commonly used measures of cost and service. Decision Package Four: Measures and Indicators of Cost and Service Performance measures promote accountability and provide policy and program decision makers with improved information for decision making. Measures are most effective when they communicate program results through established links to strategic planning and budgets and should be quantifiable (expressed in numbers or percentages). Information obtained from measures can be used to establish cost and service level baselines to support performance targets, measure progress towards achieving program goals and gauge the cost effectiveness of fleet operations by:
highlighting the relationship between cost and performance; tracking relevant changes in performance and conditions; and identifying reasons for reaching, not meeting or exceeding performance targets.
Following is a list of relevant performance measures compiled from industry reports including the General Service Administration Guide to Fleet Management and Benchmarking Fleet Management prepared by the University of Minnesota Center for Transportation Studies. The measures have been grouped into the following categories: fleet operations, fleet asset management and fleet replacements.

Zero-Based Budget Pilot Fleet Management Program
42
Fleet operations include measures and indicators of cost, service levels, service quality and productivity to evaluate the overall performance of fleet operations by service type.
Fleet Operations Measures and Indicators
Measure/Indicator Purpose
Vehicle and Equipment Acquisition Turnaround time from ordering vehicle to receipt Efficiency of procurement Turnaround time from receipt of vehicle to in-service date Efficiency of vehicle preparation Maintenance and Repair Average maintenance and repair cost per mile/hour by class/type (excluding accident repairs)
Efficiency of the maintenance service
Fully burdened labor rate Cost of service and benchmarking Average percentage labor rate below private sector fleet maintenance costs
Cost effectiveness
Average percentage parts below retail parts cost Cost effectiveness Average percentage motor pool rates below rental contract rates Cost effectiveness Fleet availability %
By fleet By class/type
Overall health of the fleet and the ability to complete repairs in a timely manner
Repeat repairs as a % of total repairs by class/type Service quality of both diagnostics and repair service
Repairs performed within 1 day, 2 days, greater than 2 days Staffing efficiency Ratio of preventive maintenance to unscheduled repairs Adequacy of preventive maintenance program in
preventing repairs Percentage of mechanics time billed to maintenance and repairs Productivity Overtime Rate Staffing efficiency % of mechanics that are ASE Certified Staff qualifications Number of vehicles and equipment per mechanic by class/type Staffing efficiency Percent of maintenance and repairs outsourced (sublet) Use of external help for repairs Number of repair orders Adequacy of preventive maintenance program in
preventing repairs Number of accidents per 100,000 miles Safe driving performance and need for driver
training Average investment in inventory Cost of inventory Parts turnover ratio (total number of parts used divided by average number of parts on hand)
Stock utilization including excessive or depleted levels
Customer satisfaction Service quality Fuel Fully burdened rate per gallon of fuel Cost of service and benchmarking Average fuel consumption by class/type Fuel efficiency Average miles per gallon by class/type Fuel efficiency Average time to repair broken fuel pumps Service quality Vehicle and Equipment Disposal Average number of days from out of service to disposal Efficiency of disposal service
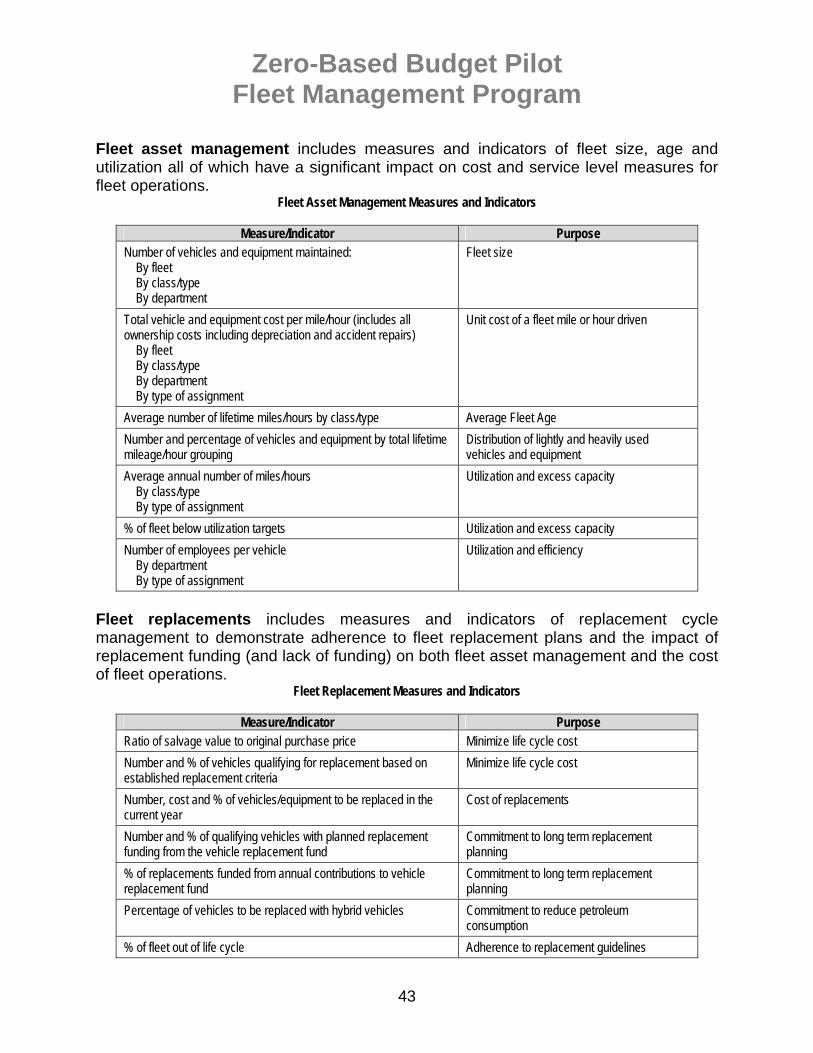
Zero-Based Budget Pilot Fleet Management Program
43
Fleet asset management includes measures and indicators of fleet size, age and utilization all of which have a significant impact on cost and service level measures for fleet operations.
Fleet Asset Management Measures and Indicators
Measure/Indicator Purpose Number of vehicles and equipment maintained:
By fleet By class/type By department
Fleet size
Total vehicle and equipment cost per mile/hour (includes all ownership costs including depreciation and accident repairs)
By fleet By class/type By department By type of assignment
Unit cost of a fleet mile or hour driven
Average number of lifetime miles/hours by class/type Average Fleet Age Number and percentage of vehicles and equipment by total lifetime mileage/hour grouping
Distribution of lightly and heavily used vehicles and equipment
Average annual number of miles/hours By class/type By type of assignment
Utilization and excess capacity
% of fleet below utilization targets Utilization and excess capacity Number of employees per vehicle
By department By type of assignment
Utilization and efficiency
Fleet replacements includes measures and indicators of replacement cycle management to demonstrate adherence to fleet replacement plans and the impact of replacement funding (and lack of funding) on both fleet asset management and the cost of fleet operations.
Fleet Replacement Measures and Indicators
Measure/Indicator Purpose Ratio of salvage value to original purchase price Minimize life cycle cost Number and % of vehicles qualifying for replacement based on established replacement criteria
Minimize life cycle cost
Number, cost and % of vehicles/equipment to be replaced in the current year
Cost of replacements
Number and % of qualifying vehicles with planned replacement funding from the vehicle replacement fund
Commitment to long term replacement planning
% of replacements funded from annual contributions to vehicle replacement fund
Commitment to long term replacement planning
Percentage of vehicles to be replaced with hybrid vehicles Commitment to reduce petroleum consumption
% of fleet out of life cycle Adherence to replacement guidelines
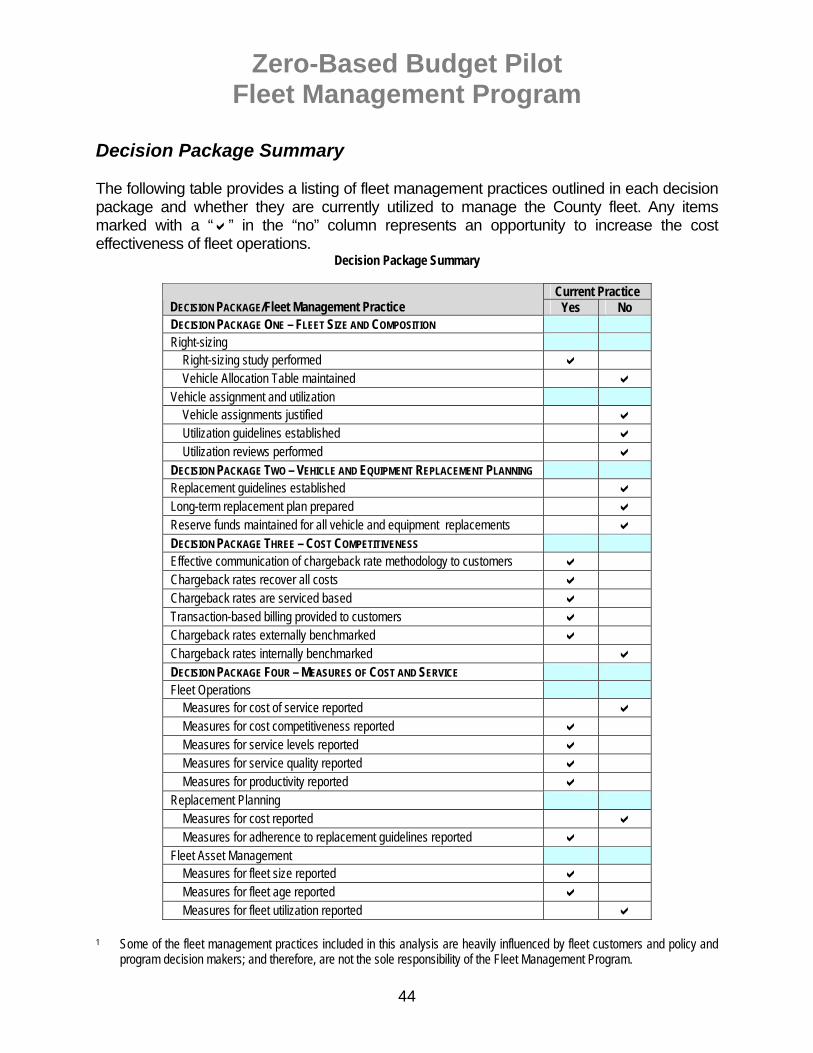
Zero-Based Budget Pilot Fleet Management Program
44
Decision Package Summary The following table provides a listing of fleet management practices outlined in each decision package and whether they are currently utilized to manage the County fleet. Any items marked with a “ ” in the “no” column represents an opportunity to increase the cost effectiveness of fleet operations.
Decision Package Summary
Current Practice DECISION PACKAGE/Fleet Management Practice Yes No DECISION PACKAGE ONE – FLEET SIZE AND COMPOSITION Right-sizing
Right-sizing study performed Vehicle Allocation Table maintained
Vehicle assignment and utilization Vehicle assignments justified Utilization guidelines established Utilization reviews performed
DECISION PACKAGE TWO – VEHICLE AND EQUIPMENT REPLACEMENT PLANNING Replacement guidelines established Long-term replacement plan prepared Reserve funds maintained for all vehicle and equipment replacements DECISION PACKAGE THREE – COST COMPETITIVENESS Effective communication of chargeback rate methodology to customers Chargeback rates recover all costs Chargeback rates are serviced based Transaction-based billing provided to customers Chargeback rates externally benchmarked Chargeback rates internally benchmarked DECISION PACKAGE FOUR – MEASURES OF COST AND SERVICE Fleet Operations
Measures for cost of service reported Measures for cost competitiveness reported Measures for service levels reported Measures for service quality reported Measures for productivity reported
Replacement Planning Measures for cost reported Measures for adherence to replacement guidelines reported
Fleet Asset Management Measures for fleet size reported Measures for fleet age reported Measures for fleet utilization reported
1 Some of the fleet management practices included in this analysis are heavily influenced by fleet customers and policy and
program decision makers; and therefore, are not the sole responsibility of the Fleet Management Program.

Zero-Based Budget Pilot Fleet Management Program
45
NEXT STEPS Following are potential next steps to further enhance the budget review process:
Evaluate adequacy of current program and activity definitions currently used by the County and consider revising based on results of this analysis
Perform detailed activity analysis including process mapping and workload analysis to identify potential areas for cost savings and program improvement
Incorporate additional performance measures and indicators of fleet cost, size, age, utilization and replacement cycle management to establish baselines for evaluating future initiatives to improve program effectiveness and efficiency
Refine unit cost calculations to calculate marginal costs and identify impact of revised performance goals and alternate service levels
Conduct program reviews and performance audits Develop formal program justification criteria for improved accountability Develop formal priority setting model for increased transparency

EXHIBIT 1Activity-Based BudgetSchedule of Resources
Object DescriptionFY 2008/09
BudgetPercent of Total
Budget
1 SALARIES 16,427,047 13.78%10 FRINGE BENEFITS 5,540,190 4.65%31 DEPARTURE INCENTIV 4,000 0.00%
Total Personnel Costs 21,971,237 18.42%215 TEMPORARY HELP AGE 210,000 0.18%220 ELECTRICAL SERVICE 312,000 0.26%221 WATER AND DISPOSAL 117,100 0.10%223 INDUSTRIAL SERVICE 518,100 0.43%224 OTHER OUTSIDE CONT 37,700 0.03%232 GENERAL AUTO & PRO 122,000 0.10%240 OUTSIDE CONTRACTUA 6,433,632 5.40%241 EQUIPMENT MAINTENA 9,500 0.01%244 OUTSIDE MAINTENANC 32,000 0.03%245 ITD MAINTENANCE 39,500 0.03%246 RAIL/AIRCRAFT/BOAT 6,800 0.01%251 BUILDINGS COUNTY O 70,000 0.06%252 VEHICLES-RENTAL 180,000 0.15%253 COMMUNICATION EQUIPMENT 200 0.00%260 GSA CHARGES 4,685,400 3.93%261 ITD 2,722,500 2.28%262 GENERAL COUNTY SUP 11,000 0.01%265 PARKS & RECREATION 29,000 0.02%310 TELECOMMUNICATIONS 148,300 0.12%311 PUBLICATIONS, SUBS 19,300 0.02%312 TRAVEL 25,300 0.02%313 AUTOMOBILE REIMBUR 60,000 0.05%314 ADVERTISING 27,000 0.02%315 PRINTING & GRAPHIC 1,000 0.00%319 PETTY CASH & CHANG 1,200 0.00%320 TRAINING 41,300 0.03%321 REIMBURSEMENTS & R - 0.00%322 TAXES,LICENSES & P 135,200 0.11%330 MISCELLANEOUS 30,000 0.03%410 FUEL & LUBRICANTS 42,805,400 35.90%430 AUTOMOTIVE REPAIR 11,540,700 9.68%432 EQUIPMENT & NON-CA 1,178,850 0.99%450 CONSTRUCTION MATER - 0.00%470 OFFICE SUPPLIES & 81,000 0.07%471 COMPUTER SUPPLIES 12,000 0.01%492 INSTITUTIONAL, MED 5,250 0.00%493 CLOTHING & UNIFORM 86,500 0.07%496 OTHER MATERIALS & 23,000 0.02%
501GENERAL FUND-TRF O (Interfund Transfer to Capital Program) 2,100,000 1.76%
570 INTRAFUND TRANSFER 1,813,100 1.52%602 SPECIAL TRANSPORTA - 0.00%
Total Other Operating 75,670,832 63.46%950 MAJOR MACHINERY, E 261,000 0.22%951 AUTOMOBILES & VEHI 20,298,000 17.02%990 INFRASTRUCTURE 1,050,000 0.88%
Total Capital 21,609,000 18.12%Total Operating Budget 119,251,069 100.00%
Exhibit 1

EXHIBIT 2Activity-Based BudgetClassification Summary
Object Description Total Direct CostProgram-Specific
Overhead General Overhead
1-100 PERSONNEL COSTS 21,971,237 215 TEMPORARY HELP AGE 210,000 220 ELECTRICAL SERVICE 312,000 221 WATER AND DISPOSAL 117,100 223 INDUSTRIAL SERVICE 518,100 224 OTHER OUTSIDE CONT 37,700 232 GENERAL AUTO & PRO 122,000 240 OUTSIDE CONTRACTUA 6,433,632 241 EQUIPMENT MAINTENA 9,500 244 OUTSIDE MAINTENANC 32,000 245 ITD MAINTENANCE 39,500 246 RAIL/AIRCRAFT/BOAT 6,800 251 BUILDINGS COUNTY O 70,000 252 VEHICLES-RENTAL 180,000 253 COMMUNICATION EQUIPMENT 200 260 GSA CHARGES 4,685,400 261 ITD 2,722,500 262 GENERAL COUNTY SUP 11,000 265 PARKS & RECREATION 29,000 310 TELECOMMUNICATIONS 148,300 311 PUBLICATIONS, SUBS 19,300 312 TRAVEL 25,300 313 AUTOMOBILE REIMBUR 60,000 314 ADVERTISING 27,000 315 PRINTING & GRAPHIC 1,000 319 PETTY CASH & CHANG 1,200 320 TRAINING 41,300 322 TAXES,LICENSES & P 135,200 330 MISCELLANEOUS 30,000 410 FUEL & LUBRICANTS 42,805,400 430 AUTOMOTIVE REPAIR 11,540,700 432 EQUIPMENT & NON-CA 1,178,850 470 OFFICE SUPPLIES & 81,000 471 COMPUTER SUPPLIES 12,000 492 INSTITUTIONAL, MED 5,250 493 CLOTHING & UNIFORM 86,500 496 OTHER MATERIALS & 23,000
501GENERAL FUND-TRF O (Interfund Transfer to Capital Program) 2,100,000
570 INTRAFUND TRANSFER 1,813,100 950 MAJOR MACHINERY, E 261,000 951 AUTOMOBILES & VEHI 20,298,000 990 INFRASTRUCTURE 1,050,000
Total Operating Budget 119,251,069
Indirect Costs
Exhibit 2

EXHIBIT 3Activity-Based BudgetResource Allocation by Object Summary
Service/Activity Personnel CostsOutside
Contractual GSA ITDFuel &
LubricantsAutomotive Repair Parts
Equipment and Non-Capital
Transfer to Capital Program
Interfund Transfer
Automobiles & Vehicles Infrastructure
All Other Object Codes Total
Administration and SupportExecutive Direction and Control 159,011 - - - - - - - - - - 159,011 Personnel, Finance and Administration 457,211 - - - - - - - - - - 457,211 IT and Systems Maintenance 309,768 - - 2,722,500 - - - - - - - 3,032,268 Contracts Management 113,699 - - - - - - - - - - 113,699 Asset Management and Tracking 47,468 - - - - - - - - - - 47,468 Total 1,087,158 - - 2,722,500 - - - - - - - - 3,809,658
Vehicle and Equipment AcquisitionFleet Assessment 49,589 - - - - - - - - - - 49,589 Vehicle Specification Preparation 117,563 - - - - - - 787,992 - - - 905,555 Vehicle Acquisition and Preparation 353,955 90,161 1,427,767 - - 228,700 38,850 - - 20,298,000 - 22,437,433 Vehicle Lease and Rental Management 17,385 - - - - - - - - - - 17,385 Vehicle Licensing and Title Coordination 31,846 - - - - - - - - - - 31,846 Total 570,338 90,161 1,427,767 - - 228,700 38,850 787,992 - 20,298,000 - - 23,441,809
Vehicle and Equipment Maintenance and Repair - Light Equipment Maintenance and Repair 7,402,864 3,700,000 1,534,850 - - 3,700,000 300,000 847,092 - - - 17,484,806 Heavy Equipment Maintenance and Repair 12,098,931 2,600,000 713,884 - - 7,600,000 820,000 393,996 - - - 24,226,811 Equipment Pool and Loaner Operation 208,692 - - - - - - - - - - 208,692 Total 19,710,487 6,300,000 2,248,734 - - 11,300,000 1,120,000 1,241,088 - - - - 41,920,309
FuelFuel Operations 375,522 - - - 42,680,400 - - - - - - 43,055,922 Environmental Operations 57,073 - - - 125,000 12,000 20,000 - - - 1,050,000 1,264,073 Total 432,596 - - - 42,805,400 12,000 20,000 - - - 1,050,000 - 44,319,996
Vehicle and Equipment DisposalEquipment Disposal 170,659 43,471 - - - - - - - - - 214,130 Total 170,659 43,471 - - - - - - - - - - 214,130
Indirect Cost Pool - - 1,008,899 - - - - 70,919 1,813,100 - - 2,652,250 5,545,168 (to be allocated as general overhead)
TOTAL 21,971,237 6,433,632 4,685,400 2,722,500 42,805,400 11,540,700 1,178,850 2,100,000 1,813,100 20,298,000 1,050,000 2,652,250 119,251,069
Exhibit 3

EXHIBIT 4Activity-Based BudgetDirect Cost Summary
Labor Allocation % Other Operating Allocation % Total Allocation %A B A+B=C
Vehicle and Equipment AcquisitionFleet Assessment 49,589 0.24% - 0.00% 49,589 0.05%Vehicle Specification Preparation 117,563 0.56% - 0.00% 117,563 0.11%Vehicle Acquisition and Preparation 353,955 1.69% 20,655,711 25.11% 21,009,665 20.37%Vehicle Lease and Rental Management 17,385 0.08% - 0.00% 17,385 0.02%Vehicle Licensing and Title Coordination 31,846 0.15% - 0.00% 31,846 0.03% Total 570,338 2.73% 20,655,711 25.11% 21,226,049 20.58%
Vehicle and Equipment Maintenance and RepairLight Equipment Maintenance and Repair 7,402,864 35.45% 7,700,000 9.36% 15,102,864 14.64%Heavy Equipment Maintenance and Repair 12,098,931 57.93% 11,020,000 13.40% 23,118,931 22.41%Equipment Pool and Loaner Operation 208,692 1.00% - 0.00% 208,692 0.20% Total 19,710,487 94.38% 18,720,000 22.76% 38,430,487 37.26%
FuelFuel Operations 375,522 1.80% 42,680,400 51.89% 43,055,922 41.74%Environmental Operations 57,073 0.27% 157,000 0.19% 214,073 0.21% Total 432,596 2.07% 42,837,400 52.08% 43,269,996 41.95%
Vehicle and Equipment DisposalEquipment Disposal 170,659 0.82% 43,471 0.05% 214,130 0.21% Total 170,659 0.82% 43,471 0.05% 214,130 0.21%
TOTAL 20,884,079 100.00% 82,256,582 100.00% 103,140,661 100.00%
Direct
Exhibit 4
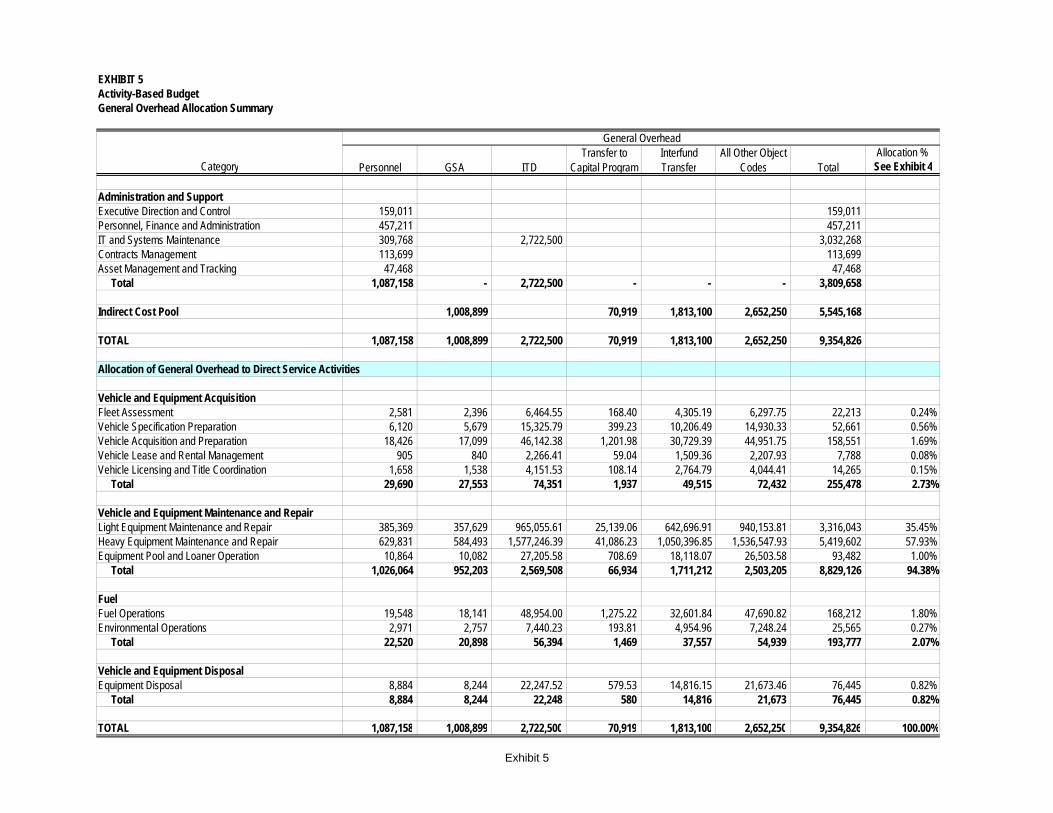
EXHIBIT 5Activity-Based BudgetGeneral Overhead Allocation Summary
Allocation %Category See Exhibit 4
Administration and SupportExecutive Direction and Control 159,011 159,011 Personnel, Finance and Administration 457,211 457,211 IT and Systems Maintenance 309,768 2,722,500 3,032,268 Contracts Management 113,699 113,699 Asset Management and Tracking 47,468 47,468 Total 1,087,158 - 2,722,500 - - - 3,809,658
Indirect Cost Pool 1,008,899 70,919 1,813,100 2,652,250 5,545,168
TOTAL 1,087,158 1,008,899 2,722,500 70,919 1,813,100 2,652,250 9,354,826
Allocation of General Overhead to Direct Service Activities
Vehicle and Equipment AcquisitionFleet Assessment 2,581 2,396 6,464.55 168.40 4,305.19 6,297.75 22,213 0.24%Vehicle Specification Preparation 6,120 5,679 15,325.79 399.23 10,206.49 14,930.33 52,661 0.56%Vehicle Acquisition and Preparation 18,426 17,099 46,142.38 1,201.98 30,729.39 44,951.75 158,551 1.69%Vehicle Lease and Rental Management 905 840 2,266.41 59.04 1,509.36 2,207.93 7,788 0.08%Vehicle Licensing and Title Coordination 1,658 1,538 4,151.53 108.14 2,764.79 4,044.41 14,265 0.15% Total 29,690 27,553 74,351 1,937 49,515 72,432 255,478 2.73%
Vehicle and Equipment Maintenance and RepairLight Equipment Maintenance and Repair 385,369 357,629 965,055.61 25,139.06 642,696.91 940,153.81 3,316,043 35.45%Heavy Equipment Maintenance and Repair 629,831 584,493 1,577,246.39 41,086.23 1,050,396.85 1,536,547.93 5,419,602 57.93%Equipment Pool and Loaner Operation 10,864 10,082 27,205.58 708.69 18,118.07 26,503.58 93,482 1.00% Total 1,026,064 952,203 2,569,508 66,934 1,711,212 2,503,205 8,829,126 94.38%
FuelFuel Operations 19,548 18,141 48,954.00 1,275.22 32,601.84 47,690.82 168,212 1.80%Environmental Operations 2,971 2,757 7,440.23 193.81 4,954.96 7,248.24 25,565 0.27% Total 22,520 20,898 56,394 1,469 37,557 54,939 193,777 2.07%
Vehicle and Equipment DisposalEquipment Disposal 8,884 8,244 22,247.52 579.53 14,816.15 21,673.46 76,445 0.82% Total 8,884 8,244 22,248 580 14,816 21,673 76,445 0.82%
TOTAL 1,087,158 1,008,899 2,722,500 70,919 1,813,100 2,652,250 9,354,826 100.00%
General OverheadTransfer to
Capital ProgramPersonnel GSA ITDInterfund Transfer
All Other Object Codes Total
Exhibit 5

EXHIBIT 6Activity-Based Budget
Category Labor Other GSATransfer to
Capital Program InfrastructureGeneral
Overhead Total
Vehicle and Equipment AcquisitionFleet Assessment 49,589 - - - - 22,213 71,802 Vehicle Specification Preparation 117,563 - - 787,992 - 52,661 958,217 Vehicle Acquisition and Preparation 353,955 20,655,711 1,427,767 - - 158,551 22,595,983 Vehicle Lease and Rental Management 17,385 - - - - 7,788 25,173 Vehicle Licensing and Title Coordination 31,846 - - - - 14,265 46,111 Total 570,338 20,655,711 1,427,767 787,992 - 255,478 23,697,286
Vehicle and Equipment Maintenance and RepairLight Equipment Maintenance and Repair 7,402,864 7,700,000 1,534,850 847,092 - 3,316,043 20,800,849 Heavy Equipment Maintenance and Repair 12,098,931 11,020,000 713,884 393,996 - 5,419,602 29,646,412 Equipment Pool and Loaner Operation 208,692 - - - - 93,482 302,173 Total 19,710,487 18,720,000 2,248,734 1,241,088 - 8,829,126 50,749,435
FuelFuel Operations 375,522 42,680,400 - - - 168,212 43,224,134 Environmental Operations 57,073 157,000 - - 1,050,000 25,565 1,289,639 Total 432,596 42,837,400 - - 1,050,000 193,777 44,513,773
Vehicle and Equipment DisposalEquipment Disposal 170,659 43,471 - - - 76,445 290,575 Total 170,659 43,471 - - - 76,445 290,575
TOTAL 20,884,079 82,256,582 3,676,501 2,029,081 1,050,000 9,354,826 119,251,069
Direct Program Specific Overhead
Exhibit 6

EXHIBIT 7 Activity-Based Budget
Service/ActivityTotal Direct
Costs
Less:Capital Outlays Included in Direct Costs
Total Direct Costs Net of
Capital Outlays
Total Program Specific
Overhead
Less: Capital Outlays Included
in Program Specific Over
Total Program Specific
Overhead Net of Capital Outlays
General Overhead
Less Capital Outlays Included
in General Overhead
Total General Overhead Net of Capital Outlays
Operation and Maintenance Capital Outlays Total Budget
A B A-B=C D E D-E=F G H G-H=I C+F+I=J B+E+H=K
Vehicle and Equipment AcquisitionFleet Assessment 49,589 - 49,589 - - - 22,213 5,223 16,990 66,580 5,223 71,802 Vehicle Specification Preparation 117,563 - 117,563 787,992 787,992 - 52,661 12,381 40,280 157,843 800,374 958,217 Vehicle Acquisition and Preparation 21,009,665 20,298,000 711,665 1,427,767 1,427,767 - 158,551 37,277 121,274 832,939 21,763,044 22,595,983 Vehicle Lease and Rental Management 17,385 - 17,385 - - - 7,788 1,831 5,957 23,342 1,831 25,173 Vehicle Licensing and Title Coordination 31,846 - 31,846 - - - 14,265 3,354 10,911 42,757 3,354 46,111 Total 21,226,049 20,298,000 928,049 2,215,760 2,215,760 - 255,478 60,065 195,412 1,123,461 22,573,825 23,697,286
Vehicle and Equipment Maintenance and RepairLight Equipment Maintenance and Repair 15,102,864 - 15,102,864 2,381,942 2,381,942 - 3,316,043 779,637 2,536,406 17,639,271 3,161,579 20,800,849 Heavy Equipment Maintenance and Repair 23,118,931 - 23,118,931 1,107,880 1,107,880 - 5,419,602 1,274,206 4,145,396 27,264,327 2,382,085 29,646,412 Equipment Pool and Loaner Operation 208,692 - 208,692 - - - 93,482 21,978 71,503 280,195 21,978 302,173 Total 38,430,487 - 38,430,487 3,489,822 3,489,822 - 8,829,126 2,075,821 6,753,306 45,183,792 5,565,643 50,749,435
FuelFuel Operations 43,055,922 - 43,055,922 - - - 168,212 39,548 128,663 43,184,586 39,548 43,224,134 Environmental Operations 214,073 - 214,073 1,050,000 1,050,000 - 25,565 6,011 19,555 233,628 1,056,011 1,289,639 Total 43,269,996 - 43,269,996 1,050,000 1,050,000 - 193,777 45,559 148,218 43,418,214 1,095,559 44,513,773
Vehicle and Equipment DisposalEquipment Disposal 214,130 - 214,130 - - - 76,445 17,973 58,472 272,602 17,973 290,575 Total 214,130 - 214,130 - - - 76,445 17,973 58,472 272,602 17,973 290,575
TOTAL 103,140,661 20,298,000 82,842,661 6,755,582 6,755,582 - 9,354,826 2,199,418 7,155,408 89,998,069 29,253,000 119,251,069
Exhbit 7

EXHIBIT 8 Activity-Based BudgetUnit Cost Summary
Service/Activity Unit of Measure Number of Units Direct Unit Cost
Program Specific Unit
Cost
General Overhead Unit
Cost Total Unit Cost
Total Operations and
MaintenanceAdd: Total
Capital Outlays Total Budget
Vehicle and Equipment AcquisitionFleet Assessment Number of Vehicles and Equipment Tracked 11,321 4.38 - 1.50 5.88 66,580 5,223 71,802 Vehicle Specification Preparation Number of Specifications Prepared 20 5,878.14 - 2,014.00 7,892.14 157,843 800,374 958,217 Vehicle Acquisition and Preparation Number of New/Replacement Vehicles Purchased 500 1,423.33 - 242.55 1,665.88 832,939 21,763,044 22,595,983 Vehicle Lease and Rental Management Number of Vehicles Leased/Rented 22 790.25 - 270.76 1,061.00 23,342 1,831 25,173 Vehicle Licensing and Title Coordination Number of Licences and Titles Maintained 203 156.88 - 53.75 210.63 42,757 3,354 46,111 Total 1,123,461 22,573,825 23,697,286
Vehicle and Equipment Maintenance and RepairLight Equipment Maintenance and Repair Number of Vehicles Maintained 7,336 2,058.73 - 345.75 2,404.48 17,639,271 3,161,579 20,800,849 Heavy Equipment Maintenance and Repair Number of Vehicles and Equipment Maintained 2,162 10,693.31 - 1,917.39 12,610.70 27,264,327 2,382,085 29,646,412 Equipment Pool and Loaner Operation Number of Pool and Loaner Vehicles 571 365.48 - 125.22 490.71 280,195 21,978 302,173 Total 45,183,792 5,565,643 50,749,435
FuelFuel Operations Gallons of Fuel Dispensed 12,700,000 3.39 - 0.01 3.40 43,184,586 39,548 43,224,134 Environmental Operations Gallons of Fuel Dispensed 12,700,000 0.02 - 0.00 0.02 233,628 1,056,011 1,289,639 Total 43,418,214 1,095,559 44,513,773
Vehicle and Equipment DisposalEquipment Disposal Number of Vehicles and Equipment to be Disposed of 800 267.66 - 73.09 340.75 272,602 17,973 290,575 Total 272,602 17,973 290,575
TOTAL 89,998,069 29,253,000 119,251,069
Exhibit 8
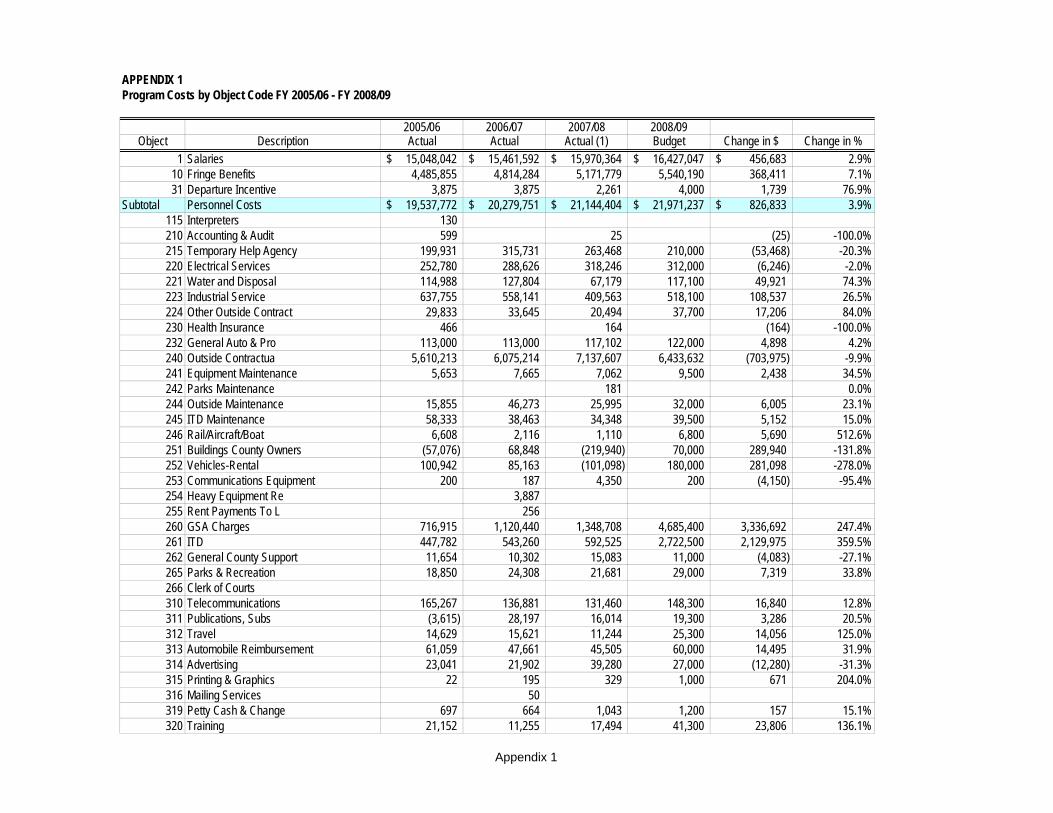
APPENDIX 1Program Costs by Object Code FY 2005/06 - FY 2008/09
2005/06 2006/07 2007/08 2008/09Object Description Actual Actual Actual (1) Budget Change in $ Change in %
1 Salaries 15,048,042$ 15,461,592$ 15,970,364$ 16,427,047$ 456,683$ 2.9%10 Fringe Benefits 4,485,855 4,814,284 5,171,779 5,540,190 368,411 7.1%31 Departure Incentive 3,875 3,875 2,261 4,000 1,739 76.9%
Subtotal Personnel Costs 19,537,772$ 20,279,751$ 21,144,404$ 21,971,237$ 826,833$ 3.9%115 Interpreters 130 210 Accounting & Audit 599 25 (25) -100.0%215 Temporary Help Agency 199,931 315,731 263,468 210,000 (53,468) -20.3%220 Electrical Services 252,780 288,626 318,246 312,000 (6,246) -2.0%221 Water and Disposal 114,988 127,804 67,179 117,100 49,921 74.3%223 Industrial Service 637,755 558,141 409,563 518,100 108,537 26.5%224 Other Outside Contract 29,833 33,645 20,494 37,700 17,206 84.0%230 Health Insurance 466 164 (164) -100.0%232 General Auto & Pro 113,000 113,000 117,102 122,000 4,898 4.2%240 Outside Contractua 5,610,213 6,075,214 7,137,607 6,433,632 (703,975) -9.9%241 Equipment Maintenance 5,653 7,665 7,062 9,500 2,438 34.5%242 Parks Maintenance 181 0.0%244 Outside Maintenance 15,855 46,273 25,995 32,000 6,005 23.1%245 ITD Maintenance 58,333 38,463 34,348 39,500 5,152 15.0%246 Rail/Aircraft/Boat 6,608 2,116 1,110 6,800 5,690 512.6%251 Buildings County Owners (57,076) 68,848 (219,940) 70,000 289,940 -131.8%252 Vehicles-Rental 100,942 85,163 (101,098) 180,000 281,098 -278.0%253 Communications Equipment 200 187 4,350 200 (4,150) -95.4%254 Heavy Equipment Re 3,887 255 Rent Payments To L 256 260 GSA Charges 716,915 1,120,440 1,348,708 4,685,400 3,336,692 247.4%261 ITD 447,782 543,260 592,525 2,722,500 2,129,975 359.5%262 General County Support 11,654 10,302 15,083 11,000 (4,083) -27.1%265 Parks & Recreation 18,850 24,308 21,681 29,000 7,319 33.8%266 Clerk of Courts 310 Telecommunications 165,267 136,881 131,460 148,300 16,840 12.8%311 Publications, Subs (3,615) 28,197 16,014 19,300 3,286 20.5%312 Travel 14,629 15,621 11,244 25,300 14,056 125.0%313 Automobile Reimbursement 61,059 47,661 45,505 60,000 14,495 31.9%314 Advertising 23,041 21,902 39,280 27,000 (12,280) -31.3%315 Printing & Graphics 22 195 329 1,000 671 204.0%316 Mailing Services 50 319 Petty Cash & Change 697 664 1,043 1,200 157 15.1%320 Training 21,152 11,255 17,494 41,300 23,806 136.1%
Appendix 1

APPENDIX 1Program Costs by Object Code FY 2005/06 - FY 2008/09
2005/06 2006/07 2007/08 2008/09Object Description Actual Actual Actual (1) Budget Change in $ Change in %
321 Reimbursements & Refu (333) 3,645 19,614 - (19,614) -100.0%322 Taxes, Licenses & Perm 99,917 105,969 59,146 135,200 76,054 128.6%330 Miscellaneous 27,793 17,500 14,710 30,000 15,290 103.9%410 Fuel & Lubricants 30,843,443 29,746,548 44,723,500 42,805,400 (1,918,100) -4.3%430 Automotive Repair & M 11,210,568 11,099,798 11,749,466 11,540,700 (208,766) -1.8%432 Equipment & Non-Capit 1,097,520 1,202,777 1,329,120 1,178,850 (150,270) -11.3%450 Constructions Material 31 470 Office Supplies & 96,955 86,208 84,294 81,000 (3,294) -3.9%471 Computer Supplies 12,712 17,657 15,402 12,000 (3,402) -22.1%492 Institutional, Medica 2,285 4,872 1,145 5,250 4,105 358.5%493 Clothing & Uniforms 47,520 104,419 72,943 86,500 13,557 18.6%496 Other Materials & Sup 19,168 7,682 5,912 23,000 17,088 289.0%501 General Fund-Trf Out 1,400,000 3,100,000 2,100,000 2,100,000 - 0.0%532 Other Special Obli 1,100,000 570 Interfund Transfer 1,564,000 1,502,000 1,527,000 1,813,100 286,100 18.7%602 Special Transportation 165 910 - - - 605 Hurricane Expenses (568) 568 -100.0%
Subtotal Operating Expenditures 56,089,407$ 56,725,740$ 72,027,906$ 75,670,832$ 3,642,926$ 5.1%910 Land Acquisition 8,776 1,547 941 Architectural/Engineering 4,307 (4,307) -100.0%950 Major Machinery, Equip 247,313 132,433 78,565 261,000 182,435 232.2%951 Automobiles & Vehicles 20,159,309 35,004,656 12,040,456 20,298,000 8,257,544 68.6%952 Other Capitalizabl 1,007,089 1,001,654 1,502,679 (1,502,679) -100.0%990 Infrastructure - - 1,050,000 (1,991,000)
Subtotal Capital Expenditures 21,422,487$ 36,140,290$ 13,626,007$ 21,609,000$ 7,982,993$ 58.6%Grand Total 97,049,666$ 113,145,781$ 106,798,317$ 119,251,069$ 12,452,752$ 11.7%Percentage Change 6.8% 16.6% -5.6% 11.7%
(1) FY 2007/08 amounts are preliminary and may be subject to adjustment based on completion of the closing process and the independent audit.
Difference Between ABDS and RFRO 836,666$ 1,525,781$ 6,069$ REFRO (As of 8/8/08) 96,213,000$ 111,620,000$ 119,245,000$ 2008/09 Proposed Budget 115,332,000$ Difference Between RFRO and FY 2008/09 Proposed Budget 3,913,000$
(2,100,000) Transfer to Capital Program(1,813,100) Transfer to GSA
(100)$
Appendix 1

Appendix 2Fleet Management Maintained Equipment Count By Department as of October 2008
DepartmentOn-Road
LightOn-Road
HeavyOff-Road/
Construction Auxiliary Total HeavyTotal Vehicles and Equipment
A % B C D B+C+D=E % A+E=F %
Fleet Management 25 0.3% 47 12 7 66 3.1% 91 1.0% Fleet Management Pool and Loner 564 7.7% 7 - - 7 0.3% 571 6.0% General Services Administration (Non Fleet) 150 2.0% 9 5 3 17 0.8% 167 1.8%GSA (Fleet and Non Fleet) 739 10.1% 63 17 10 90 4.2% 829 8.7%Office of Neighborhood Compliance 78 1.1% - - - - 0.0% 78 0.8%ETSD 87 1.2% 1 - - 1 0.0% 88 0.9%Consumer Services 41 0.6% - - 1 1 0.0% 42 0.4%Police 2,961 40.4% 114 19 61 194 9.0% 3,155 33.2%Fire Rescue 406 5.5% 149 5 4 158 7.3% 564 5.9%Corrections 253 3.4% 55 - 4 59 2.7% 312 3.3%Building 96 1.3% 1 - - 1 0.0% 97 1.0%Waste Management 156 2.1% 840 75 54 969 44.8% 1,125 11.8%DERM 109 1.5% 10 - 1 11 0.5% 120 1.3%Public Works 283 3.9% 314 117 55 486 22.5% 769 8.1%Seaport 91 1.2% 10 7 10 27 1.2% 118 1.2%Transit 214 2.9% 52 - 8 60 2.8% 274 2.9%Community Action Agency 31 0.4% 14 2 - 16 0.7% 47 0.5%Housing Agency 214 2.9% 12 5 2 19 0.9% 233 2.5%Human Services 48 0.7% 29 - 6 35 1.6% 83 0.9%Parks and Recreation 443 6.0% - - - - 0.0% 443 4.7%Water and Sewer 722 9.8% - - - - 0.0% 722 7.6%JMH (Jackson and South Hospital) 67 0.9% 2 - - 2 0.1% 69 0.7%State/County Health 44 0.6% 5 - - 5 0.2% 49 0.5%All Other Departments 253 3.4% 21 4 3 28 1.3% 281 3.0%TOTAL 7,336 100.0% 1,692 251 219 2,162 100.0% 9,498 100.0%
Appendix 2

Appendix 3Staff Time Allocation
Position ClassificationNumber of Positions
Executive Direction &
Control
Personnel, Finance and
AdministrationIT and Systems
Mainenance Contracts MgmtAsset Mgmt and
Tracking
Total Administration and Support Fleet Assessment
Vehicle Specification Preparation
Vehicle Acquisition & Preparation
Vehicle Lease and Rentals Mgmt
Vehicle Licensing and Title
Coordination
Administration and SupportAdmin Officer 1 1 0% 90% 0% 0% 0% 90% 0% 0% 0% 0% 0%Admin Secretary 1 0% 100% 0% 0% 0% 100% 0% 0% 0% 0% 0%Fleet Admin Supervisor 1 0% 55% 35% 0% 0% 90% 0% 0% 0% 0% 0%
Fleet Admin Supervisor 1 0% 45% 0% 0% 0% 45% 0% 0% 0% 0% 0%Fleet Mgmt Director 1 60% 30% 0% 0% 0% 90% 0% 0% 0% 0% 0%Fleet Mgmt Analyst 1 1 0% 100% 0% 0% 0% 100% 0% 0% 0% 0% 0%Manager GSA 1 20% 40% 20% 0% 0% 80% 0% 0% 0% 0% 0%Heavy Truck Tire Repairer 1 0% 50% 0% 0% 0% 50% 0% 0% 0% 0% 0%Senior System Analyst 1 0% 0% 100% 0% 0% 100% 0% 0% 0% 0% 0%
Vehicle Acquisition and DisposalAccount Clerk 1 0% 0% 0% 95% 0% 95% 0% 0% 0% 0% 5%Auto Part Specialist 2 1 0% 0% 0% 0% 0% 0% 0% 0% 0% 0% 0%Auto Body Worker 1 0% 0% 0% 0% 0% 0% 0% 0% 100% 0% 0%Facility Supervisor 1 0% 0% 0% 0% 0% 0% 0% 0% 50% 0% 0%Fleet Mgmt Analyst 1 1 0% 0% 0% 0% 30% 30% 0% 0% 35% 5% 30%Heavy Truck Tire Repairer 1 0% 0% 0% 0% 0% 0% 0% 0% 100% 0% 0%Maintenance Repairer 2 0% 0% 0% 0% 0% 0% 0% 0% 50% 0% 0%Manager Equipment Services 1 0% 0% 0% 0% 0% 0% 0% 40% 50% 10% 0%Fleet Admin Supervisor (Reclass to Purchasing Specialist) 1 0% 0% 0% 25% 25% 50% 0% 25% 25% 0% 0%Manager GSA 1 10% 0% 0% 30% 0% 40% 30% 30% 0% 0% 0%
Vehicle Maintenance and RepairAssistant Facility Supervisor (L) 10 0% 0% 0% 0% 0% 0% 0% 0% 0% 0% 0%Assistant Facility Supervisor (H) 8 0% 0% 0% 0% 0% 0% 0% 0% 0% 0% 0%Auto Parts Specialist 1 1 0% 0% 0% 0% 0% 0% 0% 0% 0% 0% 0%Auto Parts Specialist 2 (L) 4 0% 0% 0% 0% 0% 0% 0% 0% 0% 0% 0%Auto Parts Specialist 2 (H) 9 0% 0% 0% 0% 0% 0% 0% 0% 0% 0% 0%Data Entry Specialist 1 (L) 7 0% 0% 0% 0% 0% 0% 0% 0% 0% 0% 0%Data Entry Specialist 1 (H) 1 0% 0% 0% 0% 0% 0% 0% 0% 0% 0% 0%Facility Supervisor (L) 9 0% 0% 0% 0% 0% 0% 0% 0% 0% 0% 0%Facility Supervisor (H) 10 0% 0% 0% 0% 0% 0% 0% 0% 0% 0% 0%Fleet Mgmt Service Manager (L) 1 0% 0% 0% 0% 0% 0% 0% 0% 0% 0% 0%Fleet Mgmt Service Manager (H) 1 0% 0% 0% 0% 0% 0% 0% 0% 0% 0% 0%Heavy Equipment Tech 90 0% 0% 0% 0% 0% 0% 0% 0% 0% 0% 0%Heavy Truck Tire Repairer 15 0% 0% 0% 0% 0% 0% 0% 0% 0% 0% 0%Light Equipment Tech 64 0% 0% 0% 0% 0% 0% 0% 0% 0% 0% 0%Maintenance Repairer (L) 8 0% 0% 0% 0% 0% 0% 0% 0% 0% 0% 0%Maintenance Repairer (H) 1 0% 0% 0% 0% 0% 0% 0% 0% 0% 0% 0%Secretary 2 0% 0% 0% 0% 0% 0% 0% 0% 0% 0% 0%Semi Skilled Laborer 1 0% 0% 0% 0% 0% 0% 0% 0% 0% 0% 0%Welder 7 0% 0% 0% 0% 0% 0% 0% 0% 0% 0% 0%
FuelAccount Clerk 1 0% 0% 0% 0% 0% 0% 0% 0% 0% 0% 0%Data Console Tech 2 1 0% 0% 0% 0% 0% 0% 0% 0% 0% 0% 0%FM Training Specialist 1 0% 10% 0% 0% 0% 10% 0% 0% 0% 0% 0%Facility Supervisor 1 0% 0% 0% 0% 0% 0% 0% 0% 0% 0% 0%
**GSA MIS Technical Support 1 100% 100%
Total Full Time Equivalent (FTE) 274
Appendix 3
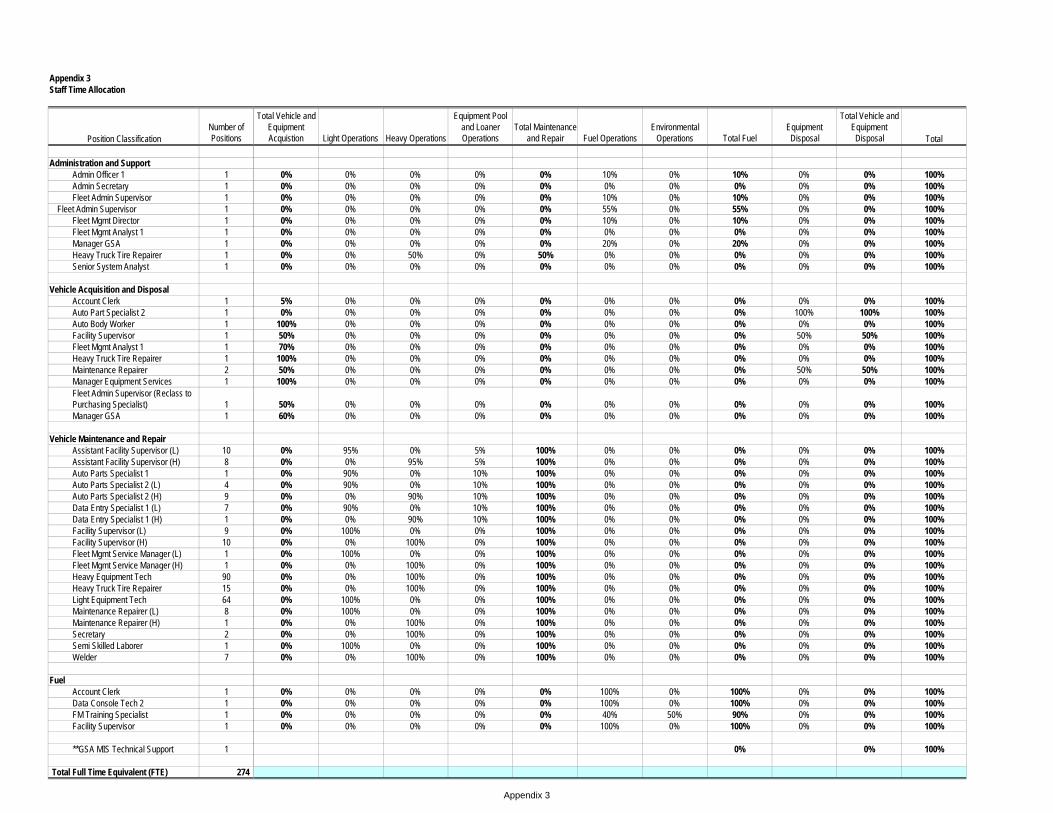
Appendix 3Staff Time Allocation
Position ClassificationNumber of Positions
Administration and SupportAdmin Officer 1 1Admin Secretary 1Fleet Admin Supervisor 1
Fleet Admin Supervisor 1Fleet Mgmt Director 1Fleet Mgmt Analyst 1 1Manager GSA 1Heavy Truck Tire Repairer 1Senior System Analyst 1
Vehicle Acquisition and DisposalAccount Clerk 1Auto Part Specialist 2 1Auto Body Worker 1Facility Supervisor 1Fleet Mgmt Analyst 1 1Heavy Truck Tire Repairer 1Maintenance Repairer 2Manager Equipment Services 1Fleet Admin Supervisor (Reclass to Purchasing Specialist) 1Manager GSA 1
Vehicle Maintenance and RepairAssistant Facility Supervisor (L) 10Assistant Facility Supervisor (H) 8Auto Parts Specialist 1 1Auto Parts Specialist 2 (L) 4Auto Parts Specialist 2 (H) 9Data Entry Specialist 1 (L) 7Data Entry Specialist 1 (H) 1Facility Supervisor (L) 9Facility Supervisor (H) 10Fleet Mgmt Service Manager (L) 1Fleet Mgmt Service Manager (H) 1Heavy Equipment Tech 90Heavy Truck Tire Repairer 15Light Equipment Tech 64Maintenance Repairer (L) 8Maintenance Repairer (H) 1Secretary 2Semi Skilled Laborer 1Welder 7
FuelAccount Clerk 1Data Console Tech 2 1FM Training Specialist 1Facility Supervisor 1
**GSA MIS Technical Support 1
Total Full Time Equivalent (FTE) 274
Total Vehicle and Equipment Acquistion Light Operations Heavy Operations
Equipment Pool and Loaner Operations
Total Maintenance and Repair Fuel Operations
Environmental Operations Total Fuel
Equipment Disposal
Total Vehicle and Equipment Disposal Total
0% 0% 0% 0% 0% 10% 0% 10% 0% 0% 100%0% 0% 0% 0% 0% 0% 0% 0% 0% 0% 100%0% 0% 0% 0% 0% 10% 0% 10% 0% 0% 100%0% 0% 0% 0% 0% 55% 0% 55% 0% 0% 100%0% 0% 0% 0% 0% 10% 0% 10% 0% 0% 100%0% 0% 0% 0% 0% 0% 0% 0% 0% 0% 100%0% 0% 0% 0% 0% 20% 0% 20% 0% 0% 100%0% 0% 50% 0% 50% 0% 0% 0% 0% 0% 100%0% 0% 0% 0% 0% 0% 0% 0% 0% 0% 100%
5% 0% 0% 0% 0% 0% 0% 0% 0% 0% 100%0% 0% 0% 0% 0% 0% 0% 0% 100% 100% 100%
100% 0% 0% 0% 0% 0% 0% 0% 0% 0% 100%50% 0% 0% 0% 0% 0% 0% 0% 50% 50% 100%70% 0% 0% 0% 0% 0% 0% 0% 0% 0% 100%
100% 0% 0% 0% 0% 0% 0% 0% 0% 0% 100%50% 0% 0% 0% 0% 0% 0% 0% 50% 50% 100%
100% 0% 0% 0% 0% 0% 0% 0% 0% 0% 100%
50% 0% 0% 0% 0% 0% 0% 0% 0% 0% 100%60% 0% 0% 0% 0% 0% 0% 0% 0% 0% 100%
0% 95% 0% 5% 100% 0% 0% 0% 0% 0% 100%0% 0% 95% 5% 100% 0% 0% 0% 0% 0% 100%0% 90% 0% 10% 100% 0% 0% 0% 0% 0% 100%0% 90% 0% 10% 100% 0% 0% 0% 0% 0% 100%0% 0% 90% 10% 100% 0% 0% 0% 0% 0% 100%0% 90% 0% 10% 100% 0% 0% 0% 0% 0% 100%0% 0% 90% 10% 100% 0% 0% 0% 0% 0% 100%0% 100% 0% 0% 100% 0% 0% 0% 0% 0% 100%0% 0% 100% 0% 100% 0% 0% 0% 0% 0% 100%0% 100% 0% 0% 100% 0% 0% 0% 0% 0% 100%0% 0% 100% 0% 100% 0% 0% 0% 0% 0% 100%0% 0% 100% 0% 100% 0% 0% 0% 0% 0% 100%0% 0% 100% 0% 100% 0% 0% 0% 0% 0% 100%0% 100% 0% 0% 100% 0% 0% 0% 0% 0% 100%0% 100% 0% 0% 100% 0% 0% 0% 0% 0% 100%0% 0% 100% 0% 100% 0% 0% 0% 0% 0% 100%0% 0% 100% 0% 100% 0% 0% 0% 0% 0% 100%0% 100% 0% 0% 100% 0% 0% 0% 0% 0% 100%0% 0% 100% 0% 100% 0% 0% 0% 0% 0% 100%
0% 0% 0% 0% 0% 100% 0% 100% 0% 0% 100%0% 0% 0% 0% 0% 100% 0% 100% 0% 0% 100%0% 0% 0% 0% 0% 40% 50% 90% 0% 0% 100%0% 0% 0% 0% 0% 100% 0% 100% 0% 0% 100%
0% 0% 100%
Appendix 3

Activity Prioritization Criteria Point Values
Executive Direction and
Control
Personnel, Finance and
Administration
IT and Systems
MaintenanceContracts
Management
Asset Management and Tracking
Fleet Assessment
Vehicle Specification Preparation
Vehicle Acquisition
and Preparation
Vehicle Lease and Rental
Management
Vehicle Licensing and
Title Coordination
Light Equipment
Maintenance and Repair Operations
Heavy Equipment
Maintenance and Repair Operations
Equipment Pool and Loaner
OperationFuel
OperationsEnvironmental Operations
Equipment Disposal
1. Board of County Commission 2008/09 Budget Priorities and Policy Objectives
10 = Priority; 0 = No Priority
Clearly-defined performance expectations and standards 5 5 5
Easily accessible information regarding County services and programs
5 5 3
Streamlined and responsive procurement process 3
"Best-value" goods and services (price, quality, terms and conditions) 5 5
User friendly e-government sharing information and providing expanded hours and services
County processes improved through information technology
Motivated, dedicated workforce team aligned with organizational priorities
5 5 5 5
Workforce skills to support County priorities (e.g. leadership, customer service, fiscal problem-solving, technology, etc.) 3 3 3 3
Safe, convenient and accessible facilities planned and built ready to meet needs 3
Safe and reliable vehicles ready to meet needs
5 5 5 5 5 5 5
Sound asset mangement and financial investment strategies
Planned necessary resources to meet current and future operating and capital needs
5 5 3
Appendix 4
Scale of Points 0 to 5: 0 = Activity has no
influence on achieving result; 1 = Activity has
minimal influence; 3 = Activity influences result5 = Activity is essential
to achieving results
Countywide Budget Priorities:
Fleet Management Program Priority Rankings by Activity
2. Enabling Strategies Strategic Plan Priority Outcomes:
Appendix 4
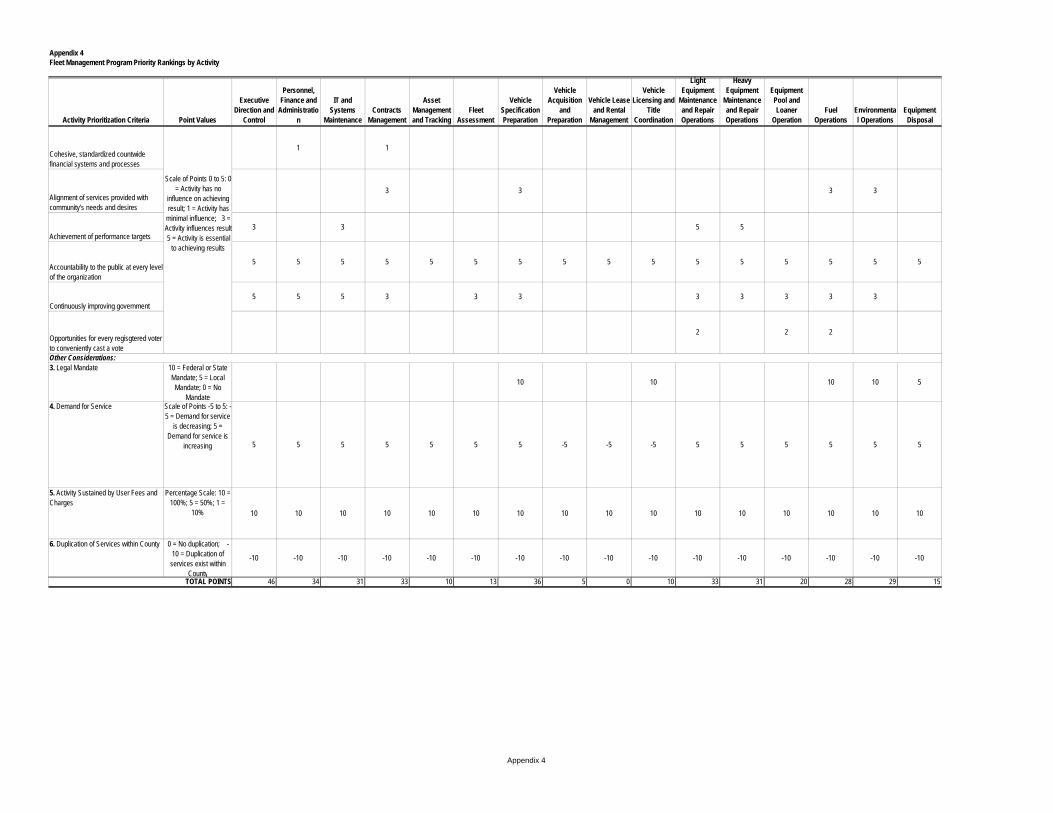
Activity Prioritization Criteria Point Values
Executive Direction and
Control
Personnel, Finance and
Administration
IT and Systems
MaintenanceContracts
Management
Asset Management and Tracking
Fleet Assessment
Vehicle Specification Preparation
Vehicle Acquisition
and Preparation
Vehicle Lease and Rental
Management
Vehicle Licensing and
Title Coordination
Light Equipment
Maintenance and Repair Operations
Heavy Equipment
Maintenance and Repair Operations
Equipment Pool and Loaner
OperationFuel
OperationsEnvironmental Operations
Equipment Disposal
Appendix 4Fleet Management Program Priority Rankings by Activity
Cohesive, standardized countwide financial systems and processes
1 1
Alignment of services provided with community's needs and desires
3 3 3 3
Achievement of performance targets3 3 5 5
Accountability to the public at every level of the organization
5 5 5 5 5 5 5 5 5 5 5 5 5 5 5 5
Continuously improving government5 5 5 3 3 3 3 3 3 3 3
Opportunities for every regisgtered voter to conveniently cast a vote
2 2 2
3. Legal Mandate 10 = Federal or State Mandate; 5 = Local
Mandate; 0 = No Mandate
10 10 10 10 5
4. Demand for Service Scale of Points -5 to 5: -5 = Demand for service
is decreasing; 5 = Demand for service is
increasing 5 5 5 5 5 5 5 -5 -5 -5 5 5 5 5 5 5
5. Activity Sustained by User Fees and Charges
Percentage Scale: 10 = 100%; 5 = 50%; 1 =
10% 10 10 10 10 10 10 10 10 10 10 10 10 10 10 10 10
6. Duplication of Services within County 0 = No duplication; -10 = Duplication of services exist within
County
-10 -10 -10 -10 -10 -10 -10 -10 -10 -10 -10 -10 -10 -10 -10 -10
46 34 31 33 10 13 36 5 0 10 33 31 20 28 29 15
Scale of Points 0 to 5: 0 = Activity has no
influence on achieving result; 1 = Activity has
minimal influence; 3 = Activity influences result5 = Activity is essential
to achieving results
TOTAL POINTS
Other Considerations:
Appendix 4