board meeting agenda october 28, 2014 - 6:30...
TRANSCRIPT
UMVRDC Mission Statement
“Enable the region to thrive through assisting local governments.”
BOARD MEETING AGENDA October 28, 2014 - 6:30 PM
Introductions Approve Agenda/Additions 1. Consent Agenda Items
a. Minutes from September 2014 b. September 2014 Treasurer’s Report and List of Bills c. RLF Treasurer’s Report d. Christmas Office Closure e. Center for Small Towns Intern Project f. Bush Foundation Community Creativity Cohort Grant
NOTE: All items listed under consent agenda will be enacted by one motion. Upon request Commission members can remove
items from the consent agenda list and have them considered separately under Action Items.
Staff Presentation: Jacki – 4a. Creating County EDA Citizen Comments: Round Robin: Please share any recent actions, discussions or issues from your council or board
2. Information Items a. Planner Update b. Executive Director Update c. EDA Conference Report
3. Action Items a. Greater MN Partnership Dues b. Staffing 4. Discussion Items a. How to Create a County EDA Adjourn Next Meeting Date: Tuesday, November 25, 2014 (BHAG committees will meet at 5:30pm)
#1a
RDC BOARD MINUTES
Upper Minnesota Valley Regional Development Commission Appleton Civic Center - Appleton, MN
September 23, 2014
Board Members Present: Bruce Swigerd, Juanita Lauritsen, Jim Dahlvang, Rusty Dimberg, Mark Bourne, Debra Lee Fader, Jim Schmaedeka, Gary Hendrickx, Mike Fugleberg, Vicki Oakes, Warren Rau, Graylen Carlson, Jeff Olson, John Berends, Brett Buer, Justin Bentaas
Board Members Absent: Scott Rixe, Scott Peterson, Kathi Thymian, Brent Olson Staff Present: Dawn Hegland, Lindsey Knutson, Randy Larson, Jacki Anderson
and Jackie Sigdahl Guests: none Call to Order Chairman Hendrickx called the meeting to order at 6:30 p.m. Approve Agenda/Additions
M/S/P – Rusty Dimberg, Mark Bourne made motion to approve the agenda with the addition of 2d. RLF Loan Activity Update and 3d. Loan Advisory Board Recommendation. 1. Consent Agenda Items
a. Minutes from August 2014 b. August 2014 Treasurer’s Report and List of Bills c. RLF Treasurer’s Report d. Canby Zoning Contract Amendment e. Granite Falls Memorial Park Master Plan Contract
M/S/P – Warren Rau, James Schmaedeka made motion to accept and approve the Consent Agenda Items as follows: approval of minutes from the August meeting; approval of the August Treasurer’s Report showing current expenses $69,279 and current revenue $4049 along with the check listings as presented; approval of the RLF treasurer’s report; approval of the Canby Zoning Ordinance extension amendment; approval of the technical assistance contract to develop a Master Plan for Granite Falls’ Memorial Park. ROUND ROBIN DISCUSSION:
Gary Hendrickx, Swift County: County interested in broadband. Looking at a 5.9% levy increase. Hiring a Mental Health Practitioner. A new Deputy Assessor will be hired and also a new GIS position will be created the first of 2015.
Brent, Big Stone County: absent
Gary Johnson, Yellow Medicine County: Broadband project moving forward. Courthouse preliminary designs are being accepted. 6.43% levy increase. De-

escalation training was held for county employees. Food shelf looking for a new location because it will not be housed in new courthouse. Have spent $196,000 on out of home placement.
Rusty, Big Stone County Townships: Shared the hospitality of the “Abbey of the Hills” in Marvin, SD – may be used as a retreat center.
Brett, Dawson/Boyd Schools: The school year is off to a good, quiet year.
James, Chippewa County Townships: passed.
Jim, Chippewa County: Levy increase of 4.5%. Two new camper cabins available for renting via website - $50/night. Thrifty White is building new store on car wash site – will include drive-up pharmacy. Cenex moving to new location closer to highway. Gun show coming up. The old Running’s building is being used for new campers and camper repair.
Bruce, Prairie Five CAC, Inc.: MAP merging not going so well. Looking into the food shelf demand.
Mark, LqP County Townships: passed
Jeff, LqP County Municipalities: May be getting a dollar store. Looking at a 7.5% levy
Scott P., YM County Municipalities: absent.
Juanita, Workforce Council: passed.
Warren, Swift County Townships: passed.
Debra Lee, Chippewa County Municipalities: Gave information on the VIP hunt in October. A Beyond the Yellow Ribbon presentation was made for city campaign. The levy dollars for the flood area will be coming in – the match has already been raised.
Justin, Granite Falls EDA: Working on the SpecSys loan along with various other loans. An agreement is being worked on for the possibility of a medical cannibus facility on 58 acres in the industrial park contingent upon licensing.
Graylen, LqP County: Still working on budget. Farmers Mutual working on having cable tv as an option. Intersection of hwy 40 & county rd. 25 may become a 4-way stop and swapped with county rd. 275
Vicki, Ortonville EDA: The RDC is working on zoning ordinances, a Brownsfield application and a Blandin/Broadband application for the City/County.
Scott R., Big Stone County Municipalities: absent.
Kathi, Ortonville Schools: passed.
Mike, Swift County Municipalities: The hospital foundation board has approved an assisted living/memory loss unit proposal for the City.
2. Information Items a. Planner Update - no questions/comments b. Executive Director Update – no questions/comments c. NADO Annual Training Conference Notes – no questions/comments
3. Action Items a. Loan Advisory Board M/S/P - Mark Bourne, Vicki Oakes made motion to approve the following requests: Approval of $100,000 loan from the disaster fund to Kay’s Processing at 5% interest with a
term and amortization of 5 years with a shared second pro-rata position with SWIF on all business assets and real estate of Kay’s Processing and Kay’s Naturals.

Approval for Northern Geo’s subordination request for an additional $350,000 that F&M Bank will be lending to the business.
Authorization for the Chairman and Executive Director’s signature on the RLF Plan
Certification Resolutions.
b Granite Falls Hedgehog Application
M/S/P - Jeff Olson, Debra Lee Fader made motion to approve the Hedgehog Grant Application of $3,750 to the City of Granite Falls. Abstaining was Justin Bentaas.
c. Agency Vehicle Replacement M/S/P - Jim Dahlvang, Rusty Dimberg made motion to approve and authorize the
purchase of an agency vehicle through Adams Motor in Montevideo.
d. Loan Advisory Board Recommendation M/S/P – Mark Bourne, Vicki Oakes made motion to approve a one-month extension to
Wade Larson, owner of West Central Powder Coat, Inc. for the commitment of a $100,000 loan from the disaster fund.
4. Discussion Items a. US DOT Rulemaking
Discussion of the proposed rulemaking comments along with the comments that we
submitted to the US DOT. b. Greater Minnesota Regional Parks and Trails Commission Update
Discussion of the Greater MN Regional Parks and Trails Commission, the District 3-
Planning Committee and the new process for applications c. 2014 City Survey Results
Discussion and review of the survey results that were sent to the counties and cities in our region
Adjournment A motion by Rusty Dimberg, Debra Lee Fader for adjournment was made at approximately 7:50pm. APPROVED BY: PREPARED BY: _______________________________ ___________________________________ Gary Hendrickx Jackie Sigdahl RDC Chairman RDC Administrative Assistant

#1b
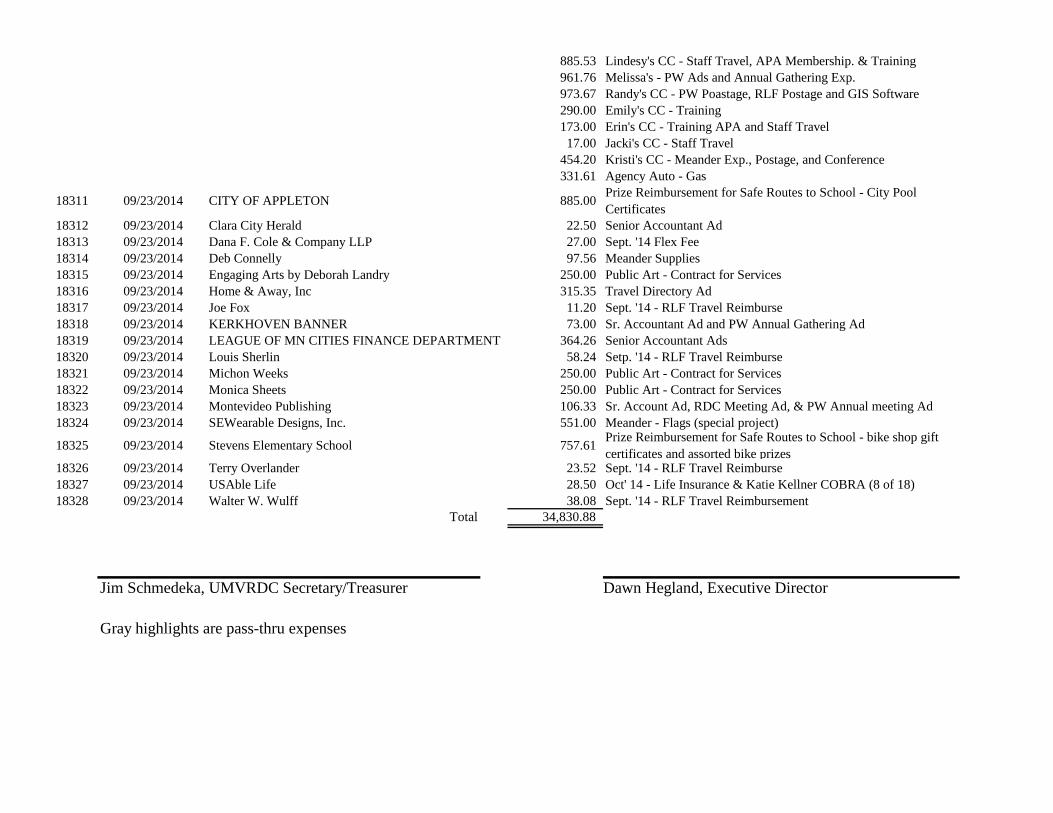
ACTION MEMO TO: Upper MN Valley RDC Commissioners FROM: Arlene Tilbury, Financial Officer DATE: October 28th, 2014 RE: September 2014 Check Listing &Treasurer’s Report Attached is the treasurer’s report for September 2014. On the bottom of the revenue report (page 2) I have added the current and year to date pass-thru revenue that is not included on the itemized revenue report. Pass-through items include things like payments to grants recipients; Meander and Tourism ads and special activities; Byway projects. At the end of the disbursement report (page 3) are the agency balances for the following accounts: general checking, money market, revolving loan fund, agency auto and equipment fund. Also enclosed is the check listing that lists all checks cut for the month of September 2014. ACTION REQUESTED: For the Commission to approve the attached September 2014 Treasurer’s Report and the September 2014 Check Listing (check # 18276 through 18328) as presented. Encl.

September-14 #1b
Page 2
FY15 Current YR-To-DT
Budget September July-September
Agency Revenues
Interest 3,500 872 1,259
Levy 282,500 434 434
- Less HH -
Dawson Sidewalk Project (4,358) -
Miscellaneous - 720 720
Economic Development/EDA -
EDA Planning Grant 64,628 16,157
Revolving Loan Fund Admin 40,000 5,543 5,543
Technical Assistance -
Technical Assistance Potential Contracts 18,230 -
Appleton Technical Assistance ($5,000 HH FY14 included) 27,000 168 168
Safe Routes for Schools Plans 15,000 -
Safe Routes Coordinator 51,000 7,277 7,277
Canby Zoning Update 4,130 -
Hazard Mitigation Updates (15,000 FY13 HH included) 87,000 8,740 8,740
Montevideo Arts Project 4,770 -
Greater MN Development Strategy 6,250 -
CERTS 28,400 2,977 2,977
Upper Sioux Hazard Mitigation (includes $5,000 HH FY14 included) 42,500 -
Dawson Sidewalk Project ($4,357.7 FY15 HH included) 8,715 -
Grant Writing -
Grant Writing Potential Contracts 5,000 -
Granite Falls Memorial Park Grant Application
2 County HM App 1,000 -
Grants Admin/Management -
Granite Falls EDA Grant 35,000 -
Granite Falls Overall Admin 15,000 -
Granite Falls Volestad House 5,000 -
Granite Falls Bridge (labor standards) 6,000 -
Benson SCDP 18,000 0 0
Ortonville SCDP 15,000 0 0
Clara City SCDP New 12,000 -
Transportation -
Planning Grant 75,000 37,500 37,500
Scenic Byway (Transp) Planning Grant FY15 15,080 -
Prairie Waters 95,000 31,984 35,484
Byway Corridor Management Plan 67,790 -
Art Crawl 46,000 20,063 21,184
Total Revenue 1,090,136 116,277 137,442
Pass-Thru Revenue (not included above) 206,096
UPPER MN VALLEY REGIONAL DEVELOPMENT COMMISSION
REVENUE & EXPENSE REPORT

Page 3
FY15 Current YR-To-DT
Expenses Budget September July-September
Salaries 488,517 46,641 130,431
Fringe Benefits 265,630 17,183 40,319
Commissioner's Expense
Per Diem 10,000 808 1,666
FICA 1,000 61 126
Public Officials Ins. 4,000 2,228 2,228
Meeting Expense 2,000 528 1,291
Travel C&C 6,000 622
Training 5,000 -
Audit 13,000 -
Computer Technical Assistance 12,000 450 1,167
Copy Charge/xerox lease 8,500 382 753
Depreciation 11,000 1,010 2,871
Dues 5,000 240 240
Insurance 1,200 439 439
Legal Fees 2,000 208 263
Miscellaneous/Employee Morale 3,000 -
Office Rent 12,210 2,033 3,050
Postage 7,000 155 2,583
Printing/Advertising 8,000 773 3,159
RDC Marketing Item 2,000 651
Registration/Training 10,000 945 1,579
Repairs/Maintenance 2,000 75 135
Software GMS/GIS/General 6,000 188 1,488
Sub./Publications 2,000 518 579
Supplies 6,000 766 1,168
Telephone/Internet 4,000 379 1,074
Travel/Staff 34,000 4,478 7,122
Web Hosting/Maintenance 3,500 609 609
Pass Thru Activity
GIS for Hazard Mitigation Chippewa 4,100 -
GIS for Hazard Mitigation YM 4,100 -
GIS for Hazard Mitigation Big Stone 4,100 -
GIS for Hazard Mitigation Upper Sioux 4,100 -
County Reimbursement for Hazard Mitigation 6,000 -
SRTS - Products 15,000 5,633 5,633
Byway 41,276 -
Meander 31,500 828 1,494
Prairie Waters 40,000 3,454 7,751
Total Expenses 1,084,733 91,012 220,492
EXCESS REV. OVER EXP. 5,403 25,264 (83,049)
General Checking 65,222$
Money Market 359,535$
Certificate of Deposit 250,000$
RLF Savings 264,908$
Agency Auto 42,019$
Equipment Fund 18,059$
UMVRDC Secretary/Treasurer UMVRDC Executive Director

Page 3 Treasurer's Report
September 2014 CHECK LISTING
Checks 18276 To 18328
Check# Check Date Vendor Name Check Amount Description
18276 09/03/2014 Advocate Tribune 82.50 Sr. Acct Ad & PW AD for Annual Gathering
18277 09/03/2014 Appleton Oil Company 115.24 Oil cahnge on both vehicles
18278 09/03/2014 CANBY NEWS 41.25 Sr. Acct Ad & PW ad for Annual Gathering
18279 09/03/2014 CHIPPEWA COUNTY AUDITOR/TREASURER 591.99 Dental Insurance - Sept. '14
18280 09/03/2014 CITY OF APPLETON 1,016.67 Rent - Sept '14
18281 09/03/2014 DAWSON SENTINEL 66.20 Sr. Acct Ad & PW Ad - Annual Gathering
18282 09/03/2014 DONS FOOD PRIDE 31.59 Gerneral Supplies
18283 09/03/2014 DZ Carpentry Inc. 11,711.00 1901 Wisconsin Ave. - Benson SCDP Req. # 16
18284 09/03/2014 Federated Telephone, Inc 495.00 Spam Filter/Computer Maintenance
18285 09/03/2014 Grants Management Systems, Inc. 67.00 GMS Software Maintenance
18286 09/03/2014 NCPERS Minnesota 16.00 Life Insurance - Sept '14
18287 09/03/2014 Ortonville Independent 120.00 Sr. Acct Ad & PW Ad for Annual Gathering
18288 09/03/2014 Outdoor News Publications 618.00 PW Advertising
18289 09/03/2014 Pamela Ellison 21.17 Supplies - PW Annual Gathering
18290 09/03/2014 PRAIRIE FIVE CAC 1,666.71 Field Admine for July '14
18291 09/03/2014 Ruth Keller 75.00 August '14 Office Cleaning
18292 09/03/2014 Senior Perspective 78.00 Meadner Ad -
18293 09/03/2014 Swift County Monitor-News 142.00 Sr. Acct Ad / PW Ad for Annual Gathering
18294 09/03/2014 The Appleton Press 55.00 Sr. Acct Ad / PW Ad - Annual Gathering
18295 09/03/2014 Tri-County News 101.50 PW Advetising
18296 09/03/2014 Vivid Image, Inc. 609.00 RDC Website Hosting
18297 09/03/2014 WESTERN GUARD 67.50 Sr. Acct Ad / Pw Ad for Annual Gathering
18298 09/03/2014 Xerox Corporation 386.39 Copy Charge - August '14
18299 09/15/2014 Bourne, Mark L 78.09 Commissioner Payroll
18300 09/15/2014 Buer, Brett T. 82.57 Commissioner Payroll
18301 09/15/2014 Dahlvang, Jim 78.65 Commissioner Payroll
18302 09/15/2014 Rau, Warren 60.73 Commissioner Payroll
18303 09/15/2014 Swigerd, Bruce 71.37 Commissioner Payroll
18304 09/15/2014 Associated Bank 125.00 Sept 2014 Employer HSA Contribution
18305 09/15/2014 First Bank & Trust 125.00 Sept 2014 Employer HSA Contribution
18306 09/15/2014 Minnwest Bank Montevideo 875.00 Sept 2014 Employer HSA Contribution
18307 09/23/2014 Benson Police Department 2,995.72Prize Reimbursement for Safe Routes to School - rain coats,
safety brochures, safety activity books, and helmets
18308 09/23/2014 Bert Raney Elementary 994.92 Prize Reimbursement - water bottles
18309 09/23/2014 CANBY NEWS 6.88 RDC Meeting Ad
18310 09/23/2014 Chase Card Services 2,688.75 Dawn's CC - Staff Travel
277.57 Arlene's CC - Office Supplies
885.53 Lindesy's CC - Staff Travel, APA Membership. & Training
961.76 Melissa's - PW Ads and Annual Gathering Exp.
973.67 Randy's CC - PW Poastage, RLF Postage and GIS Software
290.00 Emily's CC - Training
173.00 Erin's CC - Training APA and Staff Travel
17.00 Jacki's CC - Staff Travel
454.20 Kristi's CC - Meander Exp., Postage, and Conference
331.61 Agency Auto - Gas
18311 09/23/2014 CITY OF APPLETON 885.00Prize Reimbursement for Safe Routes to School - City Pool
Certificates
18312 09/23/2014 Clara City Herald 22.50 Senior Accountant Ad
18313 09/23/2014 Dana F. Cole & Company LLP 27.00 Sept. '14 Flex Fee
18314 09/23/2014 Deb Connelly 97.56 Meander Supplies
18315 09/23/2014 Engaging Arts by Deborah Landry 250.00 Public Art - Contract for Services
18316 09/23/2014 Home & Away, Inc 315.35 Travel Directory Ad
18317 09/23/2014 Joe Fox 11.20 Sept. '14 - RLF Travel Reimburse
18318 09/23/2014 KERKHOVEN BANNER 73.00 Sr. Accountant Ad and PW Annual Gathering Ad
18319 09/23/2014 LEAGUE OF MN CITIES FINANCE DEPARTMENT 364.26 Senior Accountant Ads
18320 09/23/2014 Louis Sherlin 58.24 Setp. '14 - RLF Travel Reimburse
18321 09/23/2014 Michon Weeks 250.00 Public Art - Contract for Services
18322 09/23/2014 Monica Sheets 250.00 Public Art - Contract for Services
18323 09/23/2014 Montevideo Publishing 106.33 Sr. Account Ad, RDC Meeting Ad, & PW Annual meeting Ad
18324 09/23/2014 SEWearable Designs, Inc. 551.00 Meander - Flags (special project)
18325 09/23/2014 Stevens Elementary School 757.61Prize Reimbursement for Safe Routes to School - bike shop gift
certificates and assorted bike prizes18326 09/23/2014 Terry Overlander 23.52 Sept. '14 - RLF Travel Reimburse
18327 09/23/2014 USAble Life 28.50 Oct' 14 - Life Insurance & Katie Kellner COBRA (8 of 18)
18328 09/23/2014 Walter W. Wulff 38.08 Sept. '14 - RLF Travel Reimbursement
Total 34,830.88
Jim Schmedeka, UMVRDC Secretary/Treasurer Dawn Hegland, Executive Director
Gray highlights are pass-thru expenses
#1c
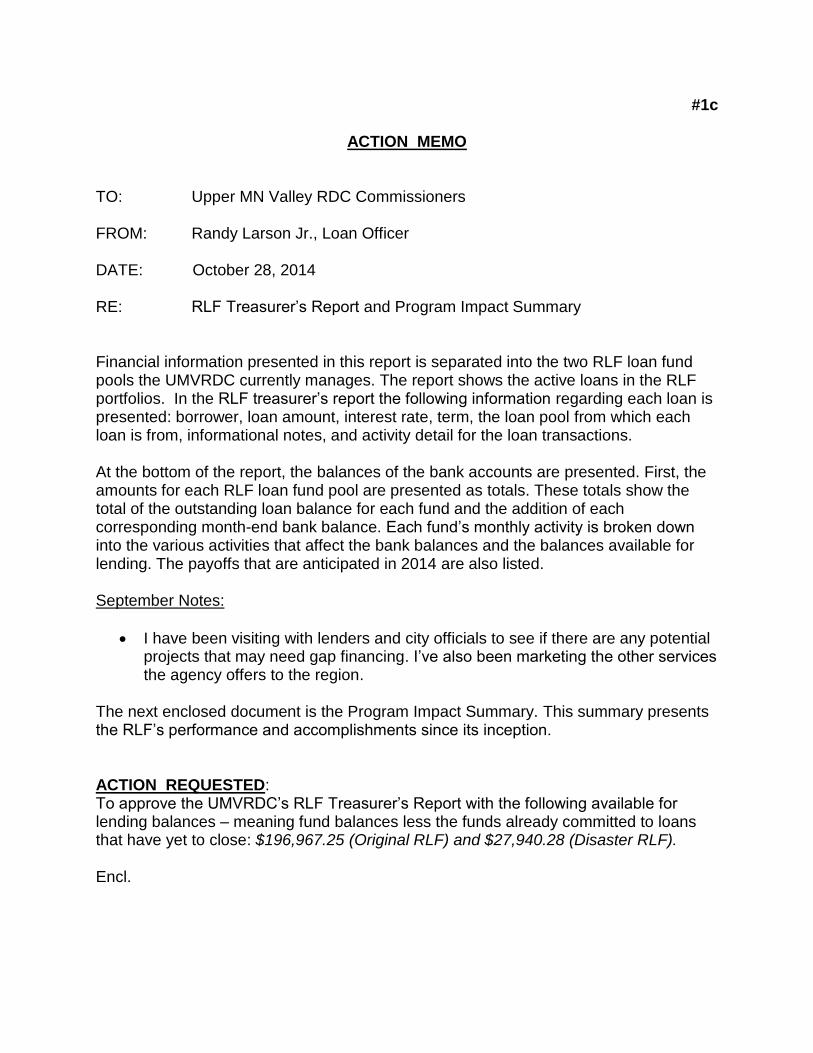
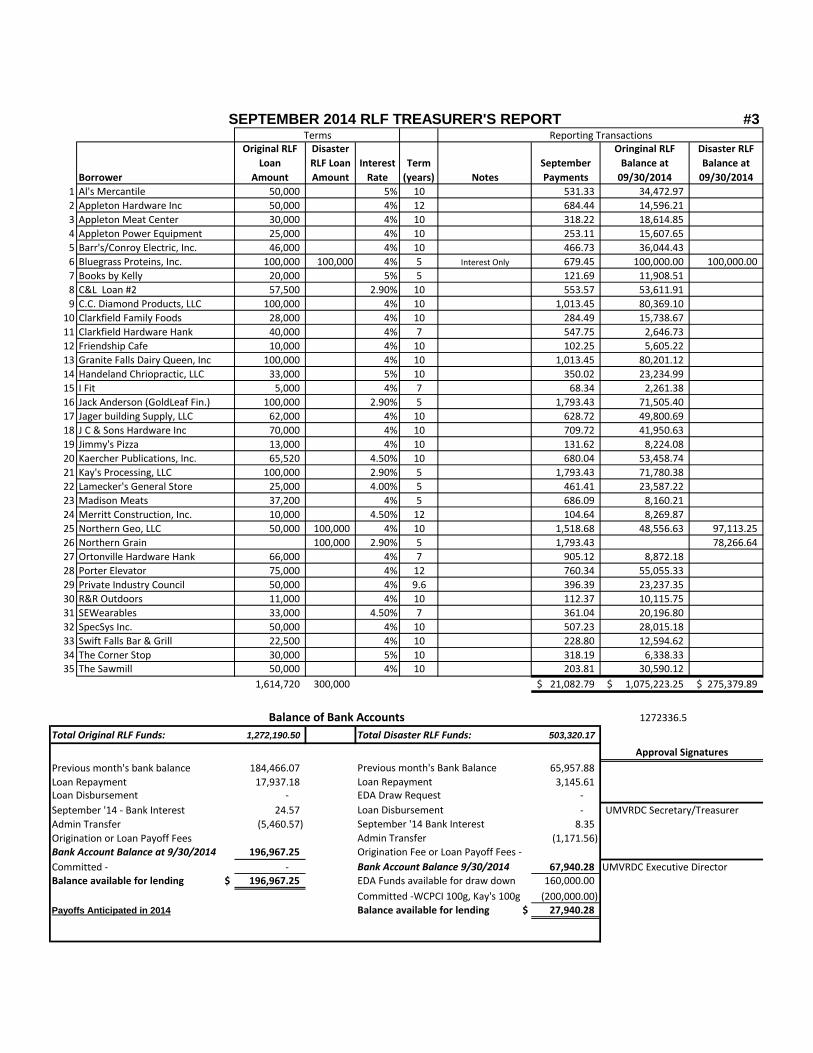
ACTION MEMO TO: Upper MN Valley RDC Commissioners FROM: Randy Larson Jr., Loan Officer DATE: October 28, 2014 RE: RLF Treasurer’s Report and Program Impact Summary Financial information presented in this report is separated into the two RLF loan fund pools the UMVRDC currently manages. The report shows the active loans in the RLF portfolios. In the RLF treasurer’s report the following information regarding each loan is presented: borrower, loan amount, interest rate, term, the loan pool from which each loan is from, informational notes, and activity detail for the loan transactions. At the bottom of the report, the balances of the bank accounts are presented. First, the amounts for each RLF loan fund pool are presented as totals. These totals show the total of the outstanding loan balance for each fund and the addition of each corresponding month-end bank balance. Each fund’s monthly activity is broken down into the various activities that affect the bank balances and the balances available for lending. The payoffs that are anticipated in 2014 are also listed. September Notes:
I have been visiting with lenders and city officials to see if there are any potential projects that may need gap financing. I’ve also been marketing the other services the agency offers to the region.
The next enclosed document is the Program Impact Summary. This summary presents the RLF’s performance and accomplishments since its inception. ACTION REQUESTED: To approve the UMVRDC’s RLF Treasurer’s Report with the following available for lending balances – meaning fund balances less the funds already committed to loans that have yet to close: $196,967.25 (Original RLF) and $27,940.28 (Disaster RLF). Encl.
Borrower
Original RLF
Loan
Amount
Disaster
RLF Loan
Amount
Interest
Rate
Term
(years) Notes
September
Payments
Oringinal RLF
Balance at
09/30/2014
Disaster RLF
Balance at
09/30/2014
1 Al's Mercantile 50,000 5% 10 531.33 34,472.97
2 Appleton Hardware Inc 50,000 4% 12 684.44 14,596.21
3 Appleton Meat Center 30,000 4% 10 318.22 18,614.85
4 Appleton Power Equipment 25,000 4% 10 253.11 15,607.65
5 Barr's/Conroy Electric, Inc. 46,000 4% 10 466.73 36,044.43
6 Bluegrass Proteins, Inc. 100,000 100,000 4% 5 Interest Only 679.45 100,000.00 100,000.00
7 Books by Kelly 20,000 5% 5 121.69 11,908.51
8 C&L Loan #2 57,500 2.90% 10 553.57 53,611.91
9 C.C. Diamond Products, LLC 100,000 4% 10 1,013.45 80,369.10
10 Clarkfield Family Foods 28,000 4% 10 284.49 15,738.67
11 Clarkfield Hardware Hank 40,000 4% 7 547.75 2,646.73
12 Friendship Cafe 10,000 4% 10 102.25 5,605.22
13 Granite Falls Dairy Queen, Inc 100,000 4% 10 1,013.45 80,201.12
14 Handeland Chriopractic, LLC 33,000 5% 10 350.02 23,234.99
15 I Fit 5,000 4% 7 68.34 2,261.38
16 Jack Anderson (GoldLeaf Fin.) 100,000 2.90% 5 1,793.43 71,505.40
17 Jager building Supply, LLC 62,000 4% 10 628.72 49,800.69
18 J C & Sons Hardware Inc 70,000 4% 10 709.72 41,950.63
19 Jimmy's Pizza 13,000 4% 10 131.62 8,224.08
20 Kaercher Publications, Inc. 65,520 4.50% 10 680.04 53,458.74
21 Kay's Processing, LLC 100,000 2.90% 5 1,793.43 71,780.38
22 Lamecker's General Store 25,000 4.00% 5 461.41 23,587.22
23 Madison Meats 37,200 4% 5 686.09 8,160.21
24 Merritt Construction, Inc. 10,000 4.50% 12 104.64 8,269.87
25 Northern Geo, LLC 50,000 100,000 4% 10 1,518.68 48,556.63 97,113.25
26 Northern Grain 100,000 2.90% 5 1,793.43 78,266.64
27 Ortonville Hardware Hank 66,000 4% 7 905.12 8,872.18
28 Porter Elevator 75,000 4% 12 760.34 55,055.33
29 Private Industry Council 50,000 4% 9.6 396.39 23,237.35
30 R&R Outdoors 11,000 4% 10 112.37 10,115.75
31 SEWearables 33,000 4.50% 7 361.04 20,196.80
32 SpecSys Inc. 50,000 4% 10 507.23 28,015.18
33 Swift Falls Bar & Grill 22,500 4% 10 228.80 12,594.62
34 The Corner Stop 30,000 5% 10 318.19 6,338.33 35 The Sawmill 50,000 4% 10 203.81 30,590.12
1,614,720 300,000 21,082.79$ 1,075,223.25$ 275,379.89$
1272336.5
Total Original RLF Funds: 1,272,190.50 503,320.17
Previous month's bank balance 184,466.07 65,957.88
Loan Repayment 17,937.18 3,145.61 Loan Disbursement - EDA Draw Request -
September '14 - Bank Interest 24.57 - UMVRDC Secretary/Treasurer
Admin Transfer (5,460.57) 8.35
Origination or Loan Payoff Fees (1,171.56) Bank Account Balance at 9/30/2014 196,967.25
Committed - - 67,940.28 UMVRDC Executive DirectorBalance available for lending $ 196,967.25 160,000.00
(200,000.00) Payoffs Anticipated in 2014 27,940.28
Approval Signatures
SEPTEMBER 2014 RLF TREASURER'S REPORT #3Terms Reporting Transactions
Balance of Bank Accounts
Total Disaster RLF Funds:
Bank Account Balance 9/30/2014
EDA Funds available for draw down
Committed -WCPCI 100g, Kay's 100g
Balance available for lending $
Previous month's Bank Balance
Loan Repayment
Loan Disbursement
September '14 Bank Interest
Admin Transfer
Origination Fee or Loan Payoff Fees -

111
5,747,160.00$
95,182,820.00$
17,886,869.00$
31,726,932.00$
1130.5
1560.5
Start-Up 39
Expansion 45
Retention 27
Total 111
52
26
33
Total 111
Industrial
Commercial
Service
Jobs Created:
Jobs Retained:
Program Impact Summary
Since the RLF was incorporated in 1988, the program has made a significant imapact on the
economic growth and employment opportunities in Region 6w. The RLF has completed the
following loan activities:
Economic Impact Summary as of September 30th, 2014
Classification:
Business Type:
Number of Loans Closed:
Loan Amounts:
Private Dollars Leveraged:
Public Dollars Leveraged:
Owner Equity:

#1d
ACTION MEMO
TO: UMVRDC Commissioners FROM: Dawn Hegland DATE: October 28, 2014 RE: Christmas Office Closure Christmas Day falls on a Thursday this year. Employees have indicated an interest in taking Friday off as a vacation day. I believe our office could be closed without affecting our workload obligations. Please note that we have not scheduled a RDC meeting in December. ACTION REQUESTED: Approve and authorize allowing the office to be closed on Friday, December 26 with all staff taking a vacation day.

#1e
ACTION MEMO
TO: UMVRDC Commissioners
FROM: Jacki Anderson, Senior Planner
DATE: October 28, 2014
RE: Center for Small Towns (CST) Interns
Each year staff identify opportunities for interns to participate in the work of the RDC
and assist our local units of government. Typically, each year we apply to the Center of
Small Towns for different projects and pay nominal fee for having the interns work with
us.
This year the project is to develop a portfolio of case studies that 1) outline financing
structures for community pools and identified is playgrounds and 2) provide examples of
ordinances and community efforts that address dilapidated housing and commercial
properties. Our application for an intern was approved. The folks at CST liked our
project idea so much that they have offered us two interns for the price of one. They feel
that the resulting portfolio could benefit many communities. It’s anticipated that the
portfolio will be available for review by the end of December.
To reflect the cost of the intern we need to retroactively adjust the UMVRDC budget.
The cost for one intern to work on this project is approximately $600. The only
foreseeable additional expense would be mileage if they were to come to the UMVRDC
for a final presentation.
ACTION REQUESTED:
Retroactively increase the budget by $600 which increases the FY15 expenses from
$1,084,733 to $1,085,333 as of October 1st, 2014.

#1f
INFORMATION MEMO
TO: Upper MN Valley RDC Commissioners FROM: Kristi Fernholz DATE: October 28, 2014 RE: Bush Foundation Community Creativity Cohort Grant The UMVRDC submitted a grant application to the Bush Foundation to be considered for the Community Creativity Cohort Program. The Community Creativity Cohort is a one-time program designed to both recognize and learn from exemplary organizations that meaningfully engage people in the arts and integrate the arts into public life. The Community Creativity Cohort will inform the Foundation's future work in the arts. The Community Creativity Cohort will consist of at least 10 organizations with a proven record of working to meaningfully engage people in the arts and integrate the arts into public life. Each selected organization will receive an unrestricted grant of $100,000 and work with the Bush Foundation over a six- to nine-month period to develop a deeper understanding of key challenges associated with their work, specifically efforts to engage the community, build and support leadership, and advance racial and economic equity. This is a one-time program that will inform the Foundation's future work in the arts. The Cohort will be announced in February 2015. ACTION REQUESTED: Approval of the authorization of the executive director’s signature on the grant application and documents to the Bush Foundation.

#2a
INFORMATION MEMO TO: UMVRDC Commissioners FROM: Kristi Fernholz, Arlene Tilbury, Melissa Carruth, Randy Larson, Emily Zandt,
Erin Smith & Lindsey Knutson DATE: October 28, 2014 RE: Planner Update In an effort to update the Commission on projects, staff has prepared the following brief summary of current projects.
Contracts: Canby Zoning Ordinance Update – Lindsey and Erin The next section of commercial, industrial and overlay districts were sent to Canby for review. A meeting is being scheduled to go over those sections with them in more detail.
Appleton Technical Assistance – Jacki and Erin The Small Cities Development Program (SCDP) applications will be due November 13th; we received a great showing for the community wide survey and we are currently compiling the data. Montevideo Arts Project (MAP) – Kristi MAP met October 7th to review the Request for Qualifications from 6 artists. The group chose three from which to develop a design concept and full budget. Milan Housing – Kristi Kristi is working in Milan to determine if the Micronesian community is interested in homeownership and, if so, to see what the city can do to help them. Dawson Sidewalk Plan – Lindsey and Emily After gathering the initial data, Lindsey and Emily are working on an ArcGIS model to prioritize sidewalk segments to present to Dawson’s sidewalk plan committee. We are currently looking at which attributes will provide the most useful information for the analysis. After the committee provides feedback on the priority sidewalk network, the committee and UMVRDC staff will work to solicit public input on the network. Federated Broadband Contract – Jacki and Erin Jacki and Erin worked to submit two broadband applications in a partnership with Federated Telephone Cooperative for the Border to Border program. The applications were submitted for Big Stone and Swift counties. The applications had a very quick turnaround time- less than 30 days! The awards will be made late December. Bellingham City Website Update – Emily and Kristi The Bellingham City Council signed a contract for the RDC to update their city website. Emily will be completing these updates over the next month.

Program Updates: Meander – Kristi Meander 2014 has come and gone! Preliminary reports are great so far. We will share economic impact data as soon as it is compiled. We are already preparing for 2015! Revolving Loan Fund – Randy As of September 30th, about $224,908 is available for lending. I have been meeting with lenders in the region to see if they may have any leads on any potential new projects that the RLF could be involved in. Minnesota River Valley National Scenic Byway (MRVSB) - Kristi We are continuing work on the Byway website and survey for potential projects to incorporate into the Corridor Management Plan. Prairie Waters Regional Tourism – Melissa and Kristi The new Prairie Waters website is in progress and is expected to be completed the end of October. The main functionality of the site is built, so now we are working on populating the pages with content and photos. Bids were sent out for the Prairie Waters visitor guides that are redone every two years. Thus far, only one proposal has been received from Itineraries, who’ve done the guides in the past. Staff is busy visiting with the cities and counties educating them on the Prairie Waters program and updating them on the 2015 DRAFT work plan. Melissa wrote a grant to Explore Minnesota Tourism for $8,000 towards advertising. Safe Routes to School – Lindsey, Emily, & Erin The Montevideo and Clarkfield Safe Routes to School plans are still in progress. Lindsey and Emily held the third meeting for each school and are working to schedule the final planning meeting before the end of the year. Erin and Emily completed a walking audit at KMS on the 21st of October and in Ortonville on October 28th to assess current conditions and how students are traveling to school. MnDOT has begun three SRTS solicitations: mini-grants to schools, bike fleets, and another infrastructure solicitation.
Hazard Mitigation – Emily and Kristi The second round of task force meetings have been completed for Chippewa, Big Stone and Yellow Medicine Counties and all three counties have scheduled their third meetings. After an analysis and prioritization of the countywide hazard inventory, the third meeting will focus on mitigation strategies. Emily is continuing to work with the cities to obtain community specific information for further analysis within the plan. Transportation – Lindsey The Transportation Alternatives Program (TAP) letter of interest forms are now out and solicitation for this program has begun. Lindsey has been working with several communities in the region to develop applications. Chippewa County is planning to submit an application to help fund the upgrades to curb ramps to make them ADA accessible throughout the county. The City of Montevideo is planning to submit an application to construct a section of sidewalk that goes over the RR tracks downtown (currently the sidewalk just ends for that small section). And the City of Canby is considering TAP funds to reconstruct the trail in their city.
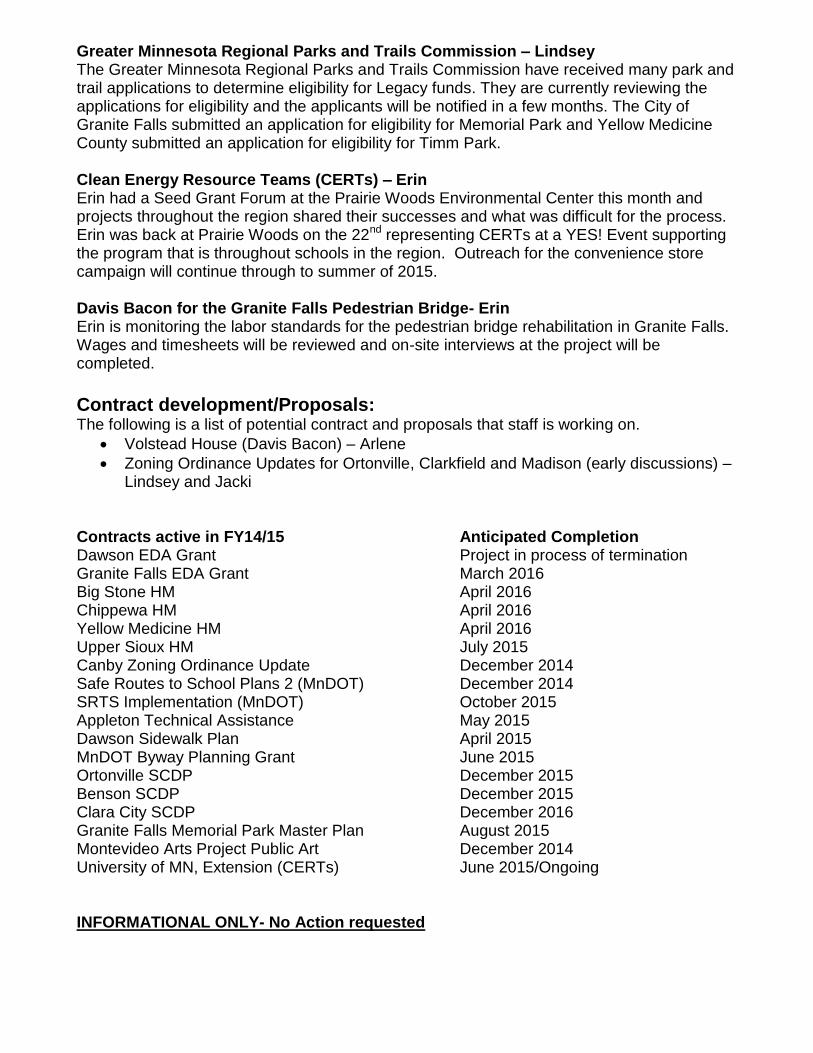
Greater Minnesota Regional Parks and Trails Commission – Lindsey The Greater Minnesota Regional Parks and Trails Commission have received many park and trail applications to determine eligibility for Legacy funds. They are currently reviewing the applications for eligibility and the applicants will be notified in a few months. The City of Granite Falls submitted an application for eligibility for Memorial Park and Yellow Medicine County submitted an application for eligibility for Timm Park. Clean Energy Resource Teams (CERTs) – Erin Erin had a Seed Grant Forum at the Prairie Woods Environmental Center this month and projects throughout the region shared their successes and what was difficult for the process. Erin was back at Prairie Woods on the 22nd representing CERTs at a YES! Event supporting the program that is throughout schools in the region. Outreach for the convenience store campaign will continue through to summer of 2015. Davis Bacon for the Granite Falls Pedestrian Bridge- Erin Erin is monitoring the labor standards for the pedestrian bridge rehabilitation in Granite Falls. Wages and timesheets will be reviewed and on-site interviews at the project will be completed.
Contract development/Proposals: The following is a list of potential contract and proposals that staff is working on.
Volstead House (Davis Bacon) – Arlene
Zoning Ordinance Updates for Ortonville, Clarkfield and Madison (early discussions) – Lindsey and Jacki
Contracts active in FY14/15 Anticipated Completion Dawson EDA Grant Project in process of termination Granite Falls EDA Grant March 2016 Big Stone HM April 2016 Chippewa HM April 2016 Yellow Medicine HM April 2016 Upper Sioux HM July 2015 Canby Zoning Ordinance Update December 2014 Safe Routes to School Plans 2 (MnDOT) December 2014 SRTS Implementation (MnDOT) October 2015 Appleton Technical Assistance May 2015 Dawson Sidewalk Plan April 2015 MnDOT Byway Planning Grant June 2015 Ortonville SCDP December 2015 Benson SCDP December 2015 Clara City SCDP December 2016 Granite Falls Memorial Park Master Plan August 2015 Montevideo Arts Project Public Art December 2014 University of MN, Extension (CERTs) June 2015/Ongoing INFORMATIONAL ONLY- No Action requested
#2b
INFORMATION MEMO TO: UMVRDC Commissioners FROM: Dawn Hegland DATE: October 28, 2014 RE: Director’s Report
In an effort to update the Commission on my activities, I prepared the following brief summary of actions that I am working on.
Attended the EDA Chicago regional conference on Sept 28-30 in Chicago with Jacki and presented on our state association, had a small group meeting with EDA regional directors who was seeking feedback on their regional office and programs, and worked with Jacki to investigate several possible project ideas with EDA regional staff.
Attended the Center for Rural Policy and Development Board meeting and was elected research committee chairperson for the next year (see attached rural research calendar).
Attended the Big Stone and Yellow Medicine County board for an annual RDC marketing visit.
Attended an interview session with the consultant for Swift County’s Strategic Plan
Organized a regional meeting to discuss broadband development and technology sharing in the region.
Submitted a letter of intent to the Blandin Foundation to: 1) assist in the development of a regional broadband feasibility plan, 2) connect IT people in the region to discuss sharing and collaboration, 3) work with economic Development staff, chambers of commerce, Prairie Waters and other interested parties to further develop the online “voice” of our region.
Reviewed options and job descriptions for Sr. Accountant and Transportation Planner positions.
Met with auditors for final exit interview.
Reviewed regional economic profile for the Greater MN Development Strategy (statewide CEDS) the MN RDCs are working on. (see attached)
INFORMATIONAL ONLY- No Action requested
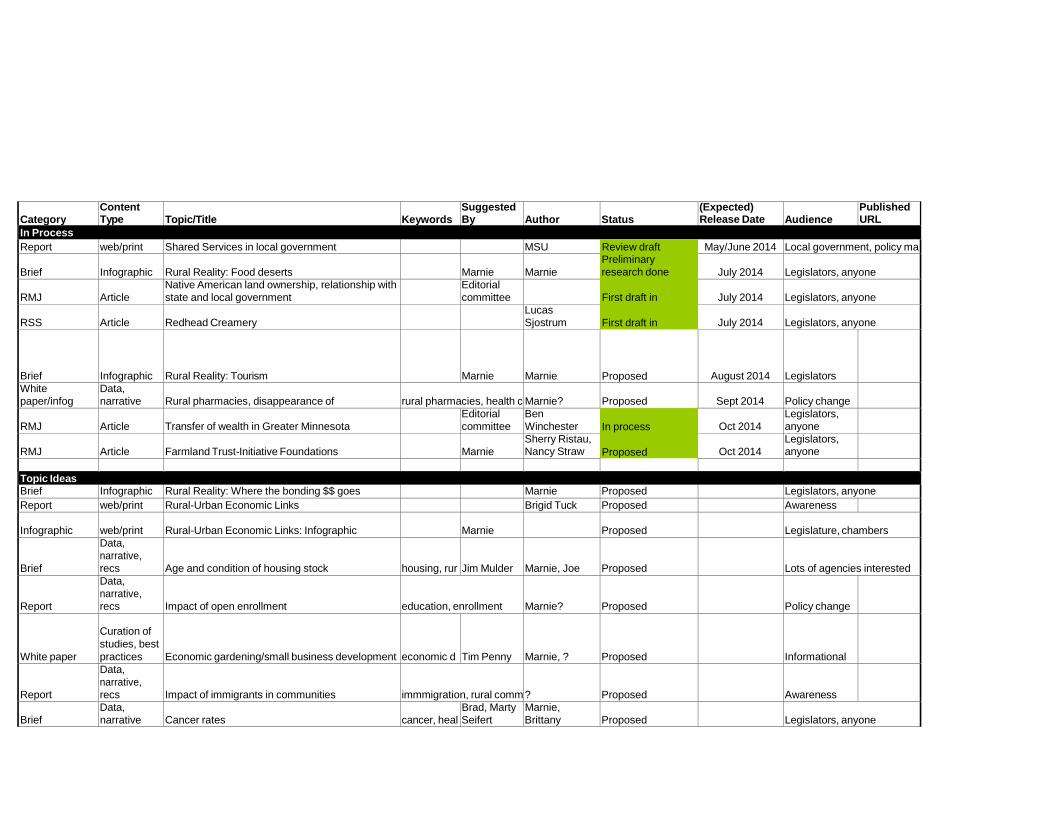
Category Content Type
Topic/Title
Keywords Suggested By
Author
Status (Expected) Release Date
Audience Published URL
In Process
Report web/print Shared Services in local government MSU Review draft Preliminary
research done
First draft in
First draft in
May/June 2014 Local government, policy ma
Brief
Infographic
Rural Reality: Food deserts
Marnie
Marnie
July 2014
Legislators, anyone
RMJ
Article
Native American land ownership, relationship with
state and local government Editorial
committee
July 2014
Legislators, anyone
RSS
Article
Redhead Creamery Lucas
Sjostrum
July 2014
Legislators, anyone
Brief
Infographic
Rural Reality: Tourism
Marnie
Marnie
Proposed
August 2014
Legislators
White
paper/infog
Data,
narrative
Rural pharmacies, disappearance of
rural pharmacies, health c
Marnie?
Proposed
Sept 2014
Policy change
RMJ
Article
Transfer of wealth in Greater Minnesota Editorial
committee
Ben
Winchester In process
Proposed
Oct 2014
Legislators,
anyone
RMJ
Article
Farmland Trust-Initiative Foundations
Marnie
Sherry Ristau, Nancy Straw
Oct 2014
Legislators, anyone
Topic Ideas Brief Infographic Rural Reality: Where the bonding $$ goes Marnie Proposed Legislators, anyone
Report web/print Rural-Urban Economic Links Brigid Tuck Proposed Awareness
Infographic
web/print
Rural-Urban Economic Links: Infographic
Marnie
Proposed
Legislature, chambers
Brief
Data,
narrative,
recs
Age and condition of housing stock
housing, rur
Jim Mulder
Marnie, Joe
Proposed
Lots of agencies interested
Report
Data,
narrative,
recs
Impact of open enrollment
education, enrollment
Marnie?
Proposed
Policy change
White paper
Curation of
studies, best
practices
Economic gardening/small business development
economic d
Tim Penny
Marnie, ?
Proposed
Informational
Report
Data,
narrative,
recs
Impact of immigrants in communities
immmigration, rural comm
?
Proposed
Awareness
Brief
Data,
narrative
Cancer rates
cancer, heal
Brad, Marty
Seifert
Marnie,
Brittany
Proposed
Legislators, anyone
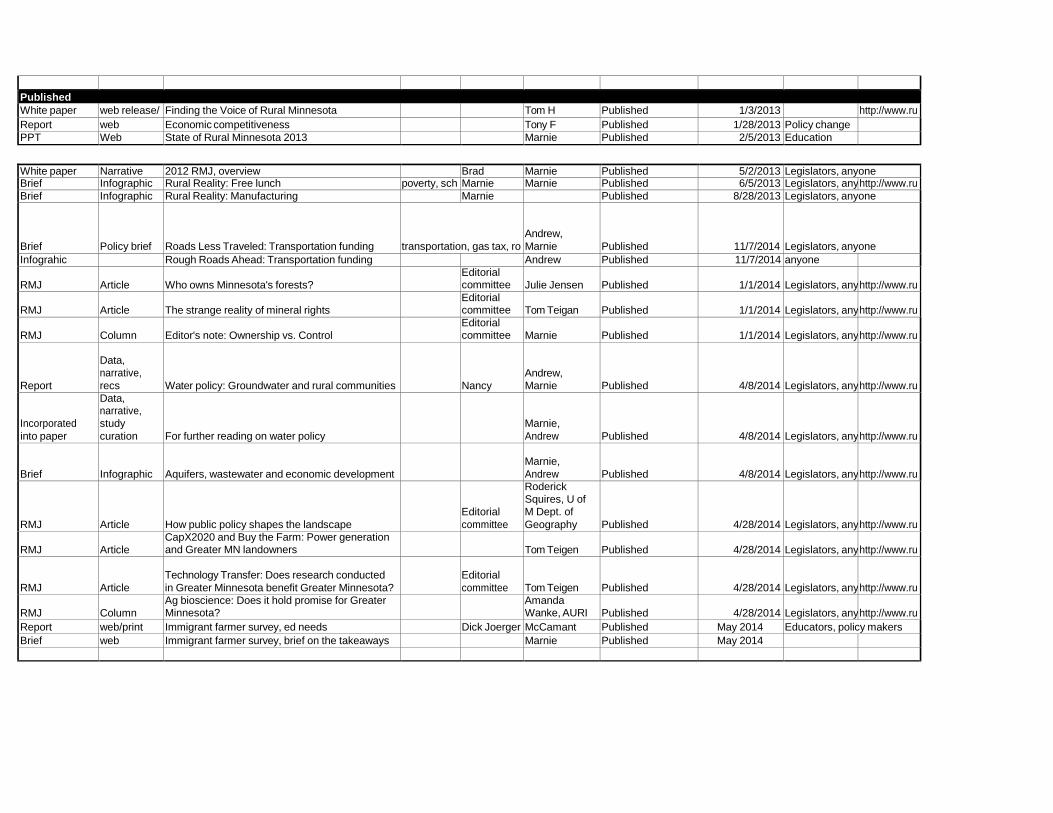
Published
White paper web release/ Finding the Voice of Rural Minnesota Tom H Published 1/3/2013 http://www.ru
Report web Economic competitiveness Tony F Published 1/28/2013 Policy change PPT Web State of Rural Minnesota 2013 Marnie Published 2/5/2013 Education
White paper Narrative 2012 RMJ, overview Brad Marnie Published 5/2/2013 Legislators, anyone Brief Infographic Rural Reality: Free lunch poverty, sch Marnie Marnie Published 6/5/2013 Legislators, any http://www.ru
Brief Infographic Rural Reality: Manufacturing Marnie Published 8/28/2013 Legislators, anyone
Brief
Policy brief
Roads Less Traveled: Transportation funding
transportation, gas tax, ro
Andrew,
Marnie
Published
11/7/2014
Legislators, anyone
Infograhic Rough Roads Ahead: Transportation funding Andrew Published 11/7/2014 anyone
RMJ
Article
Who owns Minnesota's forests? Editorial
committee
Julie Jensen
Published
1/1/2014
Legislators, any
http://www.ru
RMJ
Article
The strange reality of mineral rights Editorial
committee
Tom Teigan
Published
1/1/2014
Legislators, any
http://www.ru
RMJ
Column
Editor's note: Ownership vs. Control Editorial
committee
Marnie
Published
1/1/2014
Legislators, any
http://www.ru
Report
Data,
narrative,
recs
Water policy: Groundwater and rural communities
Nancy
Andrew,
Marnie
Published
4/8/2014
Legislators, any
http://www.ru
Incorporated
into paper
Data, narrative,
study
curation
For further reading on water policy
Marnie,
Andrew
Published
4/8/2014
Legislators, any
http://www.ru
Brief
Infographic
Aquifers, wastewater and economic development
Marnie,
Andrew
Published
4/8/2014
Legislators, any
http://www.ru
RMJ
Article
How public policy shapes the landscape
Editorial
committee
Roderick
Squires, U of
M Dept. of
Geography
Published
4/28/2014
Legislators, any
http://www.ru
RMJ
Article
CapX2020 and Buy the Farm: Power generation and Greater MN landowners
Tom Teigen
Published
4/28/2014
Legislators, any
http://www.ru
RMJ
Article
Technology Transfer: Does research conducted
in Greater Minnesota benefit Greater Minnesota?
Editorial
committee
Tom Teigen
Published
4/28/2014
Legislators, any
http://www.ru
RMJ
Column
Ag bioscience: Does it hold promise for Greater Minnesota?
Amanda Wanke, AURI
Published
4/28/2014
Legislators, any
http://www.ru
Report web/print Immigrant farmer survey, ed needs Dick Joerger McCamant Published May 2014 Educators, policy makers
Brief web Immigrant farmer survey, brief on the takeaways Marnie Published May 2014

EXTENSION CENTER FOR COMMUNITY VITALITY
Economic Composition of Upper Minnesota Valley: Industries and Performance
Authored by Brigid Tuck with assistance of Neil Linscheid and Ryan Pesch


ECONOMIC COMPOSITION: UPPER MINNESOTA VALLEY i
Presented in partnership with the EDA Center at the University of Minnesota, Crookston
Economic Composition of Upper Minnesota Valley: Industries and Performance OCTOBER 2014 Authored by: Brigid Tuck, Senior Economic Impact Analyst Assistance from: Neil Linscheid, Extension Educator in Southwest Minnesota Ryan Pesch, Extension Educator in West Central Minnesota Editors: Joyce Hoelting, Assistant Director, University of Minnesota Extension Center for Community Vitality Matt Kane, Program Leader, University of Minnesota Extension Center for Community Vitality
© 2014 Regents of the University of Minnesota. All rights reserved. University of Minnesota Extension is an equal opportunity educator and employer. In accordance with the Americans with Disabilities Act, this material is available in alternative formats upon request. Direct requests to 612‐625‐8233.
Printed on recycled and recyclable paper with at least 10 percent postconsumer waste material.
ECONOMIC COMPOSITION: UPPER MINNESOTA VALLEY ii
Table of Contents 1. KEY FINDINGS 1 Regional Strengths 1 Regional Concerns 1 2. STUDY BACKGROUND AND OVERVIEW OF THE UPPER MINNESOTA VALLEY REGION 2 3. INDUSTRY OUTPUT 3 4. EMPLOYMENT AND WAGES 5 Employment and Wages by Industry 8 Agriculture 9 Government and Government‐Owned Industries 9 Trade 9 Construction 10 5. LOCAL INTERDEPENDENCIES 10 Agriculture 10 Manufacturing 11 6. METHODOLOGY, DATA, AND SOURCES 12 Shift‐Share Analysis 13 Location Quotients 13 7. OTHER DATA RESOURCES 14

ECONOMIC COMPOSITION: UPPER MINNESOTA VALLEY 1
ECONOMIC COMPOSITION OF UPPER MINNESOTA VALLEY: KEY FINDINGS
To analyze the economic composition of the Upper Minnesota Valley region, University of Minnesota Extension conducted an analysis of industry outputs, employment and wages, and interdependencies. Following is a report of key findings. This report is presented in partnership with the EDA Center at the University of Minnesota, Crookston.
Agriculture is a primary driver of the Upper Minnesota Valley region’s economy. Trade, manufacturing, and government are other important components of the economy. Agriculture has been a strong industry in recent years, putting the Upper Minnesota Valley in a competitive position. A caution - as of the time of this publication, predictions were for relatively low grain prices for the 2014 harvest. This could significantly impact the strength of the agricultural industry.
REGIONAL STRENGTHS:
Agriculture. Agriculture is the largest industry in the region – measured by both employment and output. Corn, soybeans, and hogs contribute the highest shares of output. The agriculture industry has added jobs over the past 10 years and at rates faster than expected given national and industry trends. Manufacturing in the region is closely tied to agriculture; the largest manufacturing sectors include poultry processing, cheese manufacturing, and oilseed processing.
Construction. As an individual sector, construction is the third largest source of output. Construction jobs in the region have been on the rise and at a competitive rate. Construction companies in the Upper Minnesota Valley region added jobs despite the Great Recession. Job gains were recorded in the construction sectors of industrial building; commercial and institutional building; and heavy and civil engineering construction.
Wholesale trade. Wholesale trade added jobs in the region at a pace faster than national and industry trends. Wages are relatively strong and have grown faster than wages in other industries. Wholesale trade activity is distributed across the region.
REGIONAL CONCERNS:
The analysis also revealed areas of potential concern for the region from an economic standpoint. Areas of regional concern may warrant additional attention and understanding.
Employment. The total number of jobs in the Upper Minnesota Valley region peaked in 2008 at 18,871 jobs. Since then, the number of jobs in the region has declined. While most of Minnesota experienced job losses due to the Great Recession, most regions have recovered and are adding jobs. The Upper Minnesota Valley region is not following this trend.
Health care. While the health care and social assistance industry posted 175 new jobs in the region, national and industry trends indicate it should have added 436 jobs.
ECONOMIC COMPOSITION: UPPER MINNESOTA VALLEY 2
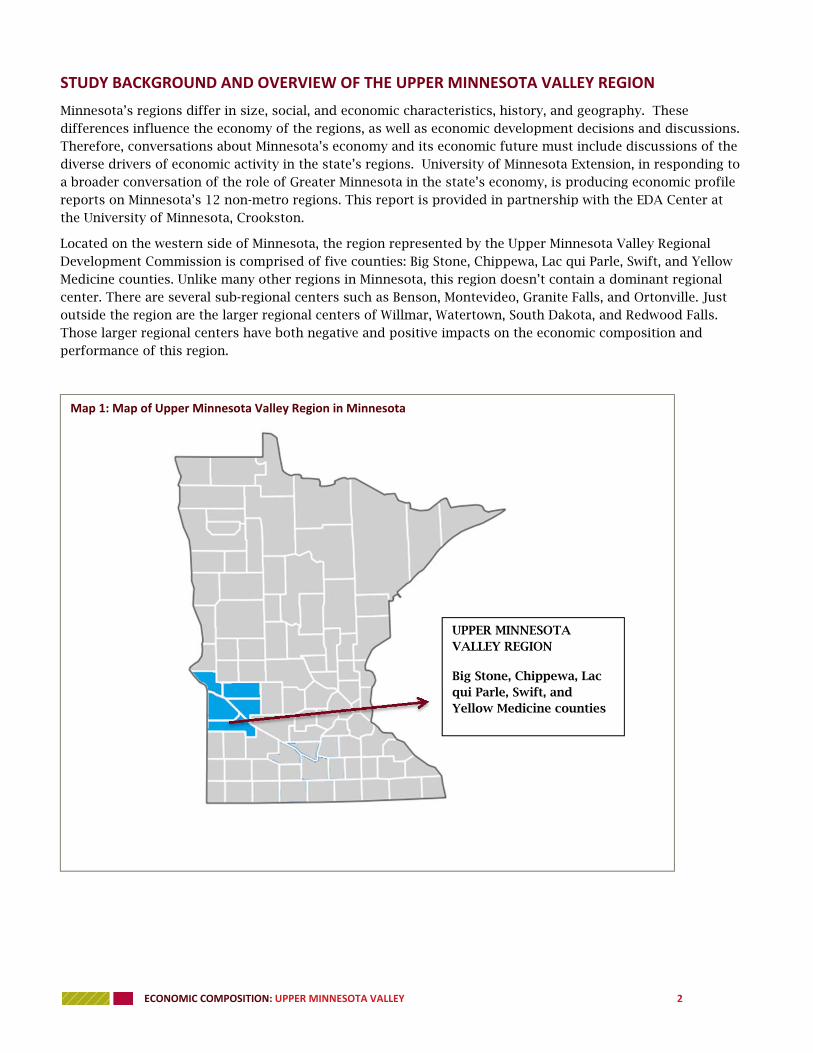
STUDY BACKGROUND AND OVERVIEW OF THE UPPER MINNESOTA VALLEY REGION
Minnesota’s regions differ in size, social, and economic characteristics, history, and geography. These differences influence the economy of the regions, as well as economic development decisions and discussions. Therefore, conversations about Minnesota’s economy and its economic future must include discussions of the diverse drivers of economic activity in the state’s regions. University of Minnesota Extension, in responding to a broader conversation of the role of Greater Minnesota in the state’s economy, is producing economic profile reports on Minnesota’s 12 non-metro regions. This report is provided in partnership with the EDA Center at the University of Minnesota, Crookston.
Located on the western side of Minnesota, the region represented by the Upper Minnesota Valley Regional Development Commission is comprised of five counties: Big Stone, Chippewa, Lac qui Parle, Swift, and Yellow Medicine counties. Unlike many other regions in Minnesota, this region doesn’t contain a dominant regional center. There are several sub-regional centers such as Benson, Montevideo, Granite Falls, and Ortonville. Just outside the region are the larger regional centers of Willmar, Watertown, South Dakota, and Redwood Falls. Those larger regional centers have both negative and positive impacts on the economic composition and performance of this region.
Map 1: Map of Upper Minnesota Valley Region in Minnesota
UPPER MINNESOTA VALLEY REGION
Big Stone, Chippewa, Lac qui Parle, Swift, and Yellow Medicine counties

ECONOMIC COMPOSITION: UPPER MINNESOTA VALLEY 3
The goals of the report are to 1) identify the region’s strengths – both industries that are the current core of the economy and emerging industries – and 2) identify concerns for the region. Regional concerns focus on industries that may be underperforming or declining.
To ascertain which industries are regional strengths and which are potential regional concerns, this report draws from industry outputs, employment, and wage data. The first section looks at output. Output measures the value of sales by industry. Studying output by industry provides perspective on which industries are driving the highest sales in the region. The second section details employment. Studying employment by industry identifies the industries that employ the highest number of people in the region. The employment section of this report also discusses wages. The third section of this report looks at economic interdependencies. Examining how sectors interact and connect with each other can provide powerful insights into an economy.
INDUSTRY OUTPUT
Output is an important factor to consider when assessing the economic composition of a specific geography. Output provides information about the economic activity of a region and also is directly tied to employment.
In 2012, businesses and industries in the Upper Minnesota Valley region produced $5.1 billion in goods and services, according to estimates from the IMPLAN economic model. Output in the Upper Minnesota Valley region accounts for less than 1 percent of Minnesota’s $567.8 billion economy and 2 percent of Greater Minnesota’s $218.8 billion economy. The Upper Minnesota Valley region is home to five of Minnesota’s 87 counties. The agriculture, forestry, fishing, and hunting industry produced 28 percent of output in the region. Manufacturing generated 23 percent of output and professional and business services generated 14 percent of output.
0.0%
5.0%
10.0%
15.0%
20.0%
25.0%
30.0%
Percent of To
tal O
utput
Chart 1: Industry Share of Total Output Upper Minnesota Valley
Source: IMPLAN

ECONOMIC COMPOSITION: UPPER MINNESOTA VALLEY 4
Chart 1 shows output by major industry category which helps frame discussions about output in the region. However, examining output by sector can be valuable too. Sectors are a more refined level of analysis because individual sectors form industries. For example, crop production and animal production are sectors within the industry of agriculture.
Beyond the major industry categories, the top ten sectors in the Upper Minnesota Valley region produce an
estimated $3.6 billion of output (table 1). The crop farming, food product manufacturing, and construction sectors are the top generators of output. Within the crop farming sector, grain farming produces $703.0 million of output and oilseed farming produces $329.7 million in output. Within food product manufacturing, poultry processing produces $121.5 million of output; cheese manufacturing produces $109.6 million of output; and soybean and oilseed processing $95.6 million. In the construction sector, construction of other new non-residential structures produces $107.2 million of output.
Output is measured in dollars. Therefore, the price of the good or service sold affects total output. Agricultural prices, particularly grain and oilseed prices, have been strong in recent years. As of the writing of this publication, grain prices for the 2014 grain harvest are predicted to be low -- perhaps even below cost of production. Low grain prices and potential farm losses could significantly impact the agricultural sector and the region.
For the majority of the sectors in table 1, high output is driven by high productivity (output per worker). Each food product manufacturing employee produces an estimated $712,000 in output annually. The clear exception in the table is government and government-owned enterprises. Government output is linked primarily to the number of employees. Output is not a very adequate measure for the government sector, as government does not make sales in the traditional sense of other industries. Output per worker is often lower for service or labor intensive industries, as it takes more workers to produce output.
The industries with the lowest output per worker in the region include private households (households providing services to other households, such as cleaning) and civic, social, professional, and similar organizations. Since the model measures one job as one job, these two industries, which have relatively high part-time employment, likely have lower output per worker because a significant share of the workers are working less than full-time.

ECONOMIC COMPOSITION: UPPER MINNESOTA VALLEY 5
Table 1: Top Ten Sectors in the Upper Minnesota Valley Region, Sorted by Output
Sector Total Output (millions) Output per Worker
Crop farming $1,134.1 $257,800
Food product manufacturing $429.3 $712,150
Construction $322.4 $151,000
Government and government-owned enterprises $313.6
$58,000
Livestock $285.3 $294,350
Machinery manufacturing $278.0 $471,100
Real estate $263.7 $750,400
Wholesale trade $259.7 $185,400
Monetary authorities $190.0 $407,300
Utilities $166.8 $668,400
Top ten total $3,642.9 (71%)
Total output in region $5,124.4 Source: IMPLAN
EMPLOYMENT AND WAGES
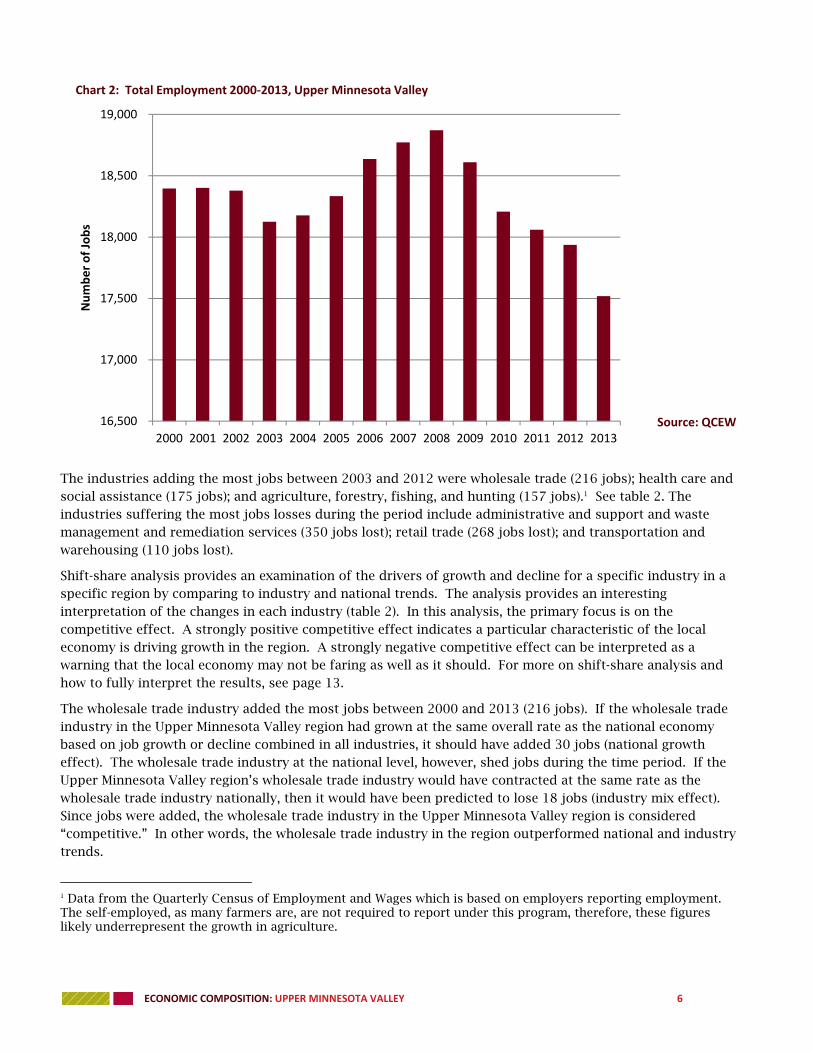
The number of jobs in the Upper Minnesota Valley region is depicted in chart 2. Jobs growth was essentially flat in the region from 2000 to 2002. Employment dropped in 2003 but began an upward trend in 2004, growing by nearly 750 between 2003 and the peak in 2008. The number of jobs in the region has been dropping since 2008. By 2013, employment was at 17,500, nearly 1,400 jobs below 2008. The 2008-2009 Great Recession hit all regions of Minnesota and most regions experienced a decline in employment between 2008 and 2010. However, most regions have since shown signs of recovery and have added jobs. Employment in the Upper Minnesota Valley region has not followed this trend.
ECONOMIC COMPOSITION: UPPER MINNESOTA VALLEY 6
The industries adding the most jobs between 2003 and 2012 were wholesale trade (216 jobs); health care and social assistance (175 jobs); and agriculture, forestry, fishing, and hunting (157 jobs).1 See table 2. The industries suffering the most jobs losses during the period include administrative and support and waste management and remediation services (350 jobs lost); retail trade (268 jobs lost); and transportation and warehousing (110 jobs lost).
Shift-share analysis provides an examination of the drivers of growth and decline for a specific industry in a specific region by comparing to industry and national trends. The analysis provides an interesting interpretation of the changes in each industry (table 2). In this analysis, the primary focus is on the competitive effect. A strongly positive competitive effect indicates a particular characteristic of the local economy is driving growth in the region. A strongly negative competitive effect can be interpreted as a warning that the local economy may not be faring as well as it should. For more on shift-share analysis and how to fully interpret the results, see page 13.
The wholesale trade industry added the most jobs between 2000 and 2013 (216 jobs). If the wholesale trade industry in the Upper Minnesota Valley region had grown at the same overall rate as the national economy based on job growth or decline combined in all industries, it should have added 30 jobs (national growth effect). The wholesale trade industry at the national level, however, shed jobs during the time period. If the Upper Minnesota Valley region’s wholesale trade industry would have contracted at the same rate as the wholesale trade industry nationally, then it would have been predicted to lose 18 jobs (industry mix effect). Since jobs were added, the wholesale trade industry in the Upper Minnesota Valley region is considered “competitive.” In other words, the wholesale trade industry in the region outperformed national and industry trends.
1 Data from the Quarterly Census of Employment and Wages which is based on employers reporting employment. The self-employed, as many farmers are, are not required to report under this program, therefore, these figures likely underrepresent the growth in agriculture.
16,500
17,000
17,500
18,000
18,500
19,000
2000 2001 2002 2003 2004 2005 2006 2007 2008 2009 2010 2011 2012 2013
Number of Jobs
Chart 2: Total Employment 2000‐2013, Upper Minnesota Valley
Source: QCEW

ECONOMIC COMPOSITION: UPPER MINNESOTA VALLEY 7
Table 2: Shift‐Share Analysis for Growth and Decline Industries2
Industry Change
2003‐2013 Industry Mix Effect
National Growth
Effect Competitive Effect
Top 3 Job Adding Industries
Wholesale trade 216 (18) 30 204
Health care and social assistance 175 377 59 (261)
Agriculture, forestry, fishing, and hunting
157 0 8 149
Top 3 Job Loss Industries
Administrative and support and waste management and remediation services
(350) 12 17 (379)
Retail trade (268) (72) 63 (259)
Transportation and warehousing (110) 12 15 (137)
Source: EMSI
The health care and social services sector added 175 jobs between 2003 and 2013 in the Upper Minnesota Valley region. However, given the rapid growth in the health care and social assistance industry at the national level, the region should have added 377 jobs (industry mix effect). Given the general employment growth across all industries nationally, the health care and social services industry in the Upper Minnesota Valley region should have added 59 jobs (national growth effect). Therefore, the health care and social services industry in the Upper Minnesota Valley region is not adding jobs as quickly as it national and industry trends would predict. This is a trend that is of note for the region and bears further exploration.
The industry called administrative and support and waste management and remediation services lost 350 jobs between 2003 and 2013. All of these lost jobs were due to the competitive effect. Specifically, all these lost jobs are in the sector of facilities support services. The definition of the sector includes establishments providing private jail services or operating correctional facilities (i.e., jails) on a contract or fee basis. In 2010, a private correctional facility closed in Appleton. The lost jobs here, then, can be attributed to a one-time event and do not necessarily indicate a trend of concern.
The retail trade industry lost 268 jobs in the Upper Minnesota Valley region during the period. While the retail trade industry at the national level contracted during the period, the job losses in the region exceed what would have been expected given those national trends, and therefore, the jobs losses can be considered a result of the Upper Minnesota Valley region being less competitive in the retail trade industry. The majority of the job losses (208) stemmed from gasoline stations. Employment in the retail trade sector of general merchandise stores increased by 27 workers in the time period.
One way to measure the strength of an industry in a region is to consider the location quotient. The location quotient for gasoline stations in the region was 3.2 in 2003, indicating the sector had 3 times as many
2 For an explanation of shift-share analysis, please see the methodology section.

ECONOMIC COMPOSITION: UPPER MINNESOTA VALLEY 8
employees in the region than would be expected given state averages. The loss of 200 jobs reduced the location quotient to 2.4. In comparison, retail trade as a whole, has a location quotient of 0.94 in the Upper Minnesota Valley region, so perhaps the job losses were a correction towards the norm. For more on location quotients and how to interpret them, see page 13.
Employment and Wages by Industry
Employment by industry in the Upper Minnesota Valley region is depicted in chart 3. The highest percentages of employment are in the industry categories of agriculture and forestry, government and government-owned enterprises, trade, and professional and business services.
Agriculture & Forestry18%
Mining0%
Utilities1%
Construction7%
Manufacturing10%
Trade13%Transport & Ware
3%
Professional & Business Services
11%
Health & Social Services
9%
Leisure & Hospitality4%
Other Services7%
Government17%
Chart 3: Employment by Industry: Upper Minnesota Valley
Key things for economic developers to consider from this employment data:
Find ways to support competitive industries. This will likely mean engaging industry leaders to discuss the key drivers of economic advantage in this region.
For some non-competitive industries, it’s important to learn more about the key drivers. Understanding the drivers will assist in determining the best method for addressing the issue. Further discussion may also reveal the trend is due to a one-time change in the region or a natural correction in the economy.
There are potential opportunities for the Upper Minnesota Valley region to grow in areas that may have not traditionally been the region’s strongest industries.
Source: IMPLAN

ECONOMIC COMPOSITION: UPPER MINNESOTA VALLEY 9
Agriculture
At the more detailed, sector level within the agriculture and forestry industry, grain farming is the largest farming activity in the region, employing approximately 54 percent of farmers in the region. Oilseed production is the second largest contributor to the agricultural industry in the region, accounting for 15 percent of the sector’s total employment. Hog production accounts for another 15 percent of agriculture’s employment. Sugar beet production employs an additional 10 percent of farmers. Both crop production and animal production are strengths for the region. Shift-share analysis shows positive gains for competitive share in both industries from 2003-2013.
Location quotients are 3.6 for crop production and 2.5 for animal production. A location quotient over 1.0 indicates the industry has a higher level of employment, or a concentration, as compared to the state. The higher the location quotient is the higher the concentration of employment.
Government and Government-Owned Industries
The second largest employment industry is government and government-owned enterprises. In the IMPLAN model used for this descriptive analysis, all publicly-owned institutions are categorized as government employment, unlike other sources which categorize government employment by the type of activity. Education is a good example here. In the IMPLAN model, all K-12 public education is included in the government industry, while other data sources would categorize it in the education industry. Government and government-owned enterprises also includes tribal government; government-owned enterprises that are run as independent businesses (such as municipal liquor stores); and public higher education institutions. In the Upper Minnesota Valley region, the sector called “state and local government – education” employs 52 percent of all government workers. The sector called “state and local government – non-education” employs 35 percent of all government workers. During the 2003 to 2013 time period, state and federal government decreased the number of employees in the region. Local government employment increased slightly.
Trade
The third largest employment sector in the Upper Minnesota Valley region is trade. Trade is comprised of two main sectors – wholesale trade and retail trade. As discussed above, wholesale trade has been a strong sector in the regional economy. Wholesale trade employment grew during the time period and at a competitive rate. Wholesale trade accounts for 40 percent of all trade jobs in the region. Wages in the wholesale trade industry in the region have grown steadily since 2000, except for a small dip in 2010. Overall, between 2000 and 2013 wages rose by 20 percent - from an inflation-adjusted $780 per week in 2000 to $939 in 2013. The average weekly wage across all industries in the region is $636 and rose by 11 percent (adjusted for inflation) during the same period. Thus, the wholesale trade industry has an average weekly wage in the Upper Minnesota Valley region of more than $300 above the average, and wage growth has been strong.
Wholesale trade employment is fairly evenly distributed across the five counties in the Upper Minnesota Valley region. Swift County’s wholesale trade industry employs approximately 30 percent of the workers and represents the largest share of employment. Big Stone County’s wholesale trade industry employs approximately 10 percent of all the workers and represents the smallest share of employment. In 2013, average weekly wages in the wholesale trade industry were highest in Big Stone County ($1,234) and lowest in Lac qui Parle County ($764).
Retail trade accounts for 60 percent of all trade jobs in the region. Swift County has the highest number of jobs in retail trade (678), while Big Stone County has the least number of jobs (181). The average weekly wage in the retail trade sector in the region is $367. Wages in the region were relatively stagnant, growing only by an inflation-adjusted four percent between 2000 and 2013. The highest average weekly wage is $424 in Lac qui Parle County and the lowest wage was $305 in Swift County.

ECONOMIC COMPOSITION: UPPER MINNESOTA VALLEY 10
As discussed above, employment in the retail trade sector declined over the time period by 268 jobs. All five counties in the Upper Minnesota Valley region lost retail trade jobs between 2000 and 2013. Swift County lost 137 jobs representing a 44 percent decline in retail jobs. Lac qui Parle County lost 85 jobs, a 38 percent decline.
Construction
Construction constitutes seven percent of all jobs in the region and creates just over six percent of total output. It is worth flagging construction though because 1) as an individual sector, construction is the third largest source of output and 2) construction jobs in the region have been on the rise and at a competitive rate. The construction industry on the national level suffered during the Great Recession and shed jobs. Construction companies in the Upper Minnesota Valley region, however, added jobs during the time period. Specifically, job gains were recorded in the construction sectors of industrial building, commercial and institutional buildings, and heavy and civil engineering construction. High prices (and profits) for grain and oilseed producers in recent years has fueled on-farm construction projects.
LOCAL INTERDEPENDENCIES
Beyond studying basic structure, examining how sectors interact with each other can provide powerful insights into an economy. Input-output models have been developed to estimate how sectors connect within a region. This section of the report will examine the two main drivers of the Upper Minnesota Valley economy (agriculture and manufacturing) and their connections with other sectors. Specifically, the analysis will focus on 1) grain farming and 2) poultry processing, which are the two largest sectors within their respective industries as measured by output.
Multipliers include both indirect and induced effects. Indirect effects are generated when a firm purchases inputs (goods and services) from other business establishments, which in turn purchase the goods and services needed for their output. These are often referred to as supply chain effects. Induced effects are generated when employees of an industry spend their wages. The discussion here focuses on indirect effects.
Multipliers are driven by the amount of purchases a sector makes from other sectors. Understanding what inputs are necessary for the production of a good or service and the extent to which those inputs are produced locally can provide insights into the potential for economic development from the sector.
Agriculture
Output multipliers for the agricultural sectors in the Upper Minnesota Valley region are estimated to range from 1.2 to 1.5. In other words, for every dollar of output generated by the sector (corn farming, for example), $0.20 to $0.50 cents are generated in other regional sectors that supply that sector.
Table 3: Top Purchases by Grain Farming in the Upper Minnesota Valley Region, Percent of Total Expenditures, and Local
Availability

ECONOMIC COMPOSITION: UPPER MINNESOTA VALLEY 11
Input Percent of Input Expenditures
More than 50% of Demand Available from Suppliers within the Upper Minnesota Valley
Region Real estate 11% Yes
Fertilizer 10% No
Agricultural support services 10% No
Petroleum products 8% No
Banks 8% Yes
Grains 8% Yes
Pesticides and other chemicals 7% No
Wholesale trade 3% Yes
Maintenance and repair of buildings 1% Yes
Truck transportation 1% Yes
Source: IMPLAN
Table 3 highlights expenditures by grain farm operations. For every dollar spent on inputs, grain farm operations are estimated to spend 11 percent on real estate (land), 10 percent on fertilizer, and 10 percent on agricultural support services. Land is a fixed commodity, so all demand is satisfied locally. However, the region does not produce fertilizer or agricultural support services in high enough quantities to satisfy the local demand. Therefore, grain farm operations are importing those items from elsewhere.
Table 3 helps illustrate two points. First, grain farm operations are important sources of local demand for real estate (land), banking institutions, other grain operators (seed suppliers), and wholesale trade operations.3 These industries and sectors with strong connections to grain farming are the top industries capturing the 20 to 50 cents of additional economic activity that flows from every dollar of agricultural output mentioned above. Second, there may be opportunities for increased local production of fertilizer, agricultural support services, and pesticides, because grain farmers are purchasing significant levels of these outputs from outside the region. Pursuing economic development based on possible opportunities for supply chain development is one economic development approach. However, before moving forward, decision-makers should 1) take a scan of the industry, as it could be that the suppliers are located just outside the region as defined for this study and therefore considered local, and 2) explore the reasons for the current industry location, as location decisions are based on a broad variety of factors including proximity to supplies and transportation routes.
Manufacturing
Multipliers for food product manufacturing sectors are estimated to range from 1.2 to 1.7. Manufacturing multipliers are often higher than agriculture, particularly if they use an agricultural product in their manufacturing process. Table 4 shows the top inputs purchased locally by poultry processing facilities, the percent of total input expenditures spent on the item, and the local availability of the item.
3 Local here is the Upper Minnesota Valley region.

ECONOMIC COMPOSITION: UPPER MINNESOTA VALLEY 12
Poultry processing facilities are important sources of local demand for poultry and egg producers, wholesale trade, and truck transportation.4 These industries and sectors with strong connections to poultry processing are the top industries capturing the 20 to 70 cents of additional economic activity that flows from every dollar of food manufacturing mentioned above. Second, there may be opportunities for increased local production of paperboard and coated paper bags, because poultry processors are purchasing significant amounts of these outputs from outside the region.
Table 4: Top Purchases by Poultry Processing Facilities in the Upper Minnesota Valley Region, Percent of Total
Expenditures, and Local Availability
Input Percent of Input Expenditures
More than 50% of Demand Available from Suppliers within the Upper
Minnesota Valley Region Poultry and egg products 30% Yes
Processed poultry meat products 17% Yes
Management of companies and enterprises 8% No
Wholesale trade 3% Yes
Truck transportation 3% Yes
Processed animal meat and rendering 2% Yes
Paperboard containers 2% No
Banks 2% Yes
Electricity and distribution services 2% Yes
All other paper bag and coated and treated paper bags
1% No
Source: IMPLAN
These two examples (grain farming and poultry processing) demonstrate the importance of economic interdependencies and interactions in the region. In general, industries that purchase from local suppliers tend to have higher economic impacts in the region.
METHODOLOGY, DATA, AND SOURCES
This report presents the economic characteristics of the region and an analysis of industries, income and employment. Three data sources were accessed in the preparation of the report. One data source is the IMPLAN database. IMPLAN is an input-output model developed by MIG, Inc. The database compiles a variety of sources to provide data on output, employment, and labor income by county for 440 economic sectors. A second data source is the Quarterly Census of Employment and Wages (QCEW) data provided by the Minnesota Department of Employment and Economic Development. This data is used, when necessary, to compliment or clarify the IMPLAN data. Finally, data from Economic Modeling Specialists International (EMSI) is presented in this report. The EMSI data in this report is derived from QCEW data; however, EMSI provides simple tools for performing calculations, such as shift-share analysis, on the data.
4 Local here is the Upper Minnesota Valley region.

ECONOMIC COMPOSITION: UPPER MINNESOTA VALLEY 13
The Regional Development Commission boundaries were used for this study’s definition of Upper Minnesota Valley. The North American Industry Classification System (NAICS) code was used in the study. The NAICS is the standard used by federal statistical agencies in classifying business establishments for the purpose of collecting, analyzing, and publishing statistical data related to the U.S. business economy. This was used to enable uniformity and also for easy data accessibility.
Finally, data was analyzed with input from Extension Educators in the region and findings were compiled into the report.
Shift‐Share Analysis
The results of shift-share analysis are presented in this report. Shift-share analysis is a powerful tool for understanding the drivers of economic change in an industry. Shift-share analysis parses economic change (here employment changes) into three components: national growth, industrial mix, and competitive share.
National Growth: National growth indicates how many jobs a local economy would have gained (or lost) as a result of the growth (or decline) of employment at the national level. For example, consider a local economy with 100,000 jobs at the beginning of the time period. If during the period under consideration, the number of jobs in the United States grew by a rate of 2 percent, then at the end of the time period under consideration, the local economy would be expected to have 102,000 jobs.
Industrial Mix: Industrial mix indicates how many jobs a particular industry within the local economy would have gained (or lost) if the local industry grew (or declined) at a rate similar to the industry as a whole in the United States. For example, if 1,000 people were employed in the finance industry in the local economy at the beginning of the period, and the finance industry as a whole in the U.S. grew at a rate of 10 percent, then at the end of the time period under consideration, the local finance industry would be expected to have 1,100 jobs.
Competitive Share: Competitive share is the remainder of change in employment for the region examined. From our example, region’s employment should have grown by 2,100 jobs, looking at overall national growth and then growth in the finance industry itself. If the local economy actually grew by 3,100 jobs in the finance industry, then 1,000 jobs were added because the local economy grew faster than expected, given national and industry trends. Conversely, if the local economy grew by only 1,000 jobs, then the economy was not as competitive as it should have been, given national and industry trends.
Percent Competitive Share: This is the percent of total jobs that are sourced from competitive share. A competitive share of 80 percent would indicate that 80 percent of the jobs during the time period were derived from the competitive share, rather than from national and industry trends.
Location Quotients
This analysis reports the location quotient for certain industries. Location quotients are used in determining the concentration of a particular industry or sector in a region compared to a larger study area. In this analysis, the location quotient for the region versus the state is reported. If, say, 30 percent of employment in a region is in health care, but at the state only 15 percent of employment is in health care, then the location quotient would be 2.0, indicating that the region has twice as much employment in health care than the state as a whole.
ECONOMIC COMPOSITION: UPPER MINNESOTA VALLEY 14
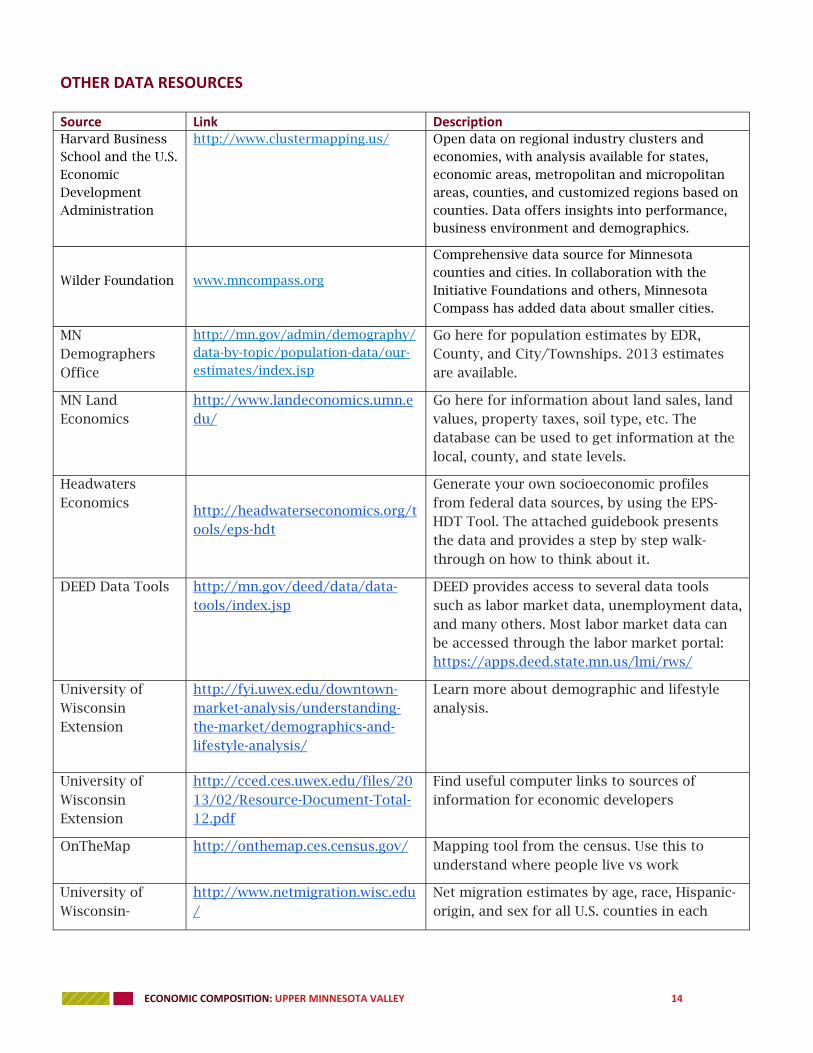
OTHER DATA RESOURCES
Source Link Description Harvard Business School and the U.S. Economic Development Administration
http://www.clustermapping.us/ Open data on regional industry clusters and economies, with analysis available for states, economic areas, metropolitan and micropolitan areas, counties, and customized regions based on counties. Data offers insights into performance, business environment and demographics.
Wilder Foundation
www.mncompass.org
Comprehensive data source for Minnesota counties and cities. In collaboration with the Initiative Foundations and others, Minnesota Compass has added data about smaller cities.
MN Demographers Office
http://mn.gov/admin/demography/data-by-topic/population-data/our-estimates/index.jsp
Go here for population estimates by EDR, County, and City/Townships. 2013 estimates are available.
MN Land Economics
http://www.landeconomics.umn.edu/
Go here for information about land sales, land values, property taxes, soil type, etc. The database can be used to get information at the local, county, and state levels.
Headwaters Economics
http://headwaterseconomics.org/tools/eps-hdt
Generate your own socioeconomic profiles from federal data sources, by using the EPS-HDT Tool. The attached guidebook presents the data and provides a step by step walk-through on how to think about it.
DEED Data Tools
http://mn.gov/deed/data/data-tools/index.jsp
DEED provides access to several data tools such as labor market data, unemployment data, and many others. Most labor market data can be accessed through the labor market portal: https://apps.deed.state.mn.us/lmi/rws/
University of Wisconsin Extension
http://fyi.uwex.edu/downtown-market-analysis/understanding-the-market/demographics-and-lifestyle-analysis/
Learn more about demographic and lifestyle analysis.
University of Wisconsin Extension
http://cced.ces.uwex.edu/files/2013/02/Resource-Document-Total-12.pdf
Find useful computer links to sources of information for economic developers
OnTheMap http://onthemap.ces.census.gov/ Mapping tool from the census. Use this to understand where people live vs work
University of Wisconsin-
http://www.netmigration.wisc.edu/
Net migration estimates by age, race, Hispanic-origin, and sex for all U.S. counties in each

ECONOMIC COMPOSITION: UPPER MINNESOTA VALLEY 15
Madison, Michigan Tech University, University of New Hampshire
decade from 1950 to 2010.

#2C
INFORMATION MEMO
TO: UMVRDC Commissioners
FROM: Jacki Anderson, Senior Planner
DATE: October 28, 2014
RE: EDA Report from Chicago
- New Economic Development Representative (EDR)
We’ve had several over the last few years and it has changed again. Our new contact for
EDA is Lee Shirey. We’ve heard great things about Lee’s ability to help navigate EDA rules
and regulations resulting successful EDA projects. It’s anticipated that in the next year he
will be out to visit our region to get to know us better. Dawn and I started a few
conversations with Lee in Chicago about potential projects and will follow-up accordingly.
- RLF Connection – I met with Catherine Canavan our RLF representative to have a
conversation about combining our two RLFs. Catherine indicated that she was not sure if
they could be combined because they were authorized under two different NOFA’s (notice
of funds availability). We are looking into this; our intention to combine the RLF’s once
revolved was stated very clearly in the RLF Plan. It is unclear at this time if we will be able
to combine them. However we are working with EDA and making all attempts to move the
conversation forward to determine what is possible.
- A few presentation highlights:
o Brownfields – how to incorporate EPA as part of your economic development plans,
this is something we haven’t used in our projects but recently submitted an
application to EPA as a demonstration project to assess the redevelopment of
commercial districts with potential contaminated sites. They also mentioned that
were applying to EPA for 3 years before successfully getting an award – take away:
keep trying!
o CEDS – some good examples of SMART goals were provided that we should
consider for our next CEDS update which will be due December 2016.
o Elements of a successful EDA application – helpful reminders as the session
reviewed the entire application process
o Broadband/Fiber Network – Southern Illinois was featured. Something unique about
their project: Those looking for broadband Internet service could visit
www.IWantMyBroadband.com and submit their information online. Those details are
then sent to over a dozen Internet Service Providers (ISP), who can contact the
sender directly about providing service. More information about the project can be
found at: http://www.connectsi.us/region.htm
- Here is the link to all conference presentations:
http://www.nado.org/events/2014-eda-chicago-regional-conference/
INFORMATION ONLY – NO ACTION REQUESTED

#3a
ACTION MEMO
TO: Upper MN Valley RDC Commissioners FROM: Dawn Hegland DATE: October 28, 2014 RE: Greater MN Partnership Dues
Last year we joined the Greater MN Partnership to follow policy issues for rural MN. They tracked and sent out timely information on some very important issues that our office works with (Broadband Infrastructure Fund, BDPI, Corridor of Commerce). The regular updates they provided during the session were helpful in understanding the issues and in some cases we were able to provide information on how those programs were accessed in our region. In addition several of my colleagues sit on the board for the partnership and were able to share additional insight on the results of this group. I would like to remain as a member in 2015.
ACTION REQUESTED: Authorize $1,000 for 2015 membership to the Greater MN Partnership.

GMNPI hvc4 GREATER MN PARTNERSHIP
July 15, 2014
Dawn HeglandExecutive DirectorUpper MN Valley Reg. Development Commission323 W. Schliernan Ave.Appleton, MN 56208
Dear Ms. Hegland:
I am writing to thank you for your 2014 membership in the Greater MinnesotaPartnership, report on a successful legislative session, and ask you to continue yourmembership in 2015. It is truly amazing what the GMNP accomplished with a goodBoard of Directors and support from more than 80 businesses, chambers, nonprofits andcities from across Greater Minnesota. Thank you for being part of this initiative!
Enclosed you will find the Session Report and Legislative Outcomes from the 2014legislative session. The GIVINP’s advocacy successes this year include:
• Creation of a $20 million Broadband Infrastructure Fund.
• Enhancements to the Angel Investment Program to make it more user-friendly for companies in Greater Minnesota.
• S6.2 million in funding for the Greater Minnesota Business DevelopmentPublic Infrastructure (BDPI) grant program.
• A fair share of funding for transportation through the Corridors ofCommerce program.
• Improvements to the Greater Minnesota Business Expansion Program andGreater Minnesota Internship Program, both of which the GMNP wereinstrumental in creating in 2013.
The GMNP Board of Directors believes we have earned your support for 2015. An invoice isattached for your use and planning. We know that many organizations have or soon will starttheir budgeting process for 2015. Your 2015 membership can be paid anytime between now
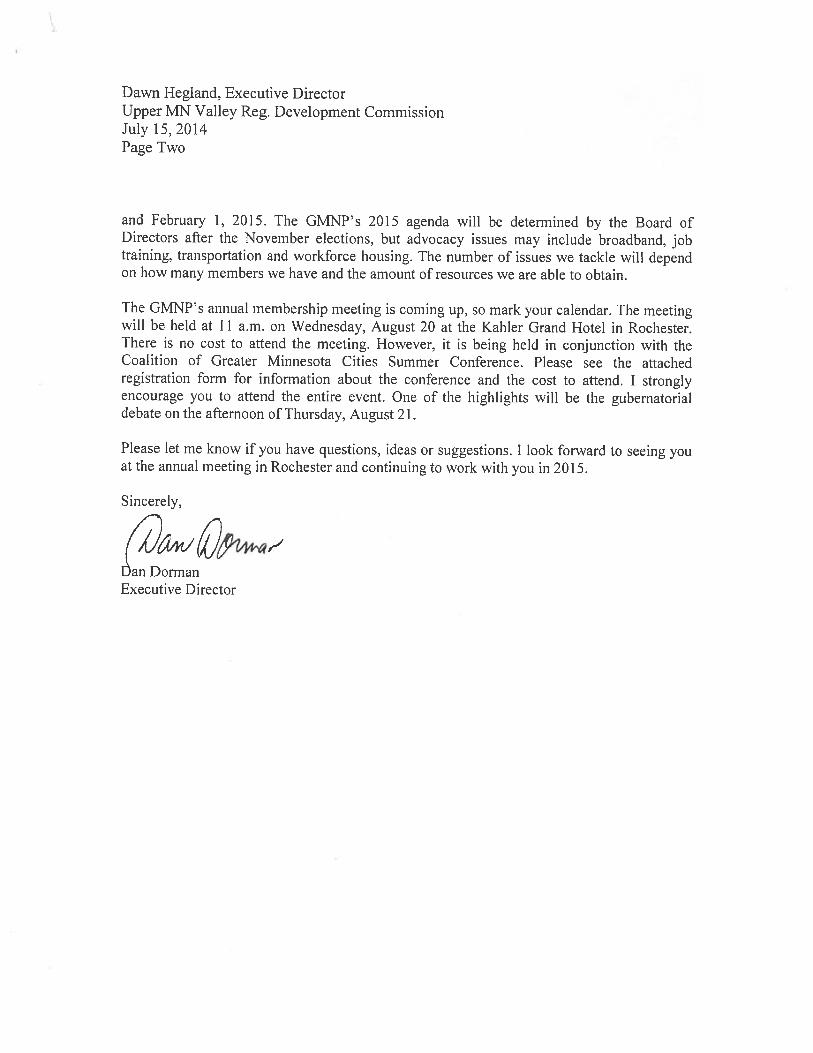
4-
Dawn Hegland, Executive DirectorUpper MN Valley Reg. Development CommissionJuly 15, 2014Page Two
and February 1, 2015. The GMNP’s 2015 agenda will be determined by the Board ofDirectors after the November elections, but advocacy issues may include broadband, jobtraining, transportation and workforce housing. The number of issues we tackle will dependon how many members we have and the amount of resources we are able to obtain.
The GMNP’s annual membership meeting is coming up, so mark your calendar. The meetingwill be held at 11 a.m. on Wednesday, August 20 at the Kahier Grand Hotel in Rochester.There is no cost to attend the meeting. However, it is being held in conjunction with theCoalition of Greater Minnesota Cities Summer Conference. Please see the attachedregistration form for information about the conference and the cost to attend. I stronglyencourage you to attend the entire event. One of the highlights will be the gubernatorialdebate on the afternoon of Thursday, August 21.
Please let me know if you have questions, ideas or suggestions. I look forward to seeing youat the annual meeting in Rochester and continuing to work with you in 2015.
Sincerely,
ban DormanExecutive Director

Following the creation of the GreaterMinnesota Partnership as an independentnon-profit organization, Executive DirectorDan Dorman and staff members took to theroad to [earn about the barriers toeconomic growth in Greater Minnesotafirsthand.
In the regional meetings and a surveyconducted by the GMNP, business andcommunity Leaders named a Lack of highquality broadband access as the top issueinhibiting growth. The GMNP researchedsuccessful broadband efforts nationwideand found that New York state’scompetitive grant program was the mostimpactful in connecting rural businessesand residents. Based on this research, theGMNP crafted legislation modeled afterNew York’s program.
Throughout the process, GMNP lobbyistsand staff had to educate legislators aboutbroadband technology, the seriousness ofthe problem, and how the state broadbandfund could maximize state dollars andcreate growth by both connecting thosewho lack access and upgrading those notserved at state goals.
The GMNP fought against an army of cableindustry heavyweights and others,effectively using a media campaign thatresulted in more than 18 editorials insupport of the fund, TV news coverage andseveral articles, columns and letters to theeditor.
In the end, $20 million was secured forbroadband infrastructure. Hard work byGMNP lobbyists and bill authors Sen. MattSchmit (DFL-Red Wing) and Rep. ErikSimonson (DFL-Duluth), as well as strongsupport from House leadership, made this asuccess story.
The legislation lays a solid foundation forfuture broadband expansion, while showinghow GMNP membership is a tool forbusiness leaders to drive economic growththrough public policy changes.
Angel Investor Program Strengthened
The GMNP was successful in getting thelegislature to make positive improvementsto the Angel Investment Tax Credit Program.Rep. Kim Norton (DFL — Rochester),spearheaded this effort for the GMNP. In thecoming biennium, $7.5 million in angelinvestor funds will be reserved forbusinesses in Greater Minnesota, or thoseowned by women or minorities, for the firstnine months of each year. Additionally,agribusiness, manufacturing, and tourismbusinesses are now eLigible for grants.
The GMNP is optimistic that changes to theprogram will result in program dollarsreaching Greater Minnesota; historicallyover 90 percent of the funding has gone tothe metro area. However, the legislaturechose not to adopt the GMNP-proposedlower wage requirement keeping theaverage metro wage requirement in place.This may require additional changes to theprogram.
Innovative Job Training BilL StaLLs
The GMNP asked the legislature to create a
job training program that is managed by
employers, so that it is flexible and fills
needs quickly. The legislation would have
allowed rural businesses that pay $11/hour
or more to get up to $3,000 per new
employee for job training from DEED to
offset training costs (on-the-job, at a
specialized trainer, or through ci Local
college).
The job training legislation was funded only
at $1 million by the House, which would
have allowed only three or four employees
to be trained per Greater Minnesota county.
However, the Senate and Governor did not
fund the program, so it did not pass.
Business Development PubLicInfrastructure Grant Program Funded
The BDPI program is a proven job creationprogram, which provides grants to cities forpublic infrastructure to encourage private
business growth, received $6.2 million infunding for the next biennium. Sen. VickiJensen (DFL-Owatonno) and Rep. JayMcNamar (DFL-Elbow Lake) were chiefauthors of the bills. Although below theoverage funding in the last 10 years, thefunding will pay for much-needed publicinfrastructure that Greater Minnesotabusinesses depend on for growth. Given therecord-setting spending in the 2014 Bondingbill, including $40 million in metro BDPI-likeprojects, it is disappointing BDPI did notreceive additional funding. We are optimisticthe legislature will revisit BDPI next year.
Corridors of Commerce Funded DespiteNo Comprehensive TransportationPackage
In a year when the Governor and Houseleadership did not want to fund acomprehensive transportation package,local government and business leaderssecured funding for the successful Corridorsof Commerce program. Responding toadvocacy from Greater Minnesota leaders,the legislature dedicated a total of $31.5million in Trunk Highway Fund dollars to theprogram over the next two years.
Greater MinnesotaStrengthened, Expanded
Programs
Both the Greater Minnesota InternshipProgram and the Business Expansion CreditProgram — GMNP initiotives passed in 2013— were strengthened this year. The GMNPworked with DEED to remove restrictivelanguage from the internship program andimprove the business expansion program.
GMNP Spurs Conversation about RuraLIssues, but More Work Is Needed
In its first session as an independentorganization, the GMNP started aconversation about rural issues that had farreaching impacts, including anunprecedented rural economicdevelopment agenda proposed by theHouse DFL. Although the Governor andSenate had other priorities, the GMNPplayed a key role in pushing for ruralpriorities, likely leading to funding forinitiative foundations, agricultural propertytax relief, and rural infrastructure projects.
GM NP..GREATER MN PARTNERSHIP’
2014 Session Report
GMNP Emerges as a Force for Greater Minnesota Economic GrowthFund WiLl Start to TackLe State’sBroadband Needs
k
- P___2irrI ——— .1 J—”r.j I tE2’ i

In 2014, You Helped Create the GMNP, Grew its Membership to 80Members, and Helped it Pass a Sweeping Agenda. We Can Do More.
With a strong membership base f
representing over 80 a •
businesses, chambers of 1commerce, EDAs, and non- ‘. 9 -
• 9profits from across the state, the
- 9_
Greater Minnesota Partnership is •
the ONLY economic , 9’deveLopment organization
9 9representing all of Greater 9
9Minnesota.
,,-----
* a
M-.. 9Formed in [ate 2013,the GMNP ._q._r9 99 —
has already passed historic •-
policy changes and has a clear t- •99 99 9
track record of success That s - r .
W
7.9 ‘‘$92why Finance & Commerce a-flmagazine awarded the GMNP its2014 “Progress MN” award. The 80+ GMNP members come from all
areas of Greater Minnesota
The GMNP is strong because of its members. However, it can only domore if its members help it grow and keep it strong.
The Greater Minnesota Business Community Needs to Speak withOne Voice.
Although progress was made in 2014, the GMNP needs to persuade theGovernor and legislature in 2015 to make transportation funding,broadband development, job training, and workforce housing higherpriorities.
Greater Minnesota needs your help to make Greater Minnesota economicdevelopment a priority.Where it has spoken with one Voice,GreatêrMinnesota was able to make itself heard. With your support, the GMNPcan be even more effective at the Capitol.
Please help make the GMNP — and Greater Minnesota —
stronger! Renew your membership and recruit membersto help us continue to grow.
Visit www.gmnp.org for detaiLs on how to join!
Board of Directors
President: Gory Evans - WinonaState UniversityVice President: HaroLd Stanistawski- Fergus Falls EconomicImprovement CommissionSecretary: Randy Wilson - City ofGlencoeTreasuren Mark PhiLLips - KrausAnderson Construction Co.Cat Brink - Marshall Area Chamberof CommerceLori Broghammer - ITC MidwestCraig CLark - City of WorthingtonBradLey C. DeWoLf- Boltàn & MenkInc.Tim FLathers - Headwaters RegionalDevelopment CommissionAnn Goebel - Minnesota StateUniversity, MankatoBrian Hanson - APEXDave HengeL - Greater BemidjiPat Hentges - City of MankatoBob Hoffman - Minnesota StateUniversity-MankatoCody Huber - Huber SupplyBrent Iserman - Bremer BankRandy Kehr - Albert Lea-FreebornCo. Chamber of CommerceMike Larson - Innovance Inc.HaL LeLand - City of Fergus FallsJennifer Libby - Owatonna Chamberof CommerceNicoLe Griensewic MickeLson -
Region Nine DevelopmentCommissionTim Penny - Southern MinnesotaInitiative FoundationNancj Straw - West CenlalInitiativeGlenn Thuringer - Bioverse Inc.John TourviLLe - City of VirginiaBarry Wilfahrt - GO Chamber(Grand Forks & East Grand Forks)Jonathan Zierdt - Greater Man katoGrowth
Executive Director Dan Dormandangmnp.org , 612-245-5204
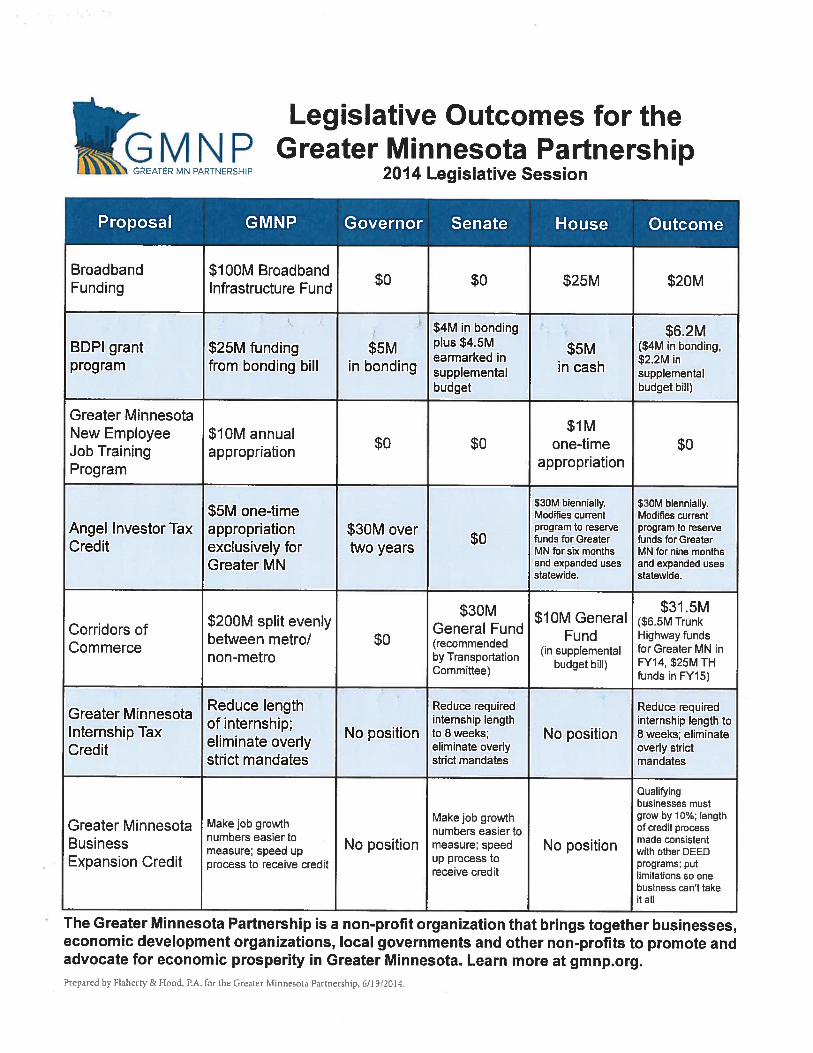
Legislative Outcomes for theG M N P Greater Minnesota Partnership. GREATER MN PARTNERSHIP 2014 Legislative Session
Proposal GMNP Governor Senate House Outcome
$0 $0 $25M $20M
‘• $4M in bonding $6.2M
BDPI grant $25M funding $5M plus $4.5M $5M ($4M in bonding,earmarked in $2.2M inprogram from bonding bill in bonding supplemental in cash supplementalbudget budget bill)
Greater Minnesota$IMNew Employee $IOM annual o o one-timeJob Training appropriation
appropriationProgram
$30M biennially. $30M biennially.$5M one—time Modifies current Modifies current
program to reserve program to reserveAngel InvestorTax appropriation $30M over0 fundsforGreater fundsforGreaterCredit exclusively for two years MN for six months MN for nine months
Greater MN and expanded uses andexpandedusesstatewide. statewide.
$30M $31.5M$200M split evenly General Fund
$10M General ($6.5M TrunkCorridors of
between metro! $0 (recommendedFund Highway funds
Commerce (in supplemental for Greater MN innon-metro by Transportation
budget bill) FY14, $25M THCommittee) funds in FY15)
Reduce length Reduce required Reduce requiredGreater Minnesota intemship length internship length toof internship;No position to 8 weeks; No position 8 weeks; eliminateInternship Tax
eliminate overly eliminate overly overly strictCred itstrict mandates strict mandates mandates
Qualifyingbusinesses must
Make job growth grow by 10%; lengthGreater Minnesota Make job growth
numbers easier to of credit processnumbers easier to made consistentBusiness measure; speed up No position measure; speed No position with other DEED
Expansion Credit process to receive creditup process to programs; putreceive credit limitations so one
business can’t takeit all
The Greater Minnesota Partnership is a non-profit organization that brings together businesses,economic development organizations, local governments and other non-profits to promote andadvocate for economic prosperity in Greater Minnesota. Learn more at gmnp.org.
BroadbandFunding
$IOOM BroadbandInfrastructure Fund
Prepared by Flaherty & Hood, PA. for the Greater Minnesota Partnership, 6/19/2014.

4 *
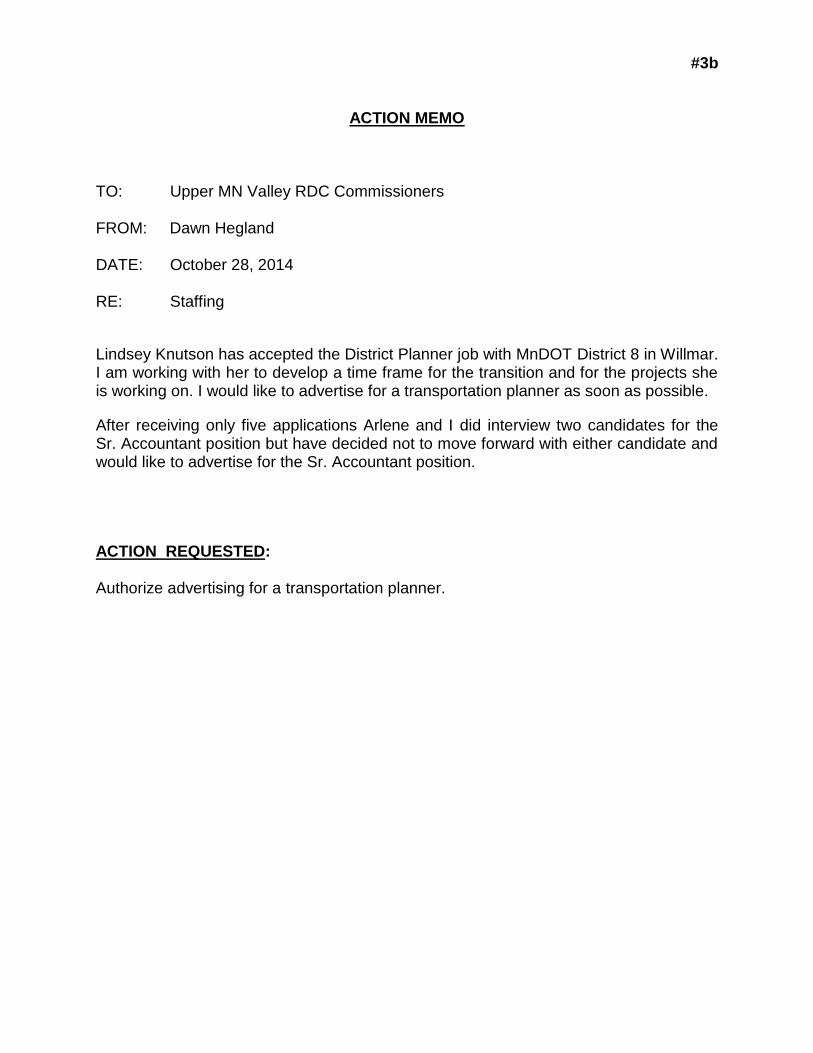
#3b
ACTION MEMO
TO: Upper MN Valley RDC Commissioners FROM: Dawn Hegland DATE: October 28, 2014 RE: Staffing
Lindsey Knutson has accepted the District Planner job with MnDOT District 8 in Willmar. I am working with her to develop a time frame for the transition and for the projects she is working on. I would like to advertise for a transportation planner as soon as possible.
After receiving only five applications Arlene and I did interview two candidates for the Sr. Accountant position but have decided not to move forward with either candidate and would like to advertise for the Sr. Accountant position.
ACTION REQUESTED: Authorize advertising for a transportation planner.

#4a
DISCUSSION MEMO
TO: UMVRDC Commissioners
From: Jacki Anderson, Senior Planner
DATE: October 28, 2014
RE: How to Create a County EDA
Past board survey results indicated an interest in learning more about how to create a
county EDA. As a result, we’ve put together the basic of creating a county EDA.
Some resources available to local units of government regarding economic
development authorities include the following:
Minnesota Statutes:
Economic Development Association of MN (EDAM) –
Minnesota Association of Processional County Economic Developers (MAPCED) –
Association of MN Counties (AMC) –
ACTION REQUESTED:
Discussion regarding the process of creating a County EDA