bmg bullionfund - my cmsbmg-group.com/doc_bin/bmg_bullionfund_mrfp_en.pdfbmg bullionfund 1 bmg...
TRANSCRIPT

BMG BullionFund 1
BMG BullionFund
Semi-Annual Management Report of Fund Performance
For the six-month period ended June 30, 2015
Caution regarding forward-looking statements Certain portions of this Semi-Annual Management Report of Fund Performance, including, but not limited to, ‘‘Recent Developments’’, may contain forward-looking statements about the BMG BullionFund (the “BMG Fund”) including statements with respect to strategies, risks, expected performance events and conditions. Forward-looking statements include statements that are predictive in nature, that depend upon or refer to future events or conditions, or that include words such as “could”, “would”, “forecasts”, ‘‘expects’’, ‘‘anticipates’’, ‘‘intends’’, ‘‘plans’’, ‘‘believes’’, ‘‘estimates’’, ‘‘projects’’ and similar forward-looking expressions or negative versions thereof. Forward-looking statements are not guarantees of future performance and actual results or events could differ materially from those expressed or implied in any forward-looking statements made by the BMG Fund. Any number of important factors could contribute to these digressions, including, but not limited to, general economic, political and market factors in North America and internationally, such as interest and foreign currency rates, investment sentiment, volatility of precious metals prices, demand for various precious metals, and other factors affecting precious metals, currency fluctuations, global equity and capital markets, changes in government relations, unexpected judicial or regulatory proceedings and catastrophic events. We stress that the above-mentioned list of important factors is not exhaustive. Some of these risks, uncertainties and other factors are described in the BMG Fund’s simplified prospectus, under the heading ‘‘Risk Factors.’’ We encourage you to consider these and other factors carefully before making any investment decisions. Forward-looking statements should not be unduly relied upon. Further, you should be aware that the BMG Fund has no specific intention of updating any forward-looking statements whether as a result of new information, future events or otherwise, prior to the release of the next Management Report of Fund Performance, and that the forward-looking statements speak only to the date of this Semi-Annual Management Report of Fund Performance. This Semi-Annual Management Report of Fund Performance contains financial highlights, but does not contain either the complete semi-annual or annual financial statements of the BMG Fund. Security holders may request a copy of the BMG Fund’s semi-annual or annual financial statements, proxy voting policies and procedures, proxy voting disclosure record or quarterly portfolio disclosure at no cost by calling 1.888.474.1001, by writing to us at 280-60 Renfrew Drive, Markham, Ontario, L3R 0E1, or by visiting our website at www.bmgbullion.com or SEDAR at www.sedar.com.

2 BMG BullionFund
TABLE OF CONTENTS
Semi-Annual Management Report of Fund Performance
Management Report of Fund Performance 3
Financial Highlights 6
Past Performance 10
Summary of Investment Portfolio 12
BMG BullionFund 3
MANAGEMENT REPORT OF FUND PERFORMANCEA
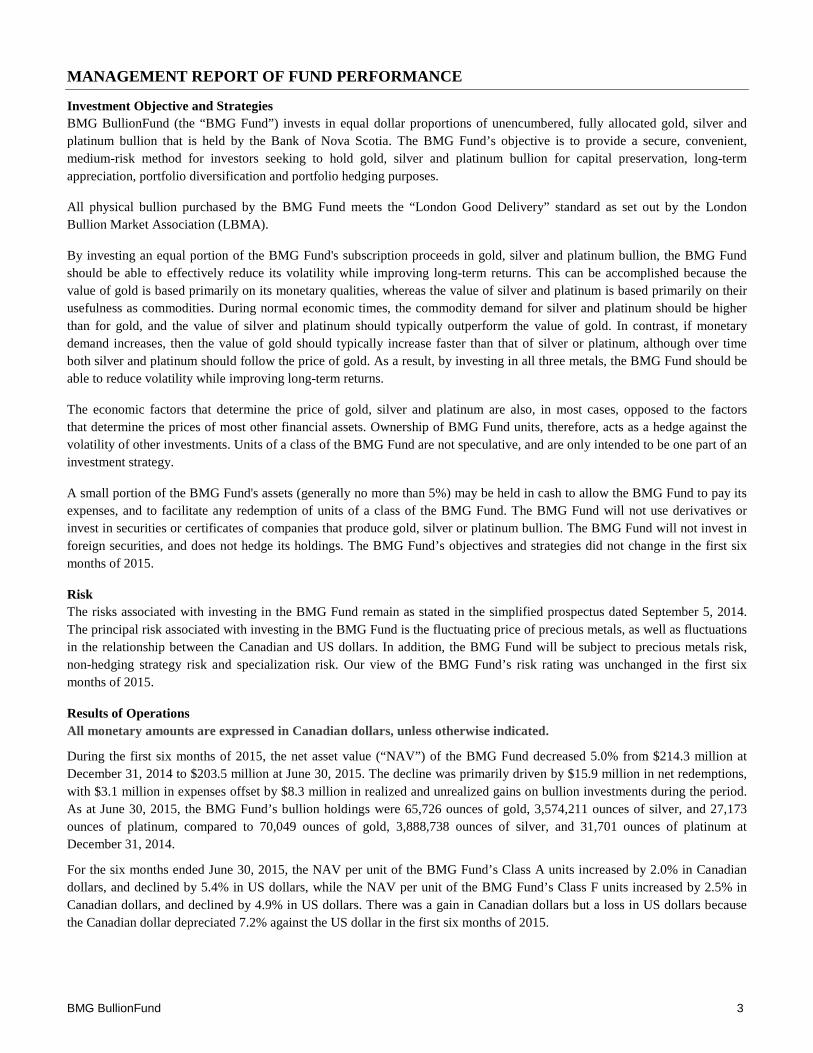
Investment Objective and Strategies BMG BullionFund (the “BMG Fund”) invests in equal dollar proportions of unencumbered, fully allocated gold, silver and platinum bullion that is held by the Bank of Nova Scotia. The BMG Fund’s objective is to provide a secure, convenient, medium-risk method for investors seeking to hold gold, silver and platinum bullion for capital preservation, long-term appreciation, portfolio diversification and portfolio hedging purposes.
All physical bullion purchased by the BMG Fund meets the “London Good Delivery” standard as set out by the London Bullion Market Association (LBMA).
By investing an equal portion of the BMG Fund's subscription proceeds in gold, silver and platinum bullion, the BMG Fund should be able to effectively reduce its volatility while improving long-term returns. This can be accomplished because the value of gold is based primarily on its monetary qualities, whereas the value of silver and platinum is based primarily on their usefulness as commodities. During normal economic times, the commodity demand for silver and platinum should be higher than for gold, and the value of silver and platinum should typically outperform the value of gold. In contrast, if monetary demand increases, then the value of gold should typically increase faster than that of silver or platinum, although over time both silver and platinum should follow the price of gold. As a result, by investing in all three metals, the BMG Fund should be able to reduce volatility while improving long-term returns.
The economic factors that determine the price of gold, silver and platinum are also, in most cases, opposed to the factors that determine the prices of most other financial assets. Ownership of BMG Fund units, therefore, acts as a hedge against the volatility of other investments. Units of a class of the BMG Fund are not speculative, and are only intended to be one part of an investment strategy.
A small portion of the BMG Fund's assets (generally no more than 5%) may be held in cash to allow the BMG Fund to pay its expenses, and to facilitate any redemption of units of a class of the BMG Fund. The BMG Fund will not use derivatives or invest in securities or certificates of companies that produce gold, silver or platinum bullion. The BMG Fund will not invest in foreign securities, and does not hedge its holdings. The BMG Fund’s objectives and strategies did not change in the first six months of 2015.
Risk The risks associated with investing in the BMG Fund remain as stated in the simplified prospectus dated September 5, 2014. The principal risk associated with investing in the BMG Fund is the fluctuating price of precious metals, as well as fluctuations in the relationship between the Canadian and US dollars. In addition, the BMG Fund will be subject to precious metals risk, non-hedging strategy risk and specialization risk. Our view of the BMG Fund’s risk rating was unchanged in the first six months of 2015.
Results of Operations All monetary amounts are expressed in Canadian dollars, unless otherwise indicated.
During the first six months of 2015, the net asset value (“NAV”) of the BMG Fund decreased 5.0% from $214.3 million at December 31, 2014 to $203.5 million at June 30, 2015. The decline was primarily driven by $15.9 million in net redemptions, with $3.1 million in expenses offset by $8.3 million in realized and unrealized gains on bullion investments during the period. As at June 30, 2015, the BMG Fund’s bullion holdings were 65,726 ounces of gold, 3,574,211 ounces of silver, and 27,173 ounces of platinum, compared to 70,049 ounces of gold, 3,888,738 ounces of silver, and 31,701 ounces of platinum at December 31, 2014.
For the six months ended June 30, 2015, the NAV per unit of the BMG Fund’s Class A units increased by 2.0% in Canadian dollars, and declined by 5.4% in US dollars, while the NAV per unit of the BMG Fund’s Class F units increased by 2.5% in Canadian dollars, and declined by 4.9% in US dollars. There was a gain in Canadian dollars but a loss in US dollars because the Canadian dollar depreciated 7.2% against the US dollar in the first six months of 2015.

4 BMG BullionFund
MANAGEMENT REPORT OF FUND PERFORMANCE (continued)
Daily average net assets decreased from $264.7 million during the first six months of 2014 to $220.6 million for the same period in 2015. This represents a 16.7% decrease, which is in line with the decrease in total expenses after absorption of $17,673 by Bullion Management Services Inc. (the “Manager”). The decrease is primarily driven by net redemptions and the performance of bullion as discussed in the “Recent Developments” section of this report.
Gold’s 2014 year-end price was US$1,199.25. This year, 2015, had a promising start as the LBMA Gold Price PM increased by 8.0% to reach a high of US$1,295.75 per ounce in January. The price declined thereafter, falling to a low of US$1,147.25 per ounce in March, and closed at $1,171.00 on June 30. The prices of silver and platinum followed a similar pattern. The LBMA Silver Price reached a high of US$18.23 per ounce in January, fell to a low of US$15.47 per ounce in March, and closed at US$15.70 on June 30. The LBMA Platinum Price PM reached a high of US$1,285 per ounce in January, fell to a low of US$1,061 per ounce in June, and closed at US$1,078 on June 30.
A number of global economic events that were evident at the close of 2014 continued to weigh heavily on the markets during the first half of 2015. Wrangling over Greece’s debt crisis, a slowdown in the Chinese economy, and the timing of the potential US Federal Reserve interest rate increase all contributed to market uncertainty. Additionally, the past year’s dramatic rise of more than 100% in key Chinese equity markets has been a cause for concern. The correction that started in June 2015 prompted the Chinese government to take several measures to calm markets and ease the stock market slide. These events have failed to trigger any major upward movement in the price of bullion, and there has been no sustained breakout pattern.
Recent Developments
Gold Gold started the year at US$1,199.25, and closed on June 30, 2015 at US$1,171.00, a 2.4% decline. In Canadian dollars, the gold price experienced a gain of 5.2% over the same period, because of a weakening of the currency against the US dollar.
As India and China wrestle for first and second place as the world’s largest gold consumer, India eased gold import regulations towards the end of 2014 by removing its requirement for importers to sell 20% of their shipments to jewelers for re-export as jewelry. While this should have been positive news for gold, India’s decision to maintain an import duty on the precious metal continues to dampen demand. Although there has been some correction recently, China’s strong equity market proved more attractive to investors than gold. It is unclear whether a correction will lead Chinese investors back to gold as an alternative asset class or as a safe haven investment.
Silver Silver started the year at US$15.97, and closed on June 30, 2015 at US$15.70, a 1.7% decline. In Canadian dollars, the silver price experienced a gain of 5.9% over the same period, because of a weakening of the currency against the US dollar.
With concerns over global growth, industrial applications (which accounted for approximately 56% of overall demand in 2014) are unlikely to contribute to materially higher demand in 2015. Significant movements in demand will likely depend on jewelry, coins and bars, and ETF investment categories. On the supply side, a rise in mine production from both new mines and production gains has virtually wiped out the supply deficit.
Platinum Platinum experienced a 10.9% decline during the first half of 2015, closing at US$1,078 and underperforming both gold and silver. In Canadian dollars, the decline was 4.0% for the same period, as the currency impact of a weakening Canadian dollar against the US dollar was unable to offset the falling platinum price. At year-end 2014, the platinum price in US dollars traded at a 1% premium over gold, but by June 30, 2015, it was at a 7.9% discount.
Output has been recovering following the protracted 2014 strike by miners in South Africa, but the shortfall from mining supply relative to demand is being cushioned by aboveground stocks, which the World Platinum Investment Council (WPIC) estimates at 2.8 million ounces as at the end of 2014. This more than adequately absorbs the supply deficit of 190,000 ounces the WPIC projects for 2015. Softening in the platinum price has not triggered significant demand growth from the key jewelry market in China because of the strong equity market, or from carmakers for use in auto catalysts because of the slowdown in global growth.
BMG BullionFund 5
MANAGEMENT REPORT OF FUND PERFORMANCE (continued)
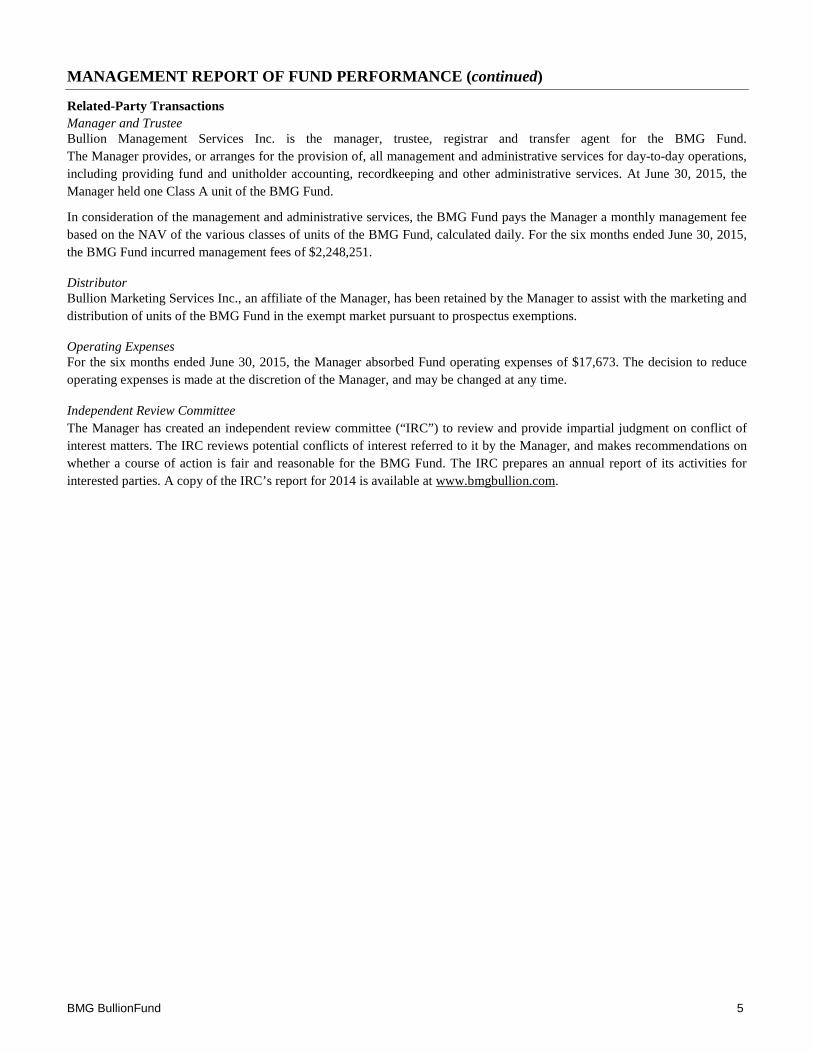
Related-Party Transactions Manager and Trustee Bullion Management Services Inc. is the manager, trustee, registrar and transfer agent for the BMG Fund. The Manager provides, or arranges for the provision of, all management and administrative services for day-to-day operations, including providing fund and unitholder accounting, recordkeeping and other administrative services. At June 30, 2015, the Manager held one Class A unit of the BMG Fund.
In consideration of the management and administrative services, the BMG Fund pays the Manager a monthly management fee based on the NAV of the various classes of units of the BMG Fund, calculated daily. For the six months ended June 30, 2015, the BMG Fund incurred management fees of $2,248,251.
Distributor Bullion Marketing Services Inc., an affiliate of the Manager, has been retained by the Manager to assist with the marketing and distribution of units of the BMG Fund in the exempt market pursuant to prospectus exemptions.
Operating Expenses For the six months ended June 30, 2015, the Manager absorbed Fund operating expenses of $17,673. The decision to reduce operating expenses is made at the discretion of the Manager, and may be changed at any time.
Independent Review Committee The Manager has created an independent review committee (“IRC”) to review and provide impartial judgment on conflict of interest matters. The IRC reviews potential conflicts of interest referred to it by the Manager, and makes recommendations on whether a course of action is fair and reasonable for the BMG Fund. The IRC prepares an annual report of its activities for interested parties. A copy of the IRC’s report for 2014 is available at www.bmgbullion.com.

6 BMG BullionFund
FINANCIAL HIGHLIGHTS The following tables show selected key financial information about each class of units of the BMG Fund, and are intended to help you understand the BMG Fund’s financial performance for the past six months ended June 30, 2015, and the years shown ended December 31, and/or from the period since the particular class was first offered. The information is derived from the BMG Fund’s financial statements.
THE FUND’S NET ASSETS PER CLASS A UNIT 2015 2014 2013 2012 2011 2010 Net assets - beginning of period(1) $ 8.78 $ 9.16 $ 12.19 $ 12.03 $ 12.62 $ 9.62 Increase (decrease) from operations: Total revenue - - - - - - Total expenses (excluding distributions) (0.14) (0.29) (0.32) (0.38) (0.41) (0.32) Realized gains for the period 0.13 0.25 0.33 0.24 0.30 0.33 Unrealized gains (losses) for the period 0.20 (0.29) (3.08) 0.24 (0.53) 2.95 Total increase (decrease) from operations(2) 0.19 (0.33) (3.07) 0.10 (0.64) 2.96 Distributions: From net investment income (excluding dividends) - - - - - - From dividends - - - - - - From capital gains - - - - - - Return of capital - - - - - - Total distributions(3) - - - - - -
Net assets – end of period $ 8.96 $ 8.78 $ 9.16 $ 12.19 $ 12.03 $ 12.62 RATIOS AND SUPPLEMENTAL DATA: Total net asset value (000's)(1) $ 165,669 $ 170,303 $ 198,337 $ 293,476 $ 276,877 $ 263,032 Number of units outstanding(1) 18,499,687 19,394,233 21,660,979 24,078,744 23,010,538 20,846,609 Management expense ratio (%)(2) 3.06 3.06 3.05 3.03 3.02 3.06 Management expense ratio before waivers or absorption (%) 3.08 3.18 3.05 3.03 3.02 3.06
Trading expense ratio (%)(3) - - - - - - Portfolio turnover rate (%)(4) - 0.90 2.66 4.01 5.62 2.54 Net asset value per unit $ 8.96 $ 8.78 $ 9.16 $ 12.19 $ 12.03 $ 12.62 For explanatory notes, please refer to "Explanatory Notes to Financial Highlights" at the end of the section.
THE FUND’S NET ASSETS PER CLASS B2 UNIT 2015 2014* Net assets - beginning of period(1) $ 8.43 $ 10.00 Increase (decrease) from operations: Total revenue - - Total expenses (excluding distributions) (0.10) (0.17) Realized gains for the period 0.12 0.17 Unrealized gains (losses) for the period 0.19 (1.73) Total increase (decrease) from operations(2) 0.21 (1.73) Distributions: From net investment income (excluding dividends) - - From dividends - - From capital gains - - Return of capital - - Total distributions(3) - -
Net assets – end of period $ 8.64 $ 8.43 RATIOS AND SUPPLEMENTAL DATA: Total net asset value (000's)(1) $ 366 $ 358 Number of units outstanding(1) 42,382 42,407 Management expense ratio (%)(2) 2.18 2.22 Management expense ratio before waivers or absorption (%) 2.18 2.34 Trading expense ratio (%)(3) - - Portfolio turnover rate (%)(4) - 0.90 Net asset value per unit $ 8.64 $ 8.43 *Data is from February 24, 2014, the date the Class B2 units were first offered, to December 31, 2014. For explanatory notes, please refer to "Explanatory Notes to Financial Highlights" at the end of the section.
BMG BullionFund 7
FINANCIAL HIGHLIGHTS (continued)
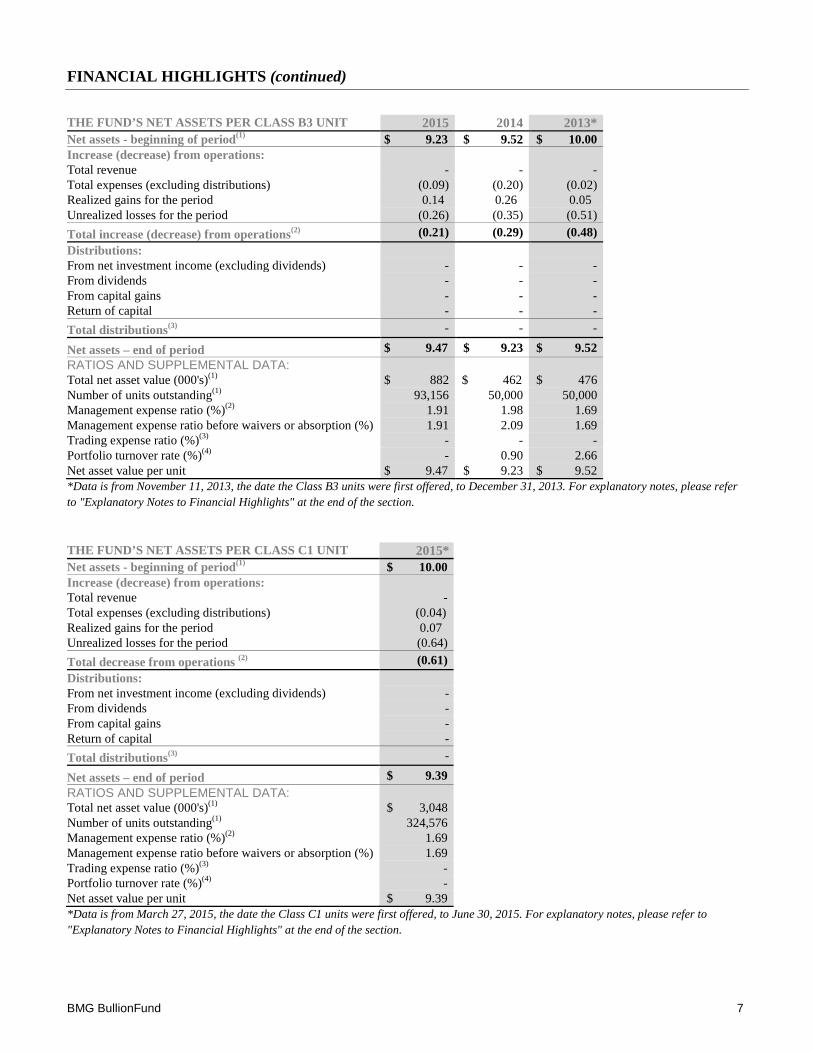
THE FUND’S NET ASSETS PER CLASS B3 UNIT 2015 2014 2013* Net assets - beginning of period(1) $ 9.23 $ 9.52 $ 10.00 Increase (decrease) from operations: Total revenue - - - Total expenses (excluding distributions) (0.09) (0.20) (0.02) Realized gains for the period 0.14 0.26 0.05 Unrealized losses for the period (0.26) (0.35) (0.51) Total increase (decrease) from operations(2) (0.21) (0.29) (0.48) Distributions: From net investment income (excluding dividends) - - - From dividends - - - From capital gains - - - Return of capital - - - Total distributions(3) - - -
Net assets – end of period $ 9.47 $ 9.23 $ 9.52 RATIOS AND SUPPLEMENTAL DATA: Total net asset value (000's)(1) $ 882 $ 462 $ 476 Number of units outstanding(1) 93,156 50,000 50,000 Management expense ratio (%)(2) 1.91 1.98 1.69 Management expense ratio before waivers or absorption (%) 1.91 2.09 1.69 Trading expense ratio (%)(3) - - - Portfolio turnover rate (%)(4) - 0.90 2.66 Net asset value per unit $ 9.47 $ 9.23 $ 9.52 *Data is from November 11, 2013, the date the Class B3 units were first offered, to December 31, 2013. For explanatory notes, please refer to "Explanatory Notes to Financial Highlights" at the end of the section.
THE FUND’S NET ASSETS PER CLASS C1 UNIT 2015* Net assets - beginning of period(1) $ 10.00 Increase (decrease) from operations: Total revenue - Total expenses (excluding distributions) (0.04) Realized gains for the period 0.07 Unrealized losses for the period (0.64) Total decrease from operations (2) (0.61) Distributions: From net investment income (excluding dividends) - From dividends - From capital gains - Return of capital - Total distributions(3) -
Net assets – end of period $ 9.39 RATIOS AND SUPPLEMENTAL DATA: Total net asset value (000's)(1) $ 3,048 Number of units outstanding(1) 324,576 Management expense ratio (%)(2) 1.69 Management expense ratio before waivers or absorption (%) 1.69 Trading expense ratio (%)(3) - Portfolio turnover rate (%)(4) - Net asset value per unit $ 9.39 *Data is from March 27, 2015, the date the Class C1 units were first offered, to June 30, 2015. For explanatory notes, please refer to "Explanatory Notes to Financial Highlights" at the end of the section.

8 BMG BullionFund
FINANCIAL HIGHLIGHTS (continued)
THE FUND’S NET ASSETS PER CLASS C2 UNIT 2015 2014* Net assets - beginning of period(1) $ 8.46 $ 10.00 Increase (decrease) from operations: Total revenue - - Total expenses (excluding distributions) (0.07) (0.12) Realized gains for the period 0.13 0.18 Unrealized losses for the period (0.90) (1.35) Total decrease from operations (2) (0.84) (1.29) Distributions: From net investment income (excluding dividends) - - From dividends - - From capital gains - - Return of capital - - Total distributions(3) - -
Net assets – end of period $ 8.69 $ 8.46 RATIOS AND SUPPLEMENTAL DATA: Total net asset value (000's)(1) $ 5,173 $ 483 Number of units outstanding(1) 595,313 57,063 Management expense ratio (%)(2) 1.55 1.60 Management expense ratio before waivers or absorption (%) 1.55 1.68 Trading expense ratio (%)(3) - - Portfolio turnover rate (%)(4) - 0.90 Net asset value per unit $ 8.69 $ 8.46 *Data is from March 12, 2014, the date the Class C2 units were first offered, to December 31, 2014. For explanatory notes, please refer to "Explanatory Notes to Financial Highlights" at the end of the section.
THE FUND’S NET ASSETS PER CLASS F UNIT 2015 2014 2013 2012 2011 2010 Net assets - beginning of period(1) $ 9.82 $ 10.13 $ 13.34 $ 13.03 $ 13.51 $ 10.20 Increase (decrease) from operations: Total revenue - - - - - - Total expenses (excluding distributions) (0.10) (0.22) (0.23) (0.27) (0.28) (0.22) Realized gains for the period 0.15 0.28 0.36 0.26 0.32 0.34 Unrealized gains (losses) for the period (0.10) (0.17) (3.48) 0.40 (1.88) 3.19 Total increase (decrease) from operations (2) (0.05) (0.11) (3.35) 0.39 (1.84) 3.31 Distributions: From net investment income (excluding dividends) - - - - - - From dividends - - - - - - From capital gains - - - - - - Return of capital - - - - - - Total distributions(3) - - - - - -
Net assets – end of period $ 10.07 $ 9.82 $ 10.13 $ 13.34 $ 13.03 $ 13.51 RATIOS AND SUPPLEMENTAL DATA: Total net asset value (000's)(1) $ 27,096 $ 18,065 $ 22,643 $ 35,919 $ 38,241 $ 26,591 Number of units outstanding(1) 2,691,988 1,840,183 2,235,041 2,692,893 2,935,910 1,968,387 Management expense ratio (%)(2) 1.97 2.02 1.95 1.94 1.93 1.99 Management expense ratio before waivers or absorption (%) 1.97 2.07 1.95 1.94 1.93 1.99
Trading expense ratio (%)(3) - - - - - - Portfolio turnover rate (%)(4) - 0.90 2.66 4.01 5.62 2.54 Net asset value per unit $ 10.07 $ 9.82 $ 10.13 $ 13.34 $ 13.03 $ 13.51 For explanatory notes, please refer to "Explanatory Notes to Financial Highlights" at the end of the section.
BMG BullionFund 9
FINANCIAL HIGHLIGHTS (continued) Explanatory Notes to Financial Highlights
Fund’s Net Assets per Unit of each Class (1) This information is derived from the BMG Fund’s financial statements. In the period a BMG Fund or class is established, the financial information is provided from the date a particular class was first offered to the end of the period. Information for 2013 and subsequent years is in accordance with IFRS. Information for years prior to 2013 is reported under Canadian GAAP. The NAV per class presented in the financial statements does not differ from the NAV per class calculated for fund pricing purposes.
(2) Net assets and distributions are based on the actual number of units outstanding at the relevant time. The increase (decrease) in net assets from operations is based on the weighted average number of units outstanding over the fiscal period. This table is not intended to be a reconciliation of opening and closing net assets per unit.
(3) The BMG Fund did not make any distributions.
Ratios and Supplemental Data (1) This information is provided as at the end of the period shown.
(2) The management expense ratio is based on total expenses for the stated period, and is expressed as an annualized percentage of daily average NAV during the period.
(3) The trading expense ratio represents the total commissions and other portfolio transaction costs expressed as an annualized percentage of NAV during the period. (4) The BMG Fund’s portfolio turnover rate indicates how actively the BMG Fund’s bullion investments are traded. A portfolio turnover rate of 100% is equivalent to the BMG Fund buying and selling all its bullion once in the course of the relevant period. There is no trading cost payable by the BMG Fund. The higher a portfolio turnover rate in a year, the greater the chance of an investor receiving taxable capital gains in the year. There is not necessarily a relationship between a high turnover rate and the performance of the BMG Fund.
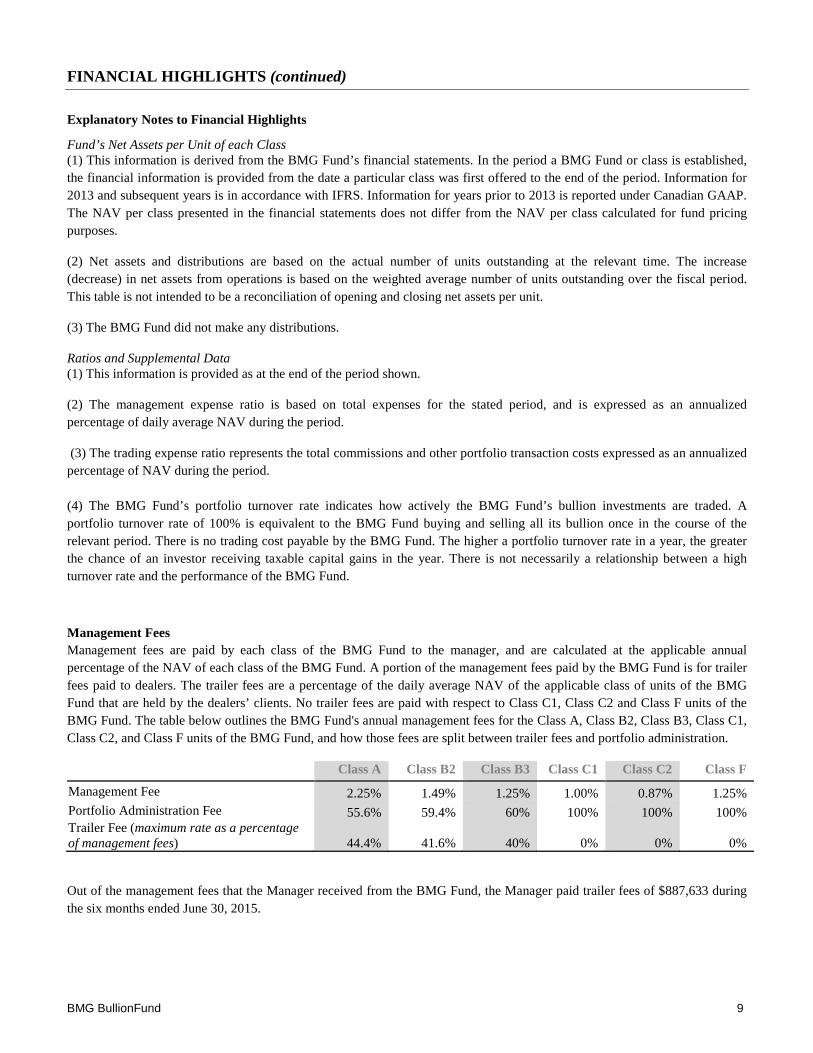
Management Fees Management fees are paid by each class of the BMG Fund to the manager, and are calculated at the applicable annual percentage of the NAV of each class of the BMG Fund. A portion of the management fees paid by the BMG Fund is for trailer fees paid to dealers. The trailer fees are a percentage of the daily average NAV of the applicable class of units of the BMG Fund that are held by the dealers’ clients. No trailer fees are paid with respect to Class C1, Class C2 and Class F units of the BMG Fund. The table below outlines the BMG Fund's annual management fees for the Class A, Class B2, Class B3, Class C1, Class C2, and Class F units of the BMG Fund, and how those fees are split between trailer fees and portfolio administration.
Class A Class B2 Class B3 Class C1 Class C2 Class F
Management Fee 2.25% 1.49% 1.25% 1.00% 0.87% 1.25% Portfolio Administration Fee 55.6% 59.4% 60% 100% 100% 100% Trailer Fee (maximum rate as a percentage of management fees) 44.4% 41.6% 40% 0% 0% 0%
Out of the management fees that the Manager received from the BMG Fund, the Manager paid trailer fees of $887,633 during the six months ended June 30, 2015.
10 BMG BullionFund
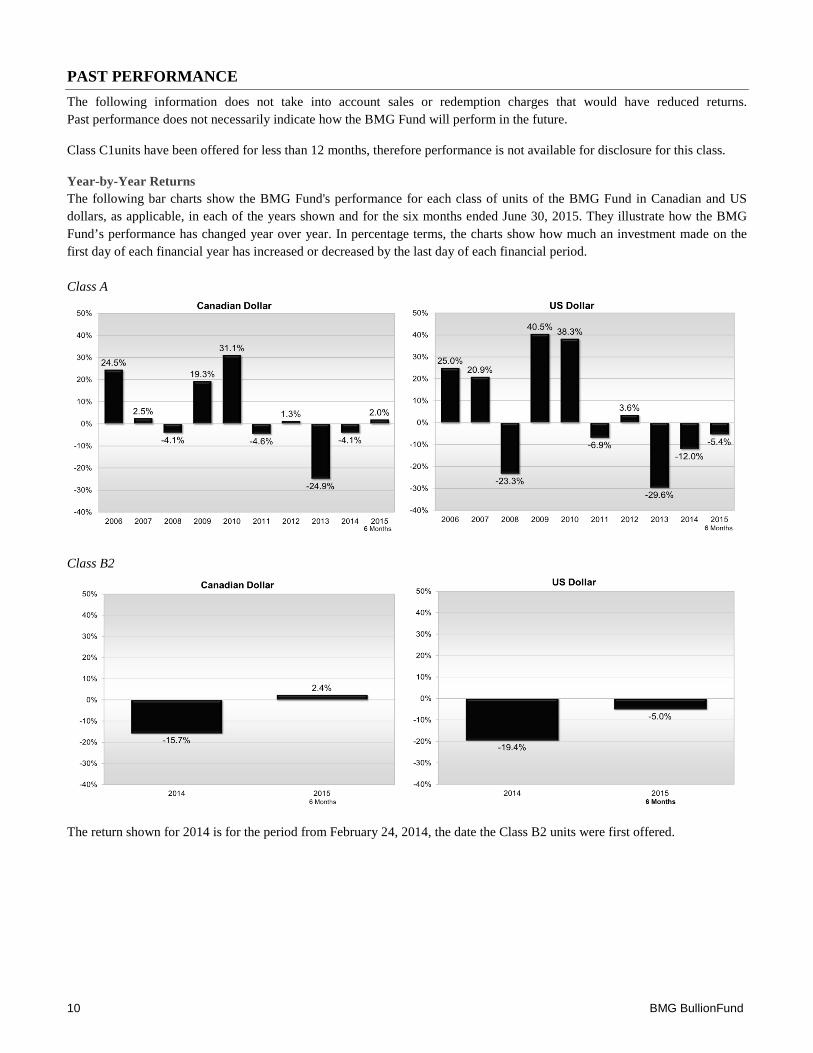
PAST PERFORMANCE The following information does not take into account sales or redemption charges that would have reduced returns. Past performance does not necessarily indicate how the BMG Fund will perform in the future.
Class C1units have been offered for less than 12 months, therefore performance is not available for disclosure for this class.
Year-by-Year Returns The following bar charts show the BMG Fund's performance for each class of units of the BMG Fund in Canadian and US dollars, as applicable, in each of the years shown and for the six months ended June 30, 2015. They illustrate how the BMG Fund’s performance has changed year over year. In percentage terms, the charts show how much an investment made on the first day of each financial year has increased or decreased by the last day of each financial period. Class A
Class B2
The return shown for 2014 is for the period from February 24, 2014, the date the Class B2 units were first offered.
BMG BullionFund 11
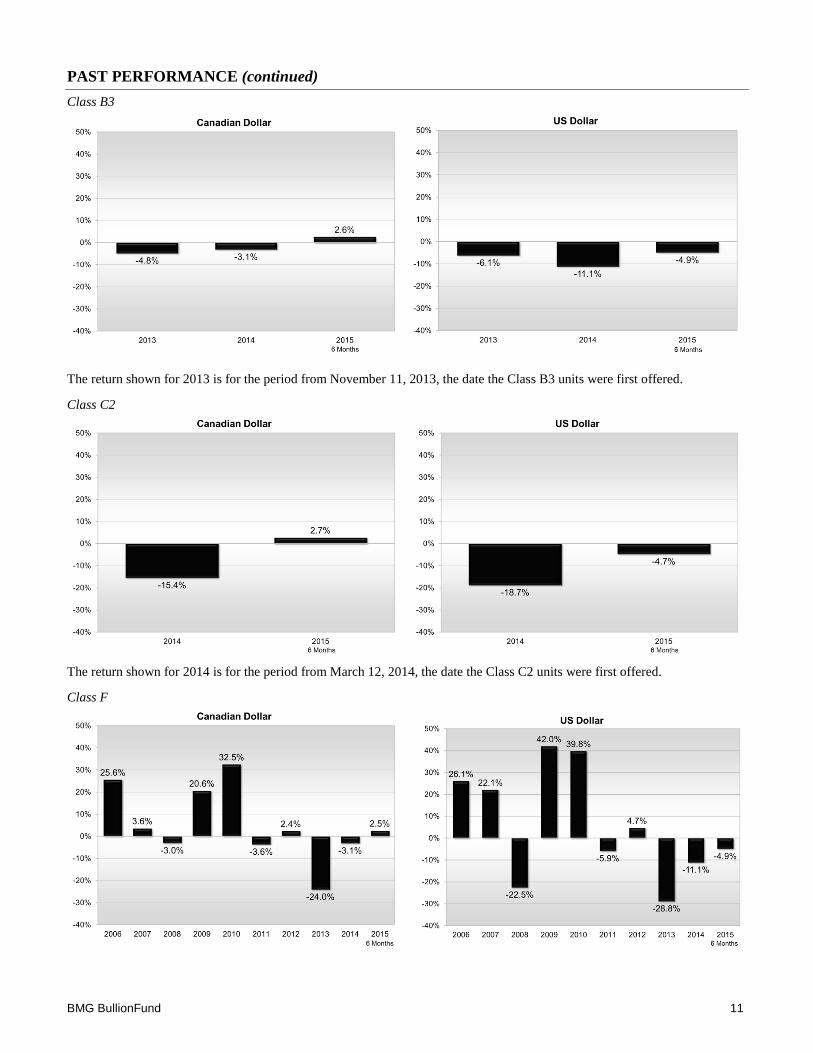
PAST PERFORMANCE (continued) Class B3
The return shown for 2013 is for the period from November 11, 2013, the date the Class B3 units were first offered.
Class C2
The return shown for 2014 is for the period from March 12, 2014, the date the Class C2 units were first offered.
Class F

12 BMG BullionFund
SUMMARY OF INVESTMENT PORTFOLIO As at June 30, 2015
Allocated ounces
Unallocated ounces
Total Fine ounces
Average Cost $
Fair Value $
Total %
Gold Bullion 65,183.909 542.264 65,726.173 65,644,732 96,087,821 47.20 Platinum Bullion 26,564.189 608.434 27,172.623 40,305,899 36,570,320 17.96 Silver Bullion 3,535,297.953 38,912.975 3,574,210.928 58,464,515 70,057,194 34.42 Cash 854,349 855,944 0.42
Total Investment 165,269,495 203,571,279 100.00
Since the BMG Fund does not rebalance its portfolio holdings, the 33.3% allocation target may differ due to the difference in performance of each metal.
Due to ongoing portfolio transactions, the Summary of Investment Portfolio may have changed by the time you purchase units of the BMG Fund. A quarterly update is available. To obtain a copy please contact our Client Services team at 1.888.474.1001, or visit www.bmgbullion.com.